
Abstract
The objectives of this study are to optimize the key process parameters of laser cladding remanufacturing parts, improve the sealing quality of the hemispherical valve and prolong and improve its service life and reliability. A high-power fiber-coupled semiconductor laser was used to fabricate a single Co-based alloy cladding layer on the pump valve material ZG45 plate. The key process parameters of laser power, scanning speed and powder feeding rate in the process of laser remanufacturing are taken as optimization variables, and the coating width, coating height, coating depth, aspect ratio and dilution rate are taken as response indexes. Based on the response surface analysis method, the central compound experiment is designed using Design-Expert software. The variance analysis of the experimental results is performed, and the regression prediction model of the process parameters relative to the corresponding index is established. Through analysis of the established perturbation diagram and three-dimensional response surface, it is concluded that the main influence factors of melting width and penetration depth are laser power and positive effect, and the main influence factors of melting height are scanning speed and negative effect. The average error of each regression prediction model is lower than 10%. The above research work has important guiding significance for optimizing the process parameters and improving the cladding quality of cobalt-based alloy on ZG45.
Introduction
Pump valve is a device used to realize mechanical energy conversion and control fluid direction, pressure and flow in fluid systems. Its products are widely used in various fields of the national economy and are an important part of general machinery. 1 The quality of the sealing surface determines the service life of the valve, which is often subjected to corrosion, erosion and abrasive wear of many kinds of media in the switching process, which is easy to be damaged. 2 To repair and remanufacture the valve sealing surface, it can be repaired and strengthened, and many scholars have studied it. It is important to note that laser cladding technology is better than the traditional surfacing technology.3–6 As a new remanufacturing technology, laser cladding melts the coating material at the same time with the thin layer on the surface of the substrate after laser irradiation and forms a surface coating with extremely low dilution and metallurgical bonding with the substrate after rapid solidification.7,8 The wear resistance, corrosion resistance, heat resistance, oxidation resistance and electrical properties of the base surface should be significantly improved, to achieve the purpose of surface modification or repair.9–11 Because the cobalt-based laser cladding layer is widely used in harsh working conditions such as high-parameter valve sealing surface, Co-Cr-W alloy is used for laser cladding in this paper.12,13 The performance of laser cladding coating also depends on some process parameters such as laser power, scanning speed, powder feeding rate, spot characteristics and carrier gas flow rate.14–18 Large-area cladding is composed of multiple single-pass cladding, and cladding must be carried out under the best process parameters to obtain satisfactory coatings. Therefore, it is particularly crucial to model and optimize the geometric characteristics of the single-pass laser cladding layer.19–22
The empirical statistical model helps to avoid the complex physical phenomena of the analysis process and can help to study the relationship between the geometric characteristics of single coats and key process parameters in laser cladding processes.23–25 At present, there are many methods for optimizing process parameters, such as mathematical statistics, the Taguchi method, response surface method (RSM) and artificial neural network.26–29 Yu et al. 30 and others used Taguchi experimental design experiments to convert the response indexes such as coating width, coating height and dilution rate into a single grey relational grade (GRG) for comprehensive evaluation combined with gray correlation theory and obtained the best combination of process parameters. The optimized parameter combination ensures the robustness of the optimization results. Chen et al. 31 used Taguchi’s method to design experiments, ranked the factors affecting quality characteristics by the signal-to-noise ratio and used analysis of variance (ANOVA) to analyze the influence of important factors on coating quality characteristics. The results show that presetting powder thickness, spot diameter and laser power are the most critical processes. The support vector machine (SVM) model with a correlation coefficient (CC) > 0.94 is established to obtain the optimal process parameters. Onwubolu et al. 32 and others used the RSM to establish the infiltration angle model of laser power, scanning speed and powder mass flow rate. Discrete search optimization technology was used to determine the optimal process parameters. The adequacy of the prediction model was verified by ANOVA. Ma et al. 33 modeled the dilution rate and residual stress of laser cladding parameters by the RSM, studied the effect of each parameter on the response, and then used the quadratic model as a constraint function and applied multi-objective quantum. The behavioral particle swarm optimization algorithm was used to find the minimum dilution rate and residual stress. Finally, the optimal process parameters were predicted by this algorithm, and a high-entropy alloy coating was prepared.
In the Design of Experiment (DOE) experimental design, the Box–Behnken experimental design and RSM are applied in the preparation of a mathematical model. The developed model is verified by the ANOVA method. The relationship between process parameters and the output response and the interaction between process parameters are analyzed and discussed in detail. 34 Therefore, the purpose of this study is to use a regression analysis method to correlate the main processing parameters with the geometric characteristics of a single-pass coating, thereby establishing a statistical model of a cobalt-based alloy coaxial laser cladding system to verify the actual predicted effect of the model. The lap cladding experiment can obtain the optimal process parameter range, and the laser cladding process can be simulated and predicted at a lower cost.
Experimental principle and research method
Experimental equipment
The laser cladding system used in the present experiment is mainly composed of numerical control machining center LDM8060, high-power semiconductor fiber coupling laser, scraping disk powder feeder, water cooler and nitrogen gas protection system. The diameter of the laser spot is 3 mm. The laser processing head uses four coaxial powder feeding ways. The protective gas system is used for laser, powder feeder and laser processing head, respectively (Figure 1).
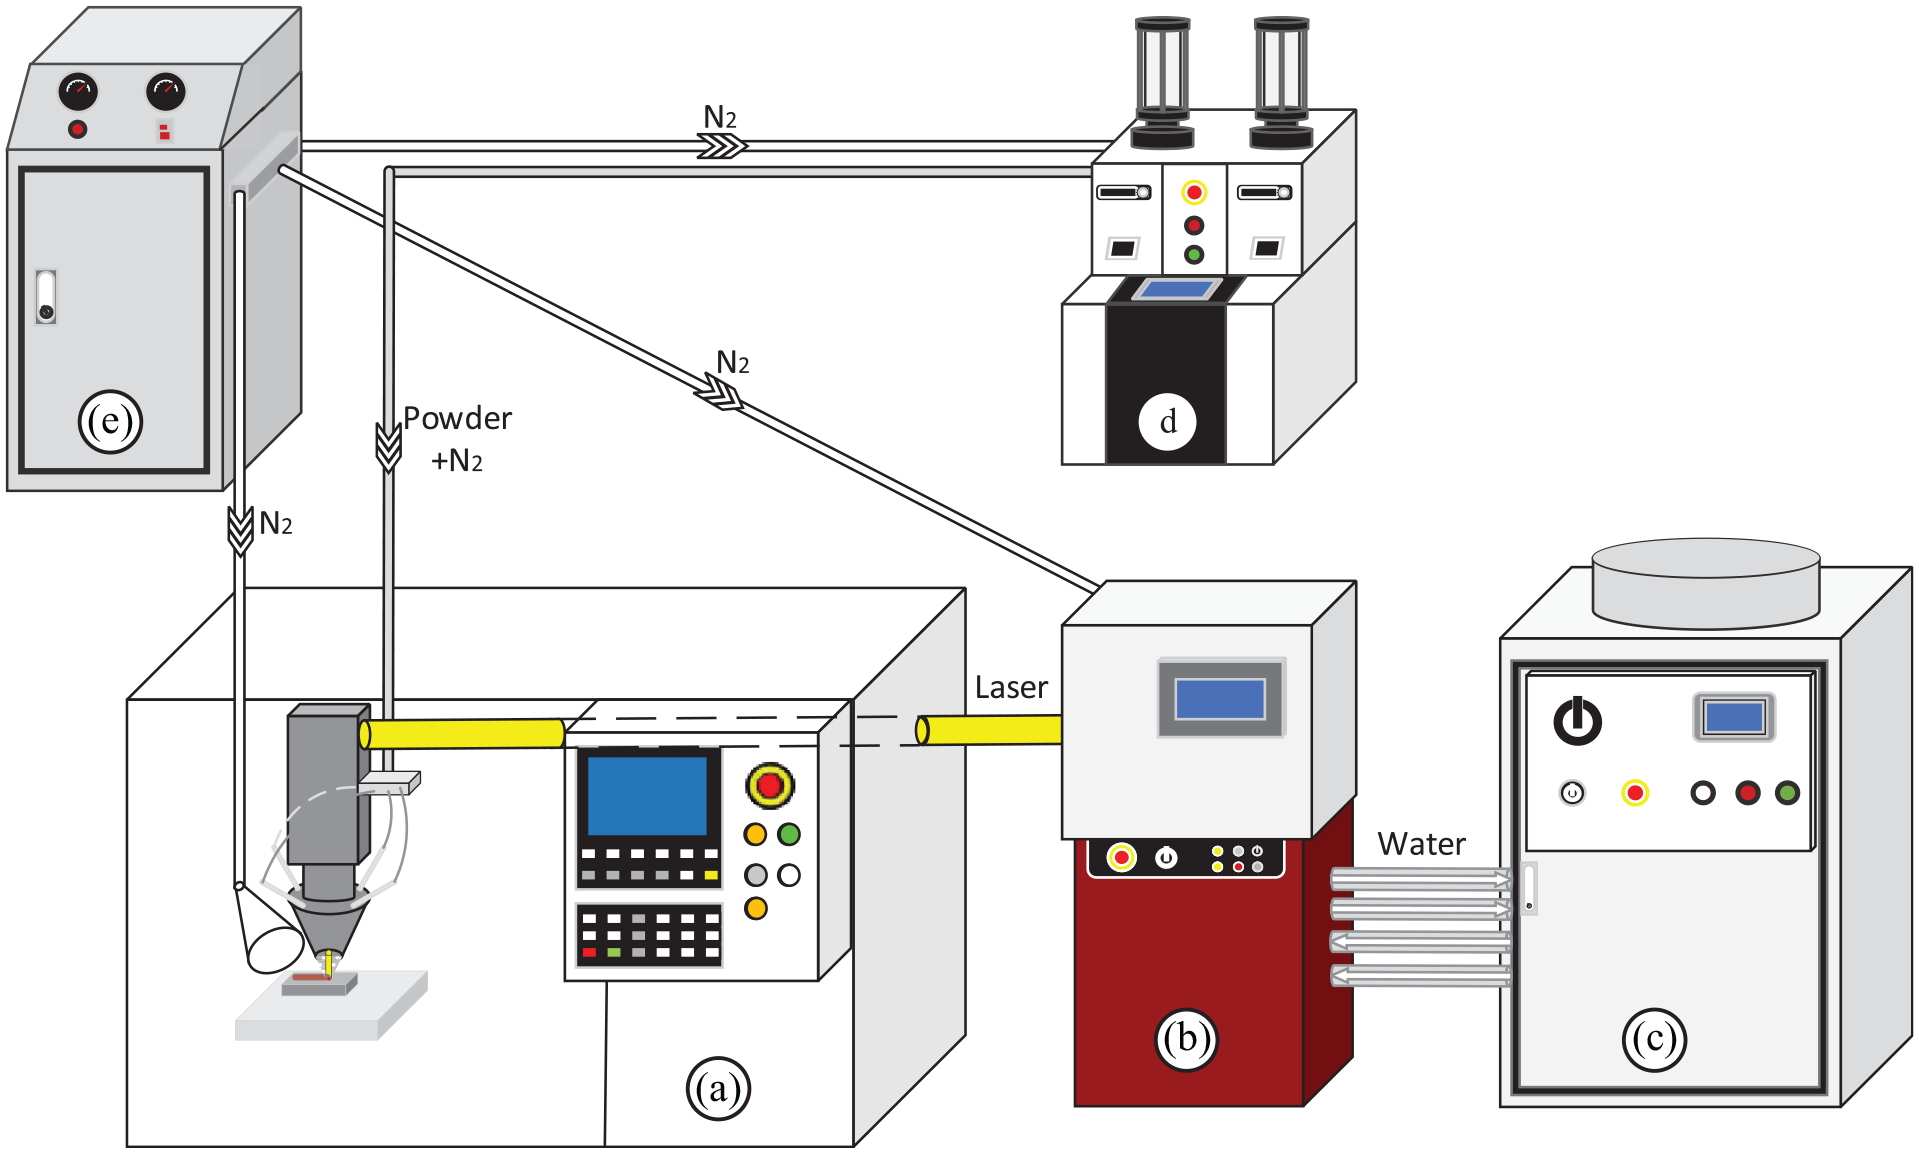
Laser cladding system: (a) CNC machining center, (b) laser, (c) water cooler, (d) powder feeder, (e) nitrogen generator.
The base material employed in the experiment is ZG310-570 (ZG45), which is a common material for pumps and valves. Its size is 100 mm × 50 mm × 15 mm. The surface of the base material is first removed with sandpaper, and then the surface is repeatedly cleaned with ethanol and acetone. Co-Cr-W alloy with a particle size of 53–150 μm is selected for this experiment. Its narrow particle size distribution helps in the formation of dense structures. Before the experiment, the powder is dried in a 120 °C drying box for 1 h to ensure its good fluidity. Figure 2 and Table 1 show the powder morphological characteristics and chemical composition mass fractions, respectively.
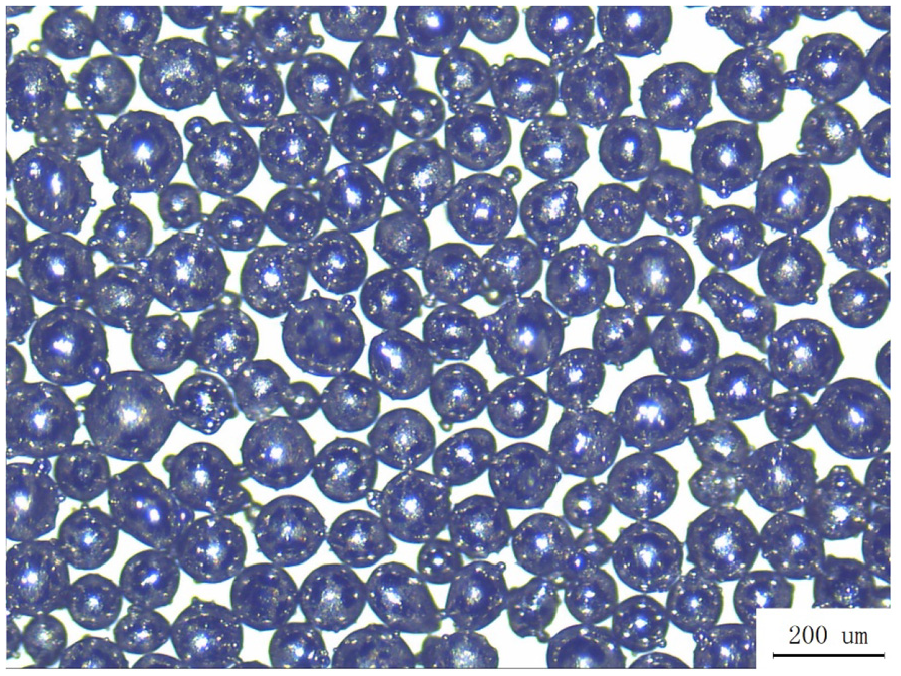
Morphological characteristics of cobalt-based alloy powder.
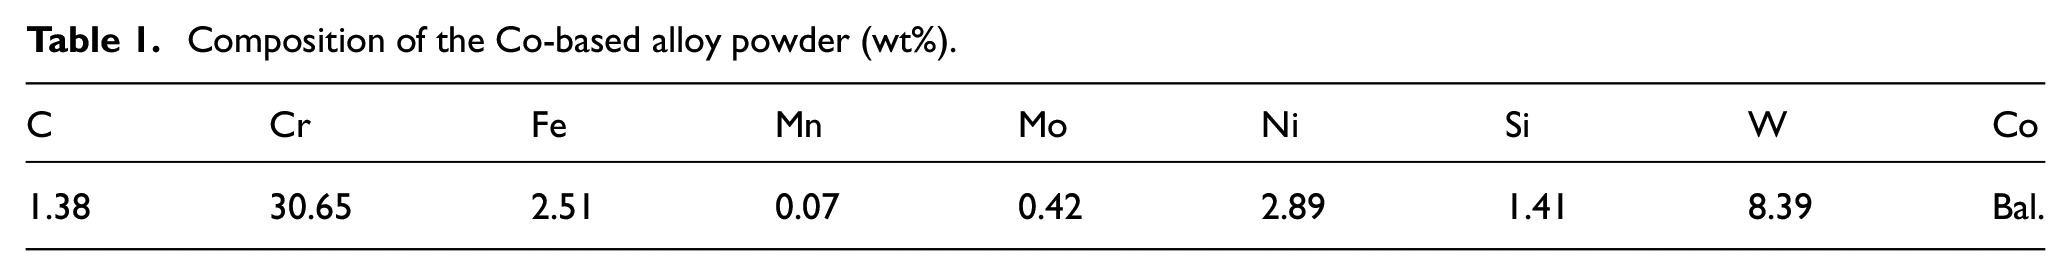
Composition of the Co-based alloy powder (wt%).
Experimental principles
RSM is a mathematical and statistical method used to establish the relationship between multiple independent input variables and responses to optimize the target response. To better establish a regression function model between influencing factors and response variables, this experiment uses the Box–Behnken design method to design an experimental scheme. The Box–Behnken design method can extract as much experimental variable effect and overall experimental error information as possible in the least number of runs and it runs efficiently. Therefore, a second-order regression model is used to fit the experimental data. As shown in equation (1)
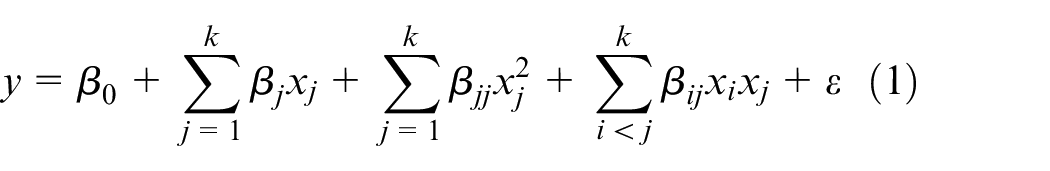
Among them,
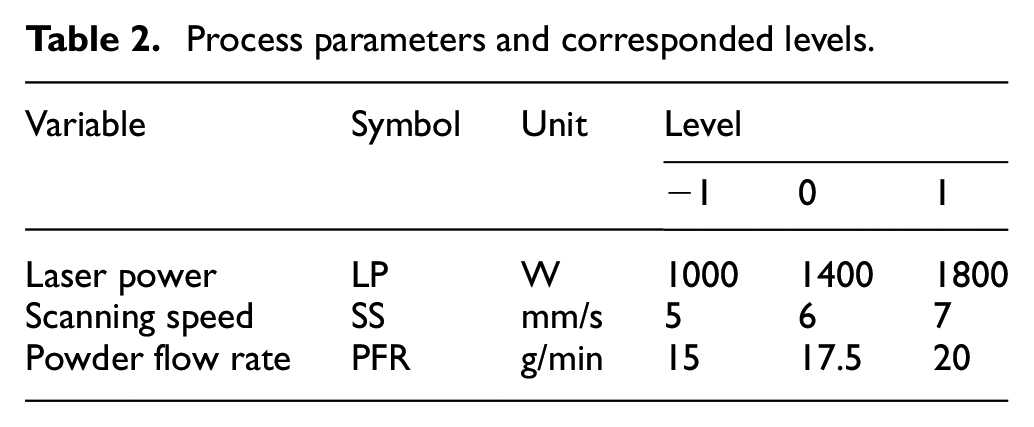
To study the effect of laser cladding process parameters on coating quality characteristics, based on RSM, laser power (LP), scanning speed (SS) and powder feed rate (PFR) were used as optimization variables. Coating width (W), coating height (H), coating depth (D), aspect ratio (W/H) and dilution rate (DR) were the response variables. Therefore, the response surface analysis software Design-Expert was used to establish a three-factor and three-level composite matrix with 12 axial points and 3 replication center points, that is, a 12-factor analysis experiment and 3 central experiments were designed. A total of 15 groups of experiments were designed based on the optimized levels obtained from the single-factor studies of the LP, SS and PFR. Table 2 describes each process parameter and coding level, and Table 3 describes the Box–Behnken experimental design scheme and experimental result.
Process parameters and corresponded levels.
Box–Behnken experimental design scheme and experimental result.
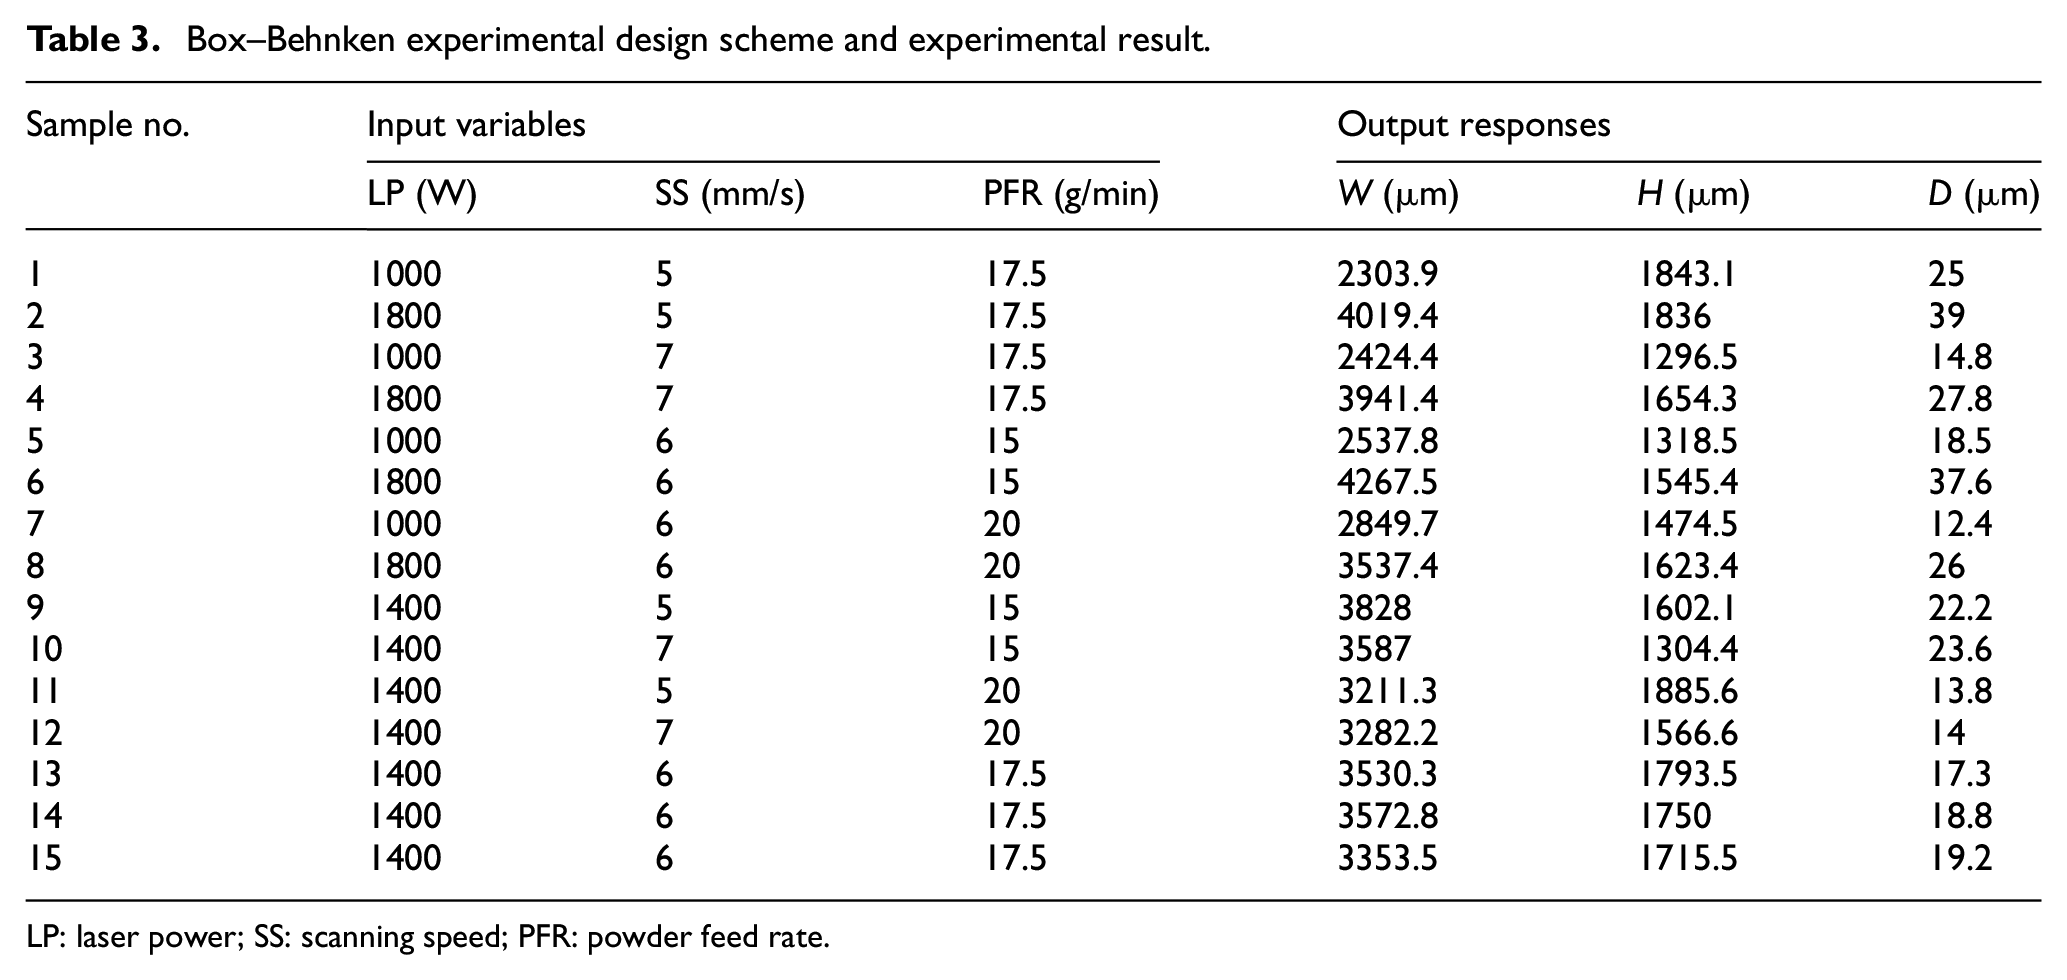
LP: laser power; SS: scanning speed; PFR: powder feed rate.
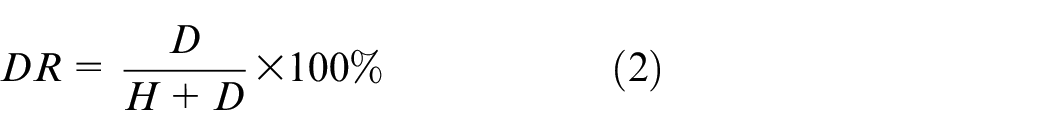
The quality characteristics of a single coat as a response variable of the process parameters include coat width (W), coat height (H), coat depth (D), aspect ratio (W/H) and dilution rate (DR). Figure 3 is a schematic diagram of the locations of the geometric features of the coating cross section. The aspect ratio takes into account the lateral expansion ability of the cladding layer. The larger the aspect ratio, the stronger the lateral expansion ability of the cladding layer. The dilution rate reflects the longitudinal expansion ability of the cladding layer and the dilution degree of the substrate of the cladding material. The smaller, the greater the longitudinal expansion ability, and the lower, the dilution degree of the cladding material of the substrate, so the aspect ratio and the geometric dilution rate can be used to optimize the three-dimensional stacking effect of the cladding layer. The calculation formula of geometric dilution rate is
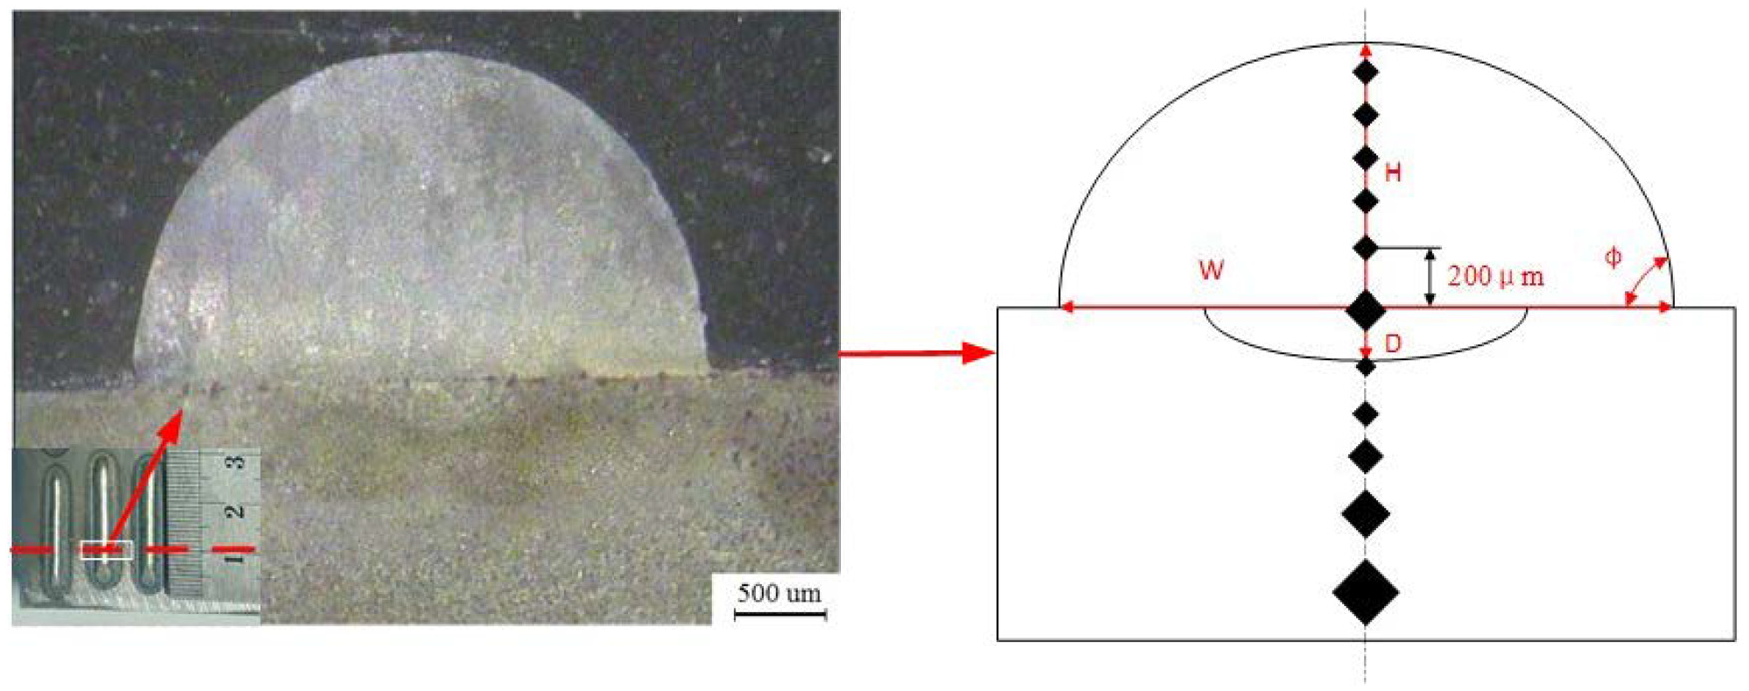
Schematic diagram of single coating quality characteristics.
After the preparation of the cladding layer is completed, the wire cutting machine is utilized to cut the block according to the cross-sectional position of Figure 3 to prepare a metallography sample. The cross sections of the samples were polished with 1200 mesh sandpapers and polished with a 0.25-μm diamond polishing agent until there was no scratch on the cross section of the sample, and metallographic corrosion was performed with aqua regia. The morphology of the cross section of the coating was photographed using a Lycra optical microscope (OM), and the geometric characteristics of the cross section illustrated in Figure 3 were measured using image processing software.
After measuring the cross-sectional quality characteristics of the coating, the data obtained were statistically analyzed using the ANOVA method. F tests, lack of fit tests and other adequacy indicators were used to assess the model’s fit. The F value is the model’s mean square division. With the ratio of the residual mean square, that is, the change explained by the model relative to the unexplained change when the p value is less than the significance level of 0.05, that is, the probability that it may occur due to noise is less than 5%, then the model or term is in
First, the significance analysis of four response value models of linear, linear and square terms, linear and interaction terms and the complete quadratic model is performed on the experimental data of each group. The model compares with the model p value less than 0.05 and the misfit term greater than 0.05 to compare the models. The degree of fit of the model determines the better response value model corresponding to the output response. Second, stepwise regression is utilized to eliminate insignificant terms in each model to determine the degree of influence of each parameter of the output response. Quantitative analysis is done based on the importance of each factor, and the cause of change is analyzed according to the perturbation diagram and an interactive diagram of the response of the input variables. Finally, a quadratic regression equation model is established to quantitatively control and predict the quality characteristics of the cladding layer.
Experimental results and discussion
Influence of process parameters on coating geometric characteristics
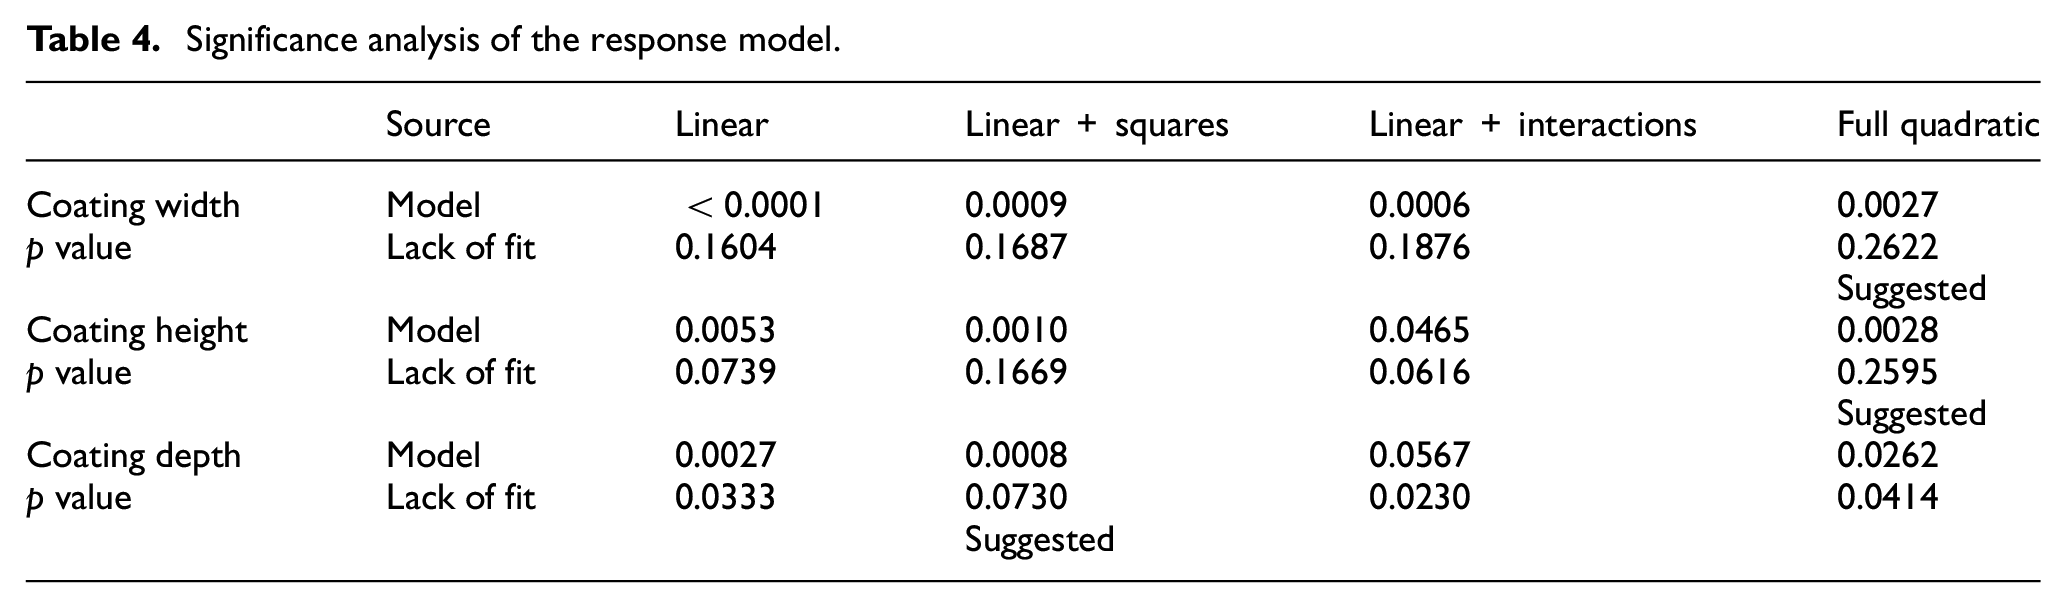
The significant analysis was performed on four response value models of linear, linear and square terms, linear and interaction terms and complete quadratic term model. The results are presented in Table 4. When a full quadratic regression model is selected for the coating width, the model p value is 0.0027 and the mismatch term p value is 0.2622, which is the best model among the four. When the full quadratic regression model is selected for the coating height, the model p value is 0.0028 and the mismatch term p value is 0.2595, which is the best model among the four. When the linear and the interaction term regression model was selected for the coating depth, the model p value was 0.0008 and the mismatch term p value was 0.0730, which is the best model among the four.
Significance analysis of the response model.
Coating width analysis
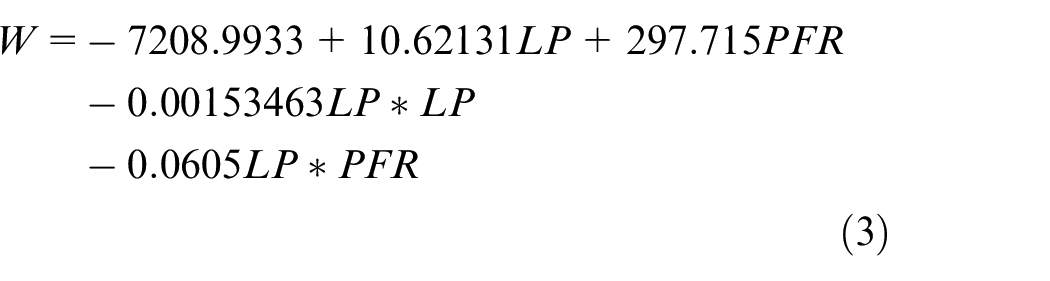
It can be seen from Table 4 that the coating width should be fitted with a complete quadratic regression model, and the insignificant factors should be eliminated automatically by the stepwise regression method. The variance analysis of the coating width in Table 5 shows that the F value of the model is 54.68 and the F value of the misfit term is 1.74, indicating that the term in the model is highly related to the response, and the p value of the model is less than 0.0001 and the p value of the misfit term is 0.4154. It is known that the model has only a 0.01% probability distortion, indicating that the model fits well. The input variables and output responses have a significant impact, and the selected model is reasonable. The R2 is 95.63%, indicating that there is a strong correlation between the experimental results and the predicted results. The R2 (adj) is 93.88%, indicating that the model has a very high degree of the fitting to the response. The R2 (pred) is 84.45%, indicating that the model is effective in predicting the new response value. AdeqPrecision (the ratio of the measured signal to noise) is 22.818, which is much more than 4, indicating that the accuracy of the model meets the requirements and has a high recognition rate. Therefore, equation (3) regression equation can be utilized to replace the real point of the experiment to analyze the experimental results
Analysis of coating width variance.
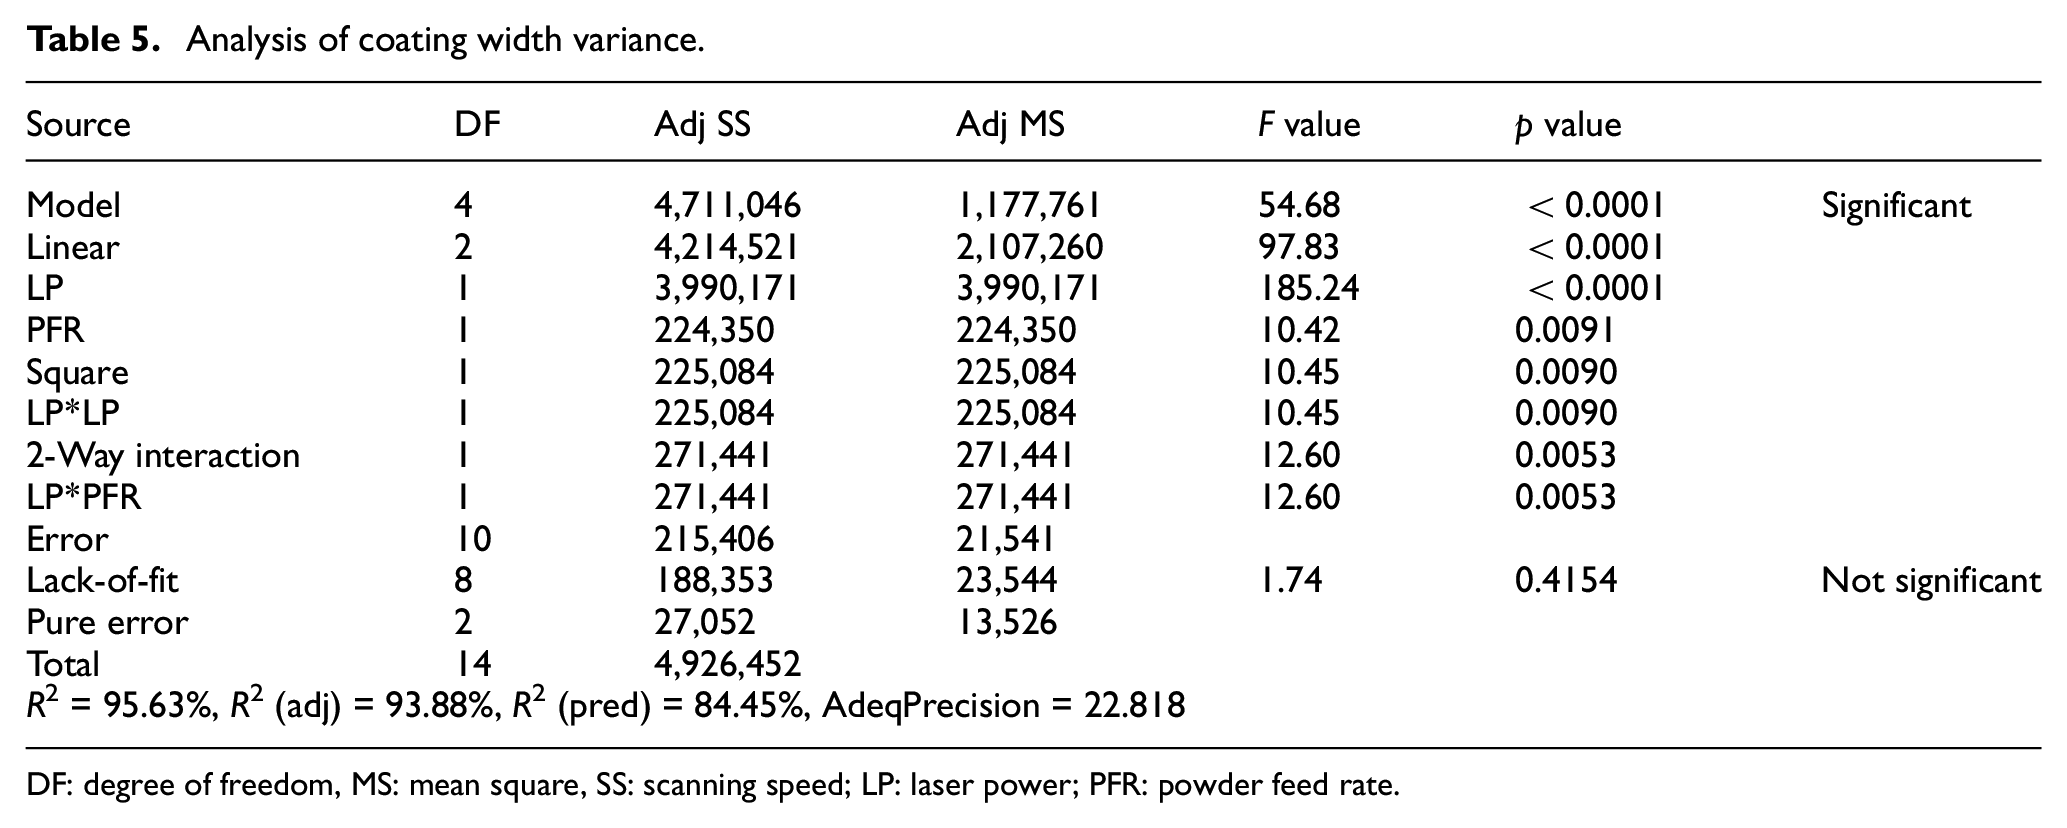
DF: degree of freedom, MS: mean square, SS: scanning speed; LP: laser power; PFR: powder feed rate.
The response model of input variables to W, including linear term LP and PFR, quadratic term LP2 and the interaction term LP*PFR, shows that it is the main influence factor of W. According to the value of P, the influence grade of W is LP > LP*PFR > LP*LP > PFR. Figure 4 shows the perturbation diagram of the input variable on W, which shows that the effect of the LP on W is positive, while that of PFR on W is negative. Figure 5 shows the interaction between LP and PFR on W, when the LP is low; PFR has almost no effect on W, when the LP is large; the influence of PFR on W increases; and the contours are oval, indicating that the interaction is significant. With the increase of the LP, the laser input energy per unit time increases, forming a larger molten pool, which eventually leads to the increase of W, so LP has a positive effect on W. With the increase of PFR, the melting powder per unit time increases, resulting in the reduction of the molten pool and the decrease of W.
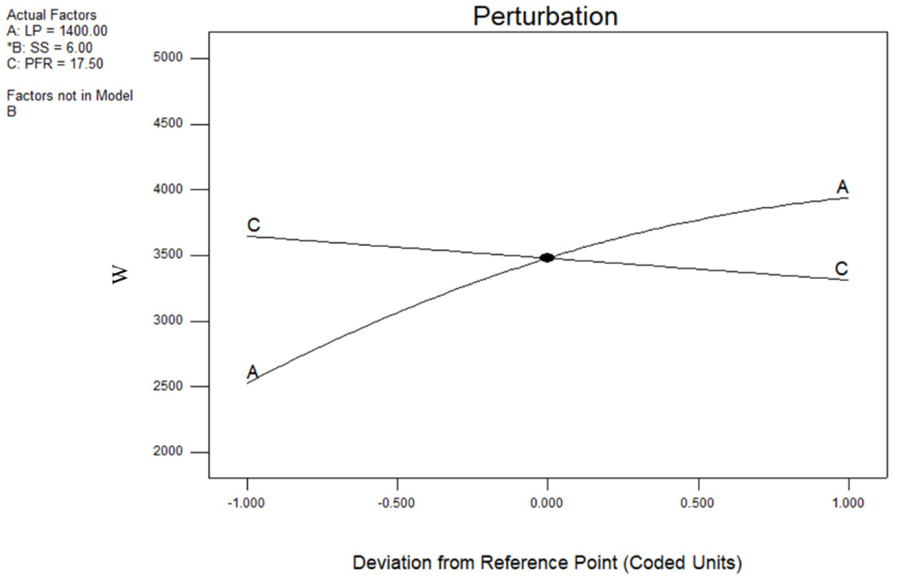
Perturbation plot of the coating width.
Effect of LP and PFR on W interaction: (a) contour map of LP and PFR interaction on W and (b) 3D response of LP and PFR interaction on W.
Coating height analysis
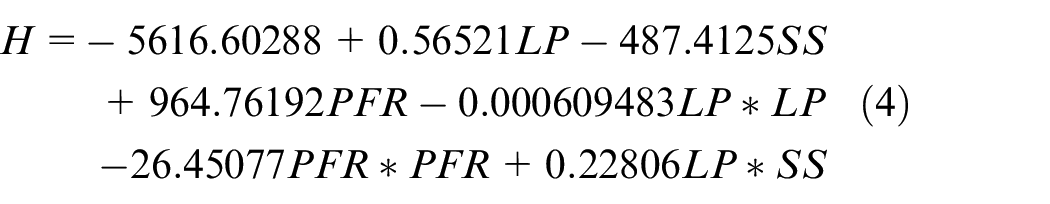
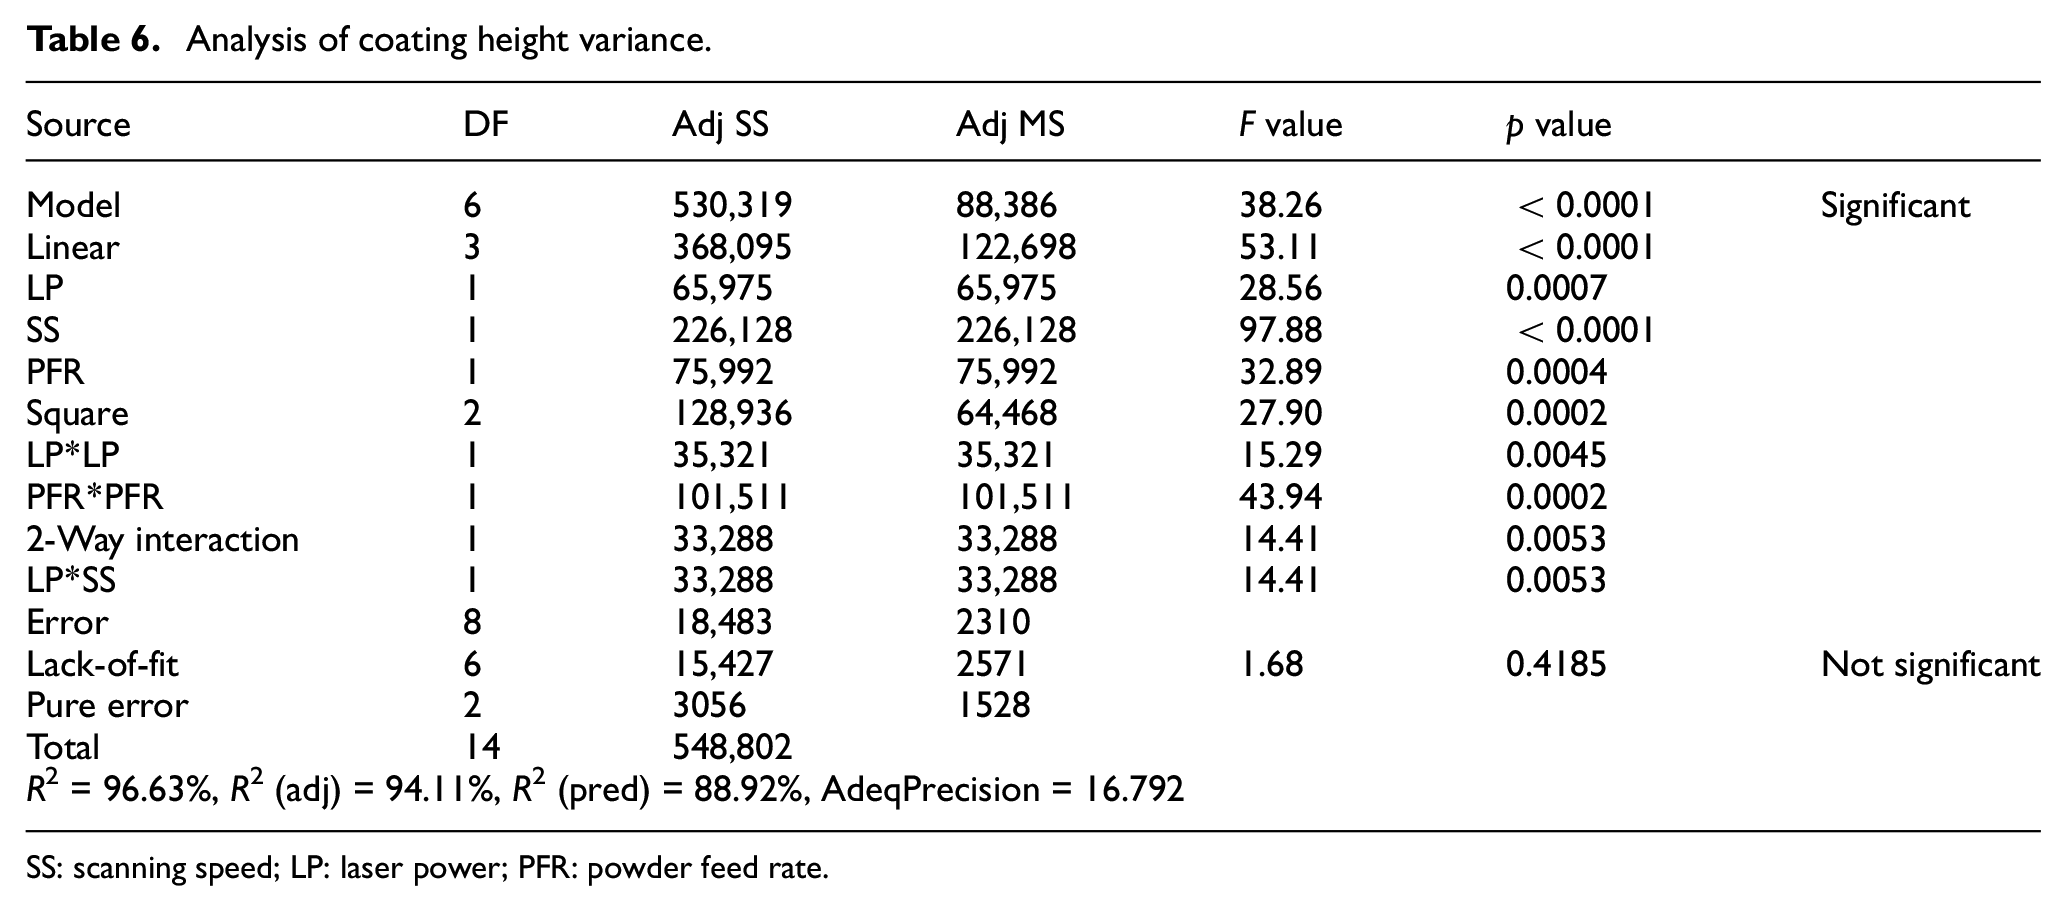
It can be seen from Table 4 that the coating height should be fitted with a complete quadratic regression model, and the insignificant factors should be eliminated automatically by the stepwise regression method. According to the ANOVA of the coating height in Table 6, the F value of the model is 38.26, and the misfit term F value is 1.68, indicating that the term in the model is highly related to the response, and the p value of the model is less than 0.0001, and the misfit term p value is 0.4185. It is known that the model has only a 0.01% probability distortion, indicating that the model fits well. The input variables and output responses have a significant impact, and the selected model is reasonable. The R2 is 96.63%, indicating that there is a strong correlation between the experimental results and the predicted results. The R2 (adj) is 94.11%, indicating that the model has a very high degree of the fitting to the response. The R2 (pred) is 88.92%, indicating that the model is effective in predicting new response values. AdeqPrecision (the ratio of the measured signal to noise) is 16.792, which is much more than 4, indicating that the accuracy of the model meets the requirements and has a high recognition rate. Therefore, equation (4) regression equation can be utilized to replace the real point of the experiment to analyze the experimental results
Analysis of coating height variance.
SS: scanning speed; LP: laser power; PFR: powder feed rate.
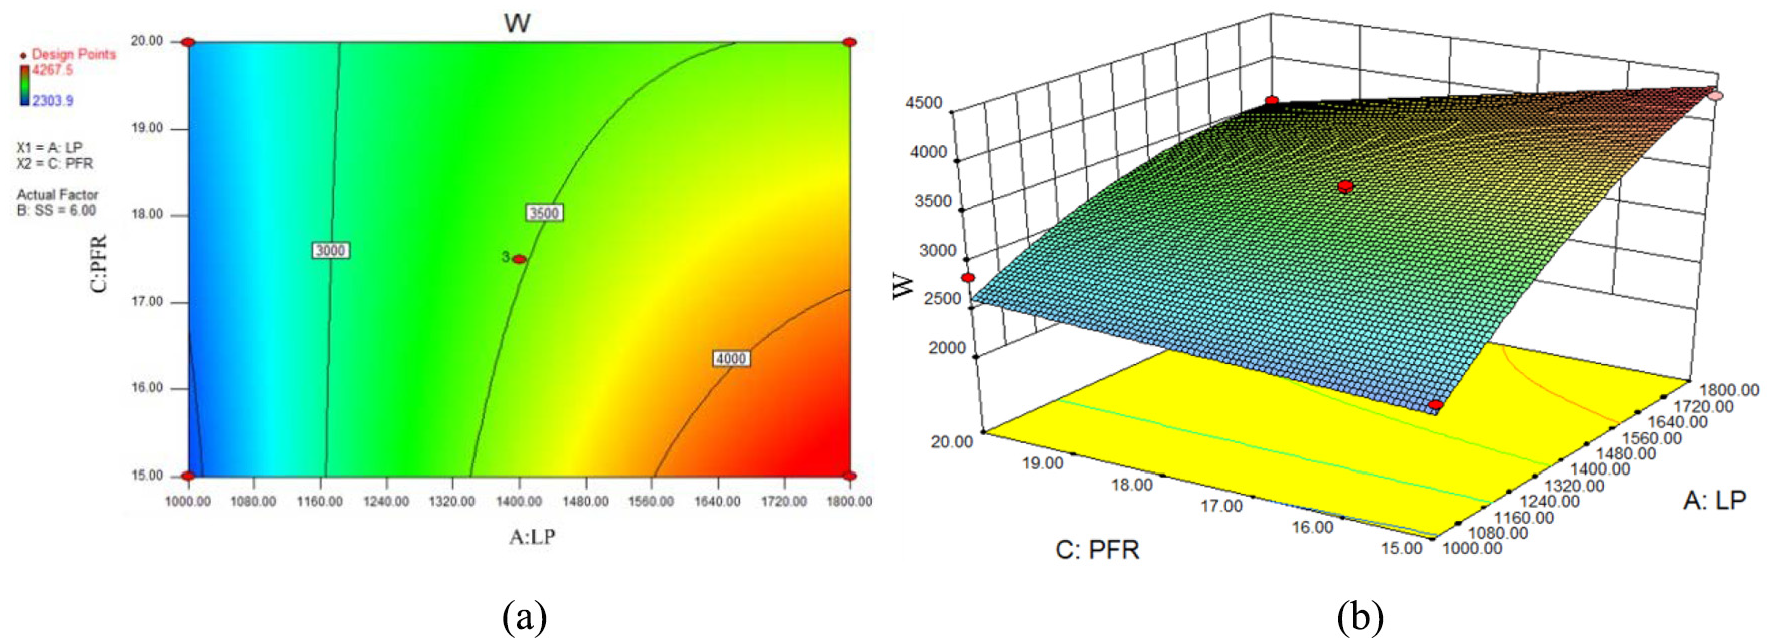
The response model of input variables for H includes linear terms LP, SS, PFR; quadratic terms LP2, PFR2; interaction term LP*SS, which are the main influence factors of W. According to the value of P, the influence grade of H is SS > PFR2 > PFR > LP > LP2 > LP*SS. Figure 6 indicates the perturbation diagram of the input variable to H, which shows that the effect of the LP and PFR on H is positive in the first section and negative in the later section. The reason is that with the increase of the LP, the laser input energy increases, the powder melting amount increases and H increases in the unit time of the front section, and the laser input energy continues to increase in the latter section, which leads to the increase of the input energy of the substrate, the increase of W and the decrease of H. With the increase of PFR, the melting amount of powder in the front section increases and H increases, while in the latter section, due to gravity and other factors, the molten powder spreads around and H decreases. The effect of SS on H is negative as a whole, which is due to the decrease of laser input energy and powder melting per unit time with the increase of SS. Figure 7 shows the interaction between SS and PFR on H, and the contours are oval, indicating that the interaction is significant. When PFR is low, the effect of SS on H is linear. When PFR is large, the effect of SS on H is nonlinear. The influence of PFR on H decreases with the decrease of SS, while the influence of the SS on H increases with the increase of PFR.
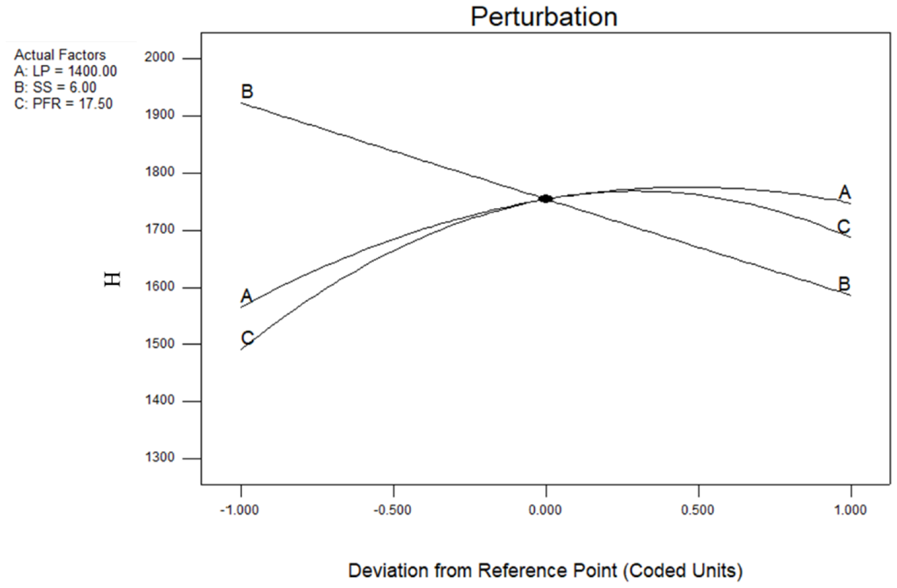
Perturbation plot of the coating height.
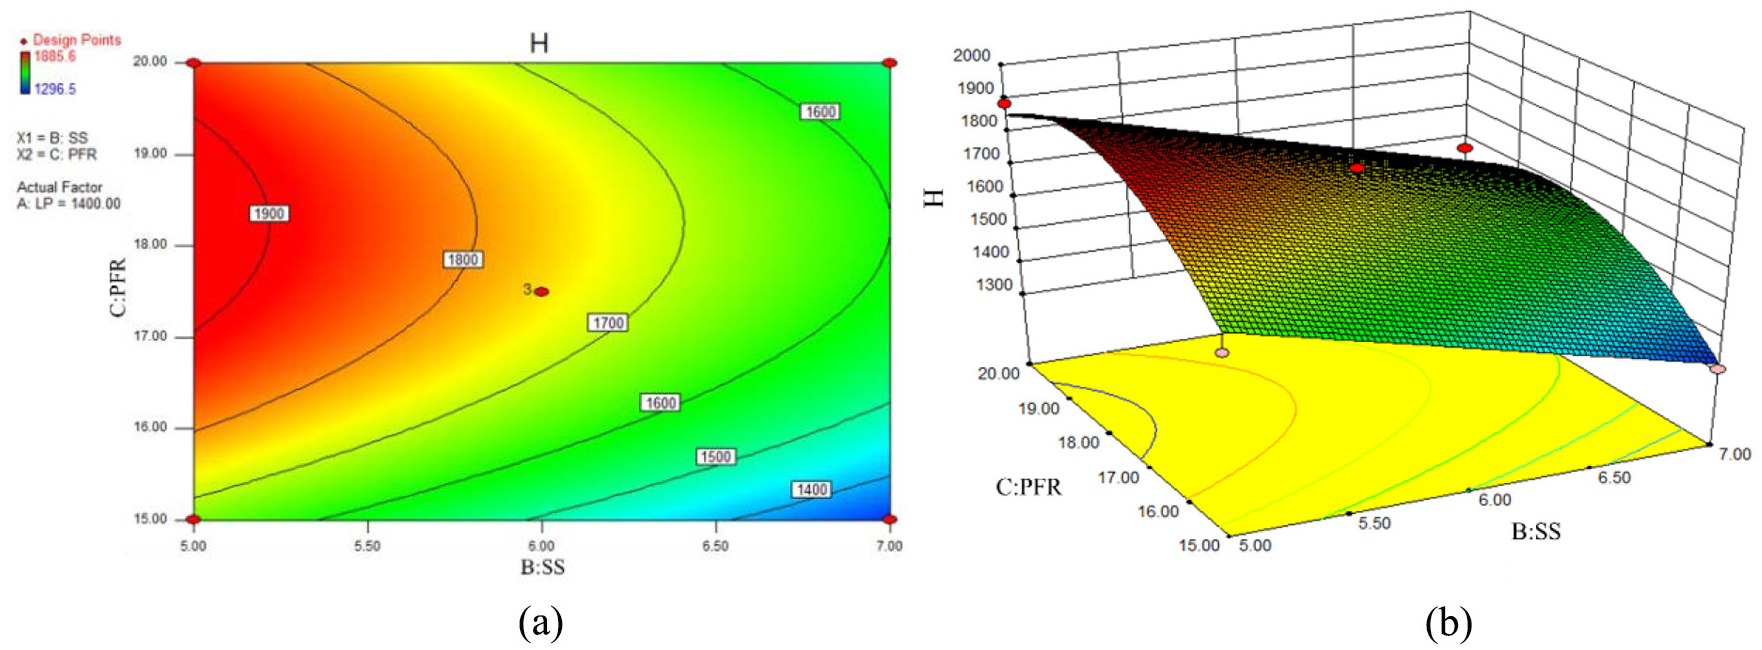
Effect of SS and PFR on H interaction: (a) contour map of SS and PFR interaction on H and (b) 3D response of SS and PFR interaction on H.
Coating depth analysis
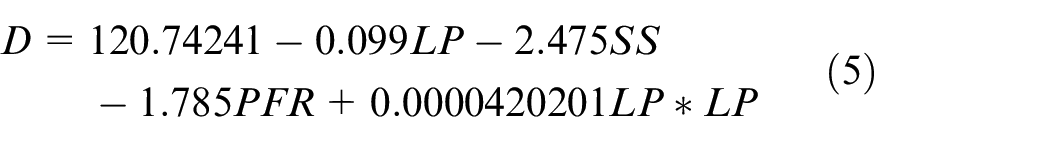
It can be seen from Table 4 that the coating depth should be fitted with the linear and square model, and the insignificant factors should be deleted automatically by the stepwise regression method. The variance analysis of the coating depth in Table 7 shows that the F value of the model is 20.84 and the misfit term F value is 12.04, indicating that the item in the model is highly related to the response, and the p value of the model is 0.0001, and the p value of the misfit term is 0.0789. It is known that the model has only a 0.01% probability distortion, indicating that the model fits well. The input variables and output responses have a significant impact, and the selected model is reasonable. The R2 is 89.29%, indicating that there is a strong correlation between the experimental results and the predicted results. The R2 (adj) is 85%, indicating that the model has a very high degree of the fitting to the response. The R2 (pred) is 72.29%, indicating that the model is effective in predicting the new response value. AdeqPrecision (the ratio of the measured signal to noise) is 14.107, which is much more than 4, indicating that the accuracy of the model meets the requirements and has a high recognition rate. Therefore, equation (5) regression equation can be utilized to replace the real point of the experiment to analyze the experimental results
Analysis of coating depth variance.
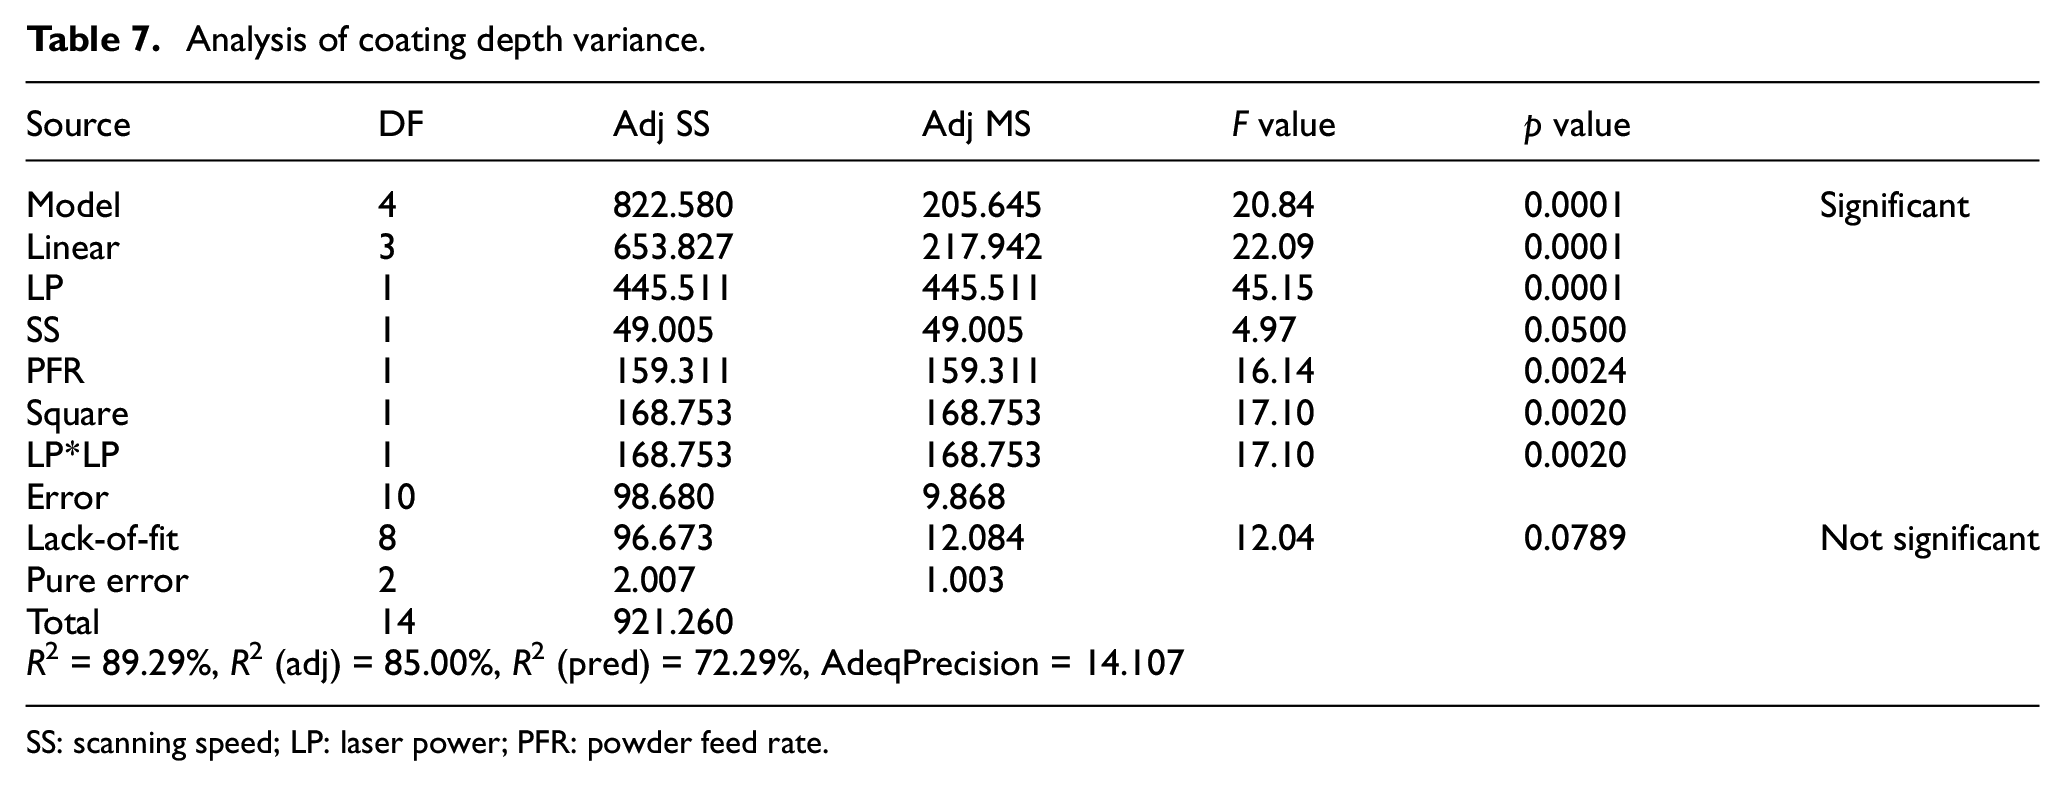
SS: scanning speed; LP: laser power; PFR: powder feed rate.
The response model of input variables to D includes linear terms LP, SS and PFR; quadratic term LP2, which are the main influencing factors of D. According to the value of P, the order of influence on D is LP > LP2 > PFR > SS. Figure 8 shows the perturbation diagram of the input variable to D. It can be seen that the influence of LP on D in the front part is small and has a negative impact. The reason is that the increased laser input energy per unit time is used to melt the powder, and the substrate receives less radiation energy, so the effect is not obvious. In the latter part, with the increase of the LP, the laser input energy radiates more to the substrate, which leads to the enlargement and deepening of the molten pool and the decrease of D, so the influence of D varies greatly and shows a positive effect. The effects of SS and PFR on D are negative. With the increase of SS, the laser input energy, molten pool and D decrease per unit time. With the increase of PFR, the laser input energy is more used to melt the increased powder, while the input energy to the substrate decreases, resulting in the reduction of the molten pool and the decrease of D. Figure 9 shows the effect of the LP and PFR on D interaction. The contours are oval, and the interaction is significant on the surface. The influence of LP on D increases with the decrease of PFR, and the impact of PFR of D increases with the increase of LP.
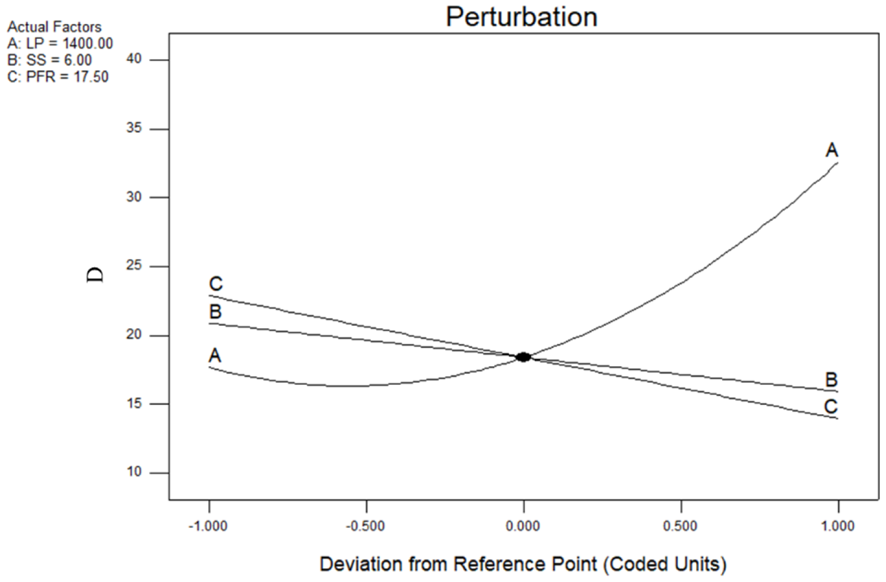
Perturbation plot of the coating depth.
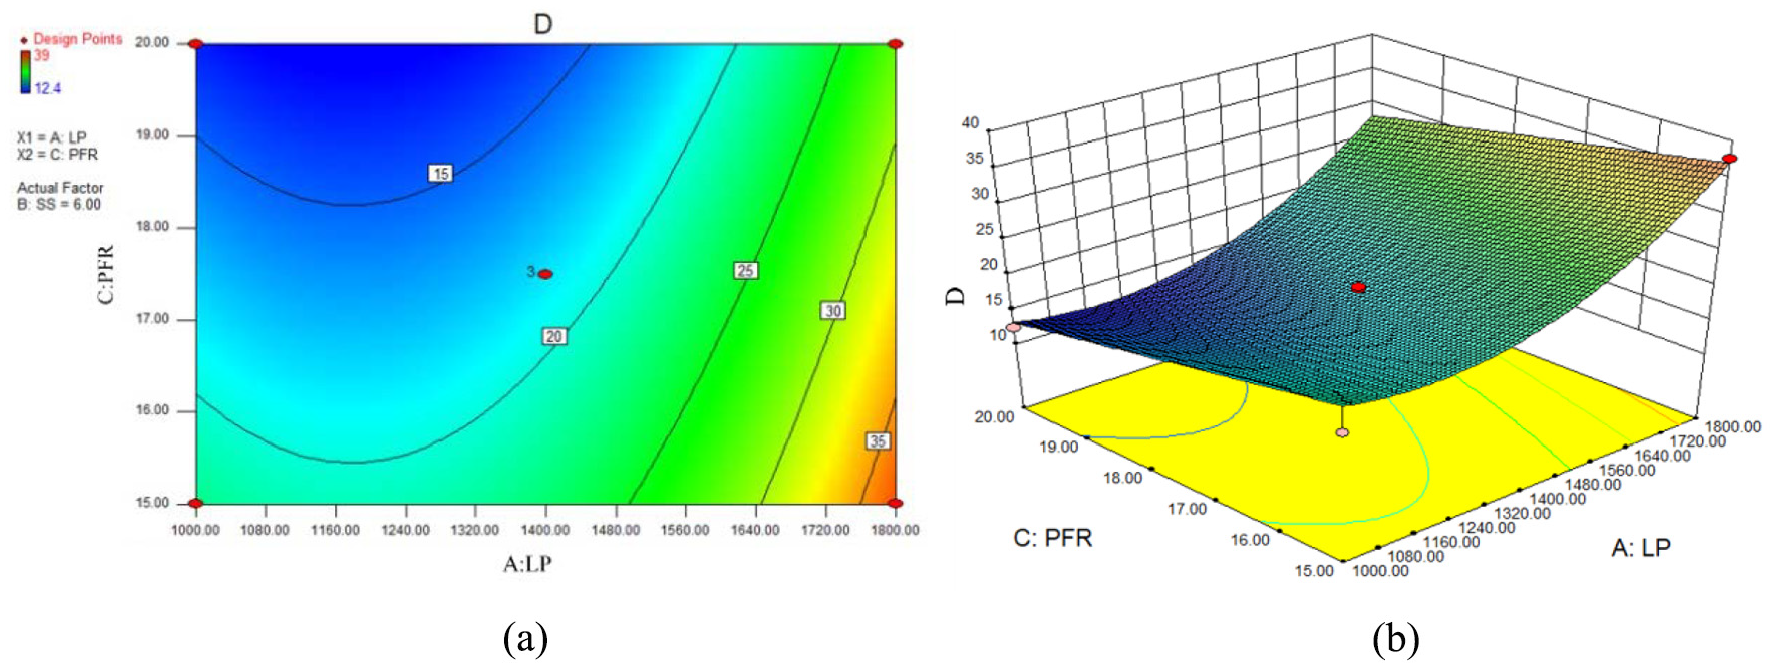
Effect of LP and PFR on D interaction: (a) contour map of LP and PFR interaction on D and (b) 3D response of LP and PFR interaction on D.
Mathematical statistical model of coating aspect ratio and geometric dilution rate
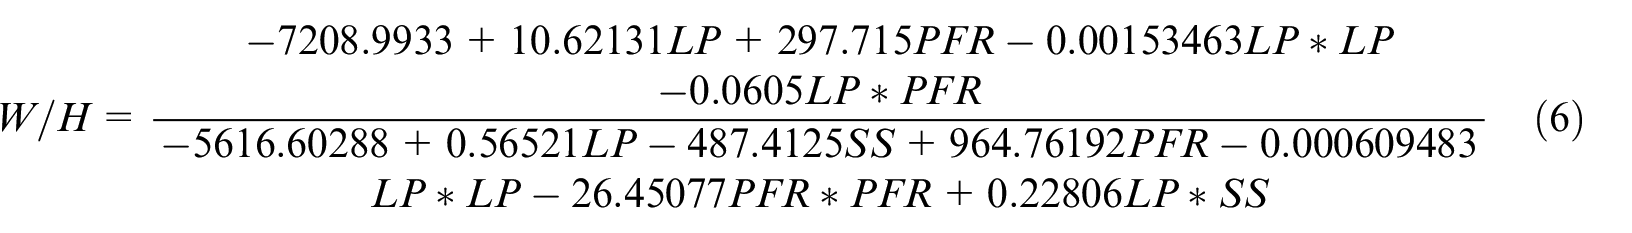
From equations (3) and (4), the mathematical-statistical model of aspect ratio can be deduced as
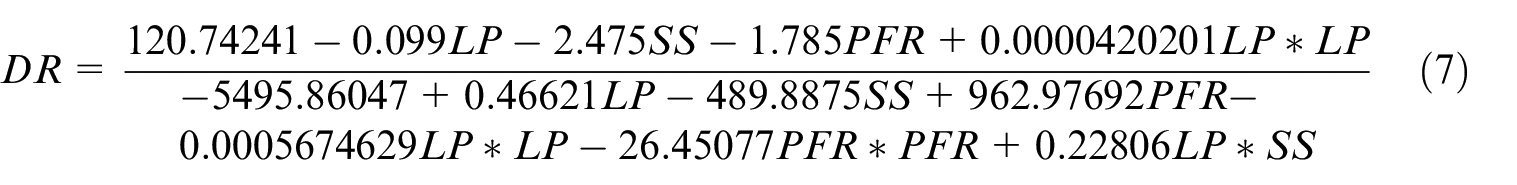
From equations (2), (4), (5), the geometric dilution of the coating can be derived
To calculate the fitting effect of the aspect ratio equation and the geometric dilution rate equation for the experimental data, the average error equation is used
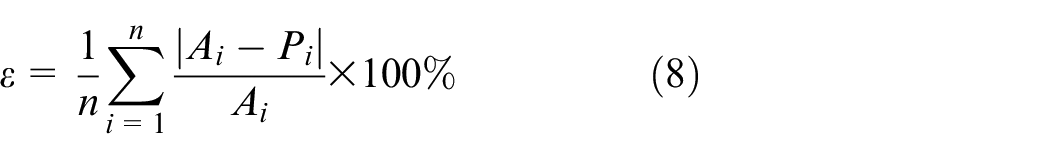
where
Optimization of process parameters and model prediction verification
According to the actual engineering requirements, the coating height needs to be greater than 1500 μm. It can be known that 5 mm/s ≤ SS ≤ 6 mm/s and PFR > 15 g/min. The aspect ratio needs to be greater than 2.4 to ensure the good lateral expansion of the cladding layer, so W > 3600 μm; it can be known that LP ≥ 1400 W and PFR < 20 g/min. The dilution rate needs to be less than 2% to ensure that the cladding layer has a good vertical expansion ability, so D < 30 μm; it can be known that LP ≤ 1700 W. Therefore, the optimal process parameter range of a single coat is 1400 W ≤ LP ≤ 1700 W, 5 mm/s ≤ SS ≤ 6 mm/s, 15 g/min < PFR < 20 g/min.
To perform predictive tests on the output response index regression equations (3)–(7), four sets of verification experimental data were selected to compare with the predicted data obtained from the respective regression equations. According to equation (8), the prediction error of each response index is shown in Table 8. According to the table, the average error of the coating width is 4.496%, the average error of the coating height is 1.150% and the average error of the aspect ratio is 3.364%. The average error of the three is less than 5%. It can be seen that the regression model established by response surface analysis and ANOVA has a very beneficial effect on fitting and predicting the width and height of the coating. The average error of the coating depth is 9.403%, and the error of the dilution rate is 8.470%. The average error of the two is below 10%. From the geometric dilution rate formula (2), it can be seen that the larger the value of the coating height, the more. When the depth value is small, a very small change in the predicted value of the coating depth can cause a large increase in the error rate, and the dilution rates in the experimental data are less than 2%, which can meet the actual production requirements. Therefore, the coating depth and the average error of the dilution rate below 10% can meet the actual needs of the project. It can be recognized from the above that the regression prediction model based on the RSM has important guiding significance for the optimization of the process parameters of the high-quality cladding of cobalt-based alloys on ZG45 and the improvement of cladding quality.
Prediction error table of each response index.
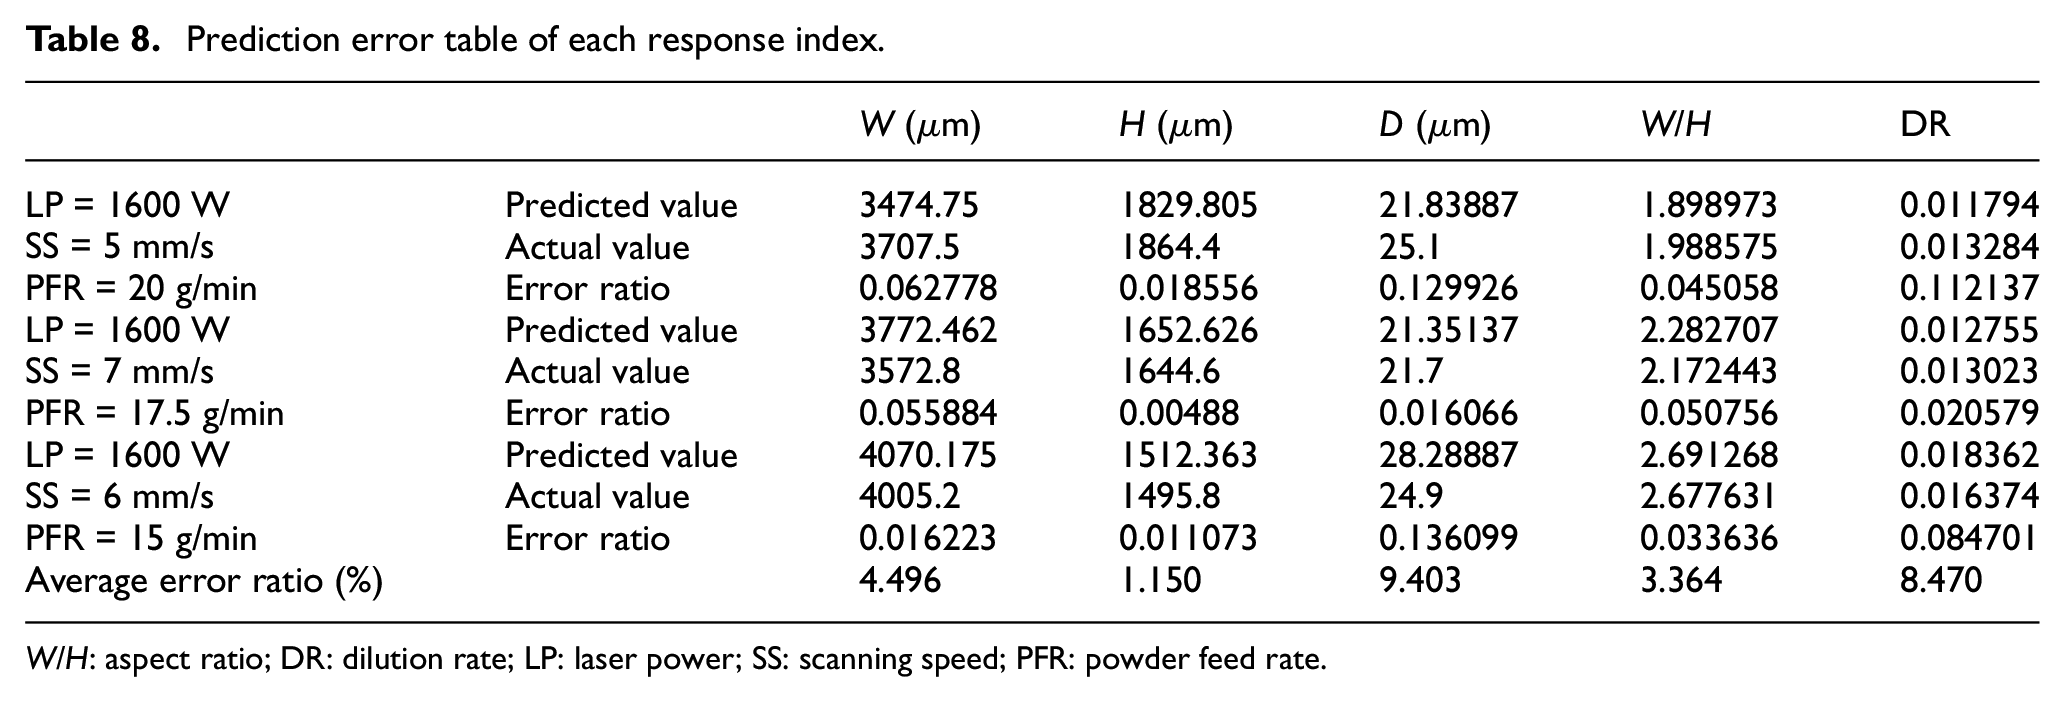
W/H: aspect ratio; DR: dilution rate; LP: laser power; SS: scanning speed; PFR: powder feed rate.
Conclusion
The laser cladding experiment of Co-based alloy is designed by the Box–Behnken design method. The experimental and analytical results show that the process parameters are closely related to the geometric characteristics of the single-pass coating. LP is the most important factor affecting the width of the coating and has a positive effect on it. SS is the most important factor affecting the height of the coating and has a negative effect on it. LP is the most important factor affecting the depth of the coating and has a positive effect on it in the main range.
The range of optimum process parameters for single-pass coating is 1400 W ≤ LP ≤ 1700 W, 5 mm/s ≤ SS ≤ 6 mm, 15 g/min < PFR < 20 g/min, which lays the foundation of processing parameters for laser cladding of multi-pass cobalt-based coatings.
It is both reasonable and feasible to use response surface analysis and variance analysis to model and analyze the relationship between process parameters and geometric features. The average error of the regression equation of geometric characteristics of a single coating is 4.496%. The coating height is 1.150%, the coating depth is 9.403%, the aspect ratio is 3.364% and the dilution rate is 8.470%.
Footnotes
Declaration of conflicting interests
The author(s) declared no potential conflicts of interest with respect to the research, authorship and/or publication of this article.
Funding
The author(s) disclosed receipt of the following financial support for the research, authorship and/or publication of this article: The authors would like to acknowledge the supports from the National Natural Science Foundation (grant no.: 51505506), Henan University’s key scientific research projects (grant nos: 20A460033, 19A460035, 20A460031) and Applied Research Project of Independent Innovation in Zhongyuan University of Technology (grant no.: K2018YY001).