
Abstract
In this study, for the selection of maximum material removal rate and minimum surface roughness
Keywords
Introduction
Micro-grinding is a competitive finish machining method for better surface integrity including more compressive surface residual stress, decreased surface roughness, and smaller dimensional tolerance. Among these quality attributes, surface roughness is significant for micro-grinding and is normally represented by the arithmetic mean value,
The understanding of surface forming mechanism and the parameters related to the surface roughness are important. Hecker and Liang 1 proposed an analytical model to predict the arithmetic surface roughness based on a probabilistic chip thickness model considering wheel topography, process parameters, and material microstructure. For micro-machining, some factors ignored in macro-machining, such as material microstructure, cutting edge radius, and elastic recovery, became significant due to small depth of cut being comparable to the material grain size. In micro-milling process, a comprehensive floor surface roughness model was proposed to predict the surface roughness of the grooves. 2 The influence factors such as the relative vibration, the elastic recovery, and the minimum cutting thickness were considered in the model. However, for the surface roughness generated by micro-grinding, the mechanism is still unclear, and the analytical model has not been proposed.
Numerous investigations are conducted to optimize process parameters for minimum surface roughness. The surface roughness of flexible joint made of maraging steel 3J33 after precision milling was investigated and measured. 3 In the investigation, Taguchi approach was used to design the milling experiments with the input parameters as milling speed, feed per tooth, and axis depth of cut. In addition, analysis of variance (ANOVA) was applied to select cutting parameters for optimal surface roughness. The result shows that milling speed is the most significant factor for the surface roughness among the milling parameters. Lu et al. 4 applied the response surface methodology (RSM) to develop an empirical model to predict the surface roughness in micro-milling of Inconel 718. In addition, the process parameters were analyzed by ANOVA, and the minimum surface roughness was achieved by determining the optimal process parameters using genetic algorithm (GA). However, for micro-grinding, the optimization for minimum surface roughness has not been investigated.
Besides surface roughness, machining efficiency is also critical for micro-machining. In order to have high efficiency in addition to good surface finish, it is imperative to optimize the grinding conditions to minimize the surface roughness and maximize material removal rate (MRR) simultaneously. Wu et al. 5 investigated the ductility-oriented removal mode in grinding of brittle materials. The result shows that the increase in surface speed causes higher MRR and smaller surface roughness. The MRR depends on depth of cut and workpiece speed in the model. Sunder and Yadava 6 modeled and optimized the process parameters for higher MRR and better surface finish in surface–electrical discharge diamond grinding process. In the investigation, MRR is a function of the initial weight of workpiece, the final weight of workpiece, and the machining time. Lu et al. 7 investigated the optimization of cutting parameters, including spindle speed, feed per tooth, and the depth of cut, for the maximum MRR and minimum surface roughness without cutter breakage in micro-milling. The Taguchi approach and regression analysis were applied to build a statistical model of surface roughness, and GA toolkit was used for optimization. Zerti et al. 8 investigated the optimization for four objectives in turning operations. First, the experiments were designed using Taguchi method with the input parameters of cutting speed, the depth of cut, and feed rate. Then, the ANOVA and Pareto chart analysis were carried out to quantify the parameters on the output parameters. The mathematical models of the output parameters were built based on RSM and artificial neural network (ANN) approaches, and the two methods were compared. Finally, the desirability function (DF) was proposed to optimize the input parameters to lower surface roughness, increase MRR, and reduce cutting force as well as power. However, few investigations were conducted about the optimization of process parameters for maximum MRR under the constraint of surface roughness in micro-grinding process.
The previous researches reported that the forces and roughness were varied when the cutting orientation changed in the micro-machining of the single crystals. Ueda et al. 9 experimentally investigated the variation of the pattern of chip formation and the force with the change in crystallography orientation of single crystals in cutting. Through experiments, Hansen et al. 10 found two dislocation patterns induced by different grain orientations under deformation and applied the microstructural evolution, correlated with the grain orientation, in the model of the anisotropy of facial center cubic (FCC) metal. Zhao et al.11,12 proposed the Taylor factor to estimate the effect of crystallographic orientation (CO) on the grinding force and temperature in micro-grinding.
In this research, the optimization models with and without considering Taylor factor of material as input parameter are developed for MRR and surface roughness in micro-grinding alloy aluminum 7075 (AA7075). The micro-grinding experiments are designed following Taguchi approach. As the first optimization approach, RSM is applied to build the mathematical models, one of which is a function of surface speed, feed rate, the depth of cut, and Taylor factor for surface roughness; the other model uses the same parameters but without Taylor factor. The individual desirability for MRR and surface roughness as well as the DF are calculated. In addition, the inverse analysis is conducted, and the optimal input setting is obtained. As the second optimization approach, the improved multi-objective particle swarm optimization (IMOPSO) is used to select the input parameters for the high MRR and low surface roughness. Finally, the optimal results from both two approaches indicate that the models considering the Taylor factor improve the optimization process.
Methodology
RSM
RSM is an empirical modeling approach to determine the relationship between the input parameters and the output parameters based on experiment data. This method is applicable for nonlinear problems even when the mechanism of the process is unclear. The developed empirical model is used for predication, and then the best response is obtained by selecting the desired outputs. Moreover, the optimal input parameters are found through inverse calculation. In addition, the multi-response optimization is conducted based on RSM by developing DF and predicting the response under given input parameters. Therefore, RSM is widely used in the field for complex material cutting process.
In this paper, the depth of cut
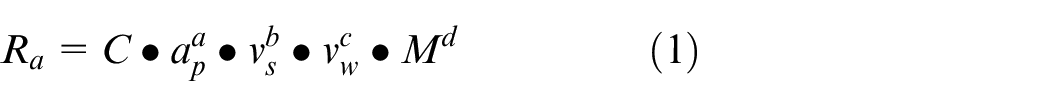
where
To convert the nonlinear model to a linear model, logarithmic transformation is used

For model simplification, equation (2) can be given as follows

where y is logarithmic transformations of the measured surface roughness, and
The quadratic response model can be represented as follows
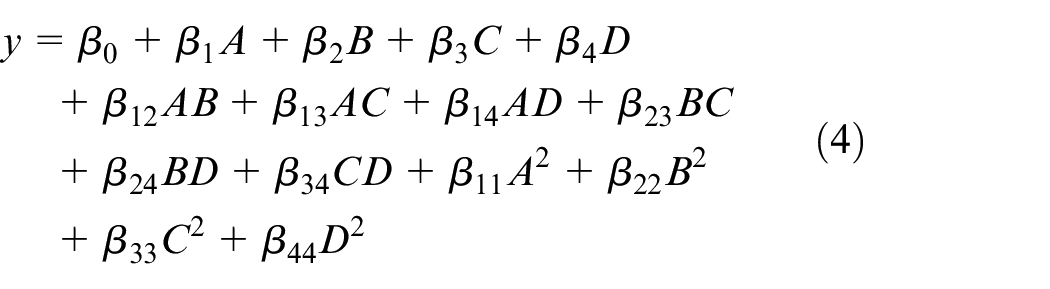
where
Multi-objective particle swarm optimization
Particle swarm optimization (PSO) algorithm is an important optimization tool and used in various fields. It is a population-based search method that exploits the concept of social sharing of information following the intelligence of the socio-biological group of organisms. In general PSO, the initial population and velocity of particles are randomly generated. Each particle is denoted and its velocity as well as position in each iteration is updated, and the fitness value is evaluated. The
Experiments setup and procedure
Materials
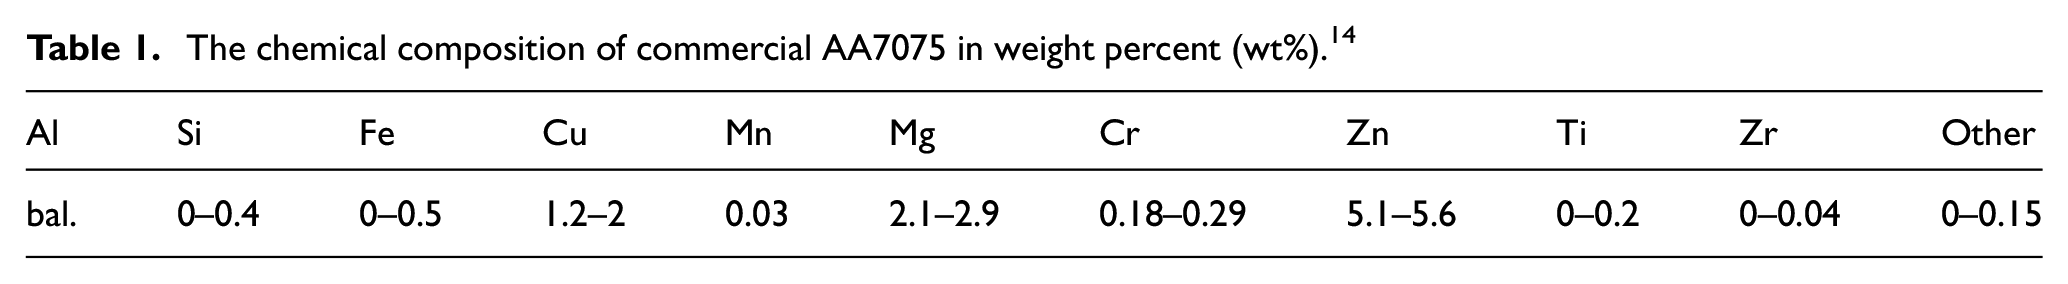
Aluminum alloy 7075T6 (AA7075T6) has a high strength-to-density ratio and is widely used in aerospace components. This investigation is about micro-grinding of commercial AA7075T6, with the chemical composition listed in Table 1 in weight percent.
The chemical composition of commercial AA7075 in weight percent (wt%). 14
Four groups of samples were cut from a single AA7075T6 plate with the initial dimension of
Experimental setup and measurement condition
A CNC microscale machine tool was used for the micro-grinding experiments. Figure 1(a) shows the machine including frame, spindle, micro-grinding wheel, positioning stage, and inspection. Figure 1(b) shows the workpiece clamped. Figure 1(c) shows the magnified morphology of the Cubic boron nitride (CBN) grinding wheel 85412-BM surface. Figure 1(d) shows the relative location of the workpiece and tool.
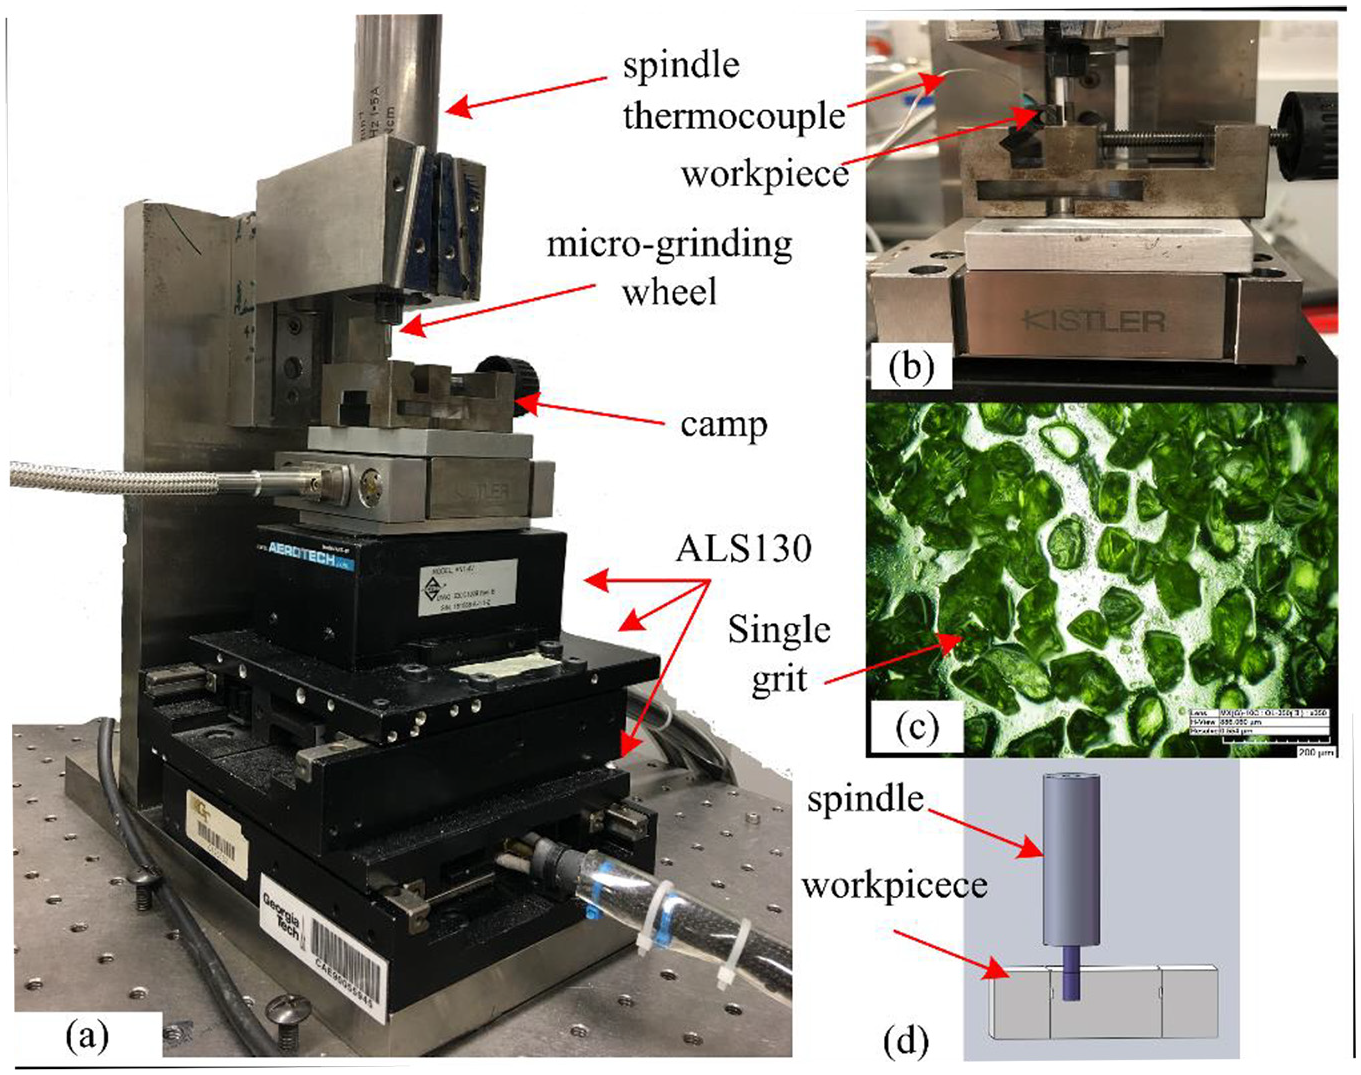
Schematic diagram of micro-grinding. (a) shows the machine including frame, spindle, micro-grinding wheel, positioning stage, and inspection, (b) shows the workpiece clamped, (c) shows the magnified morphology of the CBN grinding wheel 85412-BM surface, (d) shows the relative location of the workpiece and tool.
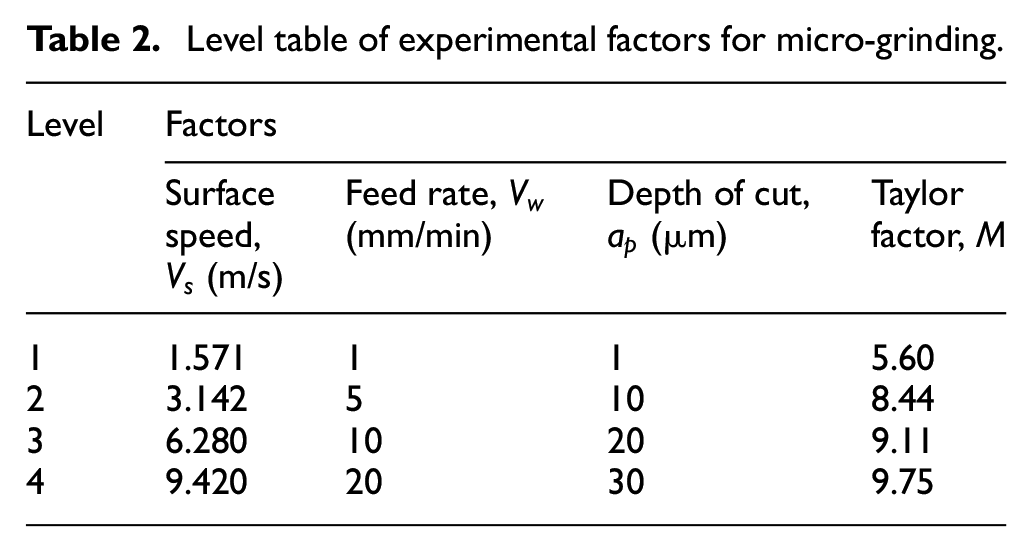
The micro-grinding experiments were designed according to Taguchi method, with surface speed, feed rate, depth of cut, and the Taylor factor as the input parameters. Four levels for each factor are shown in Table 2.
Level table of experimental factors for micro-grinding.
After the micro-grinding experiments, the workpieces were cleaned with acetone in an ultrasonic bath for 20 min. Then, the Bruker Nano Surface white light interferometer was utilized to measure the surface roughness (Ra) as shown in Figure 2(a). Both two-dimensional (2D) and three-dimensional (3D) surface roughness can be measured through this equipment with high precision in a sub-nano resolution. The measured area was enlarged as shown in Figure 2(b). The software system was used to process the raw data by correcting the measured curved surface to plane for exact value. Figure 2(c) shows the surface topology of one measured workpiece. In Figure 2(c), the ground surface is mainly featured by irregular caves.
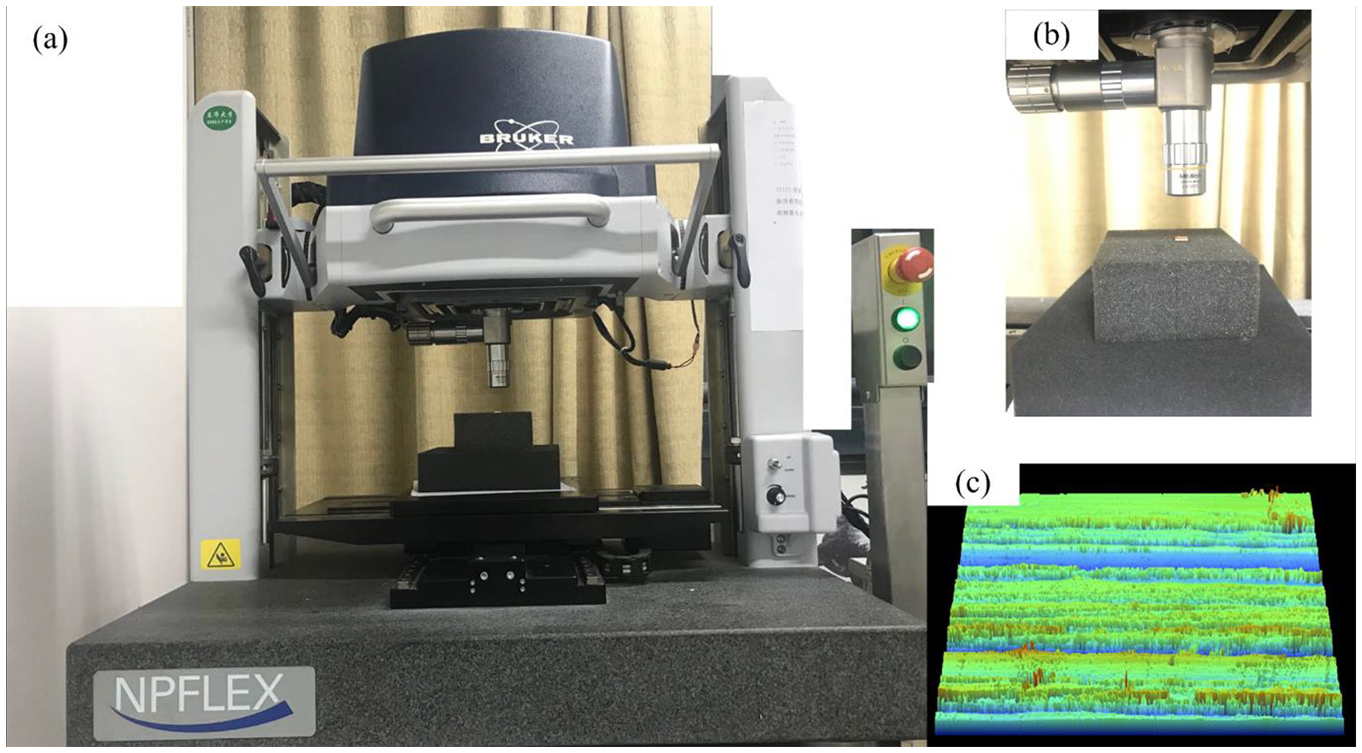
Surface roughness measurement. (a) Bruker Nano Surface white light interferometer was utilized to measure the surface roughness (Ra), (b) shows Both two dimensional (2D) and three-dimensional (3D) surface roughness can be measured through this equipment with high precision in a sub-nano resolution. The measured area was enlarged.
The measured surface roughness after micro-grinding is collected in Table 3. In addition, the MRR during micro-grinding is calculated by equation (5) and also listed in Table 3

Layout of
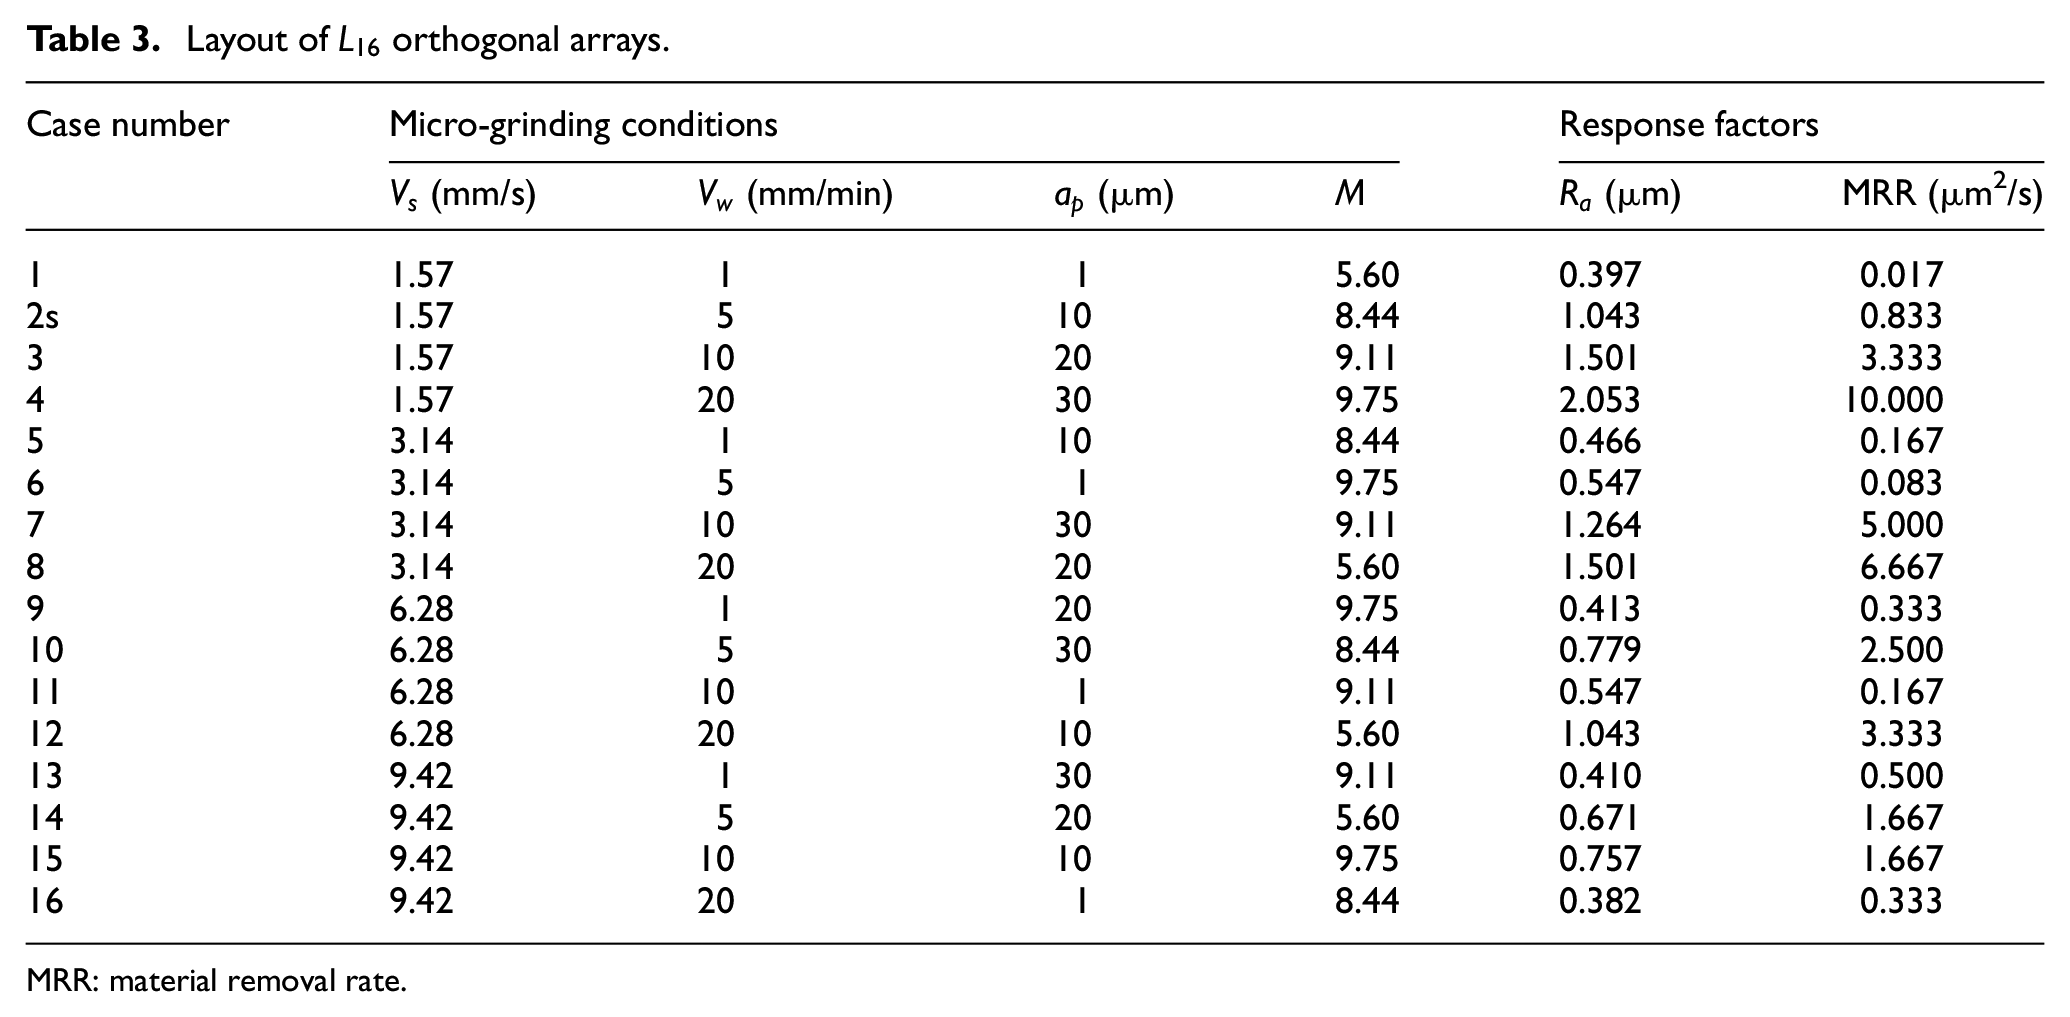
MRR: material removal rate.
The orthogonal-designed micro-grinding experiments were conducted with the variation of the surface speed, feed rate, depth of cut, and the Taylor factor. The factors are arranged according to the orthogonal matrix
Analysis and optimization
The optimal result of RSM
For the input parameter of A, the summation of squares of differences
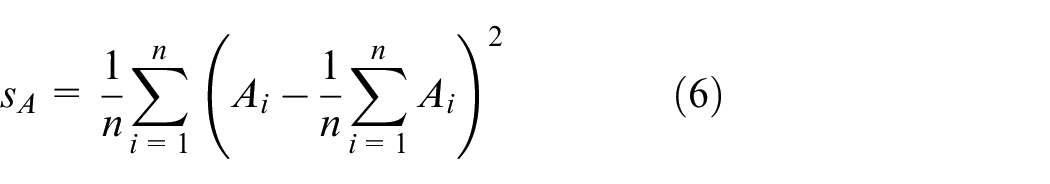
Similarly,
ANOVA table for
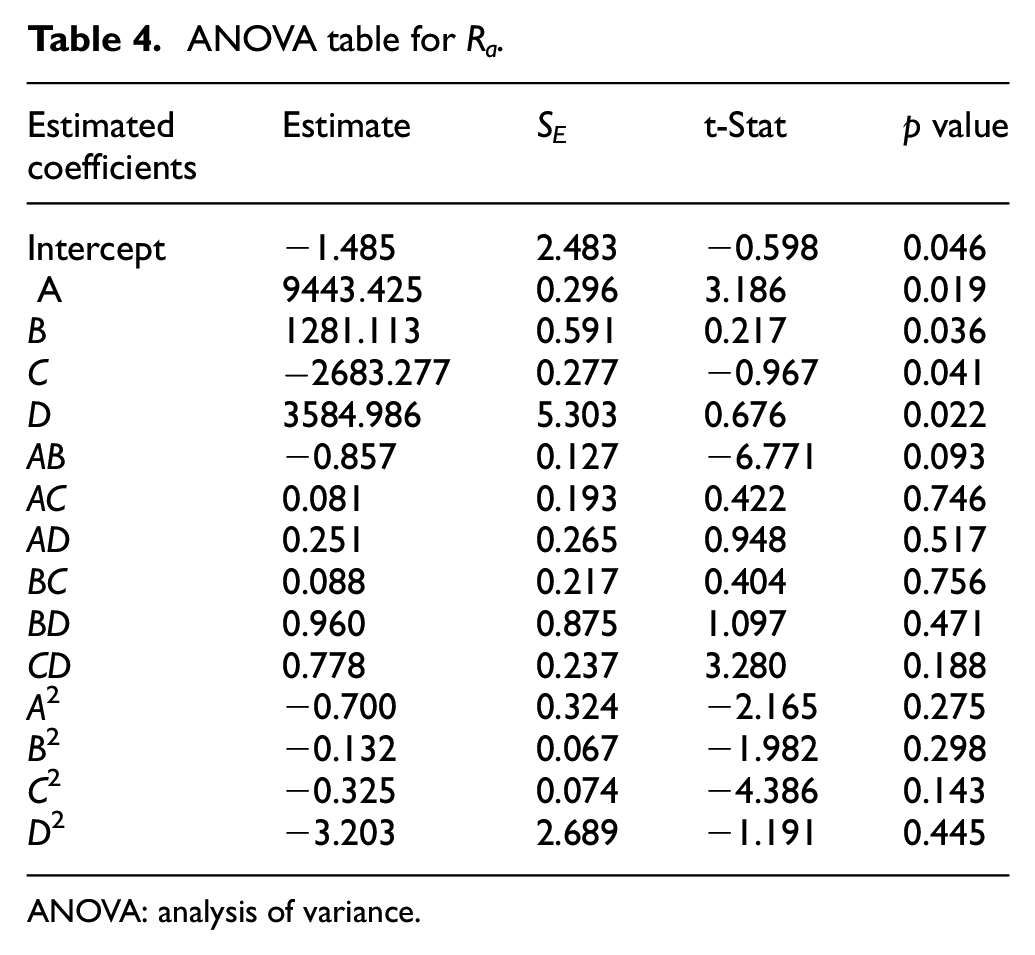
ANOVA: analysis of variance.
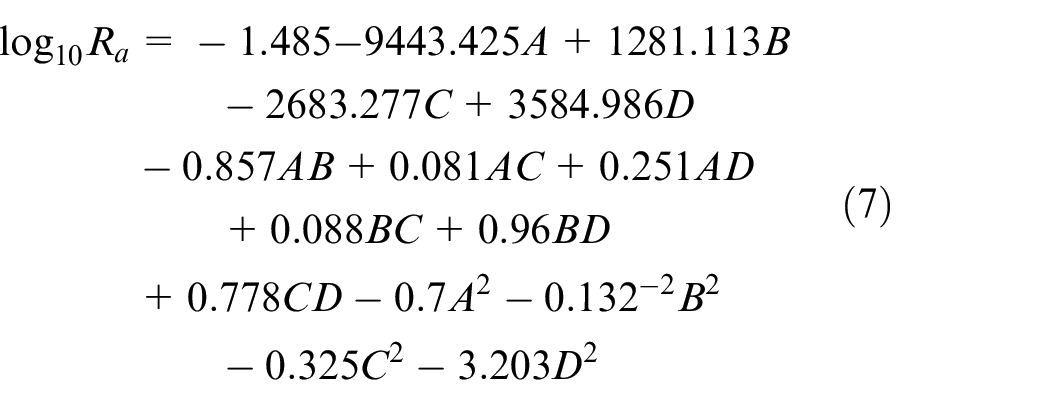
From the ANOVA table, the influence of the input parameter could be established if the “p value” is less than 0.05. It could be found that the surface speed, feed rate, the depth of cut, and Taylor factor are significant for Ra. Figure 3 represents the surface response plots of
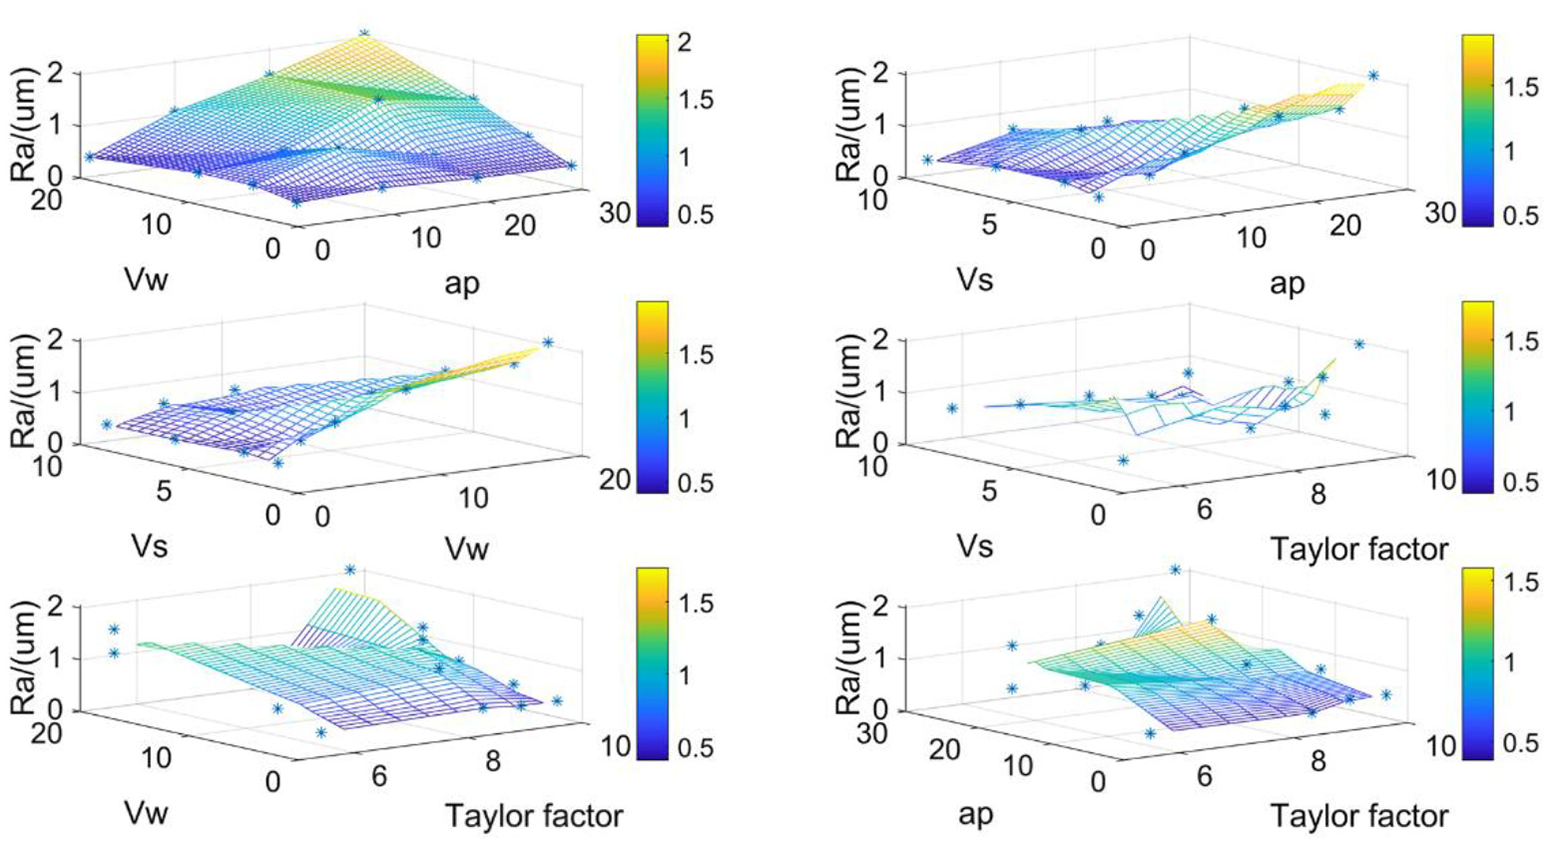
Surface response plot for Ra.
From the plot, it could be seen that the better surface roughness can be obtained by decreasing the feed rate and the depth of cut, while increasing the surface speed. In addition, the Taylor factor is significant to the variance of surface roughness.
According to the ANOVA table, a quadratic model is obtained as follows
For the multi-response optimization, each individual response is converted into their corresponding desirability
where
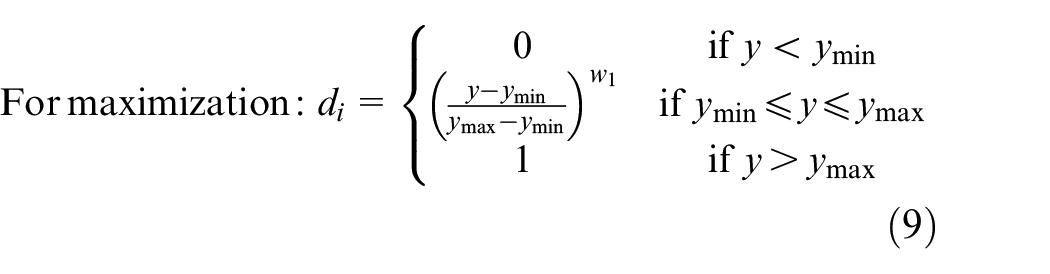
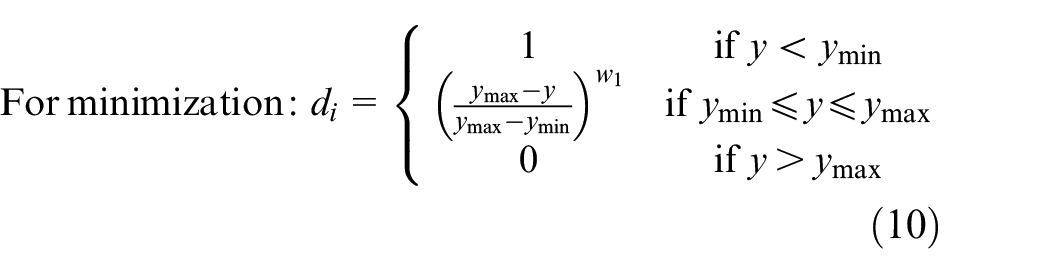
where
The DF and the relative importance of MRR and
The desirability function and the relative importance.
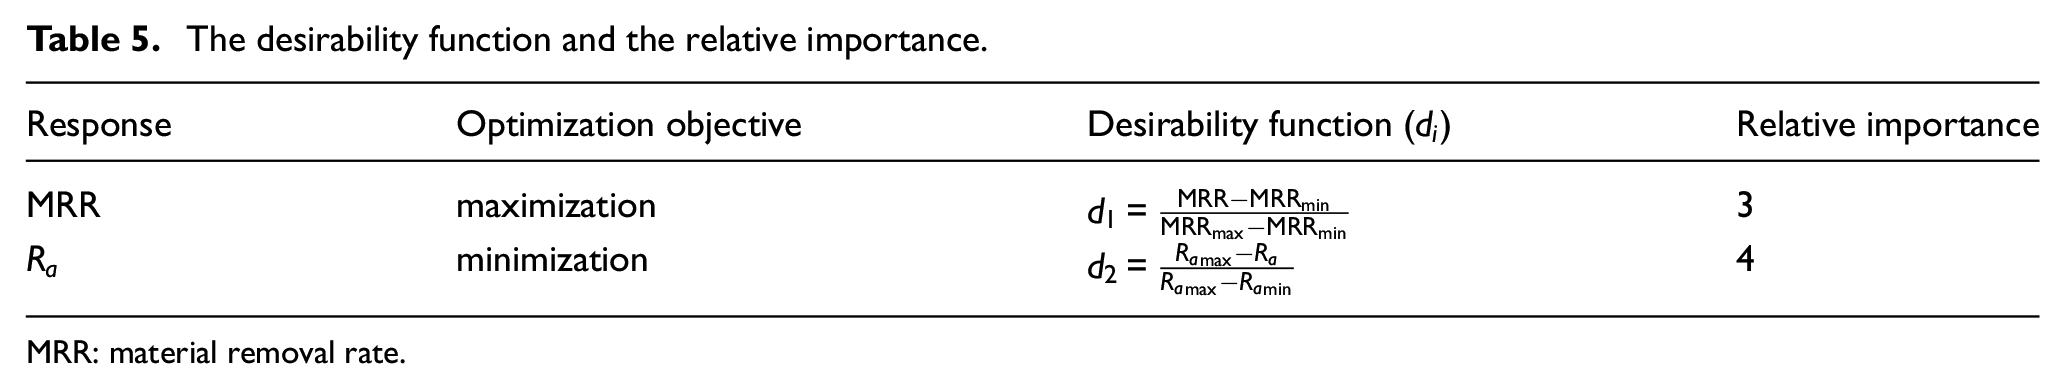
MRR: material removal rate.
Then, the global DF becomes

The objective is to maximize DF by choosing the optimal parameter combination. Based on the mathematical model for
Similarly, the mathematical models of
Comparison between the predicted optimal results of the two models.
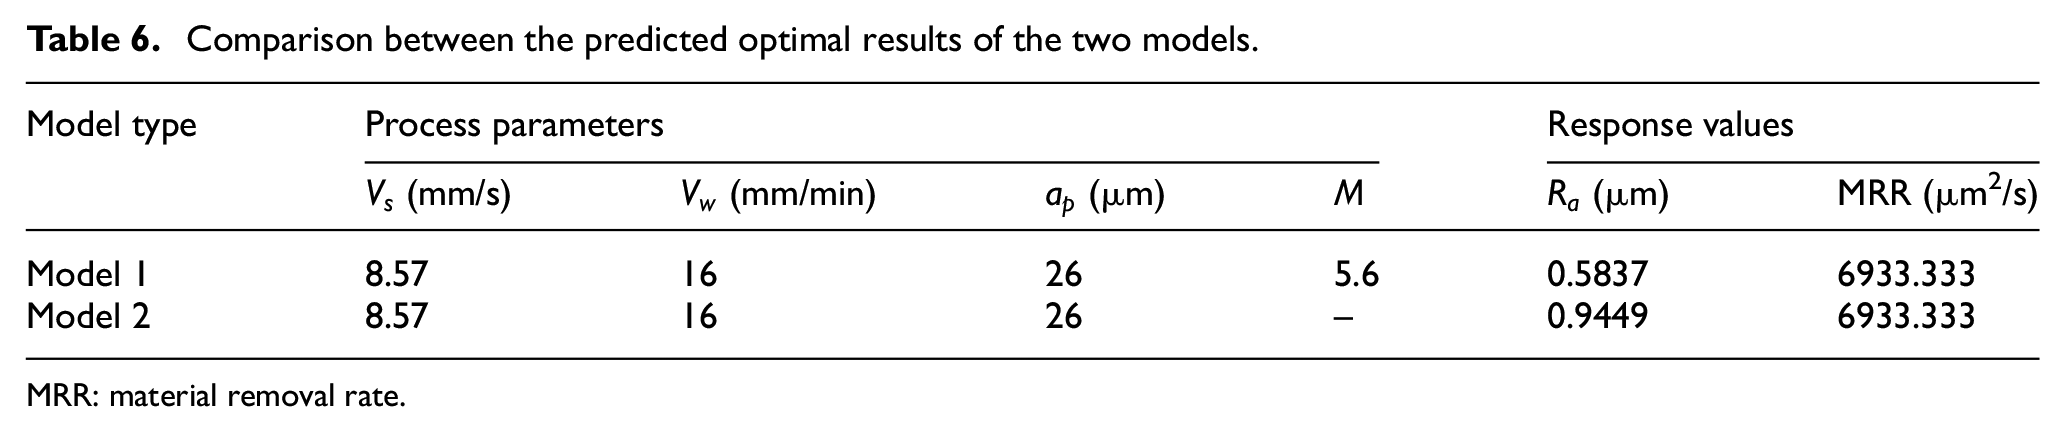
MRR: material removal rate.
The comparison results show that the optimal result of
The optical result from IMOPSO
Support vector machine (SVM) 16 is used to train the measured data in the multi-classification problems with small samples and nonlinear characteristics, and the classification effect of SVM will be more accurate when combined with IMOPSO.
For MRR and Ra, the trained result is compared to the measured data, which is shown in Figure 4.
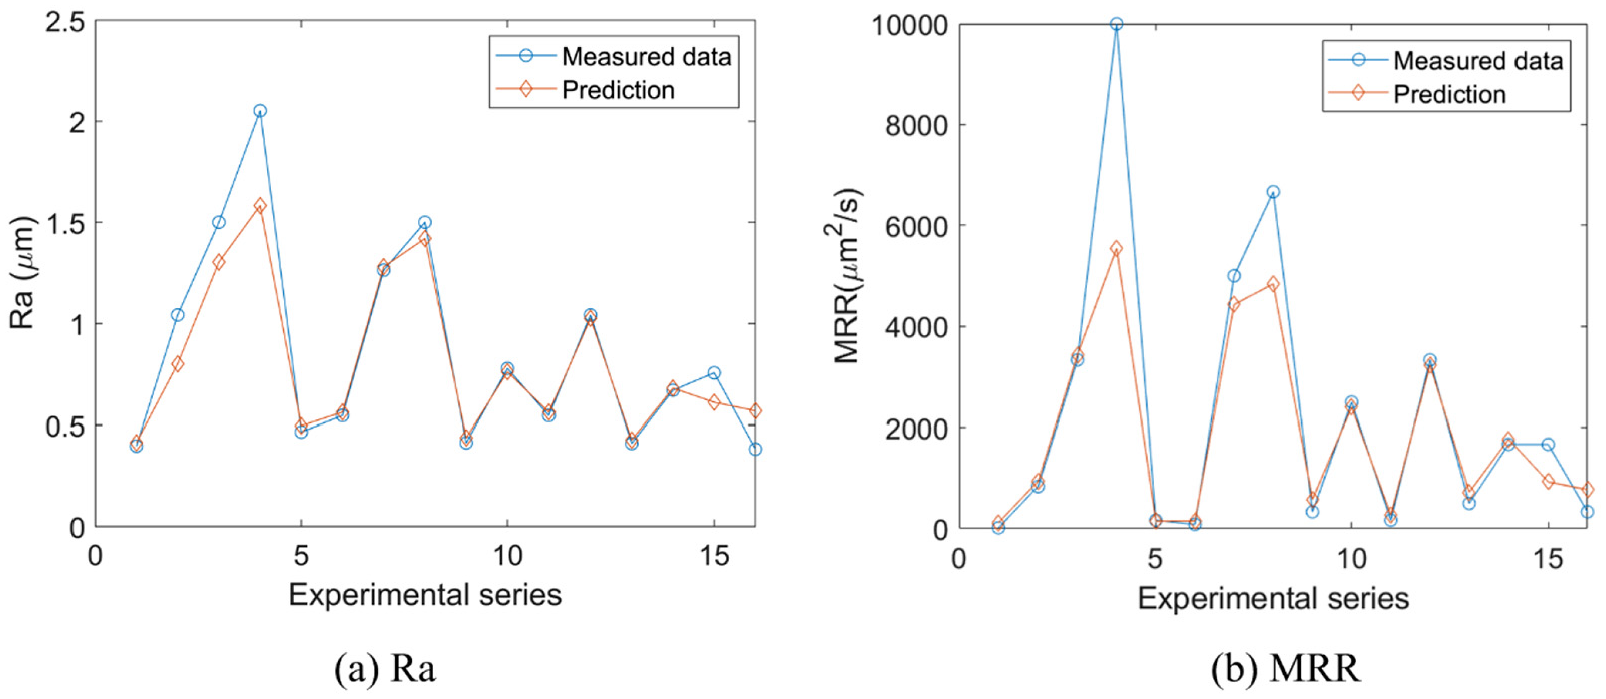
The comparison between the trained result and the measured data: (a) Ra and (b) MRR.
Then, the trained nets are used to predict the MRR and Ra produced in micro-grinding and conduct the inverse analysis. Finally, the optimal process parameters as well as the optimal MRR and Ra are obtained by IMOPSO, with
Similarly, the optimization model of
Comparison between the predicted optimal response values.
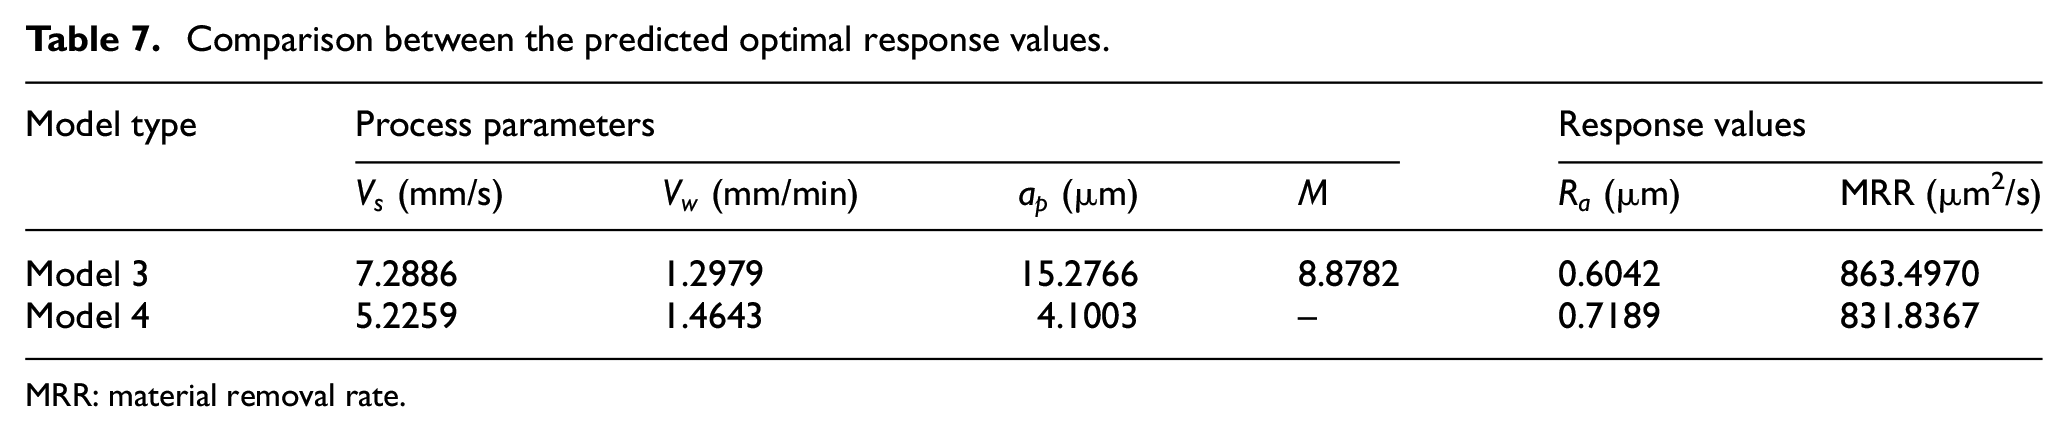
MRR: material removal rate.
The comparison results show that the optimal
Conclusion
To obtain the high quality of the machined surface and high efficiency in micro-grinding, the multi-response parametric optimizations are conducted in this investigation. The input parameters including surface speed, feed rate, the depth of cut, and Taylor factor are considered as the influence factors. The output responses are surface roughness (Ra) and MRR. The Taguchi-designed experiments are conducted with four factors and four levels. Based on the experiment data, two optimization approaches are utilized in this investigation.
To demonstrate the significance of Taylor factor to Ra and MRR, the optimization models with and without considering Taylor factor are developed through the RSM and IMOPSO approaches, respectively. By comparing the optimal results predicted from the models developed by RSM approach, it indicates that the optimal
In addition, the mathematical model developed by RSM inclines to reach maximum MRR and minimum surface roughness simultaneously. However, the model developed by IMOPSO finds optimal parameters that give lower MRR and lower surface roughness. For the lower
Footnotes
Acknowledgements
The authors gratefully acknowledge Georgia Tech Manufacturing Institute (GTMI) at the Georgia Institute of Technology for supporting the equipment.
Declaration of conflicting interests
The author(s) declared no potential conflicts of interest with respect to the research, authorship, and/or publication of this article.
Funding
The author(s) received no financial support for the research, authorship, and/or publication of this article.