
Abstract
Aiming at the dynamic and nonlinear characteristics of batch process, a multiway dynamic nonlinear global neighborhood preserving embedding algorithm is proposed. For the nonlinear batch process monitoring, kernel mapping is widely used to eliminate nonlinearity by projecting the data into high-dimensional space, but the nonlinear relationships between batch process variables are limited by many physical constraints, and the infinite-order mapping is inefficient and redundant. Compared with the basic kernel mapping method which provides an infinite-order nonlinear mapping, the proposed method considers the dynamic and nonlinear characteristics with many physical constraints and preserves the global and local structures concurrently. First, the time-lagged window is used to remove the auto-correlation in time series of process variables. Second, a nonlinear method named constructive polynomial mapping is used to avoid unnecessary redundancy and reduce computational complexity. Third, the global neighborhood preserving embedding method is used to extract structures fully after the dynamic and nonlinear characteristics are processed. Finally, the effects of the proposed algorithm are demonstrated by a mathematical model and the penicillin fermentation process.
Introduction
Batch process mainly exists in food, semiconductor, chemical production, and so on. It is vital to develop approaches that ensure product quality and production safety requirements. As one of the popular monitoring methods, data-driven statistic process monitoring (SPM) is widely used in batch process.1–3
Compared with the continuous process, the data of batch process have the structure of three-way data array. For the array, tensor and tucker models are used to deal with data directly.4–6 Some SPM methods unfold three-way array data to two-way array data, and then traditional SPM models of batch process are established,7–9 such as multiway principal component analysis (MPCA) 8 and multiway partial least squares (MPLS).10,11 The methods unfolding three-way array are along the batch direction or variable direction, but the conventional linear monitoring methods cannot describe the underlying nonlinearity of process variables. 12 For the nonlinear characteristic, the regular methods combine kernel mapping, which linearizes the relationship with high-dimensional projection, such as kernel principal component analysis (KPCA),13,14 kernel independent component analysis (KICA), 15 and kernel Fisher discriminant analysis (KFDA). 16 However, they only preserve global structure, and the neighborhood structure of data is neglected. The loss of neighborhood structure would inevitably influence the effect of process monitoring.
As one of the manifold learning algorithms, neighborhood preserving embedding (NPE) can preserve the local structure of data and has been widely used in processing monitoring.17–21 As a nonlinear extension of NPE, 22 kernel NPE tries to preserve local topology relationship. But kernel NPE only extracts the neighborhood structure and ignores the global structure.23,24 Therefore, to reveal the inherent properties of process data effectively, Tong and Yan 25 proposed a method that considered the global–local structures. Hui and Zhao 26 divided the batch process variables into related and independent variables and then used the corresponding method to realize process monitoring. Zhao and Tao 27 proposed a tensor global–local model in batch process monitoring. Although the global and local structures were preserved in dimension reduction, in real industrial process, the nonlinear relationships were often limited by physical constraints, resulting in kernel mapping being exorbitant.28–30 The type of kernel function determines the dimensions of feature space. The radial basis kernel is widely used to solve nonlinear relationships between variables by providing an infinite-order mapping. 31 But the infinite-order mapping would lead to a higher computational complexity; especially for batch process, it needs to unfold the three-array data into two-array data. After unfolding, the row would be larger than before, so if the kernel mapping is used in batch process, the computational complexity is very high and may be beyond the computer memory.
In the present work, multiway dynamic nonlinear global neighborhood preserving embedding (MDNGNPE) method is proposed for dynamic nonlinear batch process monitoring. Because the data at sampling time t are related to the data before and after sampling time t, the time-lagged windows are used to remove the auto-correlation in time series of process variables. Then, for the nonlinear characteristic of process data, constructive polynomial mapping (CPM) is used for achieving nonlinear mapping and for considering the physical constraints. The mapped data samples are extracted to the global and local data structures using global neighborhood preserving embedding (GNPE). The MDNGNPE method is applied in a numerical process and the penicillin fermentation process to verify the monitoring effects.
NPE
The NPE preserves reconstruction neighbor relationships in projected low-dimensional subspace. For training dataset X, NPE can extract a linear projection matrix A to project the dataset X into low-dimensional subspace. The NPE procedures can expressed as follows:
Construct the adjacency graph: the neighbors are defined by k-nearest neighbors (knn). If
Calculate the weight matrix W: the weight of node q to node g can be represented by
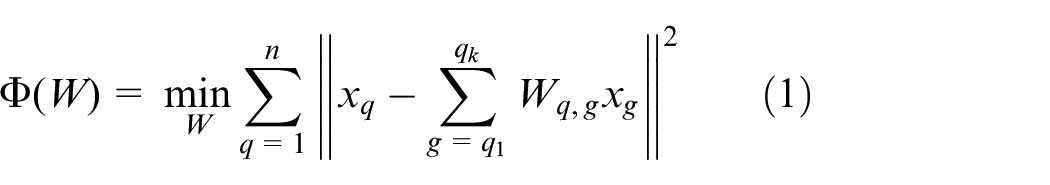
where
Compute the projection: the projection matrix
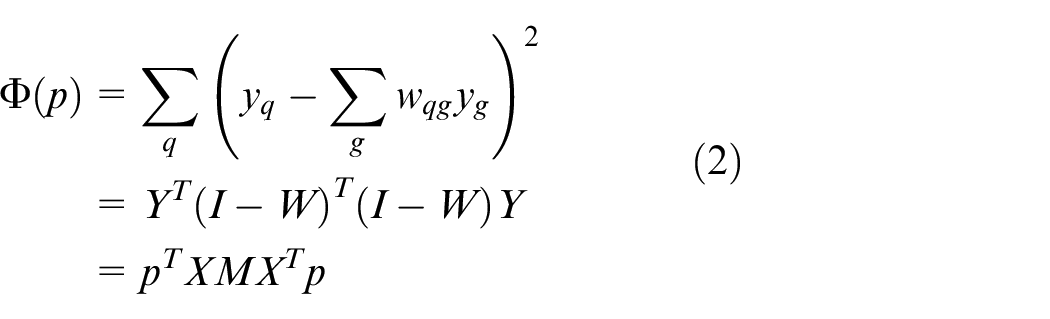
where

MDNGNPE method
Three-way array data unfolding
Batch process consists of batches, variables, and sampling points. Therefore, the data are expressed as
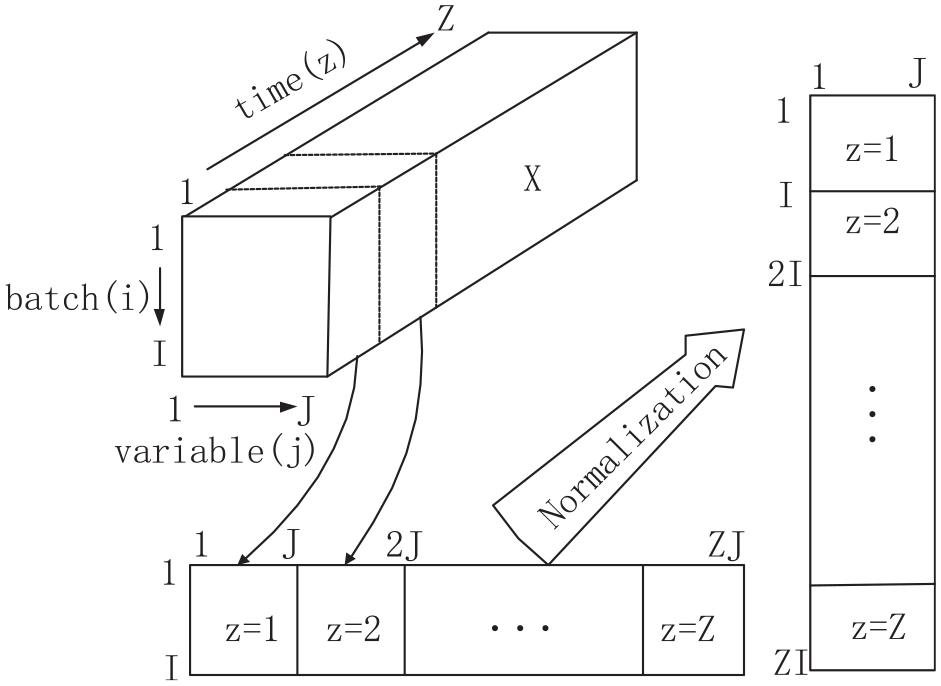
Hybrid unfolding of batch process data.
Dynamic nonlinear global neighborhood preserving embedding method
The auto-correlation in time series of process variables widely exists in real industrial process. To remove auto-correlation, an efficient method is to utilize time-lagged data matrix. After batch process data are unfolded by hybrid approach, each variable is augmented on the original time series. The time-lagged data matrix is as follows
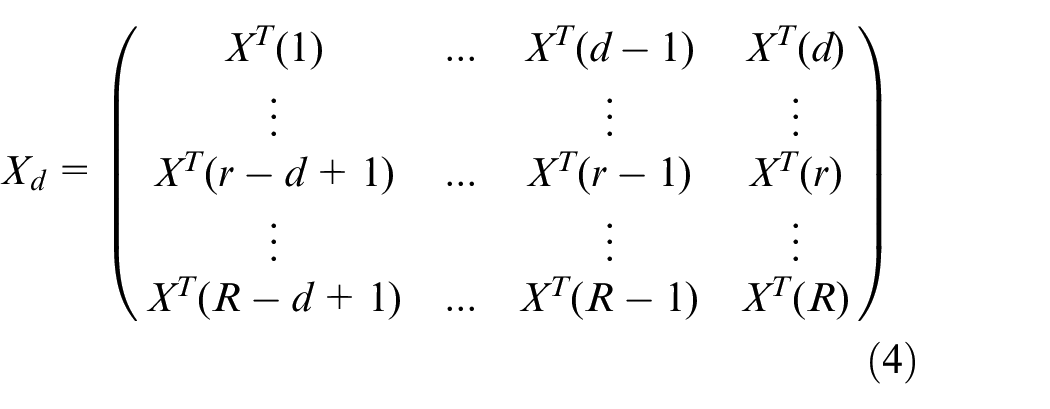
where d is the window length, R is the total number of samples, and
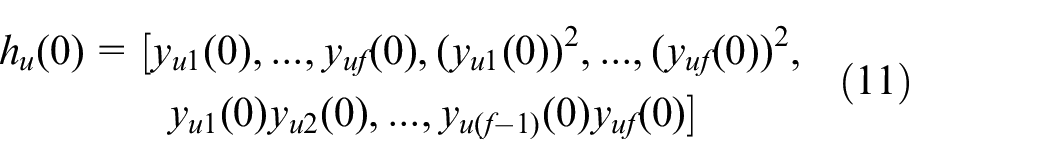
CPM is introduced to employ nonlinear mapping.
28
For training data
For the NPE algorithm, the local features can be extracted by equation (5) after seeking the nearest k neighbor points
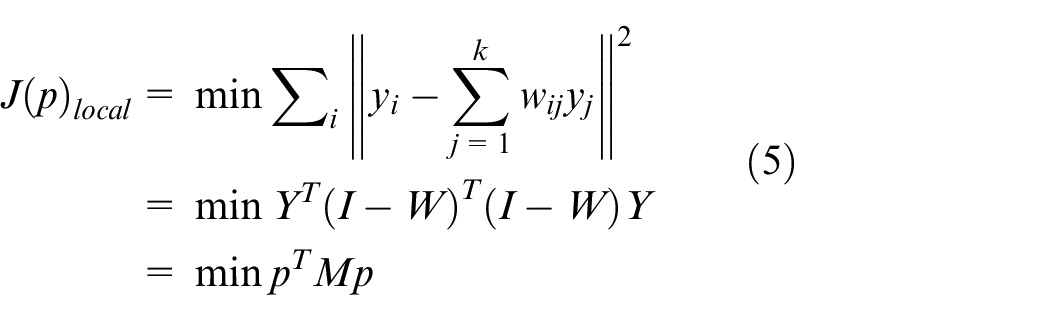
where
The global structure is preserved by seeking the maximum direction of variance, as shown in equation (6)
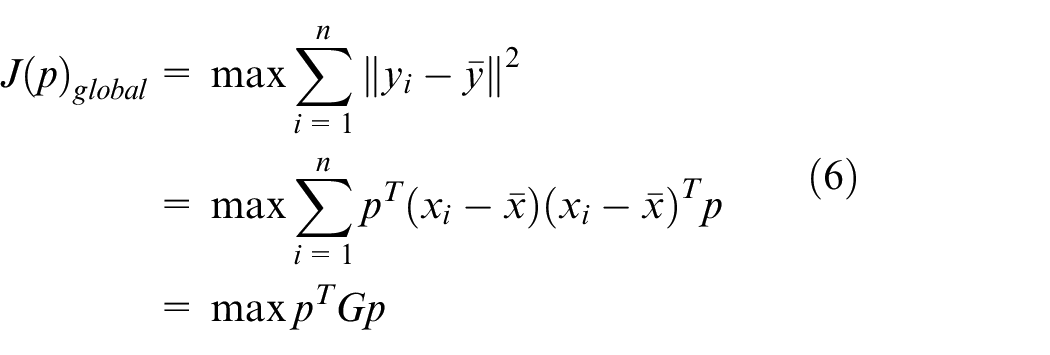
where
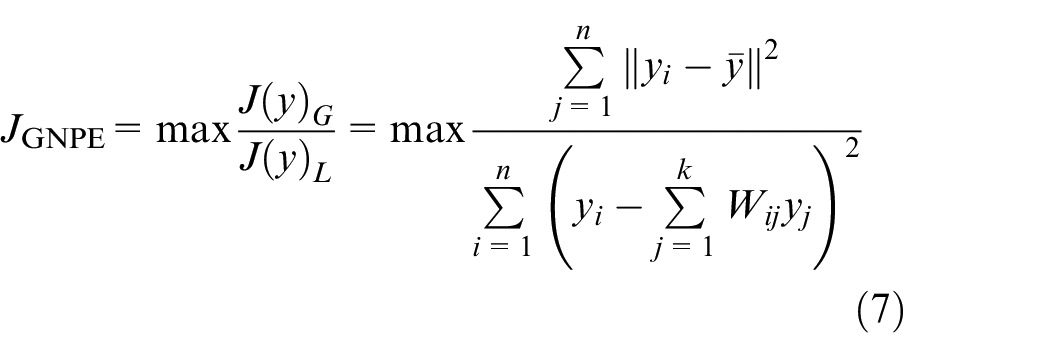
GNPE preserves both the global and local structures, and the optimal objective function is shown in equation (7)
Equation (7) can be converted to equation (8) by the projection relationship

Equation (8) can be transformed to solve the generalized eigenvalue problem using equation (9)

where the projection matrix P can be achieved by the eigenvectors corresponding to the largest g eigenvalues.
The GNPE algorithm which maps time-lagged data matrix

where
Then,
where
Given

where
Fault detection based on MDNGNPE
Fault detection
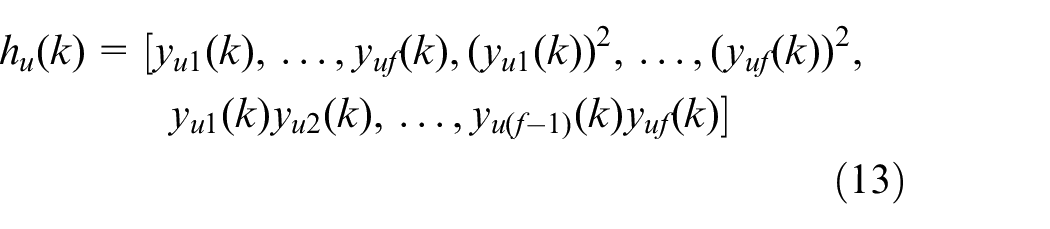
After unfolding three-dimensional data matrix
For the order of nonlinear mapping, K is specified by the user. After each iteration, squared prediction error (SPE) and Hotelling’s T2 statistics can be calculated by equation (14)
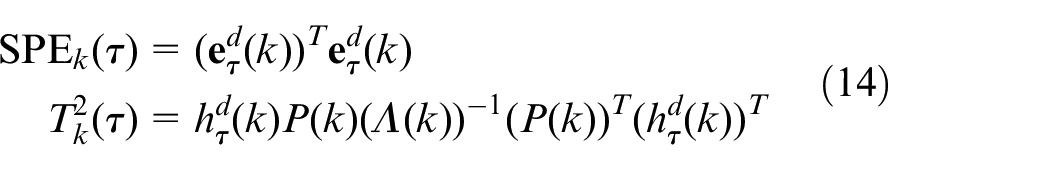
where
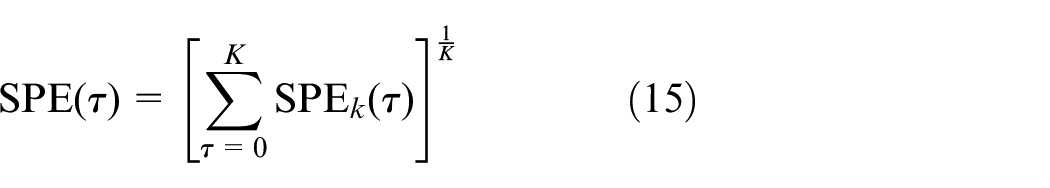
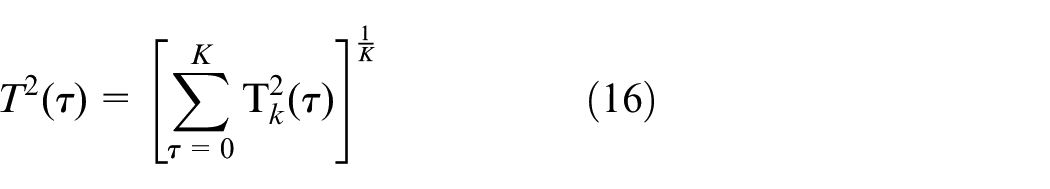
The monitoring statistics of MDNGNPE are given as follows
The SPE and T2 control limits can be determined by kernel density estimation (KDE). 33 Here, the window length is chosen as 2 to remove the auto-correlation of process variables.28,34
Monitoring steps
Offline monitoring
Step 1. Unfold three-way array data
Step 2. Construct the time-lagged data matrix using equation (4);
Step 3. CPM is introduced to employ nonlinear mapping;
Step4. GNPE is used to reduce dimensions after each iteration of CPM nonlinear mapping, and then the MDNGNPE method is obtained;
Step 5. Calculate SPE and T2 statistics based on MDNGNPE;
Step 6. Compute control limits of SPE and T2 using KDE.
Online monitoring
Step 1. Normalize the new batch data;
Step 2. Construct the time-lagged data matrix for the new samples;
Step 3. Obtain the nonlinear mapping of new time-lagged data matrix and then project into dimensional reduced subspace using GNPE;
Step 4. Calculate SPE and T2 statistics for new samples;
Step 5. Judge whether the SPE and T2 statistics exceed the control limits.
The monitoring flowchart based on the MDNGNPE method is shown in Figure 2.
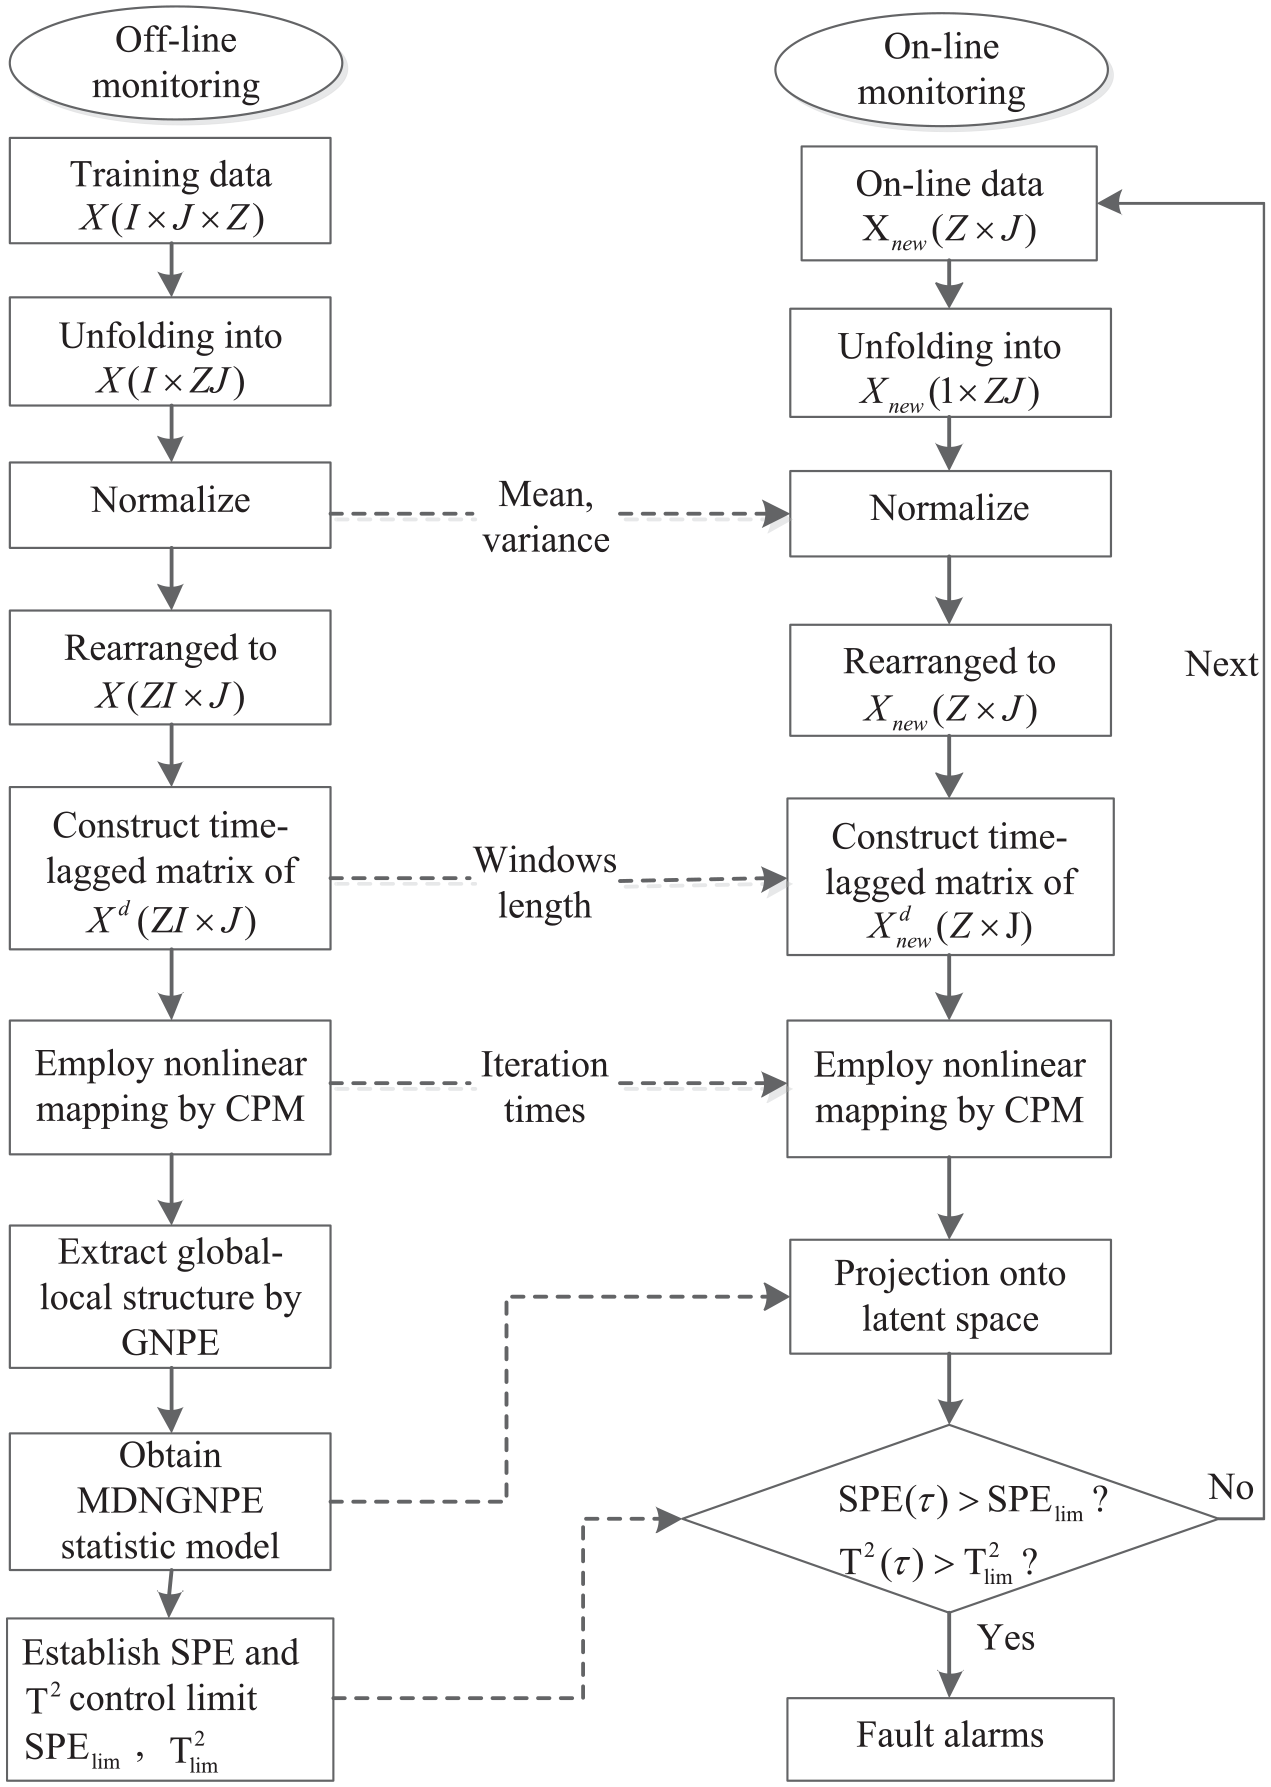
The monitoring steps of MDNGNPE.
Simulation verification and analysis
In order to verify the performance of MDNGNPE, two cases are selected for verification. The first one is a numerical process with dynamic nonlinear characteristic; the second one is a well-known penicillin fermentation process. In these two cases, the monitoring effects of MPCA, multiway neighborhood preserving embedding (MNPE), multiway global neighborhood preserving embedding (MGNPE) and MDNGNPE are compared and analyzed.
Numerical process
A nonlinear dynamic numerical system is as follows7,35
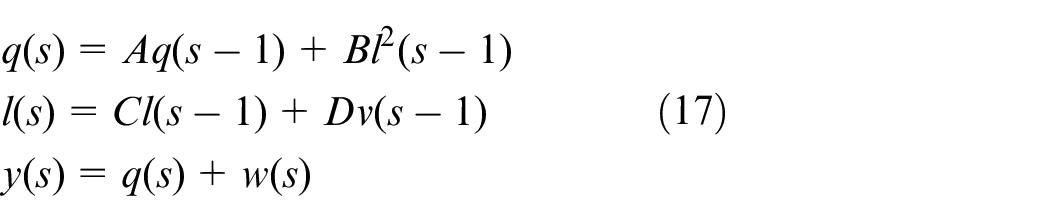
where
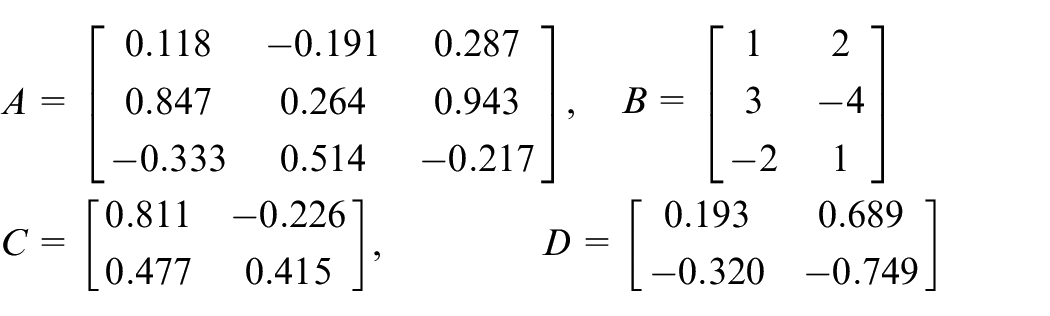
The process monitoring variables are
Furthermore, an abnormal case is added to test the effect of MDNGNPE: variable
MPCA, MNPE, MGNPE, and MDNGNPE are applied to monitor the numerical system. Monitoring charts are shown in Figures 3–6, respectively. Figure 3 shows the MPCA monitoring results, and the SPE and T2 statistics alarm the fault at the 251th and 223th sample, but the fault is added at the 151th sampling point, due to which there is a large delay in fault detection. Figure 4 shows the SPE and T2 statistics of MNPE; we can see that the fault is detected at the 241th and 240th sample, respectively, which causes a large delay in fault detection. Figure 5 shows the monitoring results of MGNPE; the SPE and T2 statistics alarm the fault at the 241th and 232th sample, respectively, due to which there is a large delay. By contrast, the monitoring results of MDNGNPE are shown in Figure 6; the SPE statistic detects the fault at the 215th sample, and the T2 statistic detects the fault at the 205th sample. It is obvious that MDNGNPE responds more quickly and detects the fault earlier than the other three methods. It shows that MDNGNPE has better monitoring performance than MPCA, MNPE, and MGNPE. This is due to the fact that the MDNGNPE method can fully extract the nonlinear dynamic characteristic of the process data.
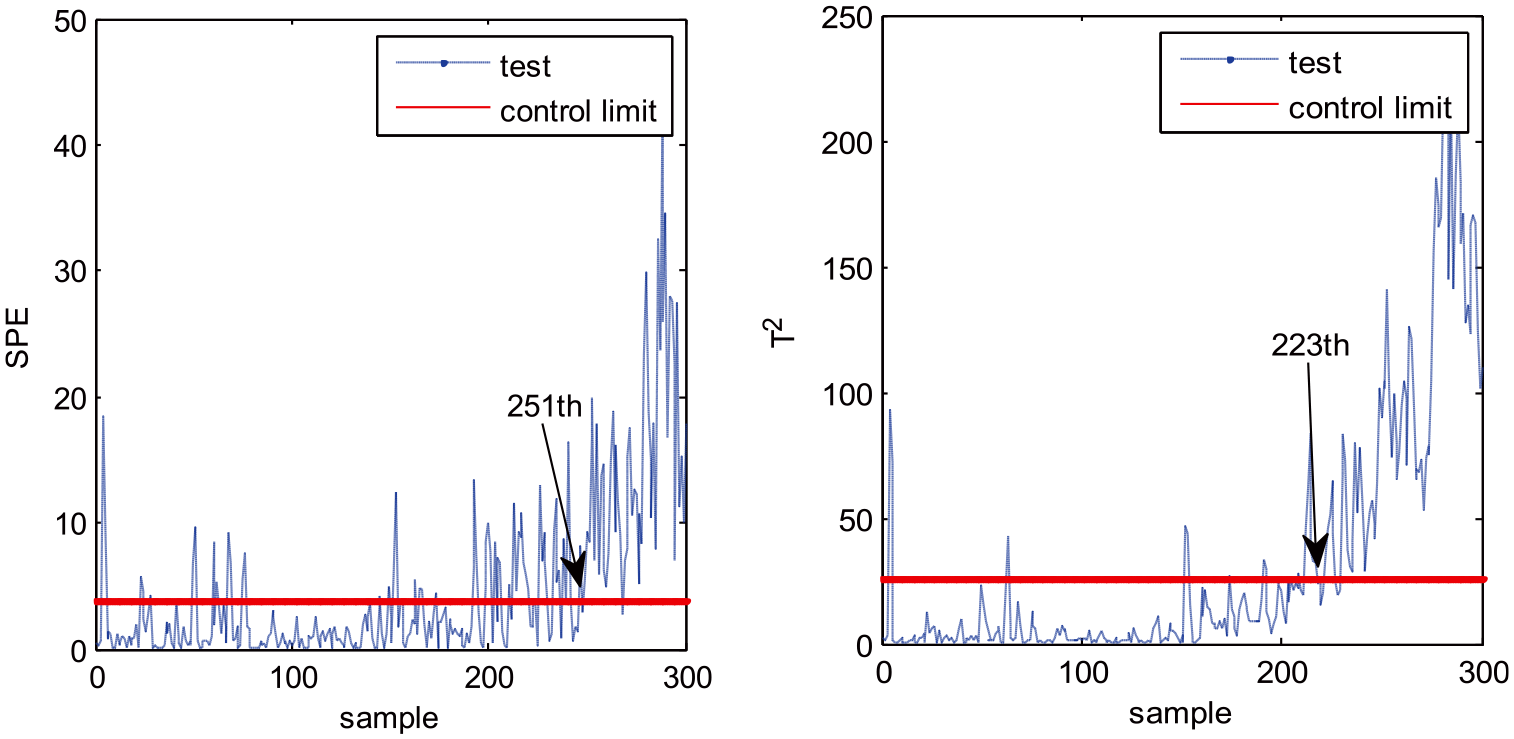
Fault detection results of MPCA.
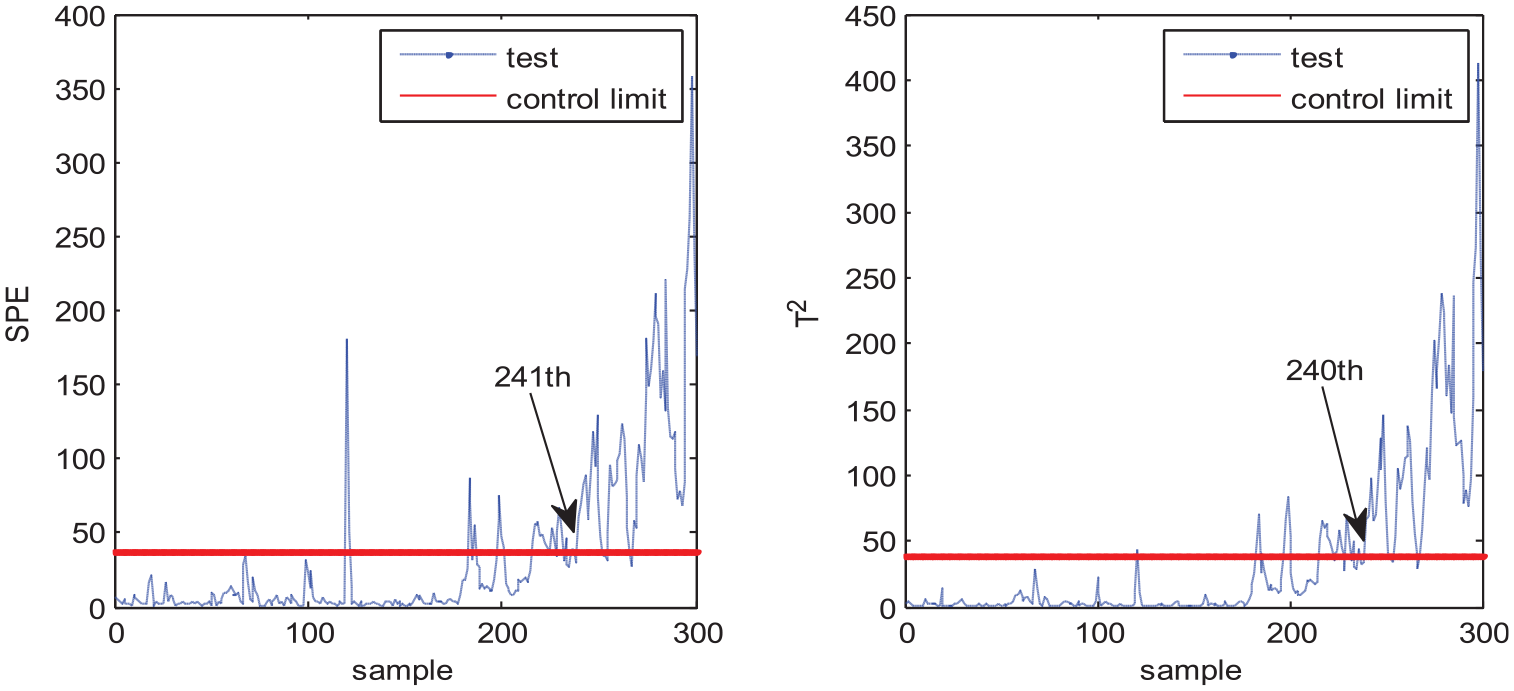
Fault detection results of MNPE.
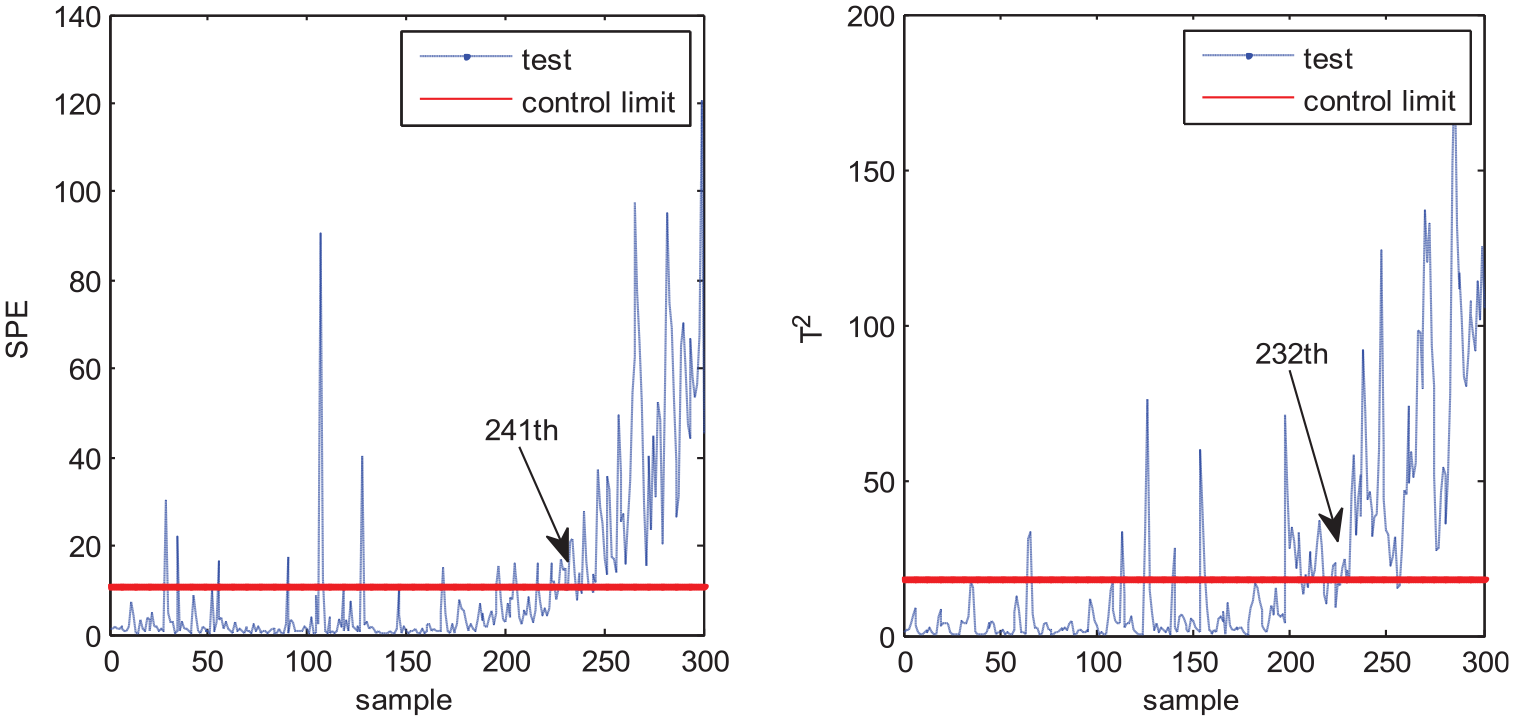
Fault detection results of MGNPE.
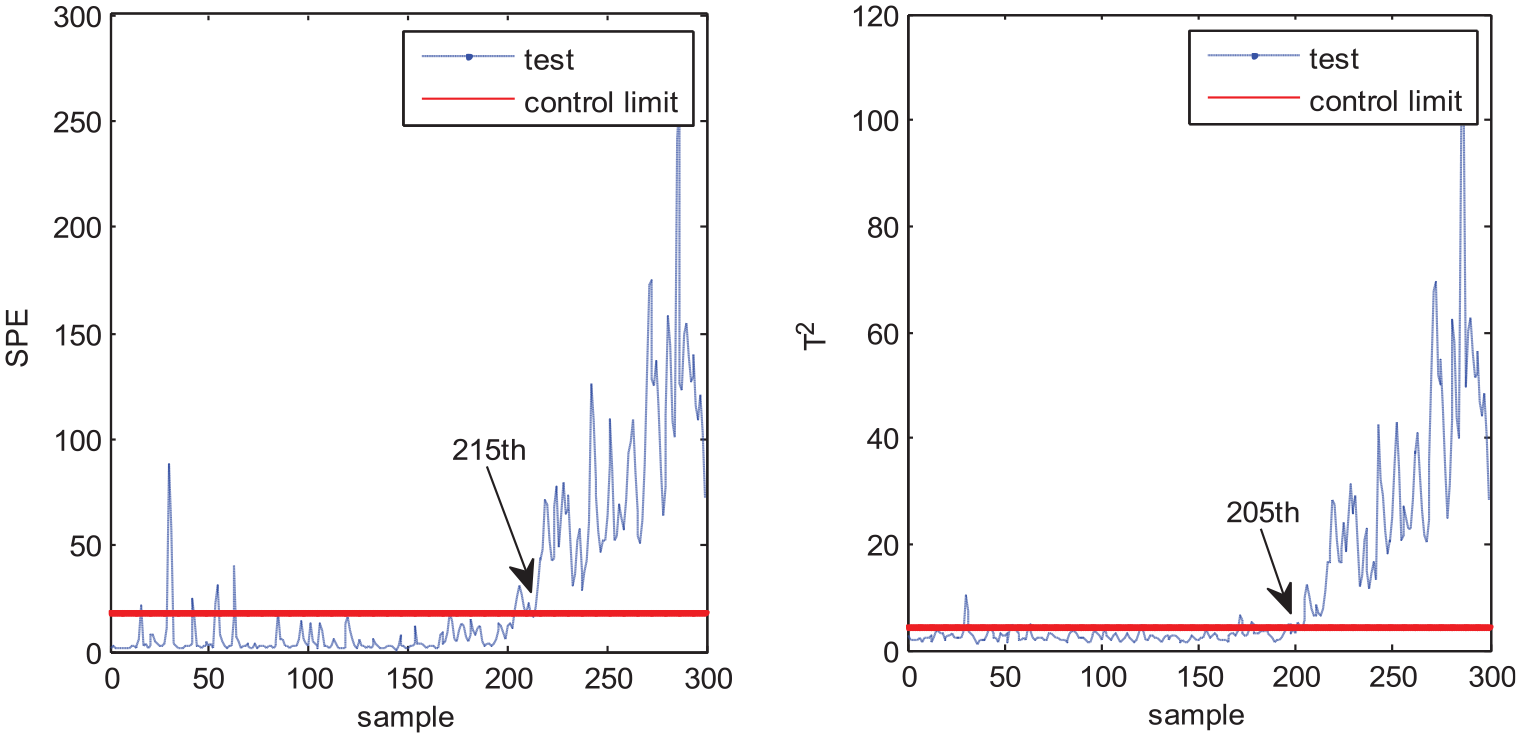
Fault detection results of MDNGNPE.
Penicillin fermentation process
The benchmark simulation of penicillin production is a typical dynamic, nonlinear batch process. In this paper, batch process data were generated by the standard simulation platform Pensim 2.0 in the penicillin fermentation process. 36 Pensim2.0 developed by Illinois Institute of Technology to study the typical batch process more conveniently can produce penicillin fermentation process data under different initial conditions and different working conditions for analysis and research. The production process of penicillin fermentation is shown in Figure 7.
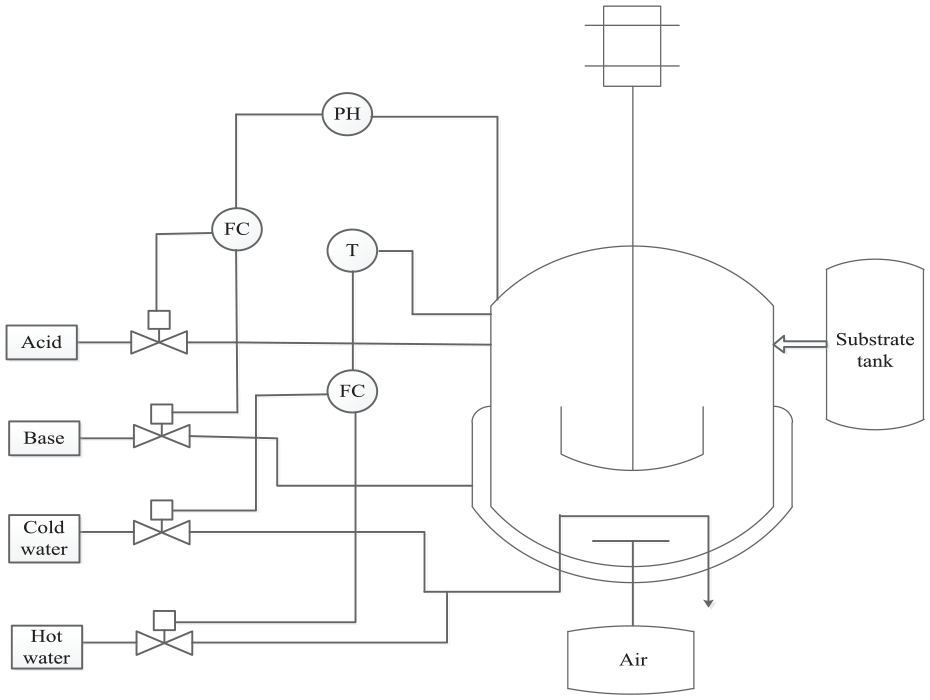
Penicillin fermentation process.
The fermentation process lasts for a total of 400 h, and the sampling interval is 1 h. A total of 36 normal batches are obtained. The 10 measurement variables which can represent the main characteristics of process are chosen, so the normal data X (36 × 10 × 400) can be obtained.
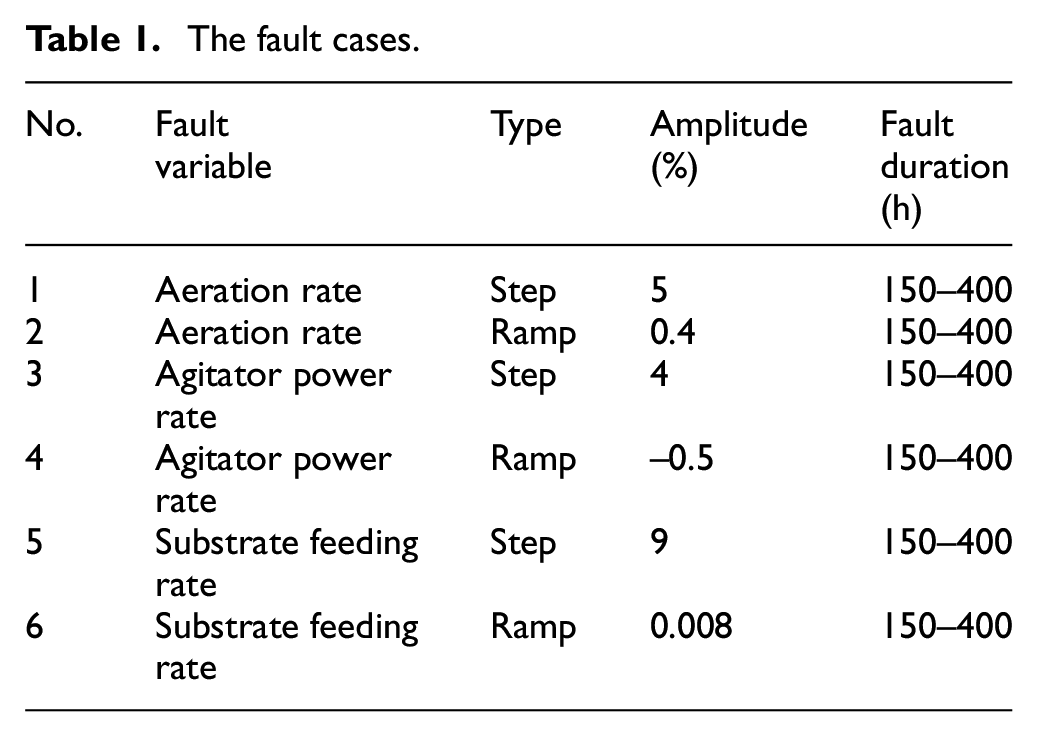
The fault detection capability is evaluated using six fault cases that involve different fault types and magnitudes. The details of fault cases are shown in Table 1. Tables 2 and 3 show the monitoring results. We can see from the tables that step fault 1 and step fault 3 can be detected by four methods. Although step fault 5 cannot be detected by these four methods immediately, the performance by the MDNGNPE method is better. There is a delay in fault detection because of the slow spread of the change in glucose substrate rate through the related variables. In contrast to step faults, the ramp faults are hard to detect because of slow changes in its variables. For ramp fault 2, ramp fault 4, and ramp fault 6, the MDNGNPE monitoring method first detects the fault and synthesizes fault detection rate (FDR) and false alarm rate (FAR), which can accurately distinguish normal and abnormal states.
The fault cases.
Fault detection rate.
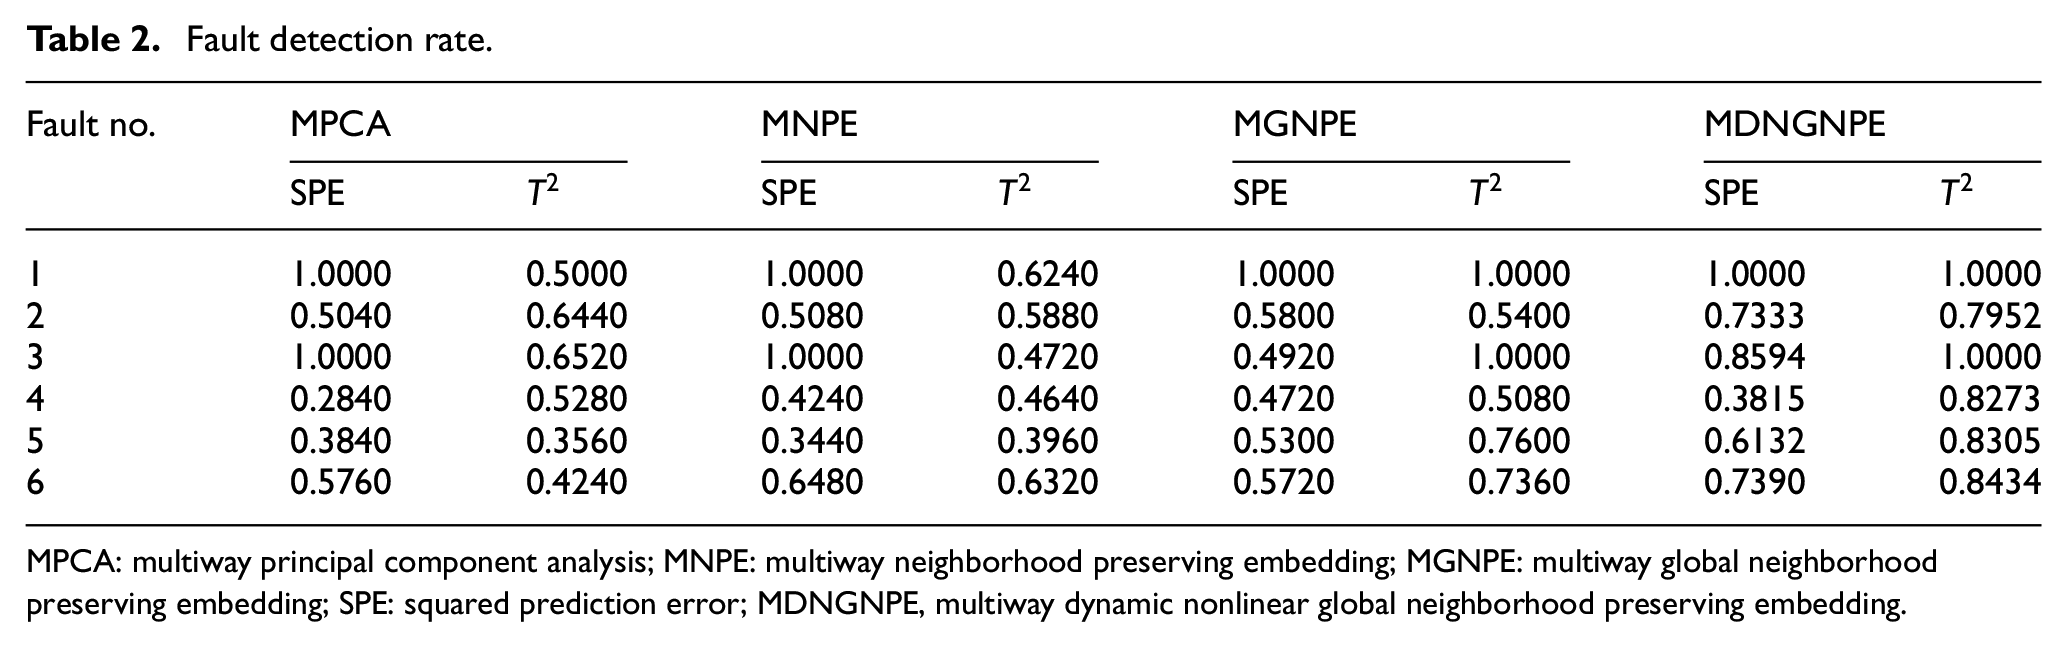
MPCA: multiway principal component analysis; MNPE: multiway neighborhood preserving embedding; MGNPE: multiway global neighborhood preserving embedding; SPE: squared prediction error; MDNGNPE, multiway dynamic nonlinear global neighborhood preserving embedding.
False alarm rate.
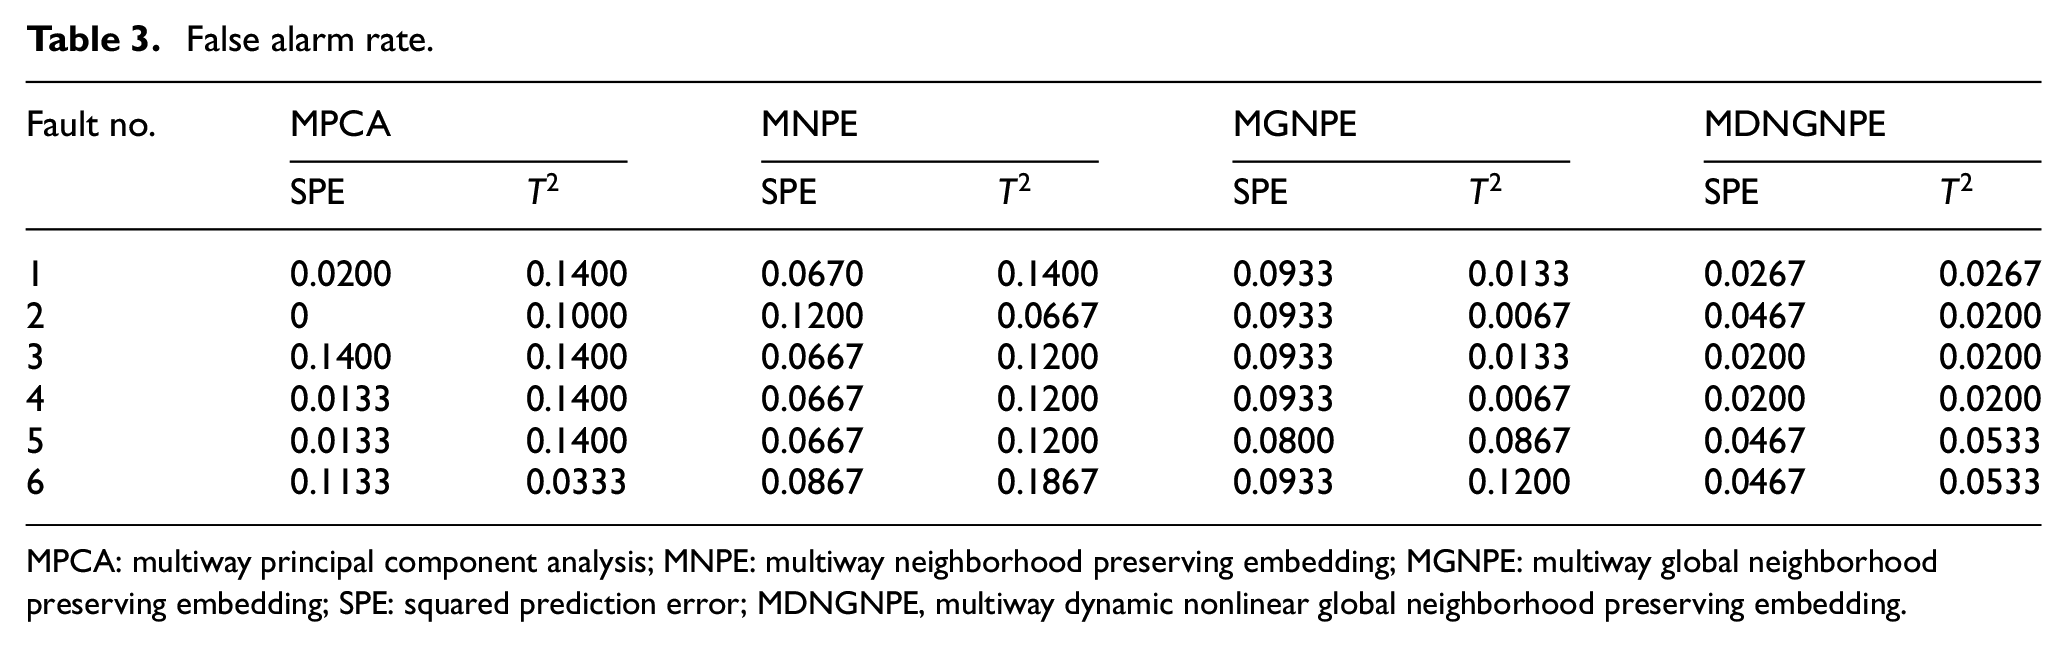
MPCA: multiway principal component analysis; MNPE: multiway neighborhood preserving embedding; MGNPE: multiway global neighborhood preserving embedding; SPE: squared prediction error; MDNGNPE, multiway dynamic nonlinear global neighborhood preserving embedding.
Fault 2 is the ramp fault of aeration rate. Figures 8–11 show the monitoring results of MPCA, MNPE, MGNPE, and MDNGNPE methods under fault 2, respectively. Figure 8 shows the fault detection result of MPCA; the SPE and T2 alarm the fault at the 300th and 308th sample, and it cannot detect the fault on time when fault 2 occurs; the false alarm occurs at the first 40 samples in T2 statistics. Figure 9 shows the SPE and T2 statistics of MNPE; the fault is detected at the 329th and 302th sample, due to which there is a large delay in fault detection; it also generates false alarm at first 40 sampling data in SPE and T2 statistics. Figure 10 shows the monitoring results of MGNPE; SPE detects the fault at the 307th sample and T2 detects the fault at the 259th sample; it also generates false alarm before 45 sampling point data of SPE. By contrast, the SPE and T2 statistics of MDNGNPE in Figure 11 alarm the fault at the 182th and 198th sample, which gives early fault detection results and has higher FDR. Generally, MDNGNPE has better monitoring performance than MPCA, MNPE, and MGNPE.
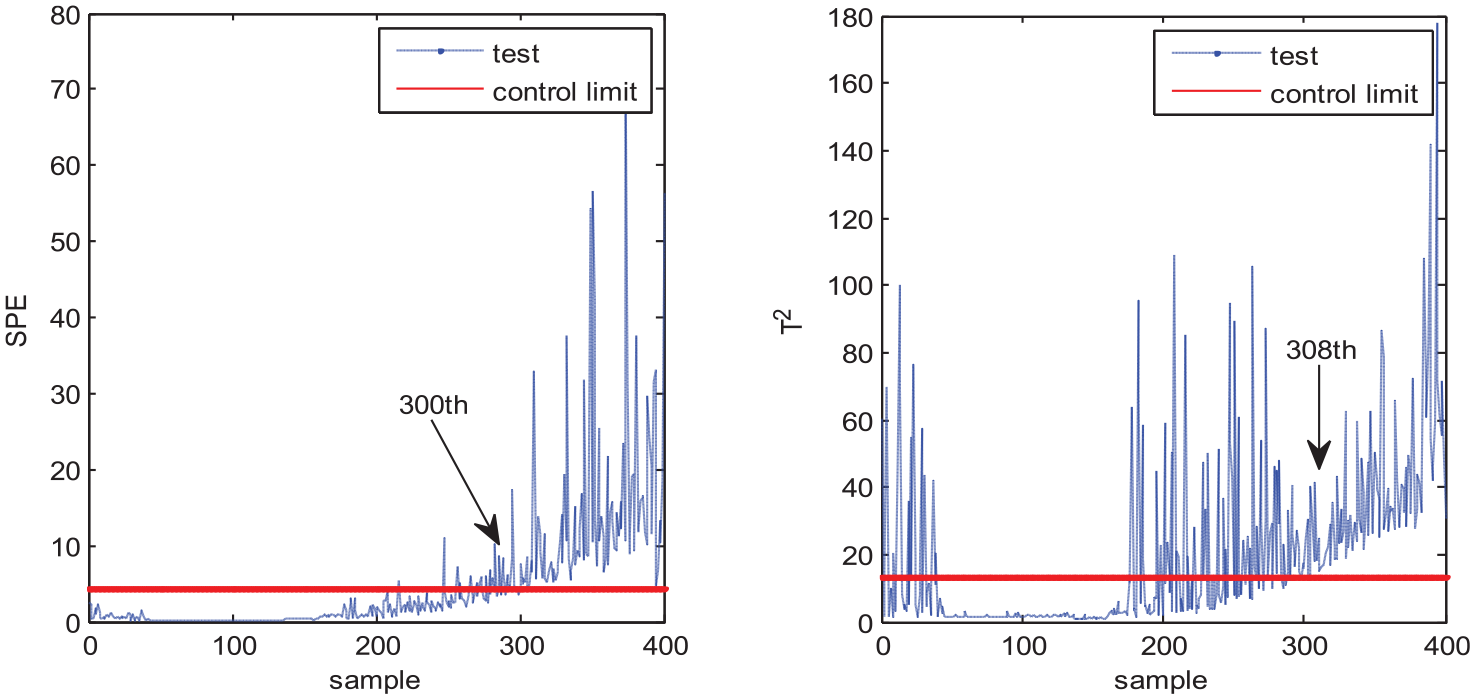
Fault detection results of MPCA under fault 2.
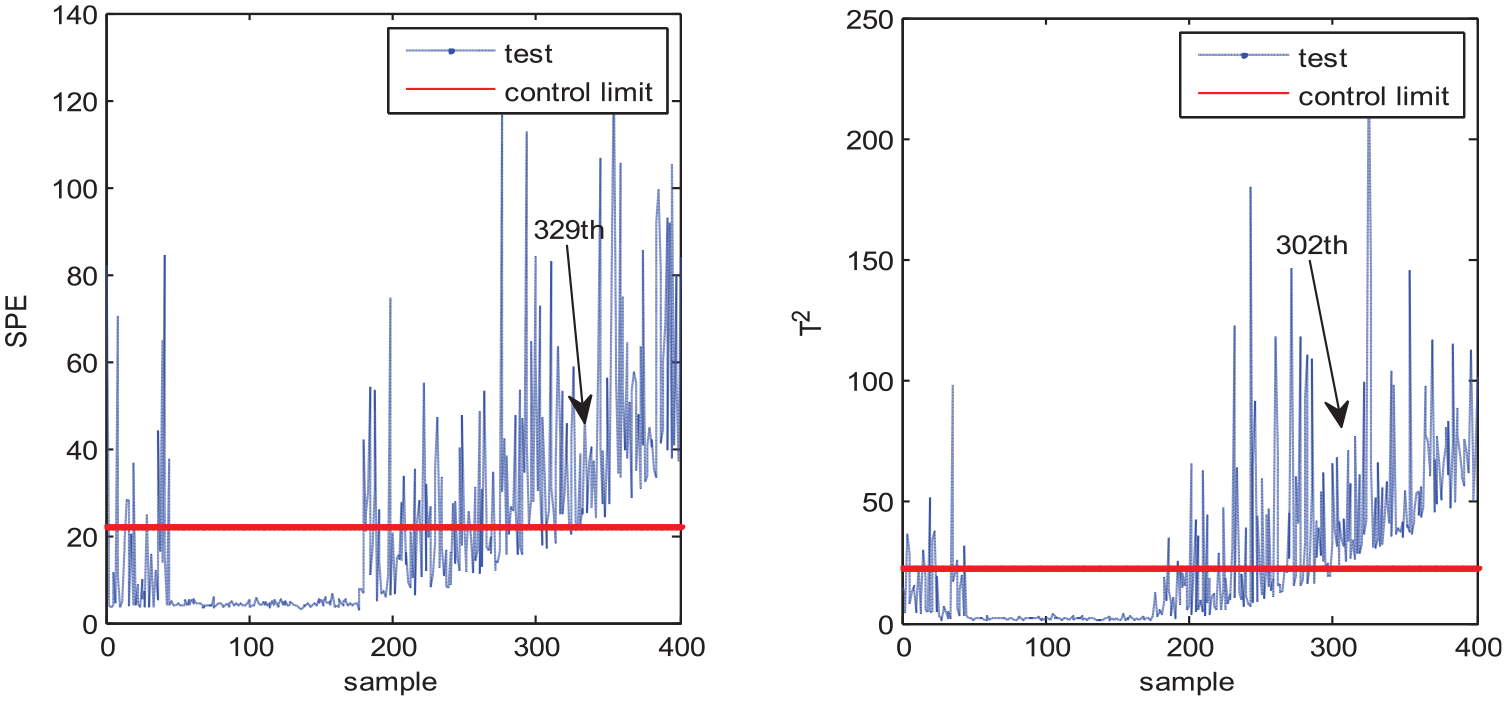
Fault detection results of MNPE under fault 2.
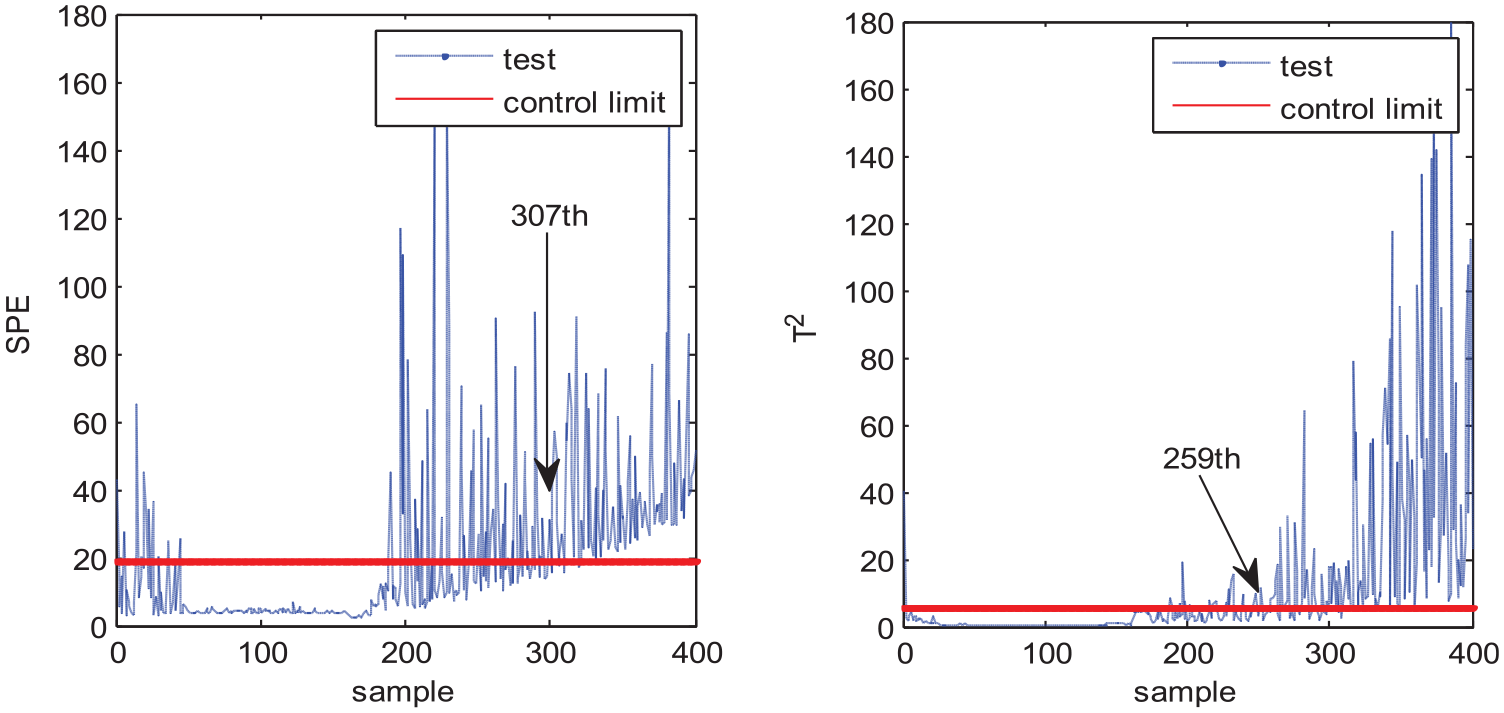
Fault detection results of MGNPE under fault 2.
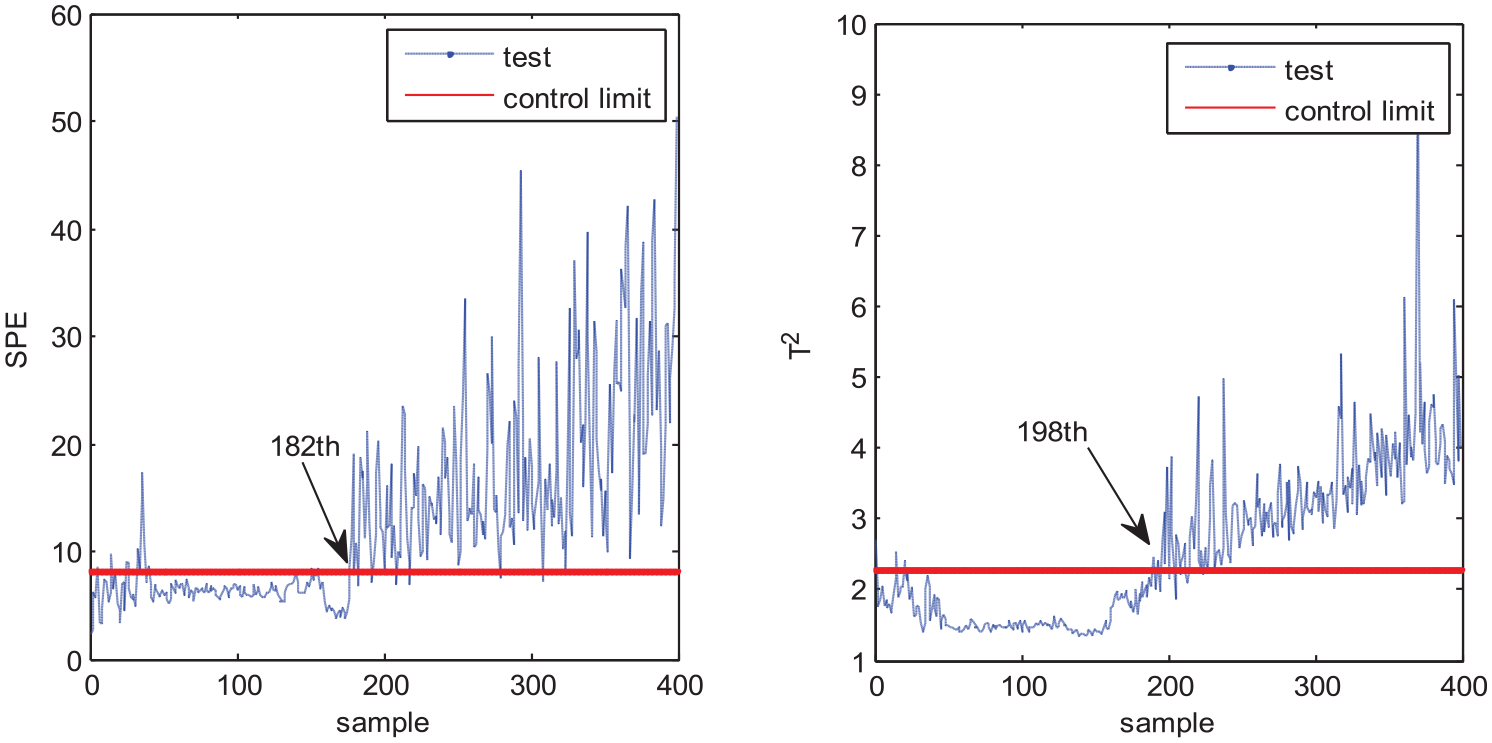
Fault detection results of MDNGNPE under fault 2.
The second test case is fault 6 in which the fault occurs at the 150th sample point and continues to the end. MPCA, MNPE, MGNPE, and MDNGNPE monitoring charts of fault 6 are shown in Figures 12–15, respectively. Figure 12 shows the fault detection result of MPCA; the SPE alarms the fault at the 306th sample and T2 alarms at the 355th sample; it cannot detect the fault on time, and the false alarm generates at first 40 samples in SPE. We can see from Figure 13 that the SPE and T2 of MNPE alarm the fault at the 264th and 300th sample; it also generates false alarm at first 40 samples in SPE and T2. Figure 14 shows the monitoring chart of MGNPE; the SPE and T2 alarm the fault at the 281th and 234th sample, due to which there is a large delay in fault alarm, and the false alarm occurs at first 40 sample data in SPE and T2. By contrast, the SPE and T2 of MDNGNPE in Figure 15 detect the fault earlier than MPCA, MNPE, and MGNPE, which alert the fault at the 241th and 213th sample, respectively. MDNGNPE outperforms MPCA, MNPE and MGNPE in terms of fault detection performance.
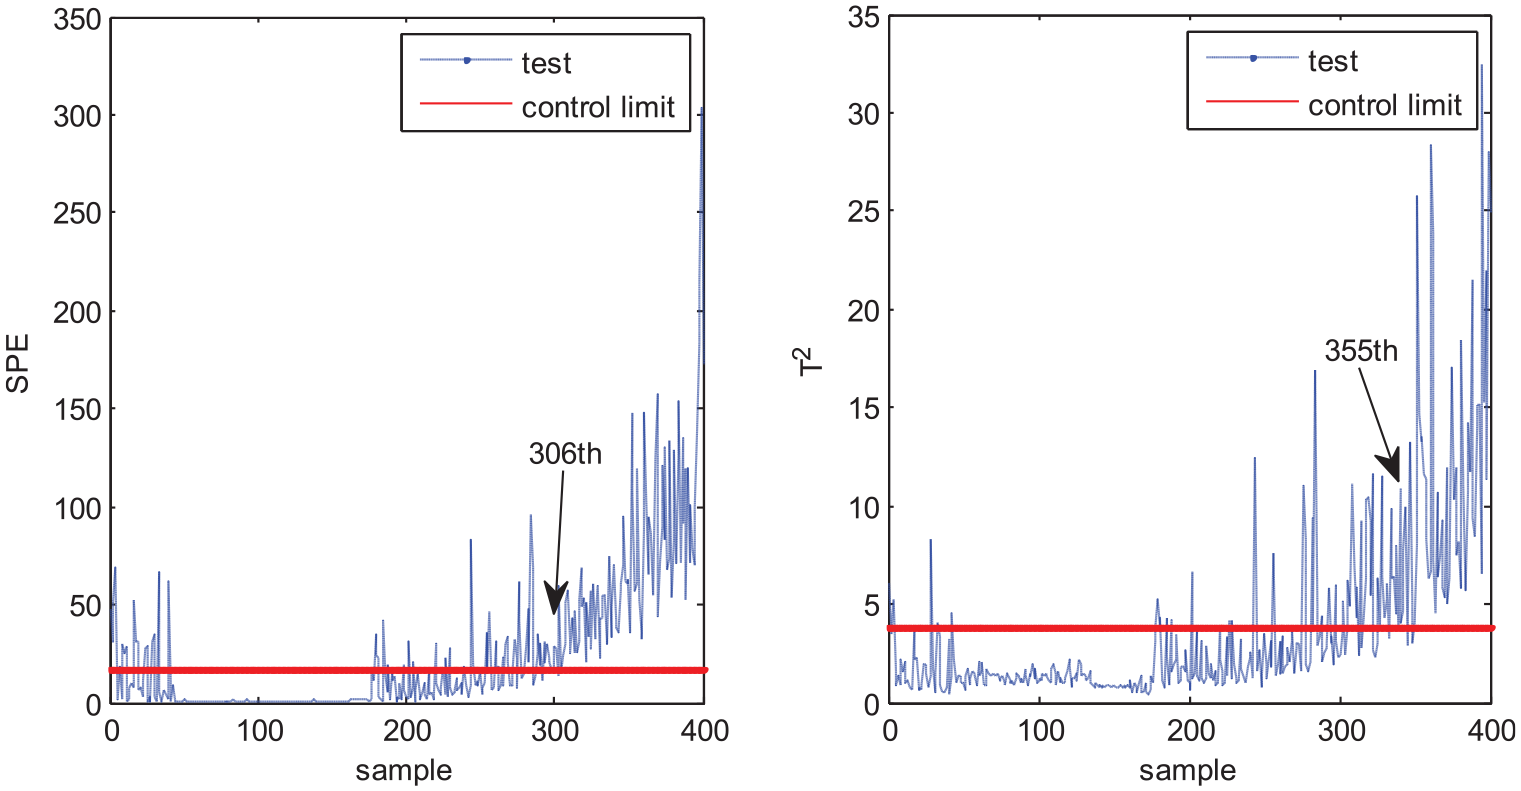
Fault detection results of MPCA under fault 6.
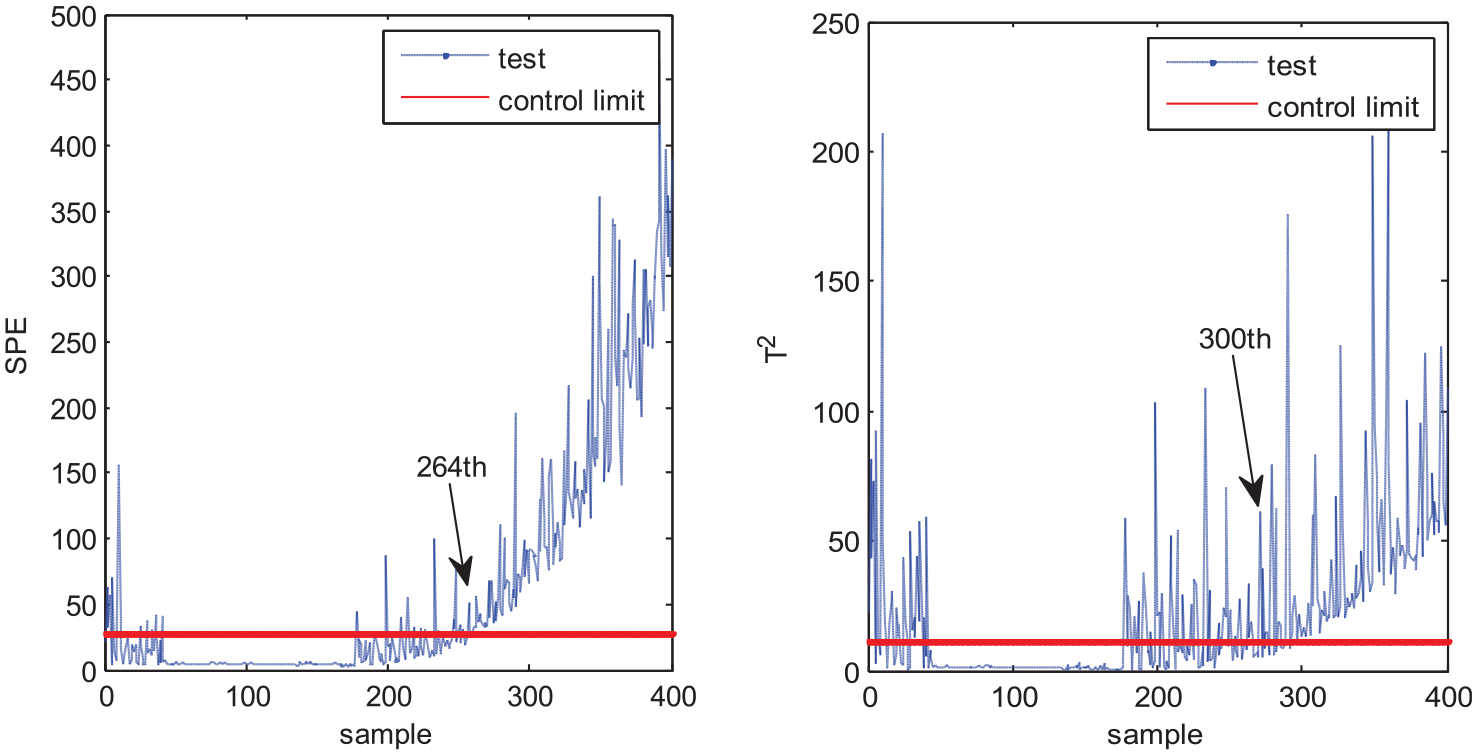
Fault detection results of MNPE under fault 6.
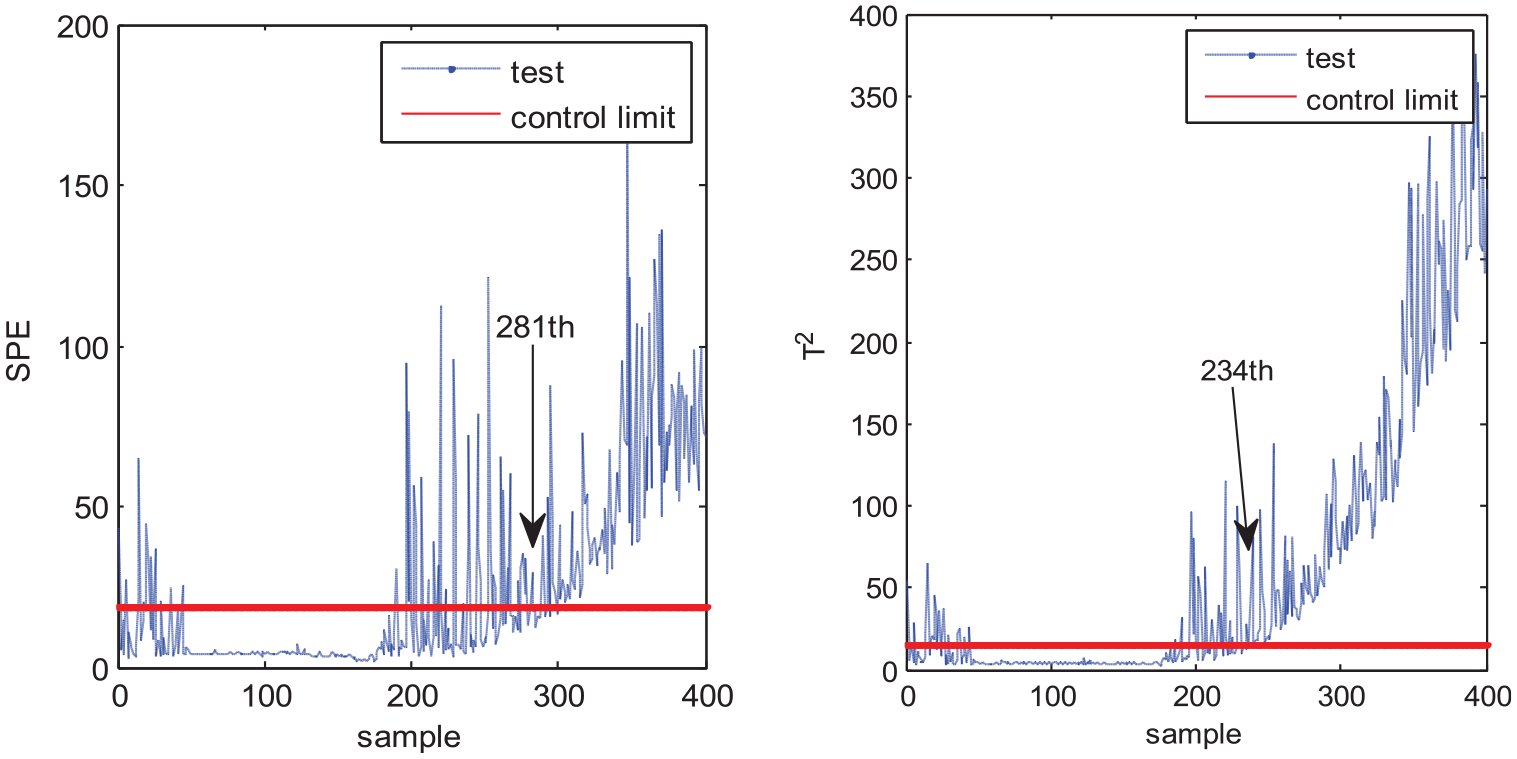
Fault detection results of MGNPE under fault 6.
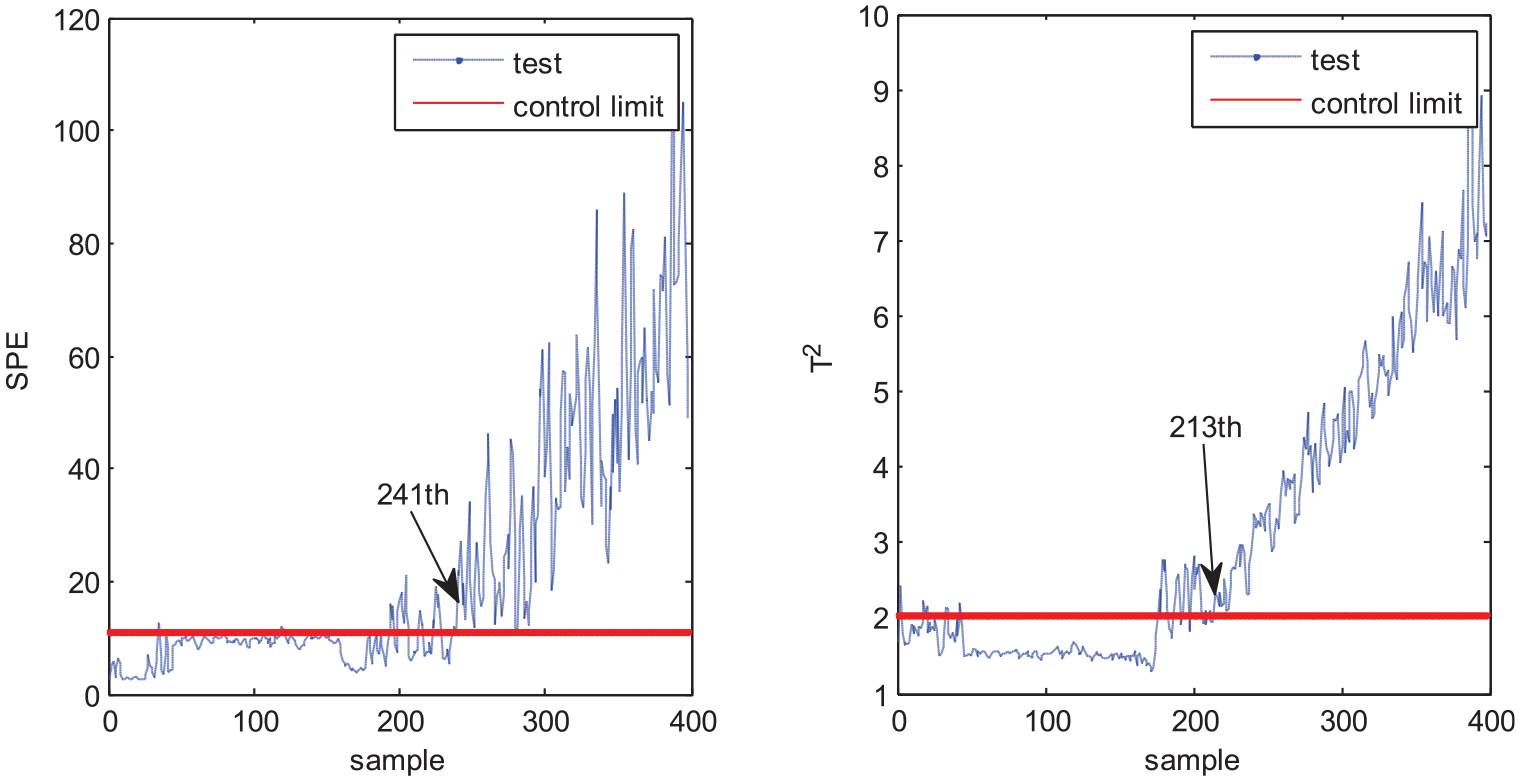
Fault detection results of MDNGNPE under fault 6.
The comparison results of average FDR and FAR under the six fault batches are shown in Figure 16. The bar heights in different colors represent the average FDR and FAR of different algorithms. It can be seen from the figure that the average FDR of MDNGNPE is higher than MPCA, MNPE and MGNPE, and the average FAR of MDNGNPE is lower. By intuitive comparison, it further explains the superior monitoring effect of MDNGNPE over the MPCA, MNPE, and MGNPE.
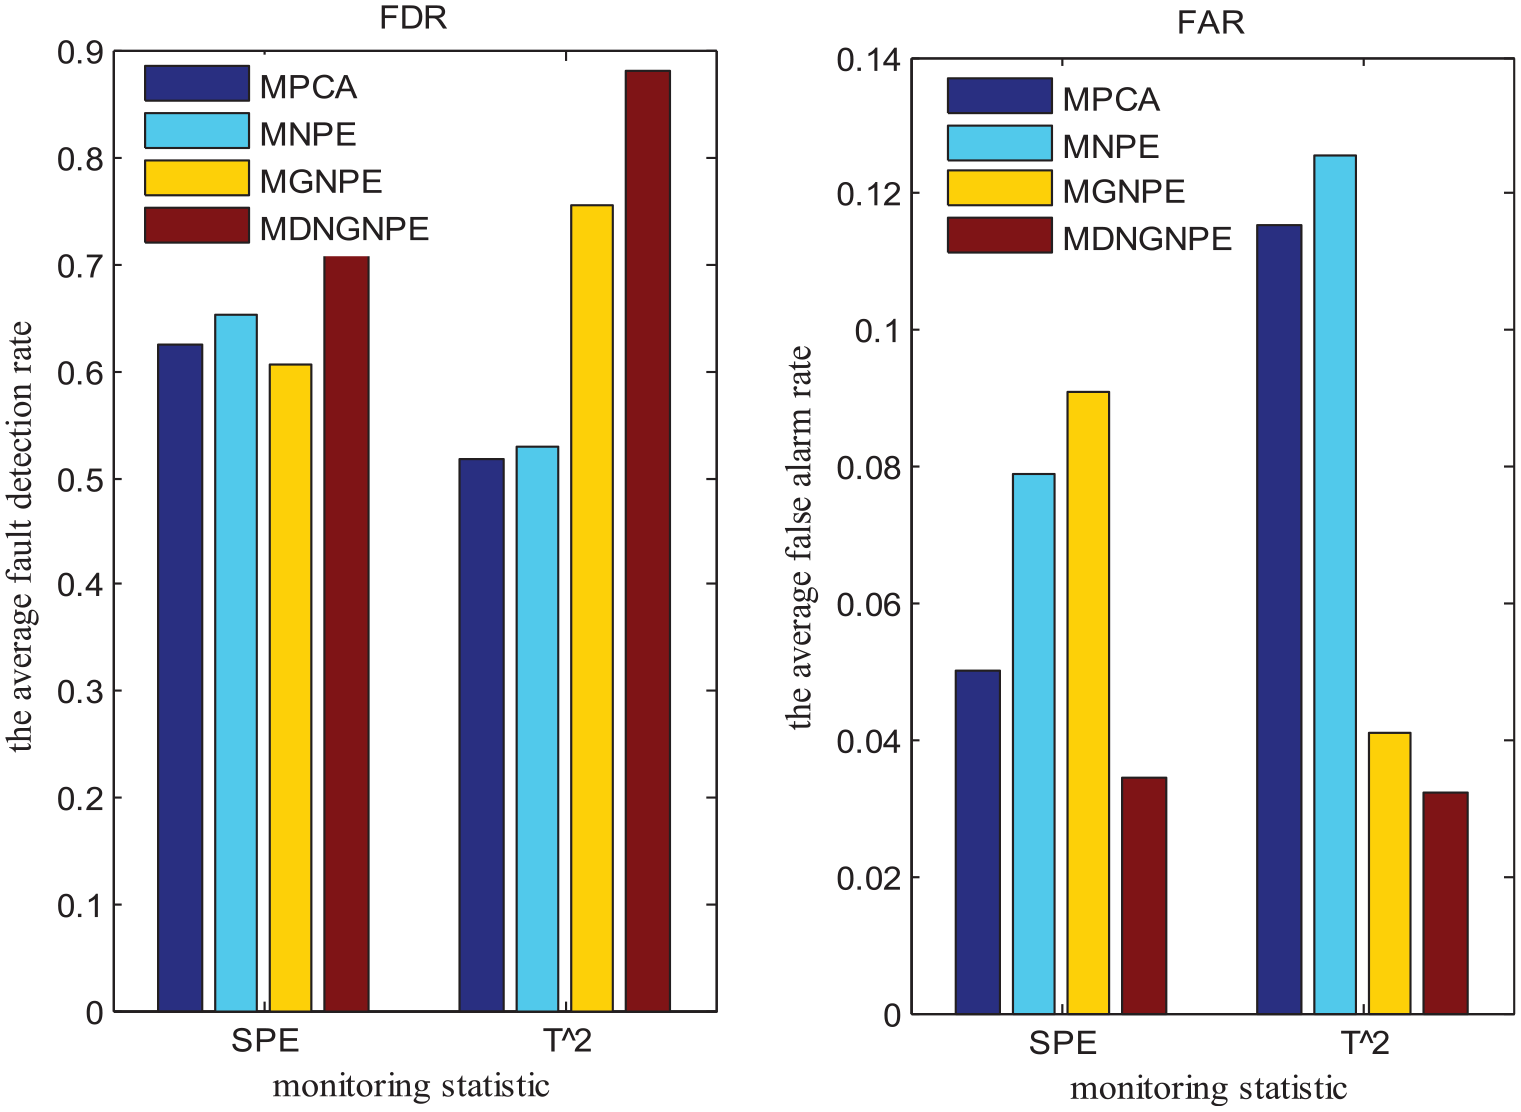
Comparison charts of average FDR and average FAR under the six fault batches.
Conclusion
In this paper, an MDNGNPE method is proposed. First, the time-lagged window is constructed to solve the problem of auto-correlation in time series. For nonlinear characteristic, an effective nonlinear mapping method is used to retain the nonlinear structure between process variables, which considers the physical limits when nonlinear mapping is employed. Second, after employing the time-lagged window and nonlinear mapping, GNPE is used to preserve global and local structures and reduce the complexity of nonlinear mapping. Finally, the simulation results obtained from the numerical simulation and the penicillin production process prove the effect of the proposed method. But the parameters in nonlinear mapping need to be set by experience. Therefore, we will build a mathematical model in the future to calculate specific parameters, instead of setting by experience.
Footnotes
Declaration of conflicting interests
The author(s) declared no potential conflicts of interest with respect to the research, authorship, and/or publication of this article.
Funding
The author(s) disclosed receipt of the following financial support for the research, authorship, and/or publication of this article: This work was financially supported by the National Natural Science Foundation of China (Nos. 61763029, 61873116), the National Defense Basic Research Project of China (No. JCKY2018427C002), Industrial Support and Guidance Project of Colleges and Universities in Gansu Province (No. 2019C-05), Open Fund Project of Key Laboratory of Gansu Advanced Control for Industrial Processes (2019KFJJ05).