
Abstract
In this paper, we present calibration and uncertainty evaluation methods for the phase of a radio-frequency comb generator using a calibrated sampling oscilloscope. In addition, we present many solutions that are indispensable for the precise calibration of phase up to 50 GHz. First, we correct the sampling time error, which is the systematic error of the equivalent time sampling system. Second, the frequency response of the oscilloscope is de-convoluted from the measured pulse, and the impedance mismatch between the radio-frequency comb generator and the oscilloscope is calibrated. Finally, we present the calibrated phase of the radio-frequency comb generator and the measurement uncertainty, which demonstrated 95% confidence intervals within ±4.4° up to 50 GHz. The calibrated radio-frequency comb generator, which is traceable to SI units, is used to calibrate a nonlinear vector network analyzer, vector signal analyzer, and oscilloscope. Uncertainties are easily propagated to the measurement uncertainty of other apparatus since it is obtained in the form of covariance.
Introduction
Recently, as various broadband wireless services have rapidly increased, the demand for precise measurement of broadband signals has also increased. 1 These wideband signals are often distorted in most apparatuses because the amplitude and phase of this equipment vary with the frequency. Typically, the phase relationship of the incident and reflected waves into a device under test (DUT) at a particular frequency can be easily measured with a vector network analyzer (VNA). However, it is difficult to measure the phase relationship between frequencies because the phase randomly changes as the frequency of the local oscillator is changed.
The radio-frequency (RF) comb generator periodically generates a wideband pulse. In the frequency domain, this results in comb-like frequency components at the pulse repetition frequency (PRF) intervals, the magnitude of which is equal to the frequency spectrum envelope of the pulse. Thus, the RF comb generator always produces the same phase relationship between all comb frequencies. As a result, the RF comb generators are used as the phase reference in many applications: nonlinear VNA phase calibration, 2 oscilloscope frequency response calibration,3–5 vector signal analyzer calibration, 6 and so on.
Recently, the calibration methods for the RF comb generator were studied. In Reader et al., 7 the phase of the RF comb generator was measured using a calibrated sampling oscilloscope. The researchers investigated the conditions of temperature, driving power, and so on. In addition, they presented the measurement value and the repeatability uncertainty under the optimal conditions. Humphreys et al. 8 proposed a method to measure the pulse irrespective of the output impedance of the comb generator. The analysis of measurement uncertainty, however, has not been sufficiently presented.
In this study, we precisely calibrated the phase of the RF comb generator and analyzed the uncertainty. We used a calibrated sampling oscilloscope in the same way as in Reader et al. 7 and Humphreys et al. 8 to secure measurement traceability. In the calibration process, the sampling time error and the frequency response of the sampling oscilloscope were evaluated and corrected. In addition, we corrected the impedance mismatch between the RF comb generator and the oscilloscope. We expect that the proposed method can be used for the calibration service of the RF comb generator. In section “Measurement system and systematic errors,” we describe the measurement system, and in section “Calibration of an RF comb generator,” we analyze the measurement uncertainty. Finally, in section “Conclusion,” we conclude this paper.
Measurement system and systematic errors
Figure 1 shows an evaluation system for an RF comb generator using a calibrated sampling oscilloscope. The wideband pulse generated by the comb generator was measured through the sampling head of the oscilloscope. The connector of sampling head is 1.85 mm, while that of DUT is 2.4 mm. Although the 1.85 and 2.4 mm coaxial connectors have the same characteristic impedance and are physically compatible, the discontinuity occurs at the mating point due to the different sizes of the inner and outer conductors. Thus, we used the 1.85 to 2.4 mm adapter to avoid this additional reflection. Sampling oscilloscopes are based on the equivalent time sampling techniques, resulting in a systematic error in the sampling time. An additional 6 GHz in-phase and quadrature-phase (IQ) signals were simultaneously measured to precisely calibrate this systematic error. The PRF of the RF comb generator was set to 100 MHz, which was branched and used as a triggering signal of the sampling oscilloscope.
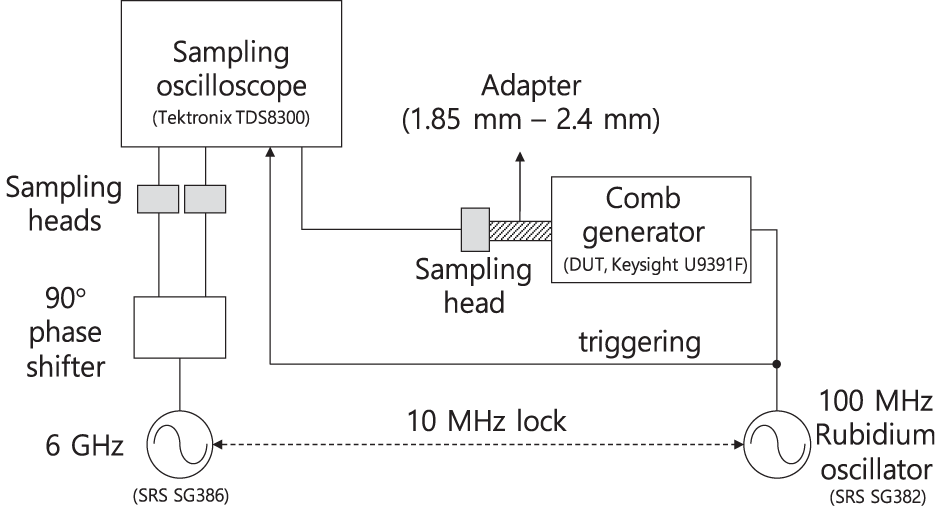
Measurement system for the phase response of the RF comb generator.
Sampling time error in the oscilloscope
The sampling time error of the sampling oscilloscope can be estimated by regression analysis based on the measured IQ signal.9,10 We used the following model

where yj,i is the ith measurement using the jth channel. aj, θj, and cj are the amplitude, phase, and offset values of the sinusoidal signal measured through the j channel, respectively. ti and δi are the ith sample time and timing error of the oscilloscope, respectively, and εj,i is the random noise. Thus, nonlinear optimization can be used to estimate the measurement time error δi of the sampling oscilloscope. In this work, we have applied ODRPACK as the optimizer. Unlike least square fitting, ODRPACK can estimate error δi for the input variable ti by means of “errors in variables” approach. 11 As shown in Figure 2, the pulses of the RF comb generator, which were measured 100 times; the mean value; and the mean of the timing error corrected measurements are represented with gray points, black solid line, and white solid line, respectively. The timing error correction is shown with a delay of 1 ps for ease of comparison. The raw measured value (gray points) changes significantly with each measurement due to the noise and timing error of the oscilloscope. The simple arithmetic mean (black solid line) shows lower peak amplitude and less steep slope compared with the result of timing error correction. This results in the attenuation of the high-frequency components of the pulse. The mean value of the timing error correction, however, was not decreased and removed many discontinuities, allowing accurate measurement up to high-frequency range.
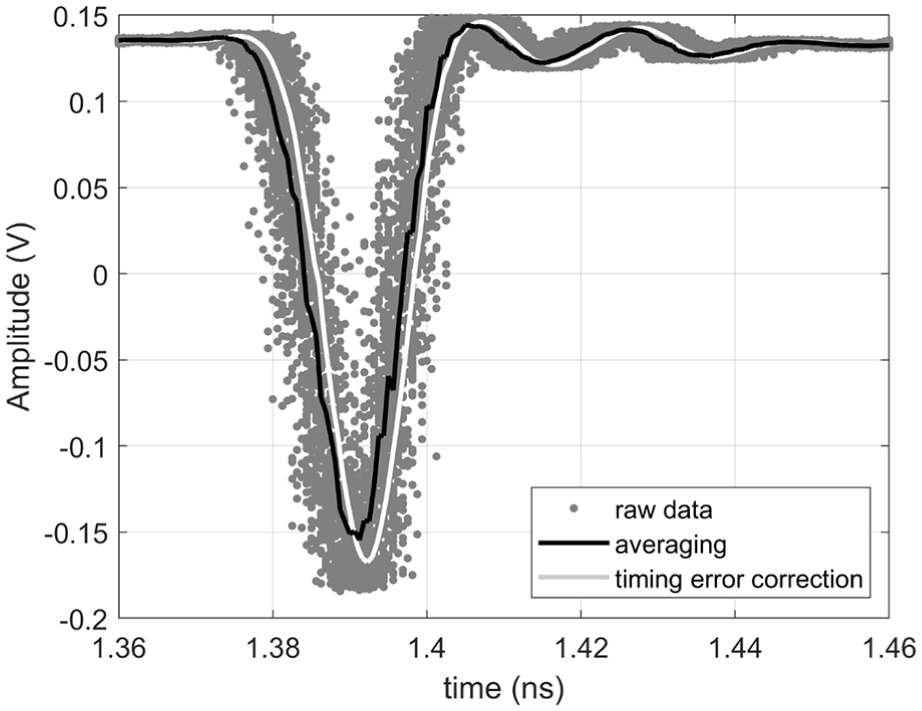
Calibration result for the timing error on the sampling oscilloscope.
Impedance mismatch
To measure the scattering parameter of a two-port device using a VNA, a “thru” calibration process is necessary. However, with a non-insertable device, in which the DUT ports are different from those in this study, “thru” measurement is impossible. To solve this problem, “adapter removal” or “unknown thru” calibration is usually used. In this study, we used the one-port de-embedding technique, which allows for accurate measurements due to the low number of cal kit connections and the absence of cable movement. 12 After calibrating one port of the VNA, the error box Sport was determined as shown in Figure 3. Then, the adapter was connected to the VNA, and the Stotal was also obtained through the one-port calibration process. After each S-parameter was converted to the T-parameter, we applied equation (2) to calculate the T-parameter of the adapter

S 11 and S22 of the adapter from Tadapter can be calculated, but not S21 and S12, because they are not distinguishable. S21 and S12, however, could be calculated from equation (3) using the reciprocal property of the passive devices
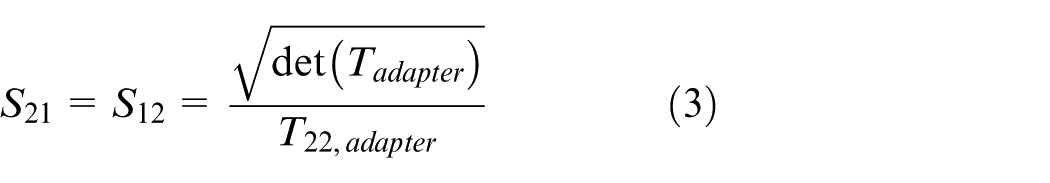
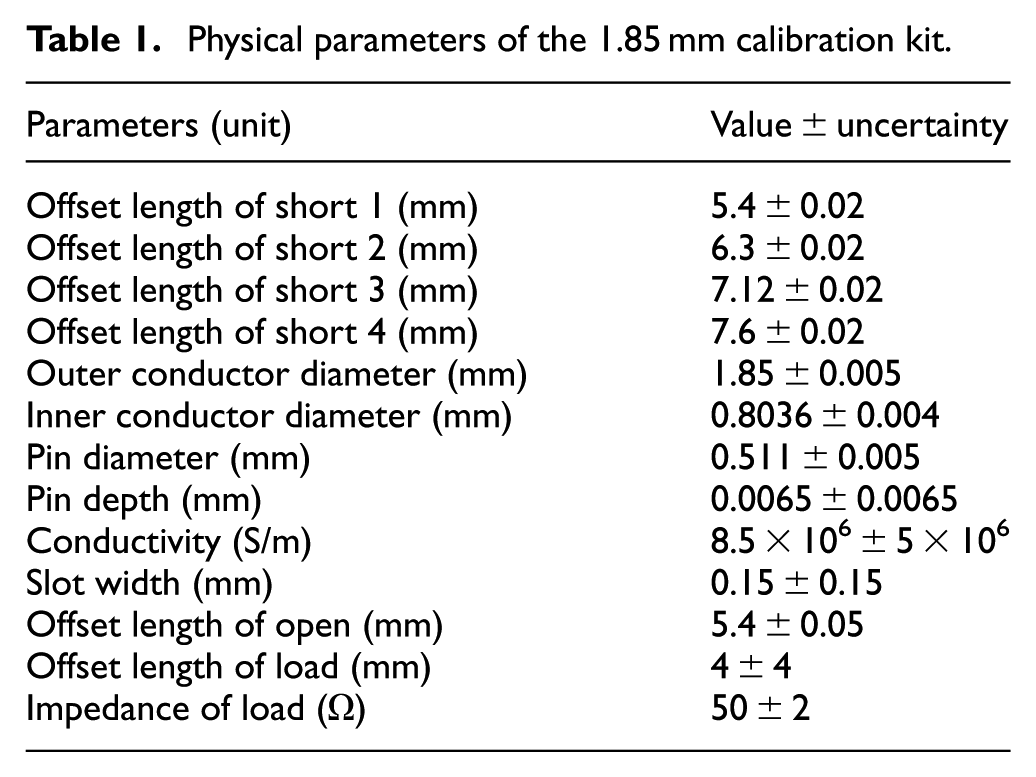
where det indicates the determinant of the T-matrix. The phase obtained by taking the square root varied only ±90°, so it must be brought back to ±180°. 13 In this study, the measurement uncertainty was estimated based on the physical dimensions of the cal kit to obtain the covariance between frequencies. The physical dimensions of the 1.85 mm cal kit are summarized in Table 1, and the physical dimensions for the 2.4 mm cal kit can be found in Avolio et al. 14 and Jargon et al. 15 The parameters of Open and Load cal kits were found using the reciprocal property of the passive elements, 16 and other parameters were obtained from the manufacturer’s specifications and IEEE standards.17,18 Figure 4 represents the S21 of the adapter measured three times. The deviation of the repeated measurement is very small, with an amplitude of 0.002 dB and a phase of 0.05° or less. Based on the physical parameters in Table 1, the measurement uncertainty experienced 0.06 dB in amplitude and 1° in phase at the 95% confidence interval (CI).
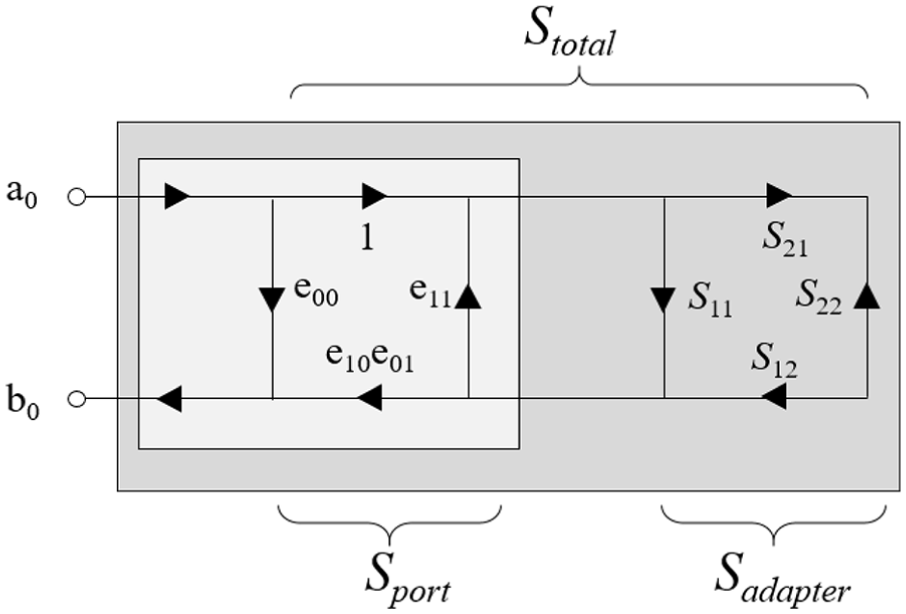
One-port de-embedding technique.
Physical parameters of the 1.85 mm calibration kit.
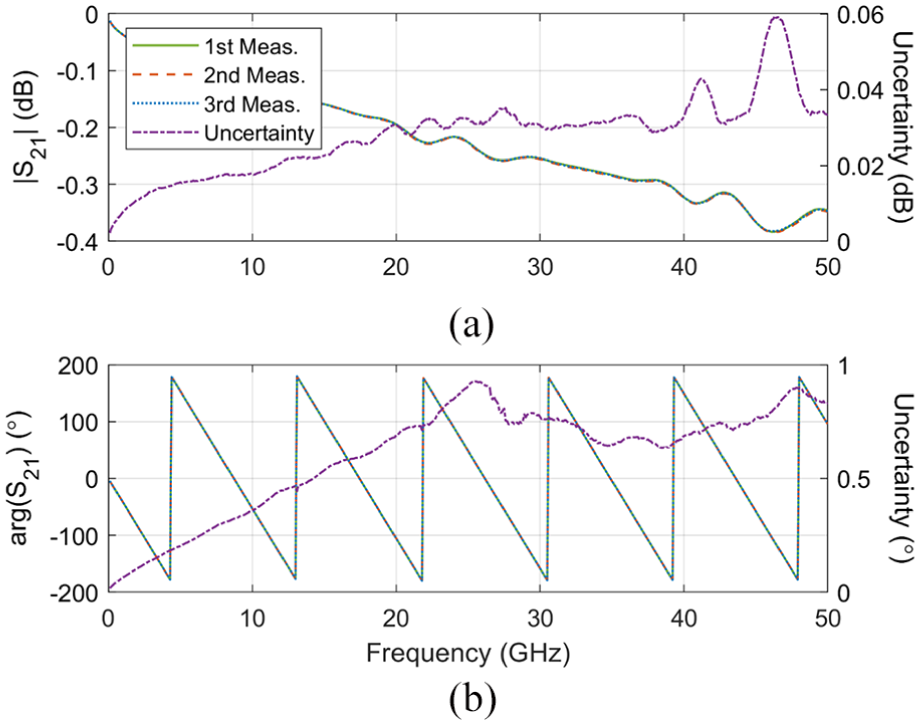
S-parameters of the adapter: (a) amplitude and (b) phase.
Frequency response of the oscilloscope
The DUT generates wideband pulses from DC to 50 GHz, which inevitably includes the frequency response of the sampling oscilloscope. Thus, the frequency response must be accurately measured and corrected. Figure 5 shows the measurement of frequency response and 95% CI. The frequency response is obtained using the photodiode calibrated by the National Institute of Standards and Technology. We can calibrate the oscilloscope’s response since we use the photodiode with known frequency response. The 95% CI is estimated based on the Monte Carlo simulation, including the uncertainty for corrections about the photodiode frequency response, impedance mismatch, and oscilloscope’s timing error (see section “Sampling time error in the oscilloscope”). 5 It shows a nearly flat amplitude and a linear phase up to 40 GHz, but at a higher frequency, the amplitude begins to decrease, and the phase is no longer linear, which means that the signal components in this frequency band are distorted by the frequency response of the sampling oscilloscope. Therefore, the frequency response must be calibrated for the precise measurement result.
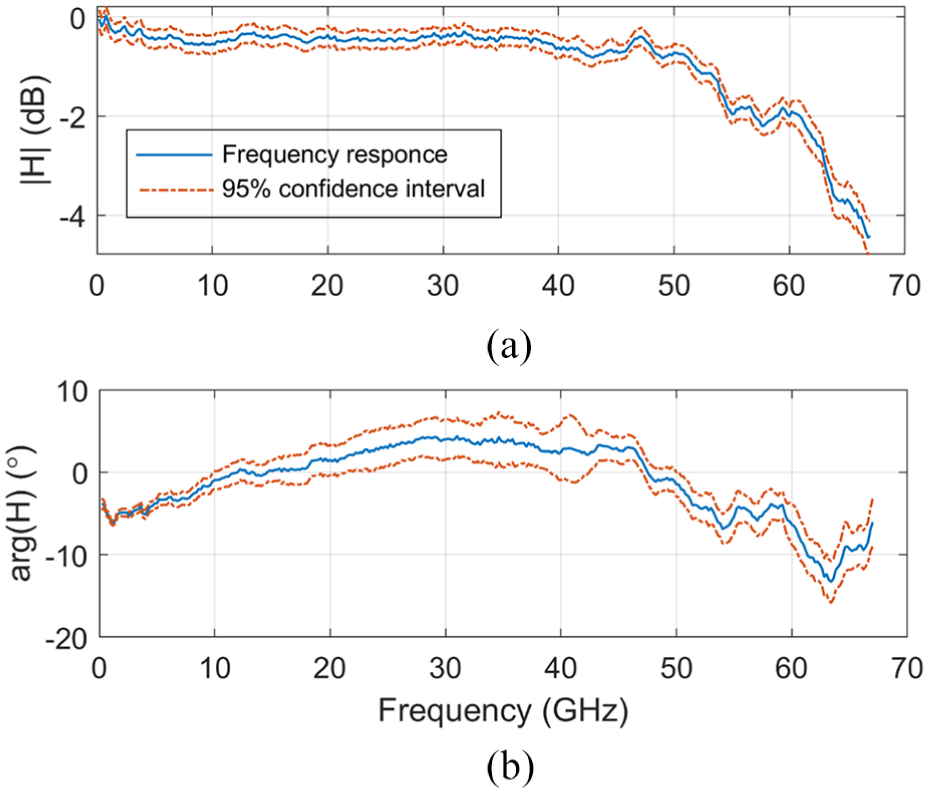
Frequency response of the sampling oscilloscope: (a) amplitude and (b) phase.
Calibration of an RF comb generator
Calibration of the systematic errors of the measurement system
The frequency response of the oscilloscope and the impedance mismatch between the apparatuses can be calibrated as follows 19
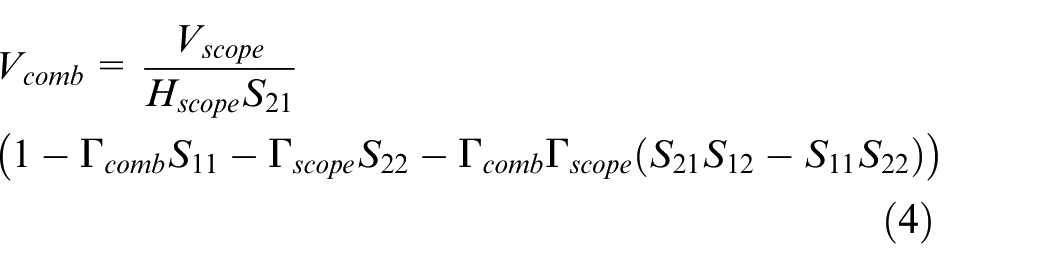
where Γ scope , Γ comb , Sij, and Hscope are the reflection coefficient of the oscilloscope, the reflection coefficient of the RF comb generator, the S-parameters of the adapter, and the frequency response of the oscilloscope, respectively. Vscope is the Fourier transform of the measured pulse vscope using the sampling oscilloscope. Note that vscope is the corrected signal for the time base error of the oscilloscope. Figure 6 shows the results before (dashed line) and after (solid line) the systematic errors of the measurement system are calibrated. The phase is detrended by subtracting the linear phase to have a small root mean square (RMS) error from DC to 40 GHz for easy comparison. Comparing before and after calibration, the amplitude increases by about 1.5 dB and the phase delay decreases by about 90°. This result clearly shows that the systematic errors of the measurement system must be calibrated for precise phase measurement of the RF comb generator.
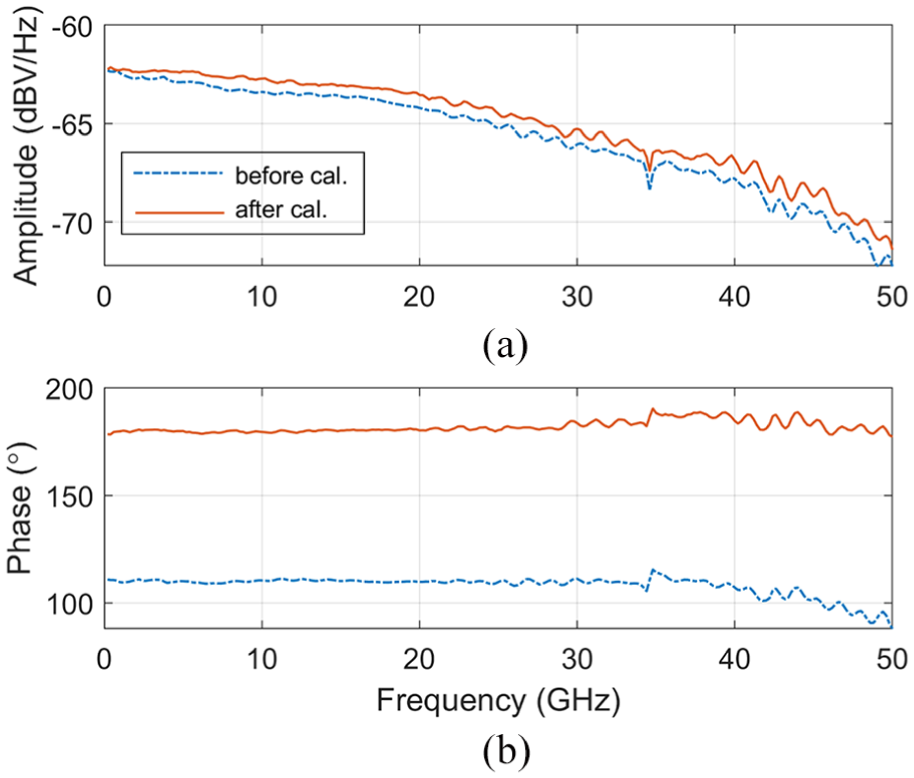
Frequency spectrum of the pulse generated by the RF comb generator: (a) amplitude and (b) phase.
Analysis of the measurement uncertainty
The measurement uncertainty of the RF comb generator can be estimated from each covariance of the measured pulse
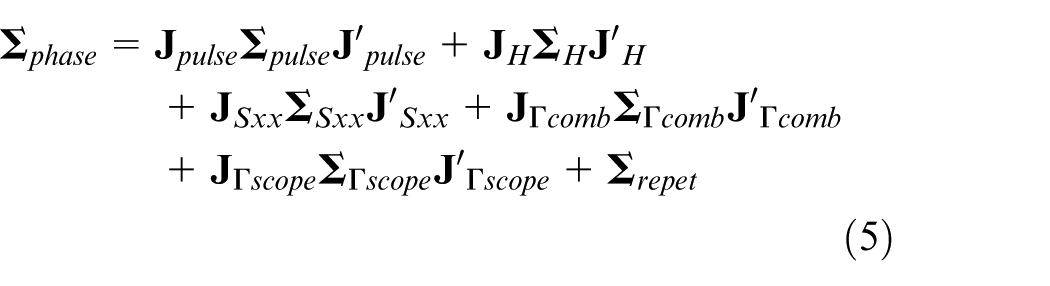
where
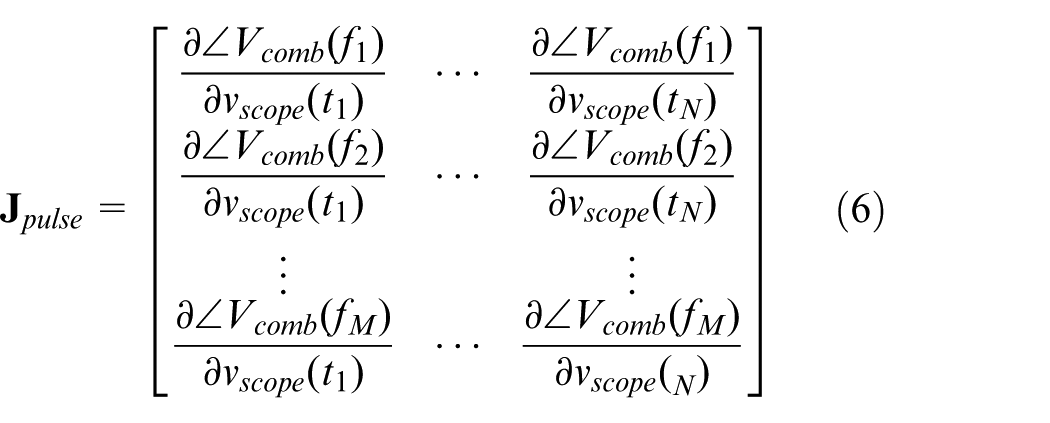
where N and M are the length of the measuring pulse vscope and the phase response of the RF comb generator ∠Vcomb, respectively. Other Jacobian matrices have the same numerator as equation (6) and are found by replacing only the denominator with their partial derivatives. Figure 7 shows the measurement pulse vscope and the Jacobian matrix
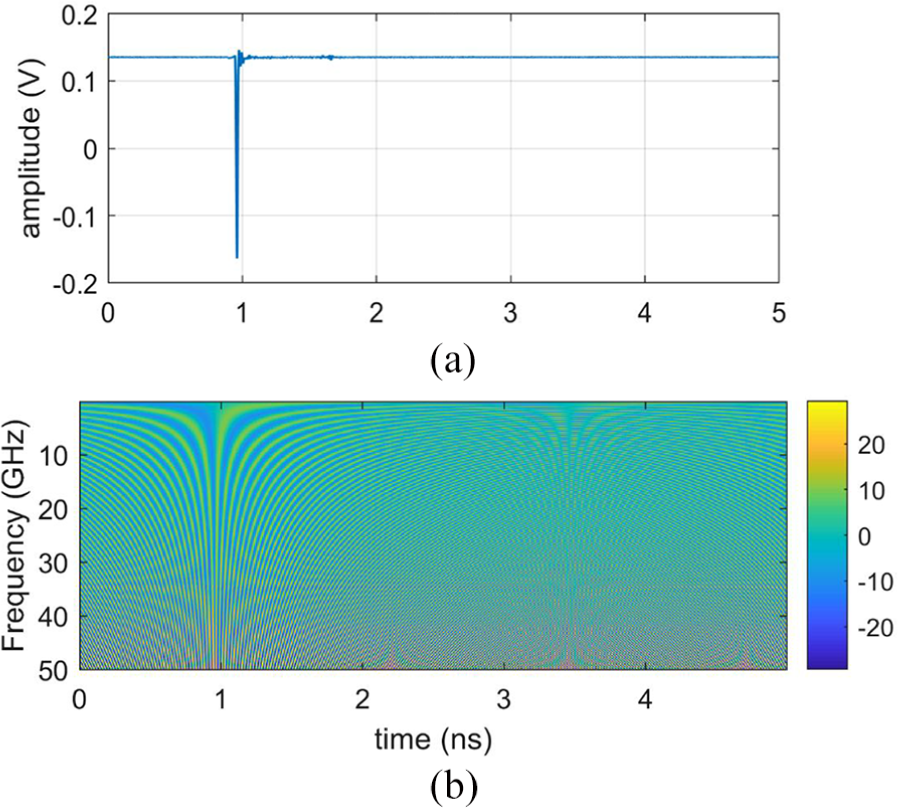
(a) Measured pulse vscope and (b) the Jacobian matrix for the measured pulse
The phase calibration result of the RF comb generator using equation (5) is shown in Figure 8(a). The solid line represents the measured phase of the RF comb generator, and the dotted line is the measurement uncertainty that was obtained from multiplying the square root of the diagonal of covariance Σ phase by the expansion factor k = 2. The dashed line indicates a Monte Carlo simulation that was carried out 1000 times. The uncertainty calculation based on the covariance was in good agreement with the Monte Carlo simulation. Thus, for measurement uncertainty estimation, the approach based on the covariance can be used in place of time-consuming Monte Carlo simulation. Figure 8(b) shows the covariance Σ phase , which has a large value near 40 GHz and also a large value near the 35 GHz where the phase discontinuity is produced. Figure 9 shows the contribution of each calibration process to the phase measurement uncertainty. The frequency response of the sampling oscilloscope contributes the most to uncertainty, while the calibrations of the timing error on the oscilloscope and the impedance mismatch between apparatus are small. Also as expected, the repeatability becomes larger as the frequency is increased. The calculated Σ phase contains correlations between all components. Thus, it can be easily propagated to the uncertainty of other quantities. 20 If there are no correlations, the uncertainty is not properly propagated. Figure 10 shows the wideband pulse and its uncertainty. We assume that only the phase of the pulse varies, and its uncertainty is taken from Figure 8. The uncertainty without correlation between frequencies is overestimated than the one with correlation, and gives similar values in all time. However, the uncertainty with correlation shows reasonable result with high value on rising and falling time interval of the pulse.
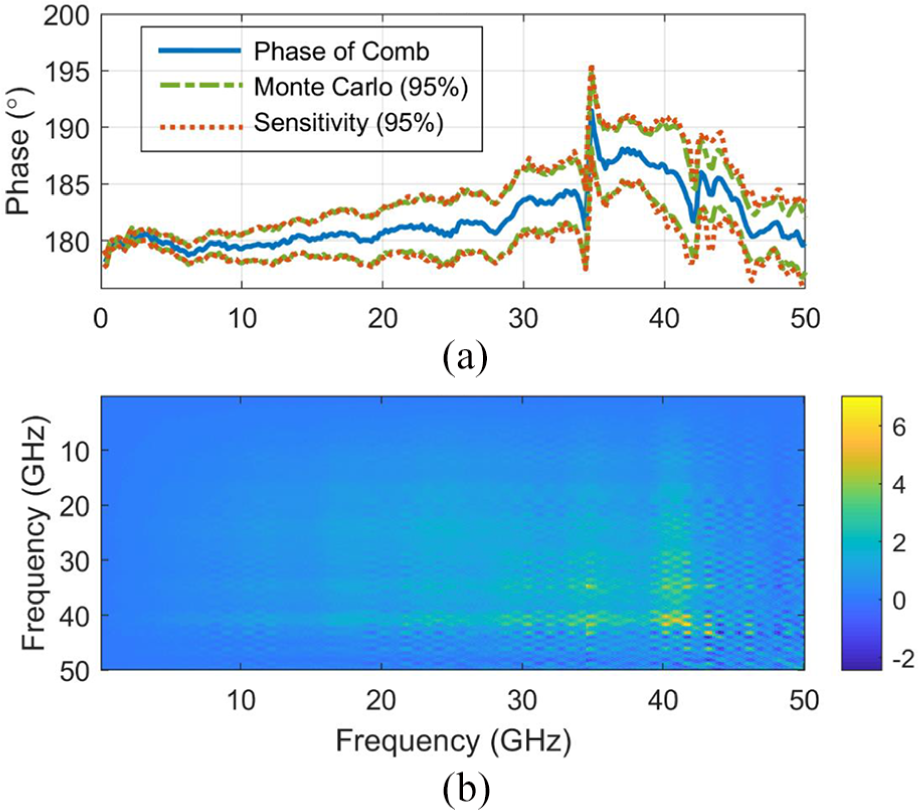
(a) Phase response of the RF comb generator and 95% confidence interval and (b) covariance for the measured phase.
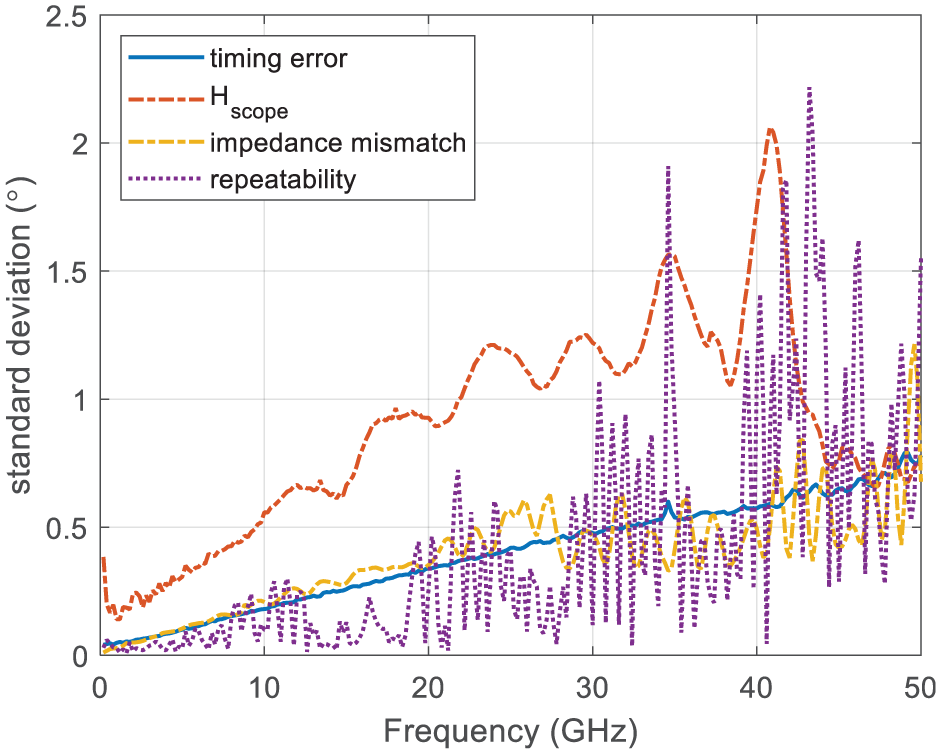
Contributions of each calibration process to the phase measurement uncertainty.
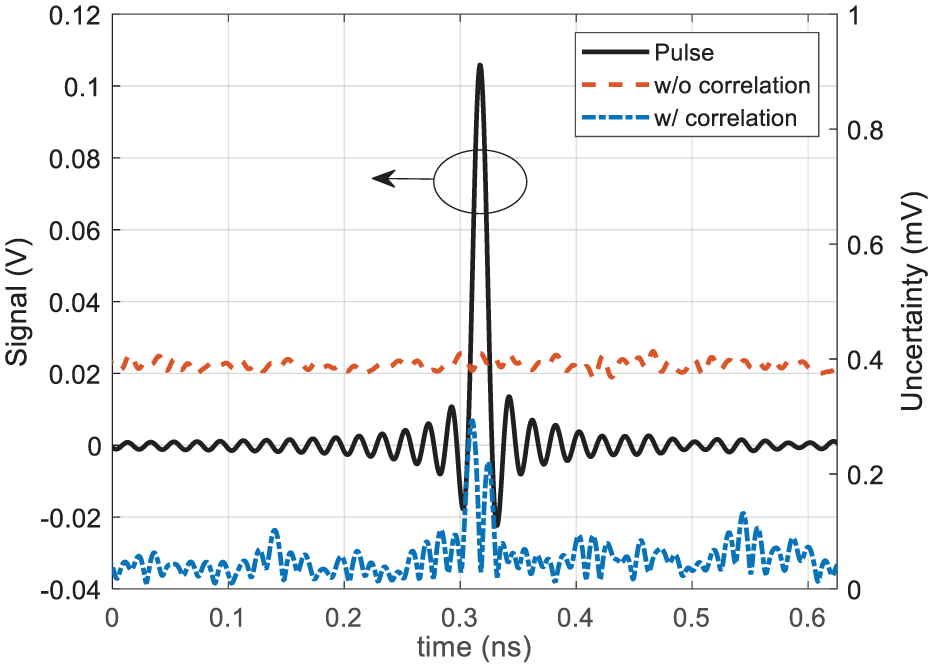
Simulated pulse and its uncertainty with and without correlation between frequency components.
Conclusion
In this paper, we proposed a method to accurately measure the phase of the RF comb generator using the sampling oscilloscope. The proposed method not only includes repeatability through the multiple measurements but also calibrates the systematic errors of the measurement system, such as the sampling time error, impedance mismatch, and frequency response of the oscilloscope. The phase measurement using a DUT operating at up to 50 GHz has an uncertainty of up to ±4.4° (k = 2). In addition, the correlations between all phases can be obtained, which allows for easy propagation to the uncertainty of different quantities.
Footnotes
Declaration of conflicting interests
The author(s) declared no potential conflicts of interest with respect to the research, authorship, and/or publication of this article.
Funding
The author(s) disclosed receipt of the following financial support for the research, authorship, and/or publication of this article: This research was supported by the Physical Metrology for National Strategic Needs funded by the Korea Research Institute of Standards and Science (KRISS-2019-GP2019-0005).