
Abstract
In order to improve quality in manufacturing, the measuring instruments used in production process should regularly be monitored and corrected according to international or national standards. Calibration of high-voltage equipment and precise measurements of DC high voltages are accomplished by standard voltage divider. Self-heating effect is the main error source of measurement in high-voltage DC resistive dividers. Therefore, precise control systems should be designed to keep stability of the ambient temperature and to regulate the heat distribution along the high-voltage DC resistive divider. For this purpose, a heat controlled resistive divider whose input voltage (Vin) is up to 5 kV was designed. This study is focused on heat convention and the dissipation model of the resistive divider and executes some control simulations under various conditions that aim to find the appropriate control method. Responses of the high-voltage DC resistive divider model are compared with and are validated by the responses of the designed actual system. The model provides us faster analyze and design solutions for novel methods. In this way, analyzing and controlling higher voltage dividers, such as 100 KV, will reduce just into a parameter change on the model. The fuzzy control method is suggested since the system dynamic has non-linear characteristics. Fuzzy temperature difference controller keeps temperature at a certain degree where fuzzy vertical temperature gradient controller keeps vertical temperature gradient around zero. Actual system and model responses for the fuzzy control are compared and interpreted.
Keywords
Introduction
Resistive self-heating effects cause measurement uncertainties in high-voltage DC resistive divider (HVDC-ResDiv) systems.1,2 Calibration of equivalent measurement devices and precise measurements of DC HVs are realized by standard HVDC-ResDiv.3– 5 HVDC-ResDiv designed for calibration of other reference systems should have a measurement uncertainty of less than 0.002%. Therefore, resistor modules’ thermal coefficients should be lowest, and temperature gradient caused by the self-heating should be reduced to reasonable levels. 6 Power dissipation results in temperature difference (TD) in overall resistors and vertical temperature gradient (VTG) along the resistor block and significantly threatens precise measurements.7,8 Individual contribution of TD and VTG to the measurement uncertainties is emphasized in literature.1,3,7–10
In this purpose, several TD control techniques are proposed in order to reduce TD errors.1,8,10 By means of a shielded structure of the resistors and TD control, a 2-ppm measurement uncertainty is achieved. 10
Effects of noise rejection techniques and partial discharge measurements on HVDC cables should be investigated. 11 Small-signal model of an HVDC system with angle control and an HVDC system with constant DC voltage control are proposed. 12 Improvement in stability of HVDC systems by convenient control strategies is essential for providing standards.13,14
Mathematical modeling and simulation of heat and mass transfer offers definitely appropriate controller designs.15,16
Control method is getting important to maintain uncertainty arisen from heating around ppm levels.1,10 However, literature mention on neither TD nor VTG control methods. For this reason, an HVDC-ResDiv, which adjusts its TD and VTG by controllers and provides a consistent measurement, is realized. 17
Physical description and numerical calculation of a system’s heat and mass transfer characteristics under influence of temperature gradients allow us critical values of the temperature gradients and critical velocities of the convection. In the organization of complex systems, mathematical modeling and simulation are required. 21 In this way, analyzing dissimilar operational modes could be possible, and statement of potential errors and their adjustment is achieved without additional costs of real conditions. 22 Heat conduction model is commonly employed in analysis and designing of nano transistors. Simulations and improvements in the layer parameters could allow reducing self-heating effect and provide a considerable enhancement in the temperature performance of metal–oxide–semiconductor field-effect transistors (MOSFETs). 23 Modeling HVDC systems provides more rapid and accurate designs that overcome the deficiencies, or combining and observing the advantages, of the previous systems.24–26
Artificial intelligence is widely used as a method of self-heating control, feature extraction or classification of internal-corona-surface discharges in HVDC applications. 27 Fuzzy-based systems provide effective controllers for uncertain non-linear systems. 28 Application of fuzzy logic–based controllers on first- and second-order unknown non-linear systems is one of the state-of-art research studies on control theory.29,30
In this study, heat conduction–convention and mass transfer model of the 5-kV HVDC-ResDiv is extracted: Heat conduction and energy equations are determined. General expression of system’s dynamic equations is given in terms of state-space equations and is converted to Simulink equivalent block model. A series of control simulations are realized under various conditions that aim to find the appropriate control method.
In the control of TD and VTG, fuzzy and proportional–integral–derivative (PID) methods are addressed. The study lies heavily on fuzzy inference systems (FISs) in order to satisfy non-linear relations 31 of the HVDC-ResDiv control system. Fuzzy TD and fuzzy VTG controllers are developed, and the results for the actual system and the model are compared and interpreted.
Because of the non-linear system structure, proposed fuzzy control provides a contribution to accurate measurement of HVDCs. Each control experiment and returning of the system to initial conditions takes half of the hours of attendance. Modeling and simulation of the system accelerates design and parameter changes and allows rapid application of new control methods.
Heat distribution controlled HVDC-ResDiv platform
Heat distribution control of the system is ensured by keeping TD at a constant degree and by reducing VTG around zero. In this purpose, a system composed of two chambers filled with transformer oil, a motor pump, Peltier effect heat pump (PHT) and their control software is designed (Figure 1). Transfer of the heat through the HVDC-ResDiv is carried out with both forced convection and conduction. 32 Total resistors (TRs) are kept in heat producer cylinder tank (HPCyT) on the left, where QP (W), origin of TD (°C) and VTG (°C), is removed from cooling tank (CoT) on the right: circulation pump (CP) forces heated oil and convects QP to CoT and PHTs and cooling fans on the CoT transfer it to the outer ambiance.
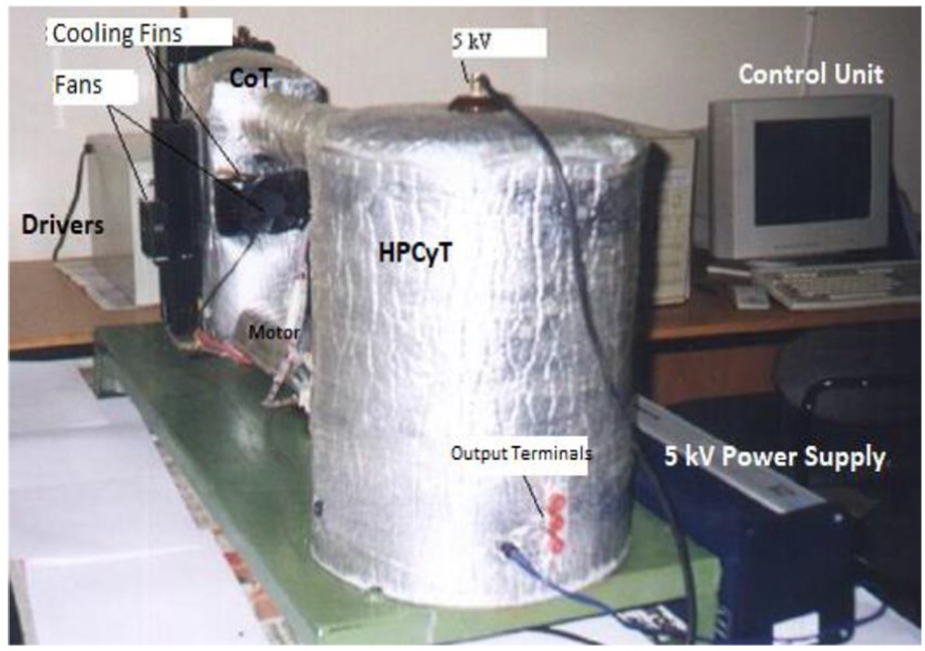
HVDC-ResDiv (5 KV).
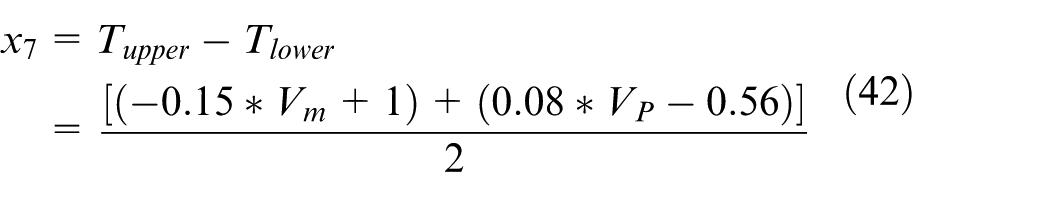
Tupper and Tlower sensors of the HPCyT determine TD and VTG values (Figure 2), (equation (2)).
Features of the mentioned HVDC-ResDiv system are listed: 17
Vin is up to 5 kV
TR is 10 MΩ: 9 × 1 MΩ + 9 × 100 kΩ + 10 × 10 kΩ
HV arm resistors: 9990 kΩ
Low-voltage (LV) arm (output) resistor: Rlow: 10 kΩ
Voltage division ratio (VDR): 1000:1
Max Vo: 5 V.
One of the most critical assisting tools in the analysis and design of measurement systems and measuring instrumentation is the mathematical modeling. 33
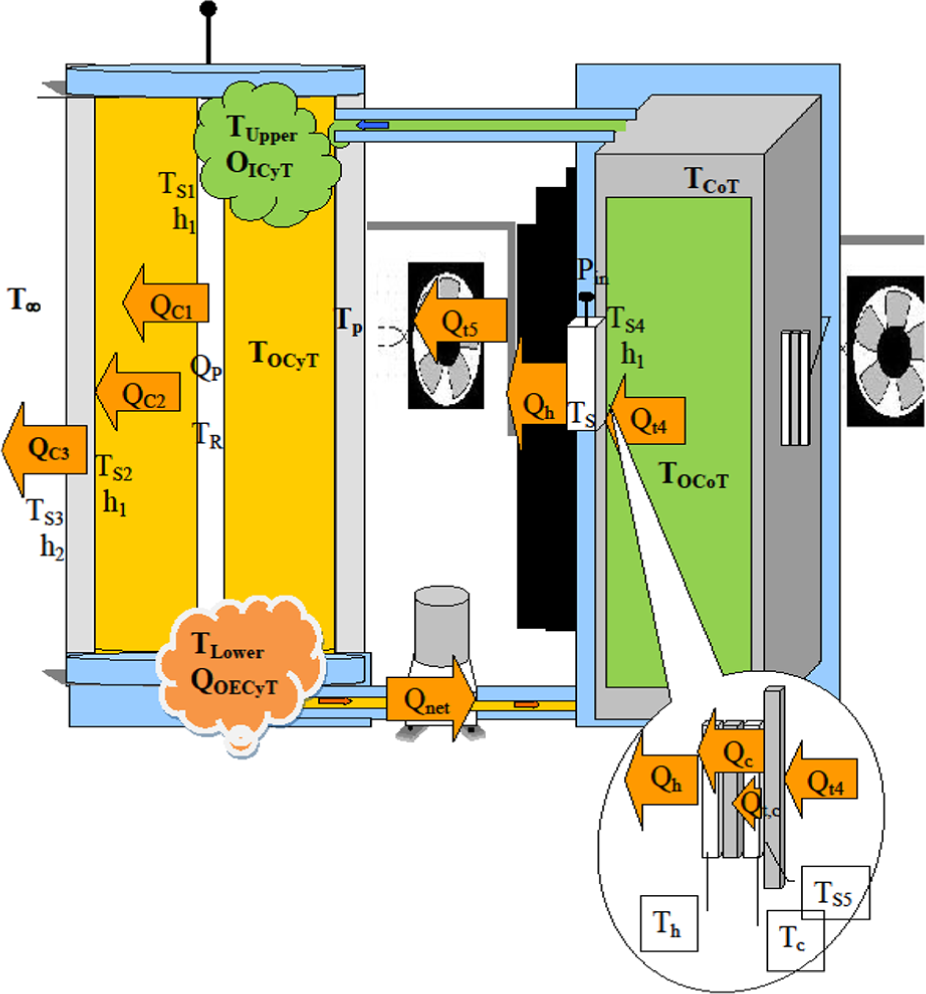
Heat distribution in the temperature controlled 5-kV HVDC-ResDiv system.
Heat conduction and convention model of the 5-kV HVDC-ResDiv
Extraction of mathematical model and its simulation, which allows analysis and evolution of various operating modes and behaviors of systems, is essential in the design of complex installations.34,35
Heat conduction and energy equations
QP is about 2.5 W, and a trivial amount is stored in the resistors, and the rest is transferred to the liquid (Figure 1). When the temperature of the outer ambiance is cooler than the inner ambiance of the HPCyT, a certain part of the heat is transferred to the outer ambiance through the lateral surface of the tank. Another part of the heat is stored on the cylinder tank (CyT) and on the liquid. The rest is brought to the CoT by means of the CP. Similarly, the heat which arrived is stored in the liquid of the CoT and on its aluminum body. The rest is transferred from the system by means of PHTs. Heat is thrown from the heated surface of the PHT by forced convection which uses cooling fans. Related temperatures are given in the nomenclature.
The temperatures and heat conduction in the temperature controlled 5-kV HVDC-ResDiv system are illustrated in Figure 2.
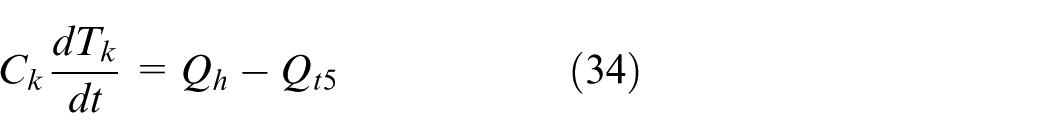
General heat equation describes energy exchanges as follows (equation (1))

Assumptions:
1. In the experiments,

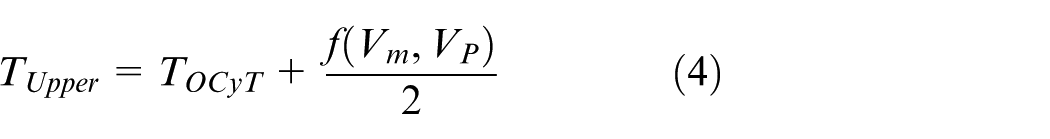
2. Referring to the experimental observations of the system (Figure 3), relation between difference of
According to observations given in Figure 3, a linear empiric approximation of
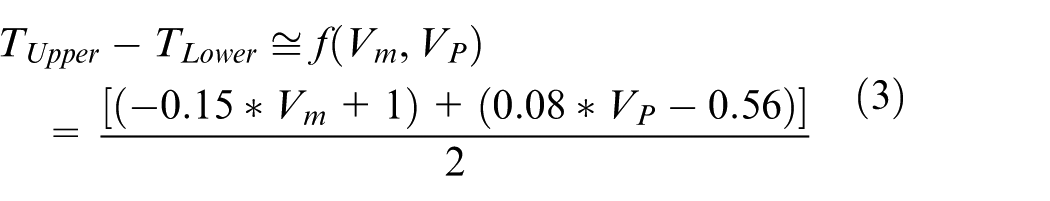
Solution of equations 2 and 3 yields
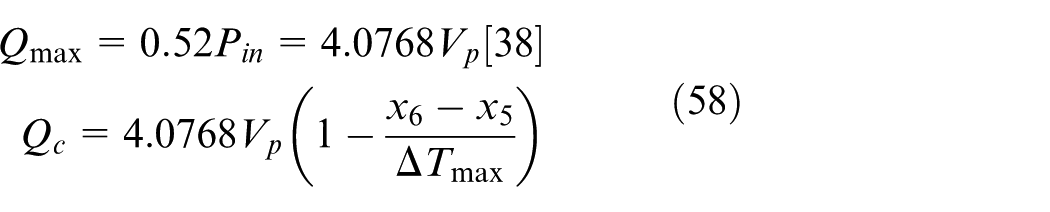
Variation of
Heat distribution in the HPCyT
All heat expressions in this section refer to the quantity of heat in a unit time (W)

Referring to the direction of the motor pump, HPCyT will remove the heat,


Heat distribution could be grouped into two sections: in HPCyT and in CoT.
Heat distribution in the CyT
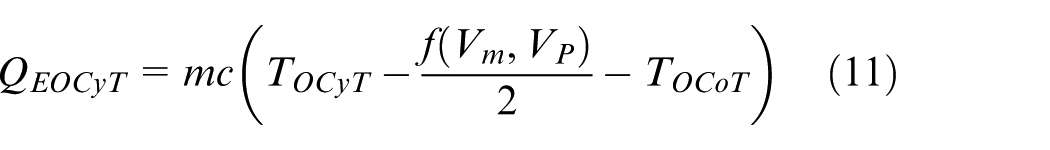
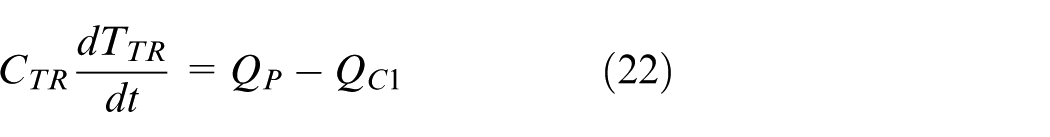
Heat stored on the resistors is
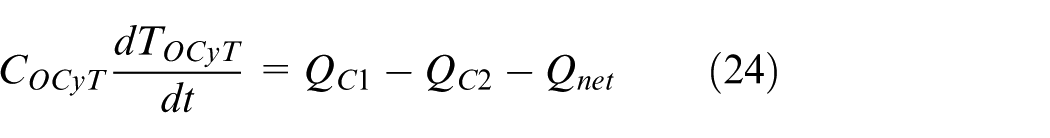
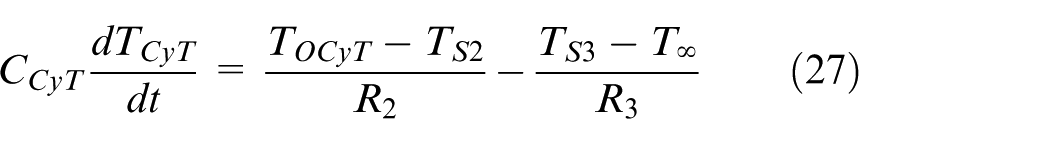
Heat stored in the fluid (oil) of HPCyT (W): Heat stored in the oil of HPCyT is equal to the difference of incoming and outgoing heats to the fluid in the tank (equation (24))
Heat stored in the side walls of HPCyT
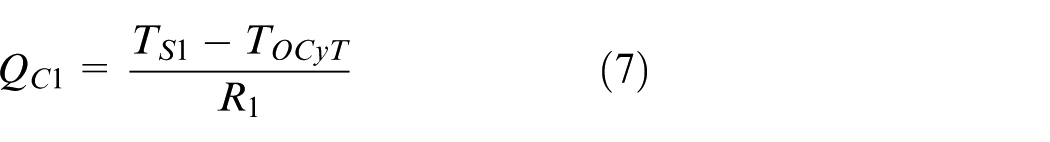
Therefore
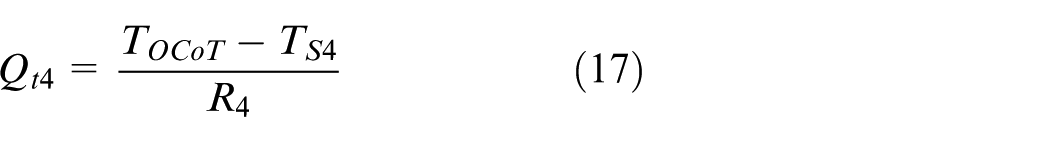
Heat distribution in the CoT
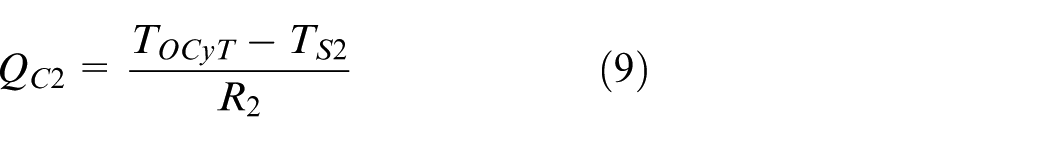
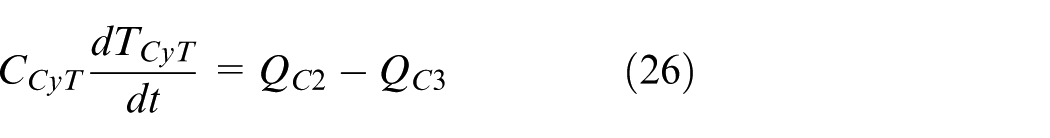
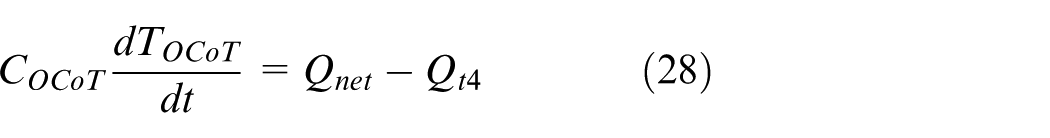
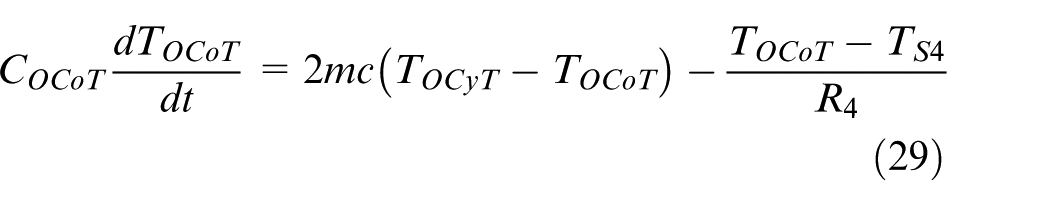
The net heat entering CoT will be equal to heat stored in the CoT and the heat removed from the HPCyT by forced convection. Stored heat of the fluid inside the CoT is described by the equation (28)
Heat stored in the body of the CoT is expressed by equation (30)
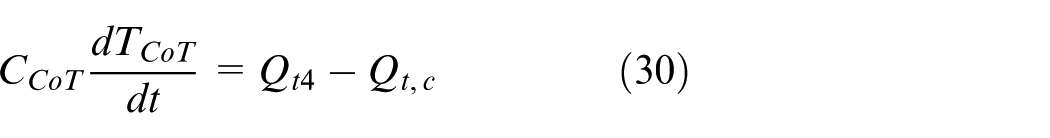
where
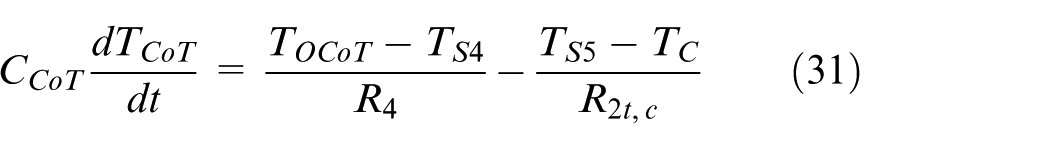
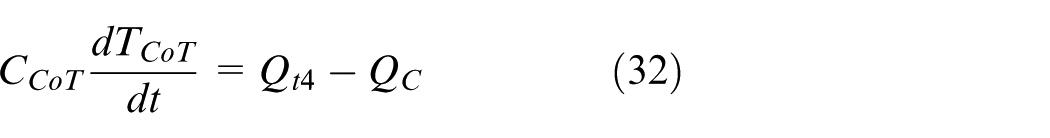
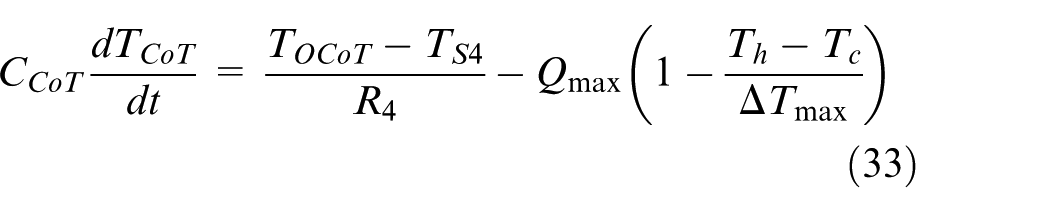
Because
Thus, the modified form of equation (30) is as follows
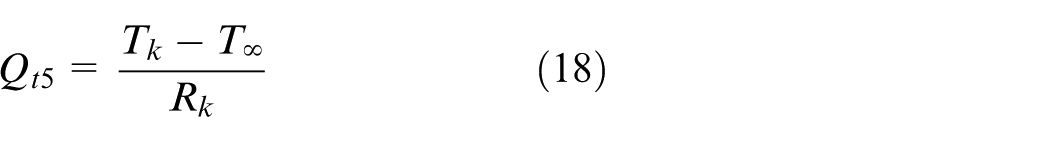
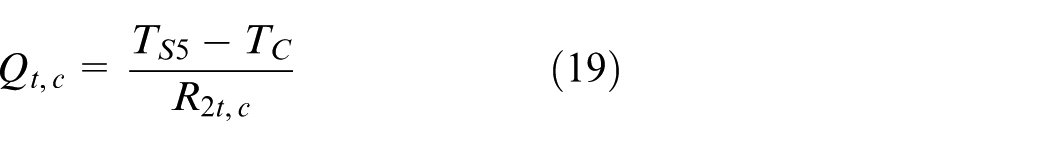
Heat stored in the cooling fins
Expression of heat transitions in terms of state equations for the system is as follows.
Assumptions


and the empiric equation for the temperature gradient is
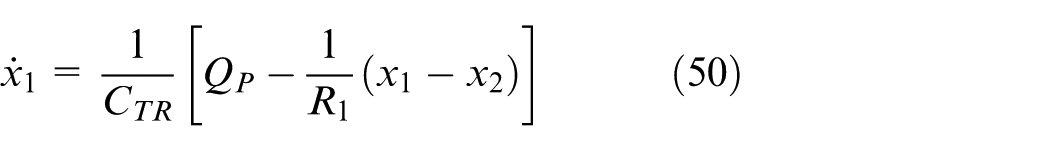
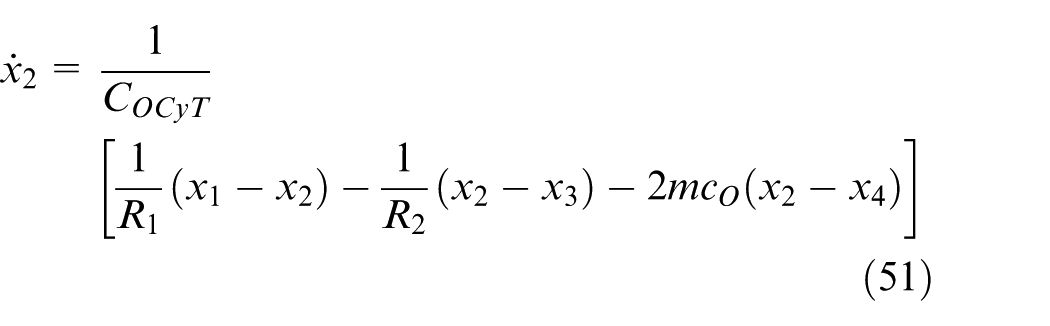
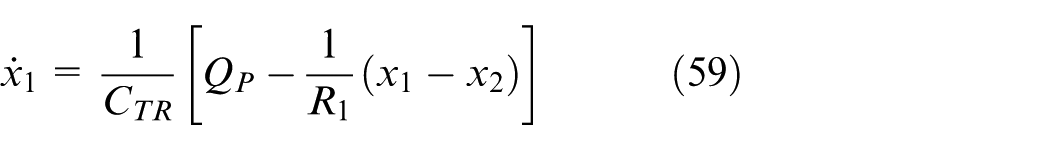
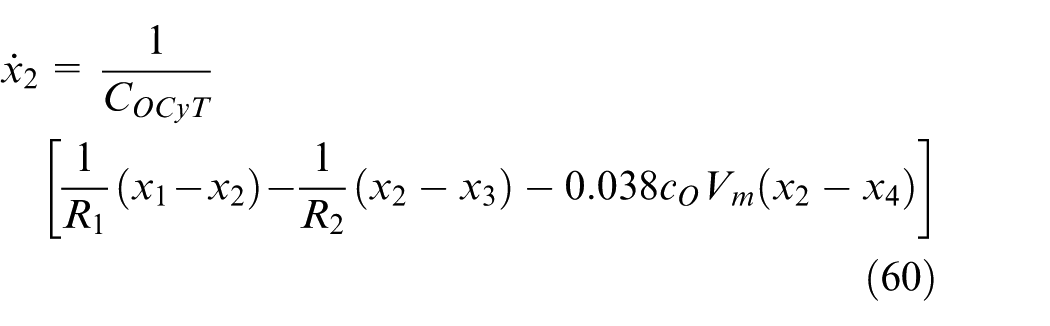
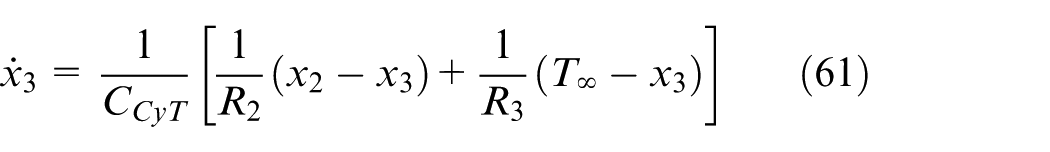
HPCyT and CoT equations are expressed in terms of state variables, respectively
And CoT equations become
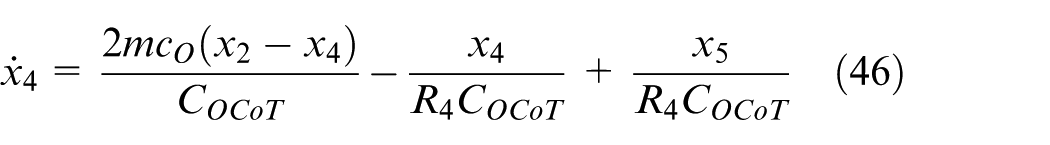
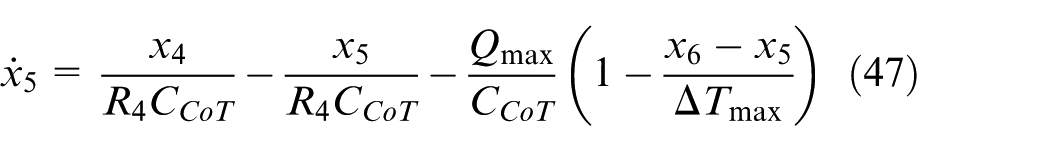
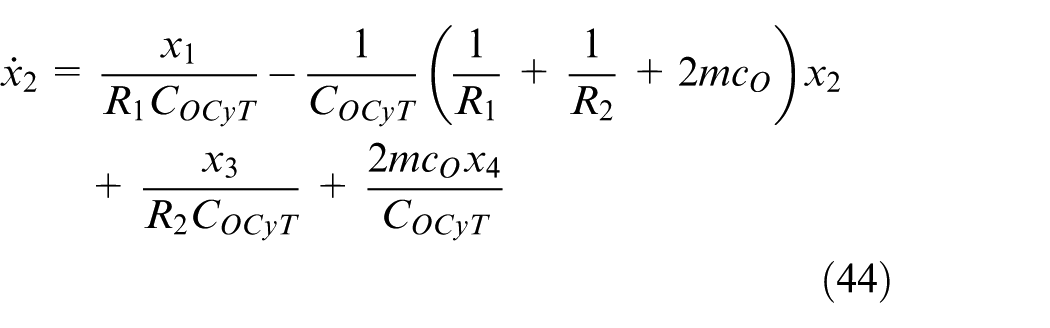
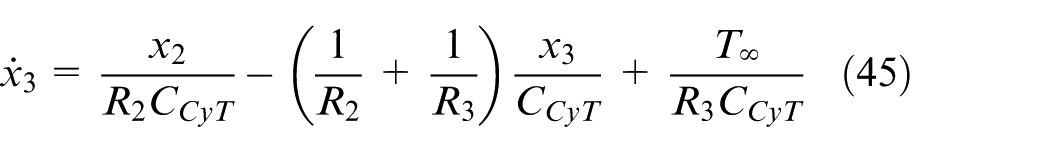
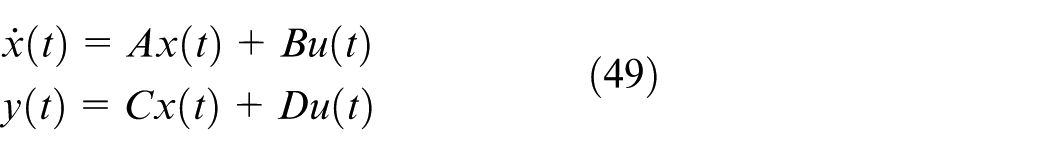
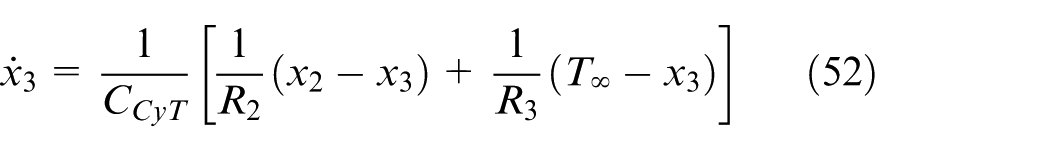
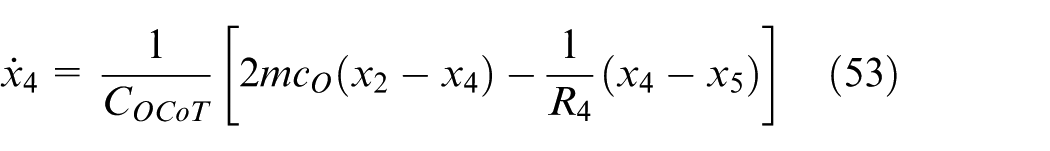
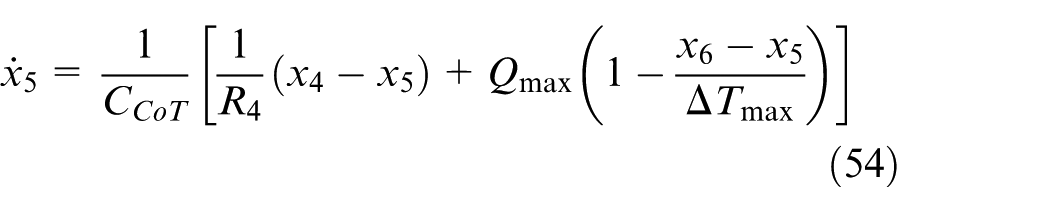
Here, general expression of system’s dynamic equations is
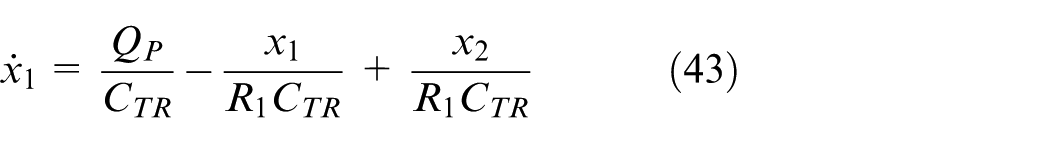
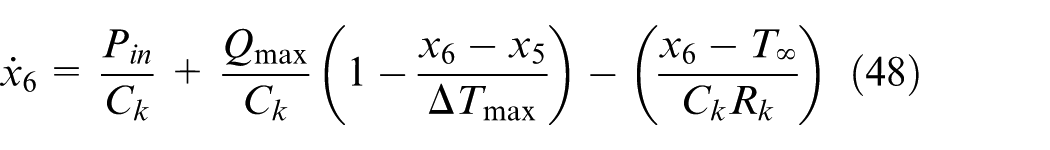
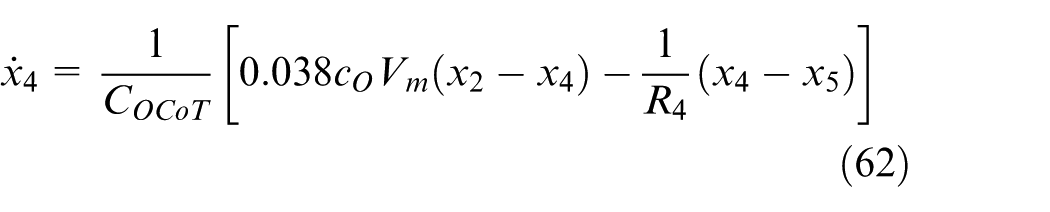
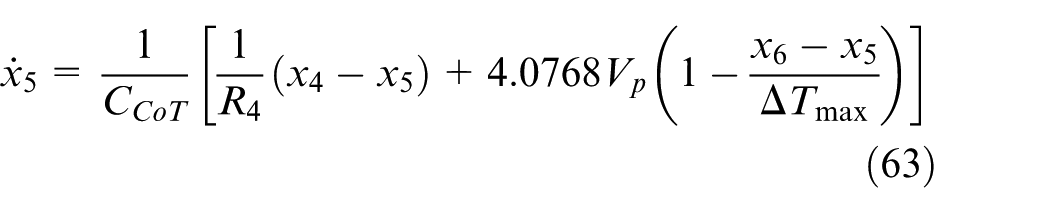
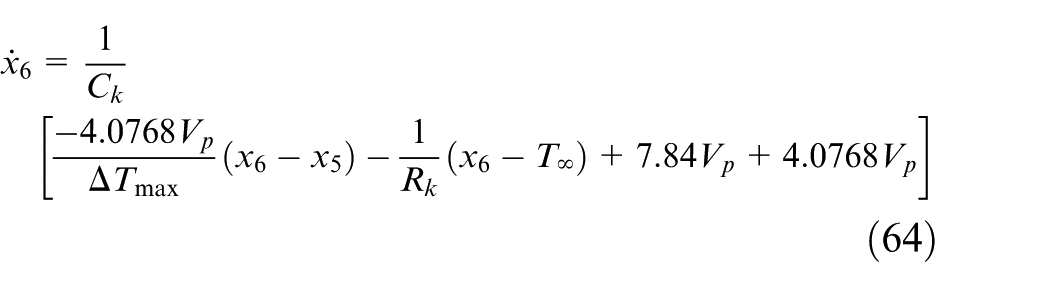
For convenience in representation of the Matlab Simulink blocks, state-space equations of the heat model are modified as follows
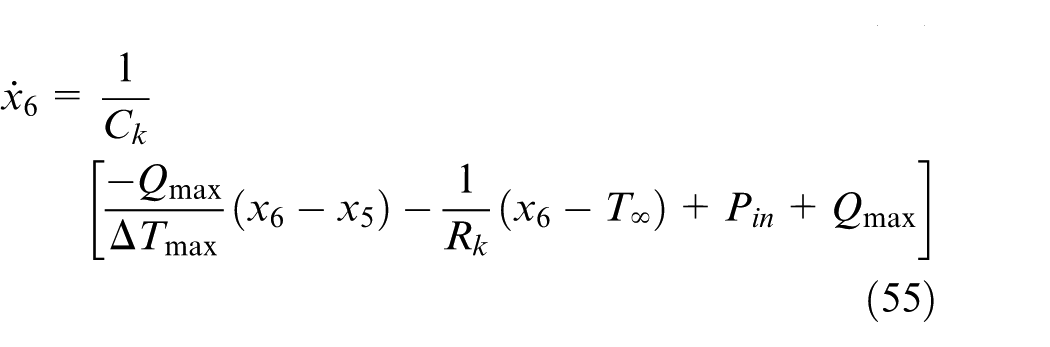
The Pin power is applied to the Peltiers. Resistors of the Peltiers are about 5.57Ω. Vp varies between 0 and 14 V. Thus, Pin is between 0 and 78 W. The motor’s mass flow rate
K18 = 0.228/12 = 0.019. Thus, m = 0.019

2.

Thus, equations are reinterpreted as
As output, the temperature of the oil in HPCyT where the resistances are found is taken as T2, and the TD along the resistances is taken as Tupper − Tlower. The Simulink model based on the equations provides viability of the model in terms of prescription blocks that illustrate the physical relations between the variables. 38 The Simulink equivalent block model is shown in Figure 4.
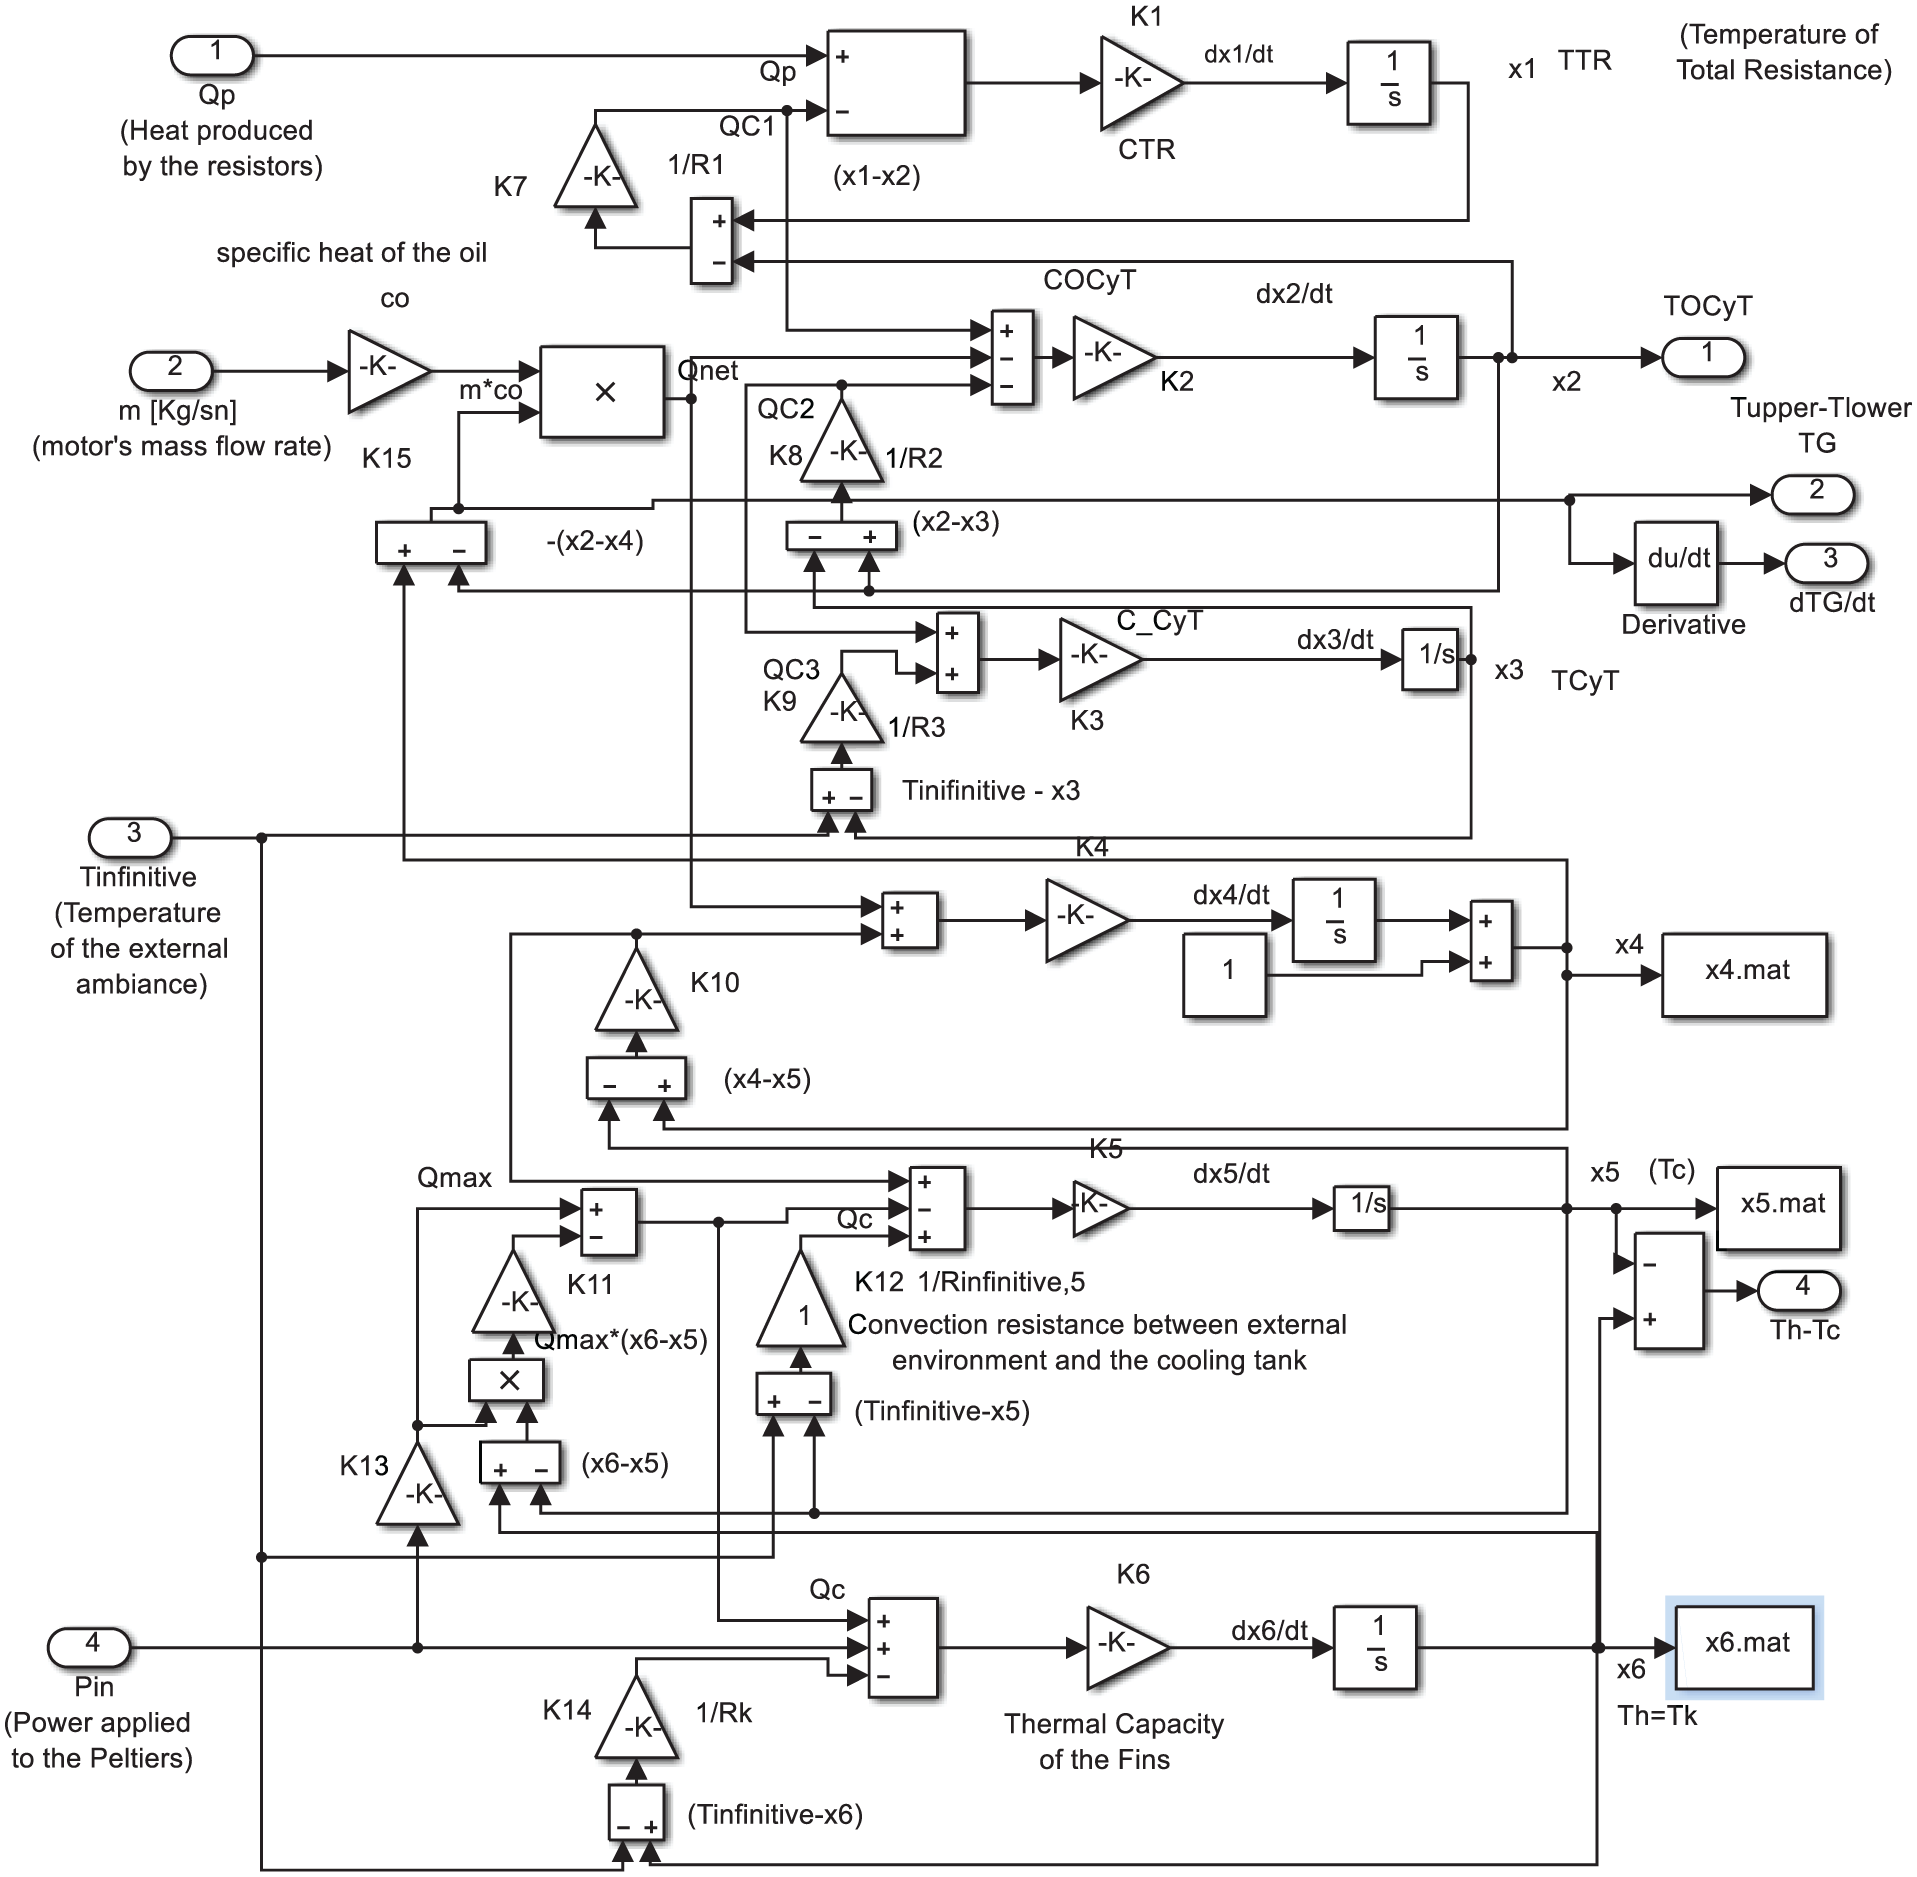
Equivalent Simulink block diagram of the system.
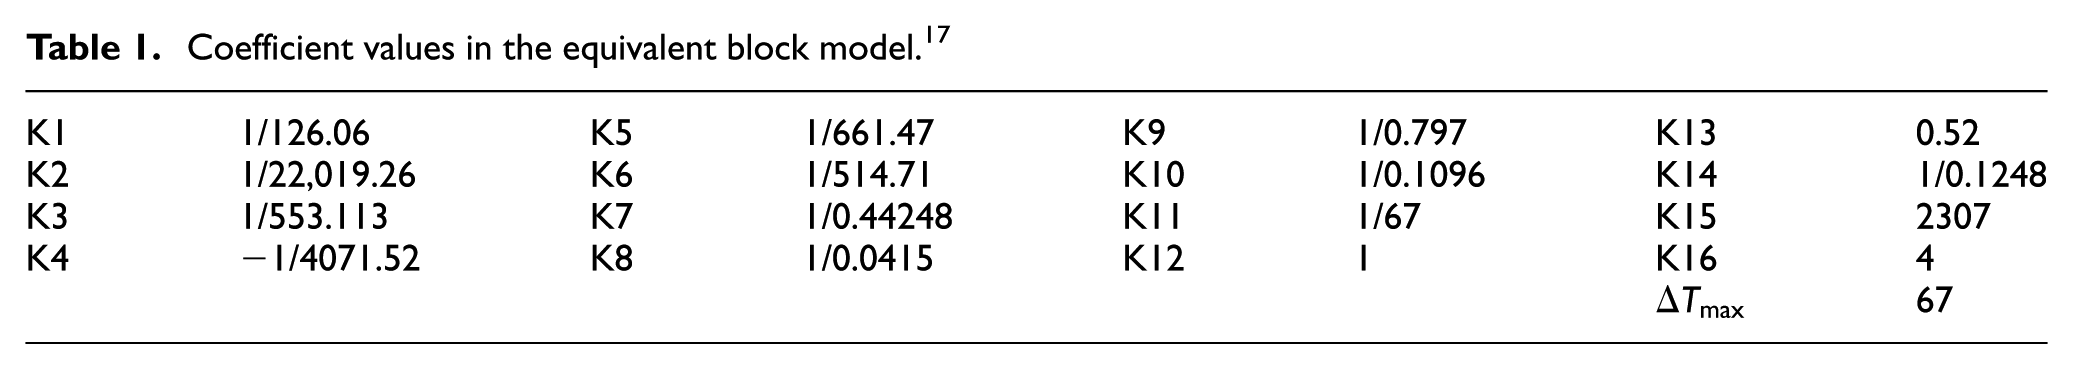
The coefficient values of the equivalent block diagram are given in Table 1.
Coefficient values in the equivalent block model. 17
Control methods
PID and fuzzy methods carry out the process to determine the suitable control for the system.
PID (three terms) control method
The PID control algorithm is composed of three parameters: Proportional (P) + Integral (I) + Derivative (D) terms. 39 The P parameter defines return to mentioned error where the I defines the response to the sum of recent errors and the D defines the reaction to the error rate. Total reaction of the PID adjusts the output of the system to the desired value.
Fuzzy control method
Fuzzy control generally deals with control of complex non-linear systems, which are hard to express by accurate mathematical models.40,41 FIS is a linguistic instruction–oriented system which is composed of fuzzification, fuzzy decision-making (conjunction of the antecedent propositions refers to their supporting degrees and implication of consequent results), aggregation of the results in a output set and defuzzification of the output fuzzy set (Figure 5). Outputs of the FIS systems command both the Vp and the Vm.
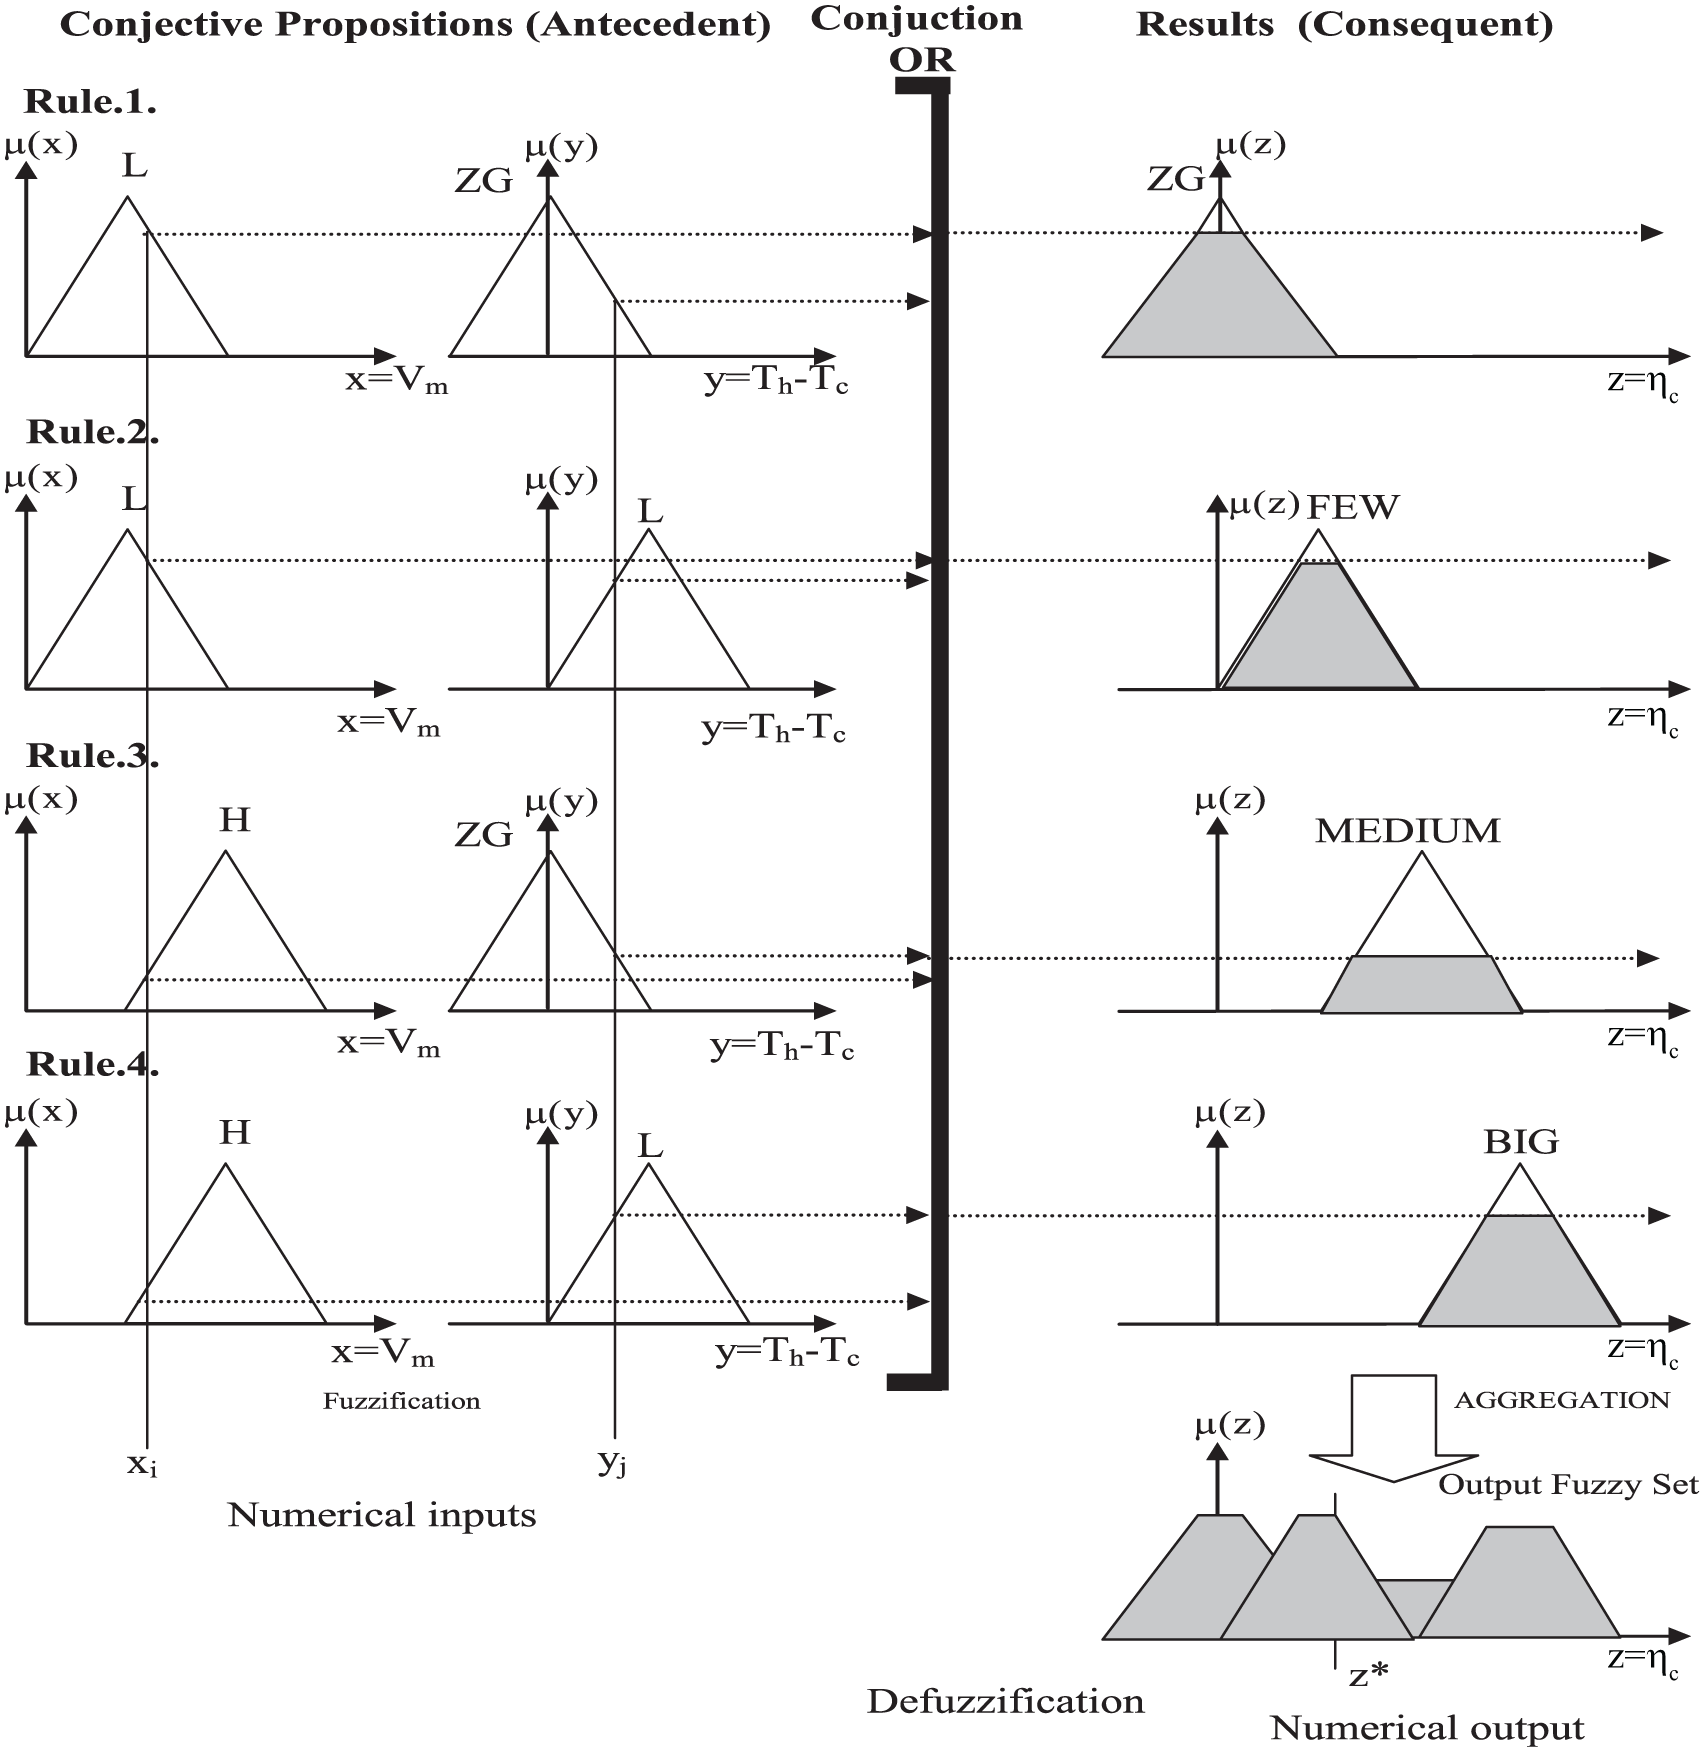
Graphical representation of an example of Mamdani-based FIS. 41
Design of the controllers
TD controller adjusts Vp between 0 and 14.5 V and yields an amount of Qc between 0 and 136 W. VTG controller regulates Vm between 0 and 12 V and convects oil within a rate of v between 0 and 0.228 kg/s. Reduced VTG and TD allows appropriate conditions for precise measurements. 10
Design of TD controller
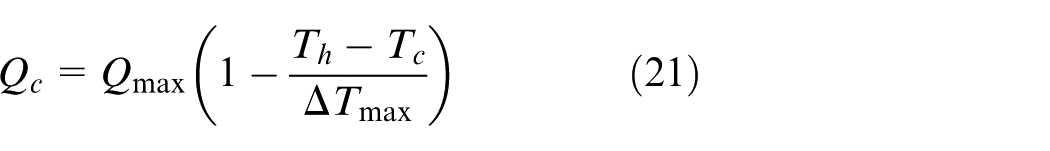
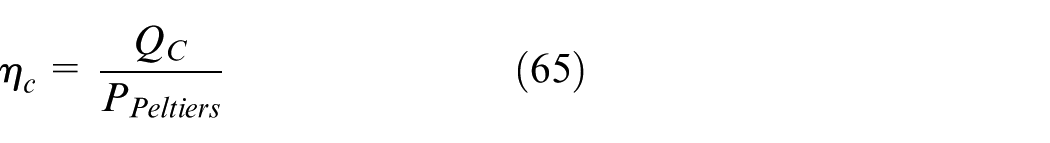
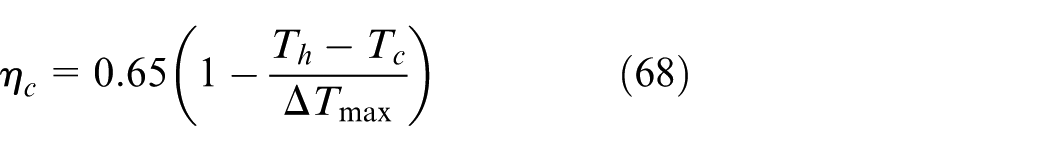
In the first stage, ηc should be determined: ηc (equation (2)) could vary within 0–0.65 rates, and together with TD, they determine Vp 17
Since RPeltiers≅ 1087 Ω then

In order to reduce TD around zero, necessary voltage will be about
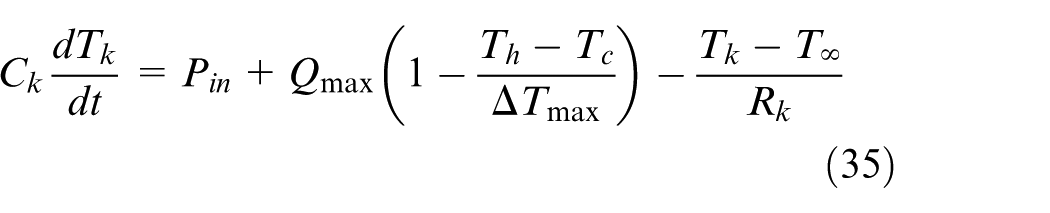
ηc is a function of the Peltiers Th − Tc, and ΔTmax is 67 °C 36
PID TD controller design for the system is proposed in detail. 17
Fuzzy TD controller design
The empirical interpretations of the experiments point out that ηc is a non-linear characterization of v and Th − Tc where T∞ is 24 °C and QR = 2.5 W. 17 Processing regions of Vm and its corresponding v are 4–8 V and 0.076–0.152 kg/s, respectively. Higher speed results in rising of heat caused by increasing friction. ηc should be revised as ηcTotal after taking QR and Qm effects into account (Figure 6).
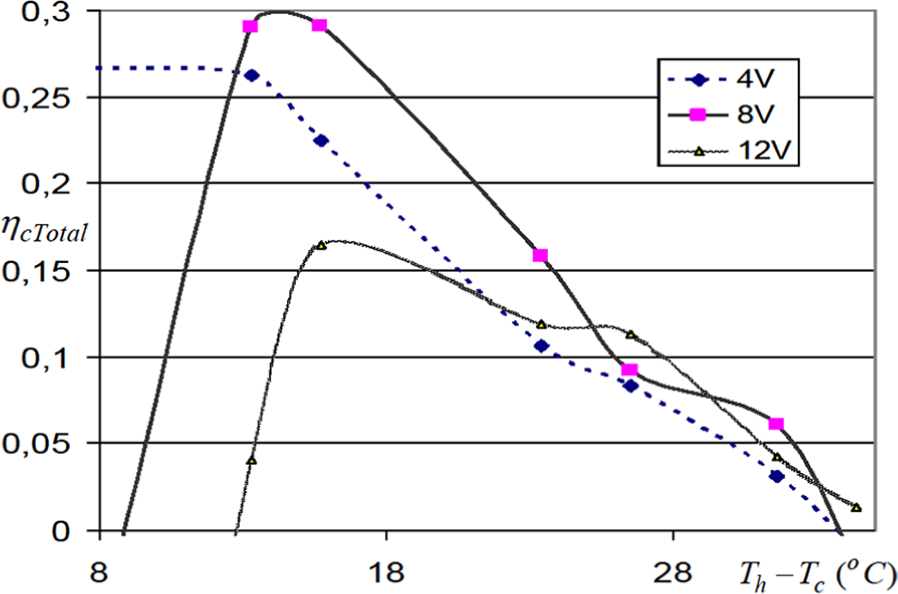
Experimental observations that illustrate relation between Th − Tc and
Instead of the linear relation given in equation (26), the empirical relation can be realized by means of fuzzy rules.
Therefore, a fuzzy rule base, which describes the non-linear relation, could be derived based on Figure 6 as shown in Table 2.
Rule base that determines relation between
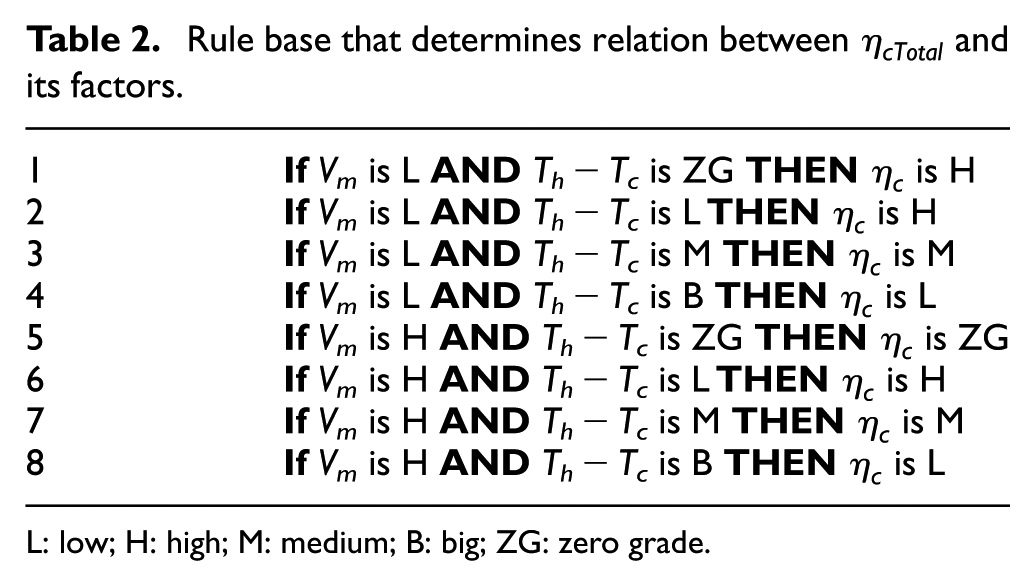
L: low; H: high; M: medium; B: big; ZG: zero grade.
The relation between controller output Vp, and inputs
Rule table of changes in Vp due to TD and
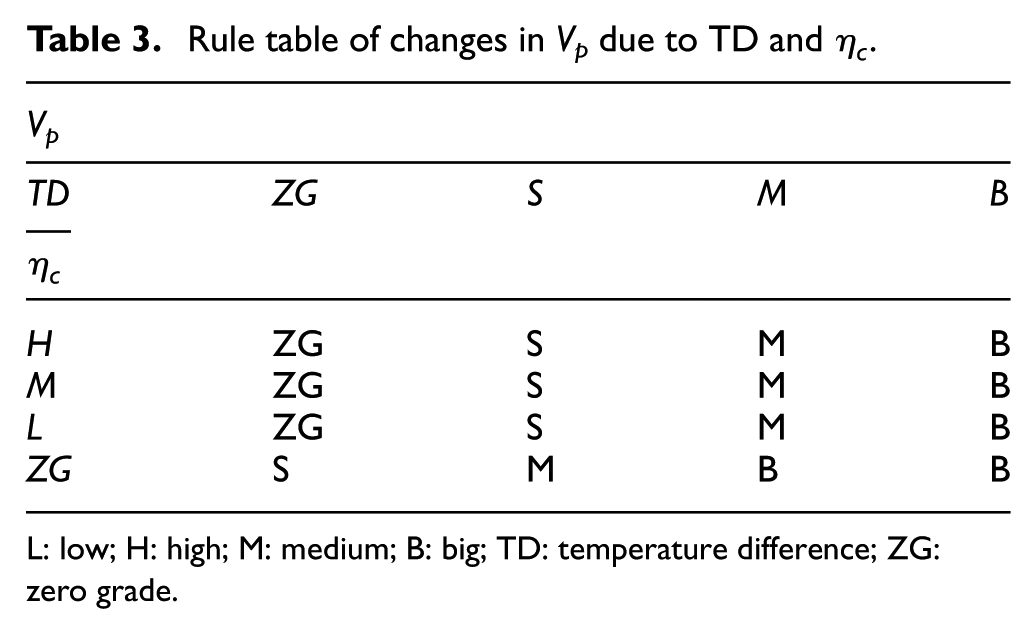
L: low; H: high; M: medium; B: big; TD: temperature difference; ZG: zero grade.
When we interpret the first rule, “IF TD is Zero Grade AND ηcTotal is High (This means Vm is Low AND Th − Tc is Zero Grade) THEN Cool around Zero”
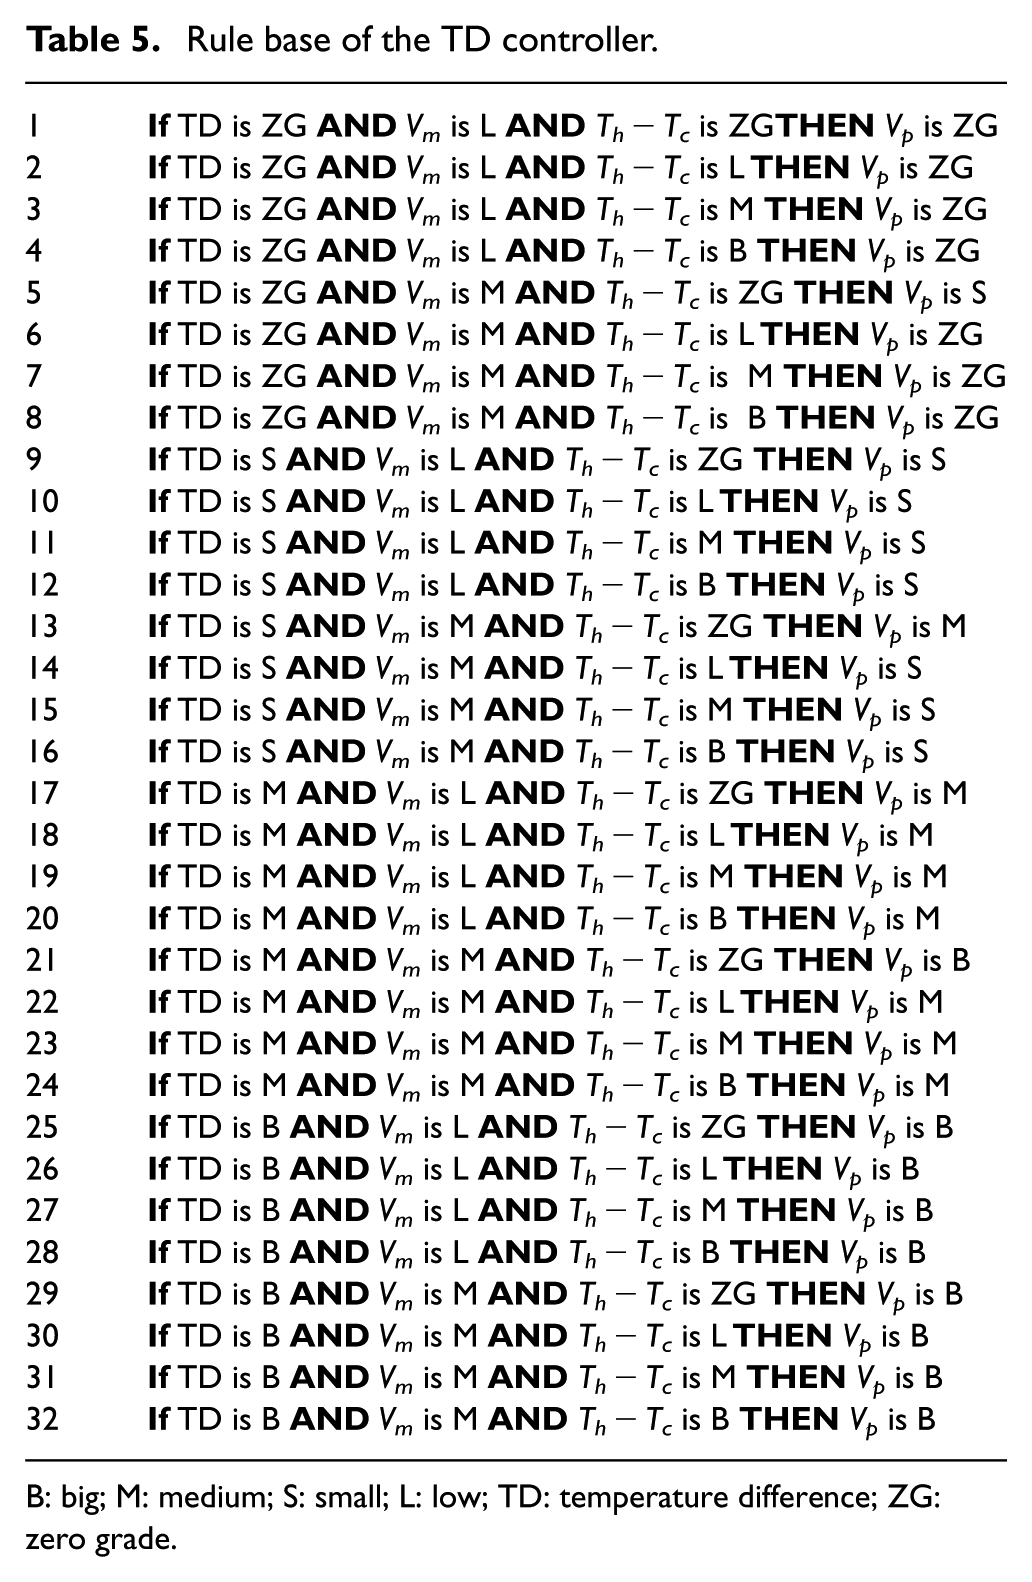
Table 5 is derived by means of locating Table 2 in Table 3. Input variables concerned with the TD controller are given in Figure 7. Corner membership functions (MFs) are represented by means of trapezoidal functions, where interiors are represented by means of triangles. Input variables TD, Vm and Th − Tc are composed of four, two and four MFs, respectively. Operating band, B, for the controller is optional but generally selected as 1 °C out of where it operates in on-off mode.
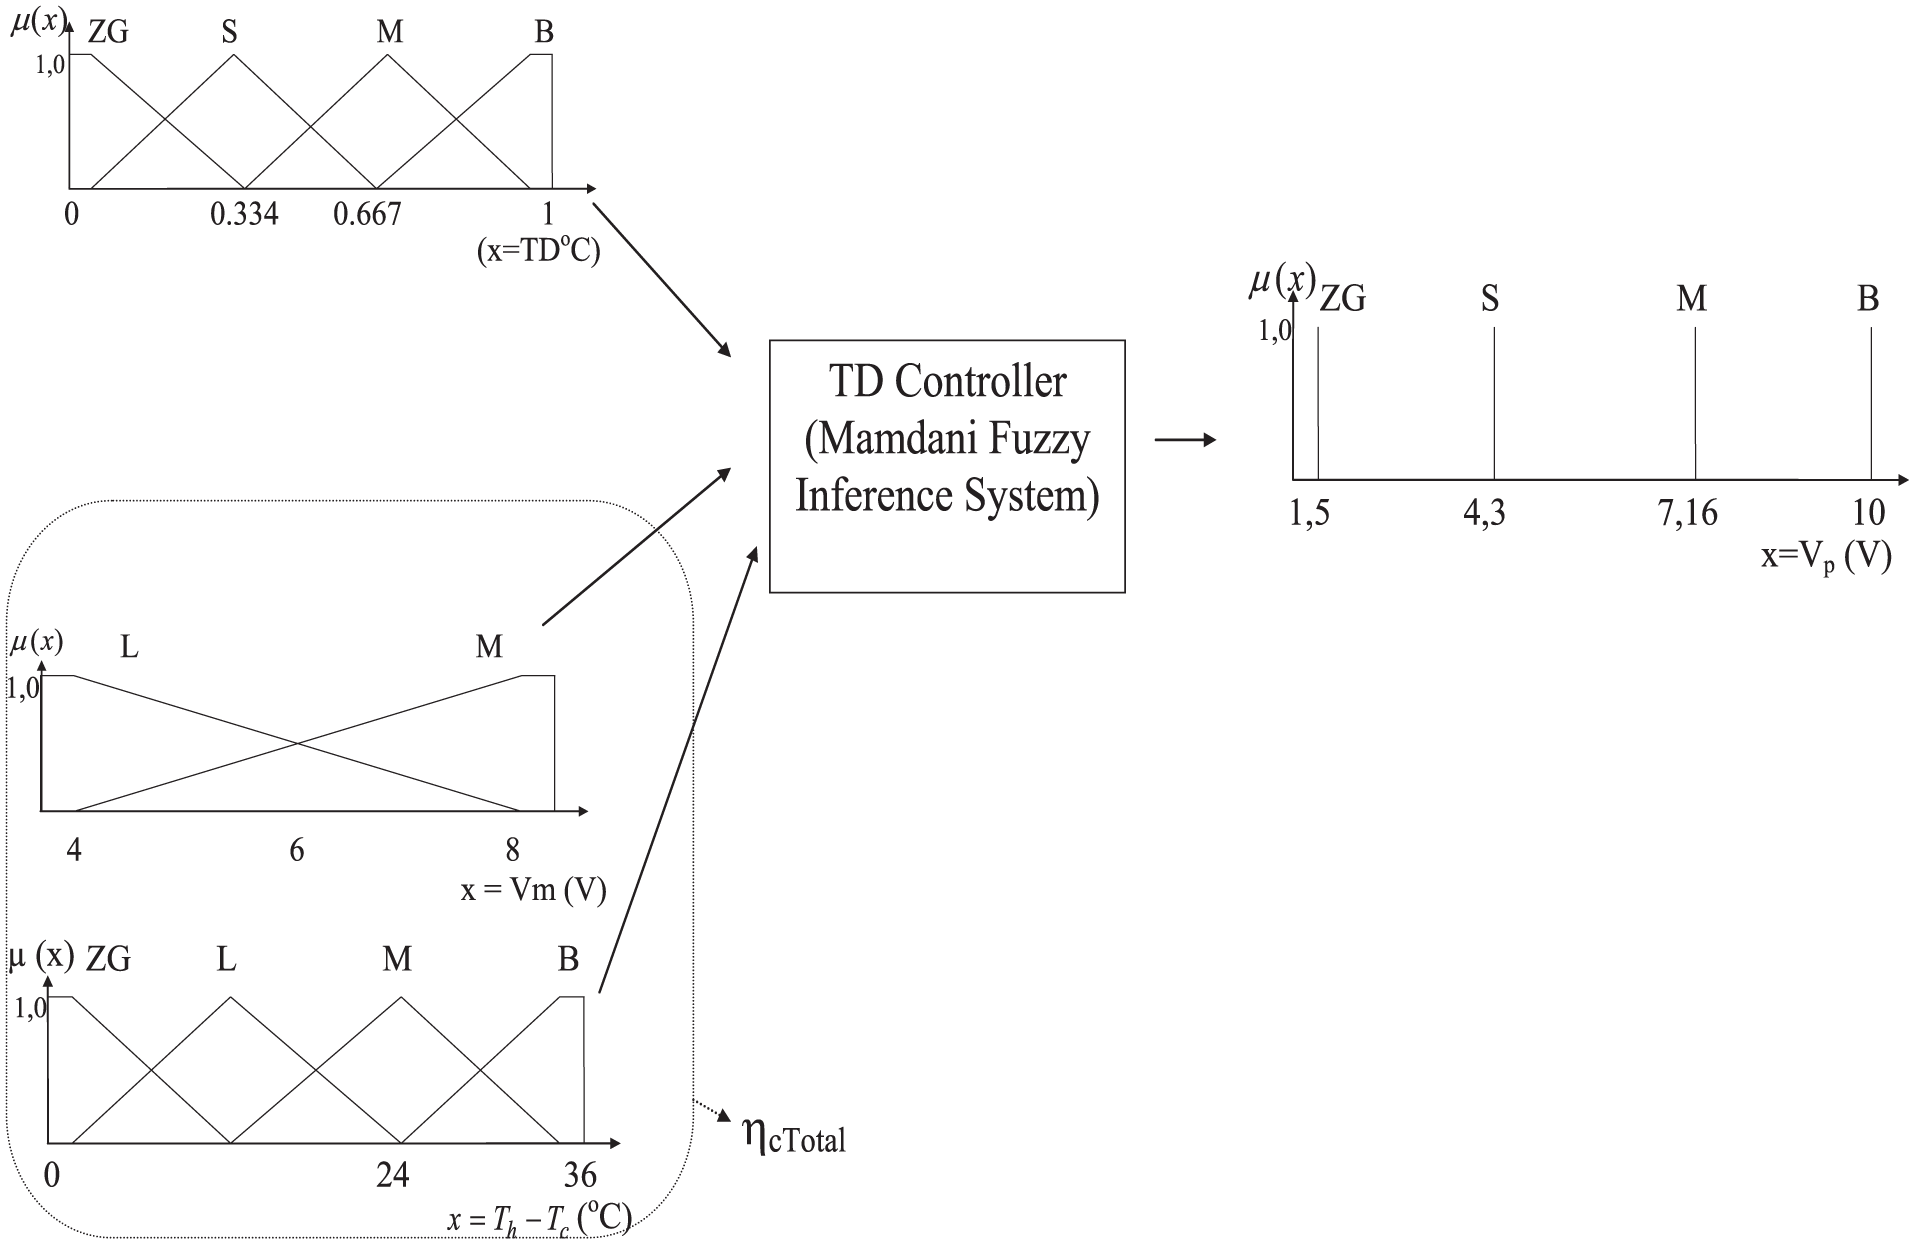
Fuzzy TD controller.
Shape of the output MFs plays fewer roles on the output than input MFs, rules and defuzzification methods. 42 Therefore, output variable is composed of four singleton MFs which make our program 43 simpler.
Rules agreed in Table 5 given in “Appendix 2” are set by means of experimental try-and-faults to accomplish the results of the non-linear behavior. In this way, the fuzzy TD controller determines a convenient control Vp (Figure 7).
Fuzzy VTG controller design
Length of the TR block and amount of the self-heating effect determines the VTG.7,10 In this study, VTG is reduced by controlling the Vm which provides a forced convection against natural convection of the OCyT caused by the QR. Lesser v below 0.076 kg/s, natural convection dominates the forced convection and rises Tupper (Figure 8). Contrariwise, v over 0.152 kg/s reverses the convection and OCoT cooled by the Peltiers dominates on Tupper and brings VTG about negative values.
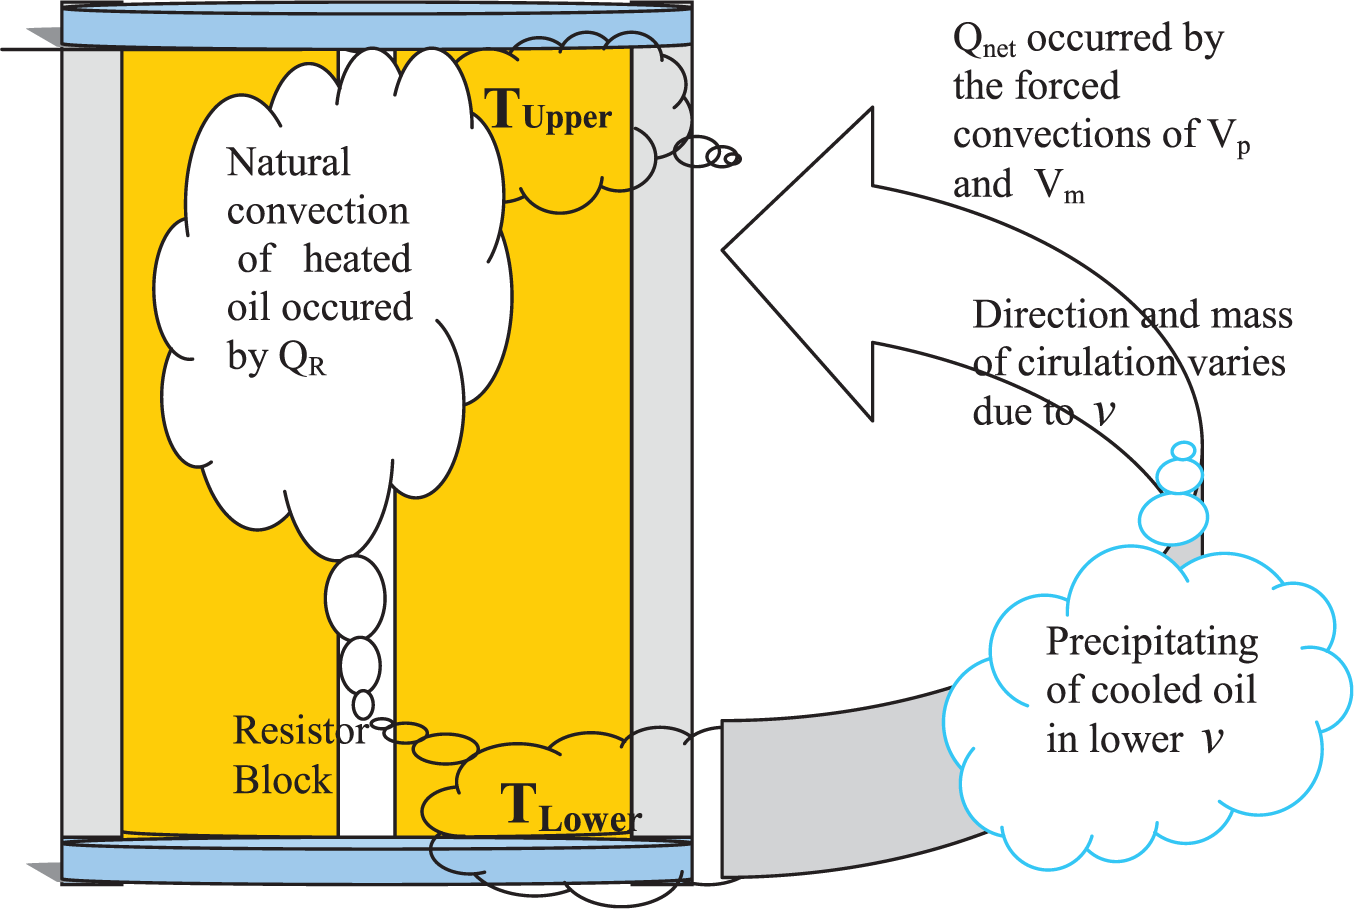
Illustration of convection loop of heat and its corresponding VTG refer to v.
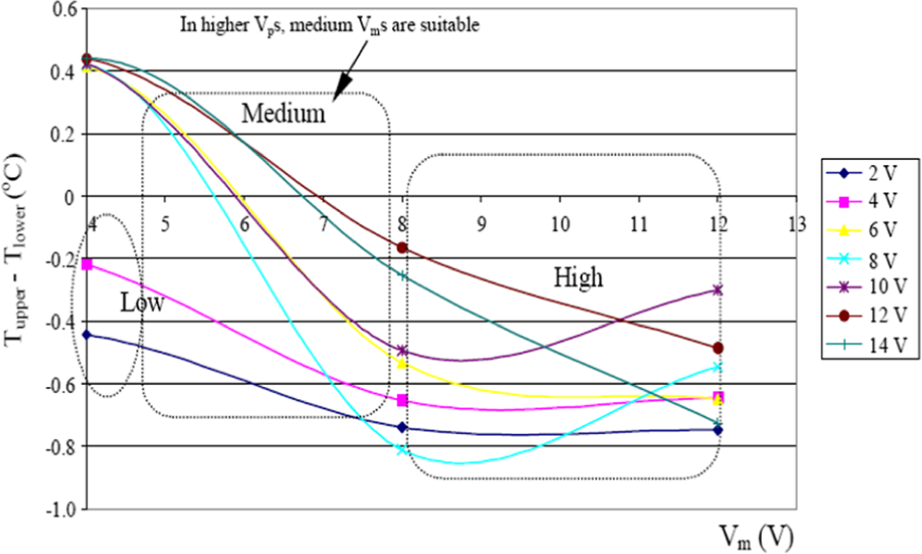
The v should operate within the mentioned values, and their corresponding voltages are within 4–8 V. Variation curves for VTG versus Vm and Vp are depicted in Figure 3 which commented and guided to fuzzy rules. For example, for lower Vps around 2–4 V, Vm is reduced to maintain VTG around zero. On the other hand, for increased Vp within 6–14 V range, just medium Vm could minimize the VTG. 17 Proposed input and output fuzzy variables for the VTG controller are shown in Figures 9–11.
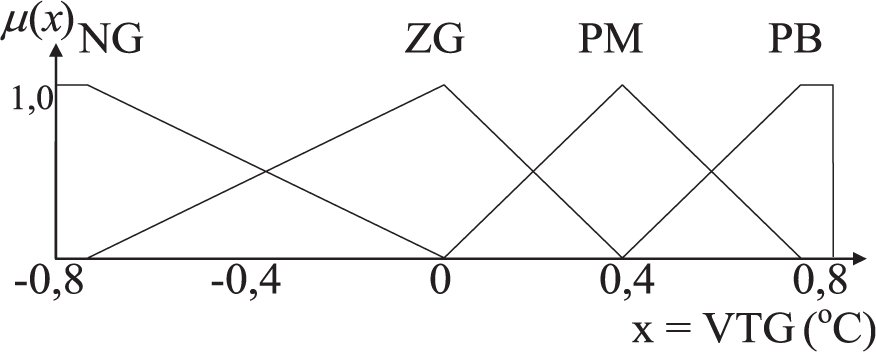
Membership functions of the input variable VTG.
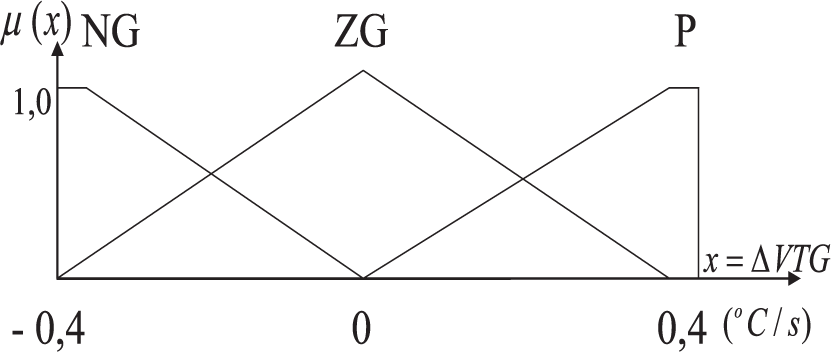
Membership functions of the input variable
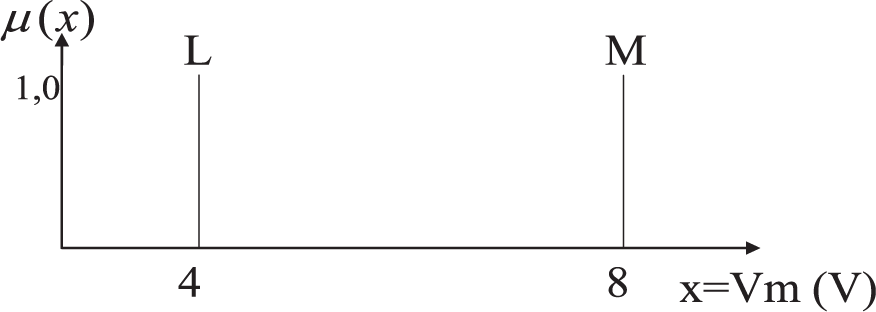
Membership functions of the output variable Vm.
Fuzzy rules are established due to status of the variables: VTG and its derivative
Rules are given in Table 4.
Rule base of the VTG controller.
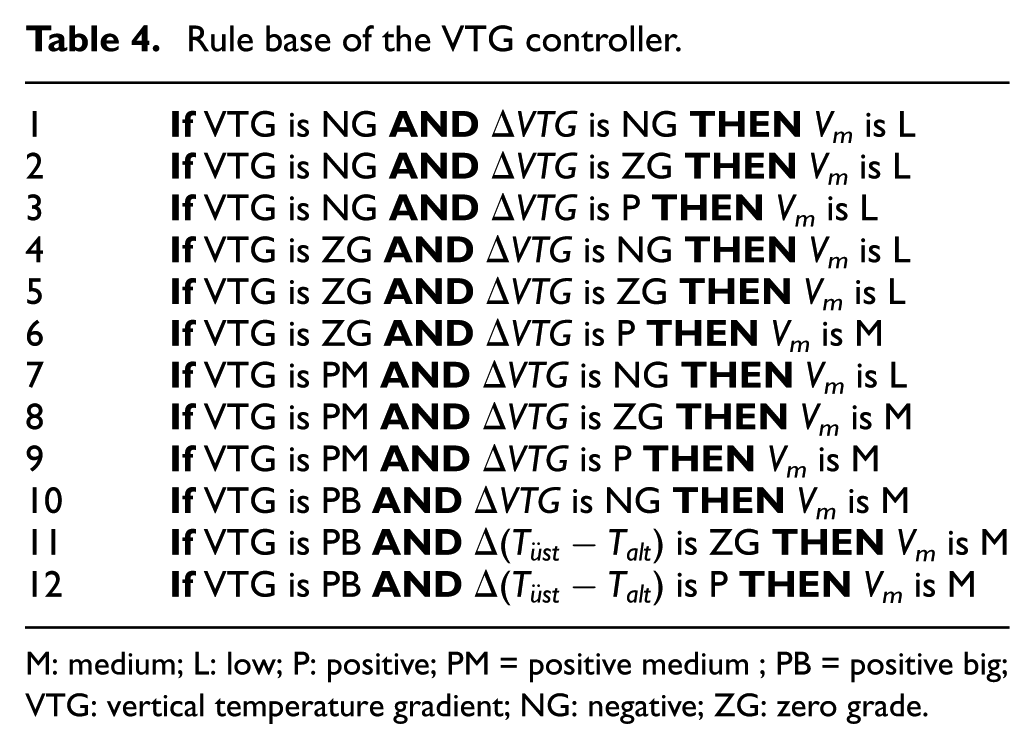
M: medium; L: low; P: positive; PM = positive medium ; PB = positive big; VTG: vertical temperature gradient; NG: negative; ZG: zero grade.
Programs developed for the system
Fuzzy and PID control program is developed in Delphi 5.0. 44 Programs and their flowcharts are explained in previous studies in detail.43,45 Simulation programs are developed in Matlab Simulink. In the fuzzy program, min functions are used for AND and IMPLICATION operators. Sum function is preferred for simplicity in AGGREGATION operations 46 and center of gravity is used as DEFUZZIFICATION method. 42
Simulation model of the control process
The experimental results of the control processes are thoroughly discussed. 45 Scope of the study is heat and mass transfer modeling of the system and comparison of its performance with that of the real-time results: Both PID and fuzzy control methods are applied to the system and to the model. Simulink block diagram (Figure 4) is embedded as a subsystem to the control system model given in Figure 12. The model allows switching between PID and fuzzy control methods. However, the study is focused on fuzzy control results of the actual system 45 and the simulation results of the model. Fuzzy control blocks are essentially attached to Matlab Simulink models and allow design process being shorter. 47
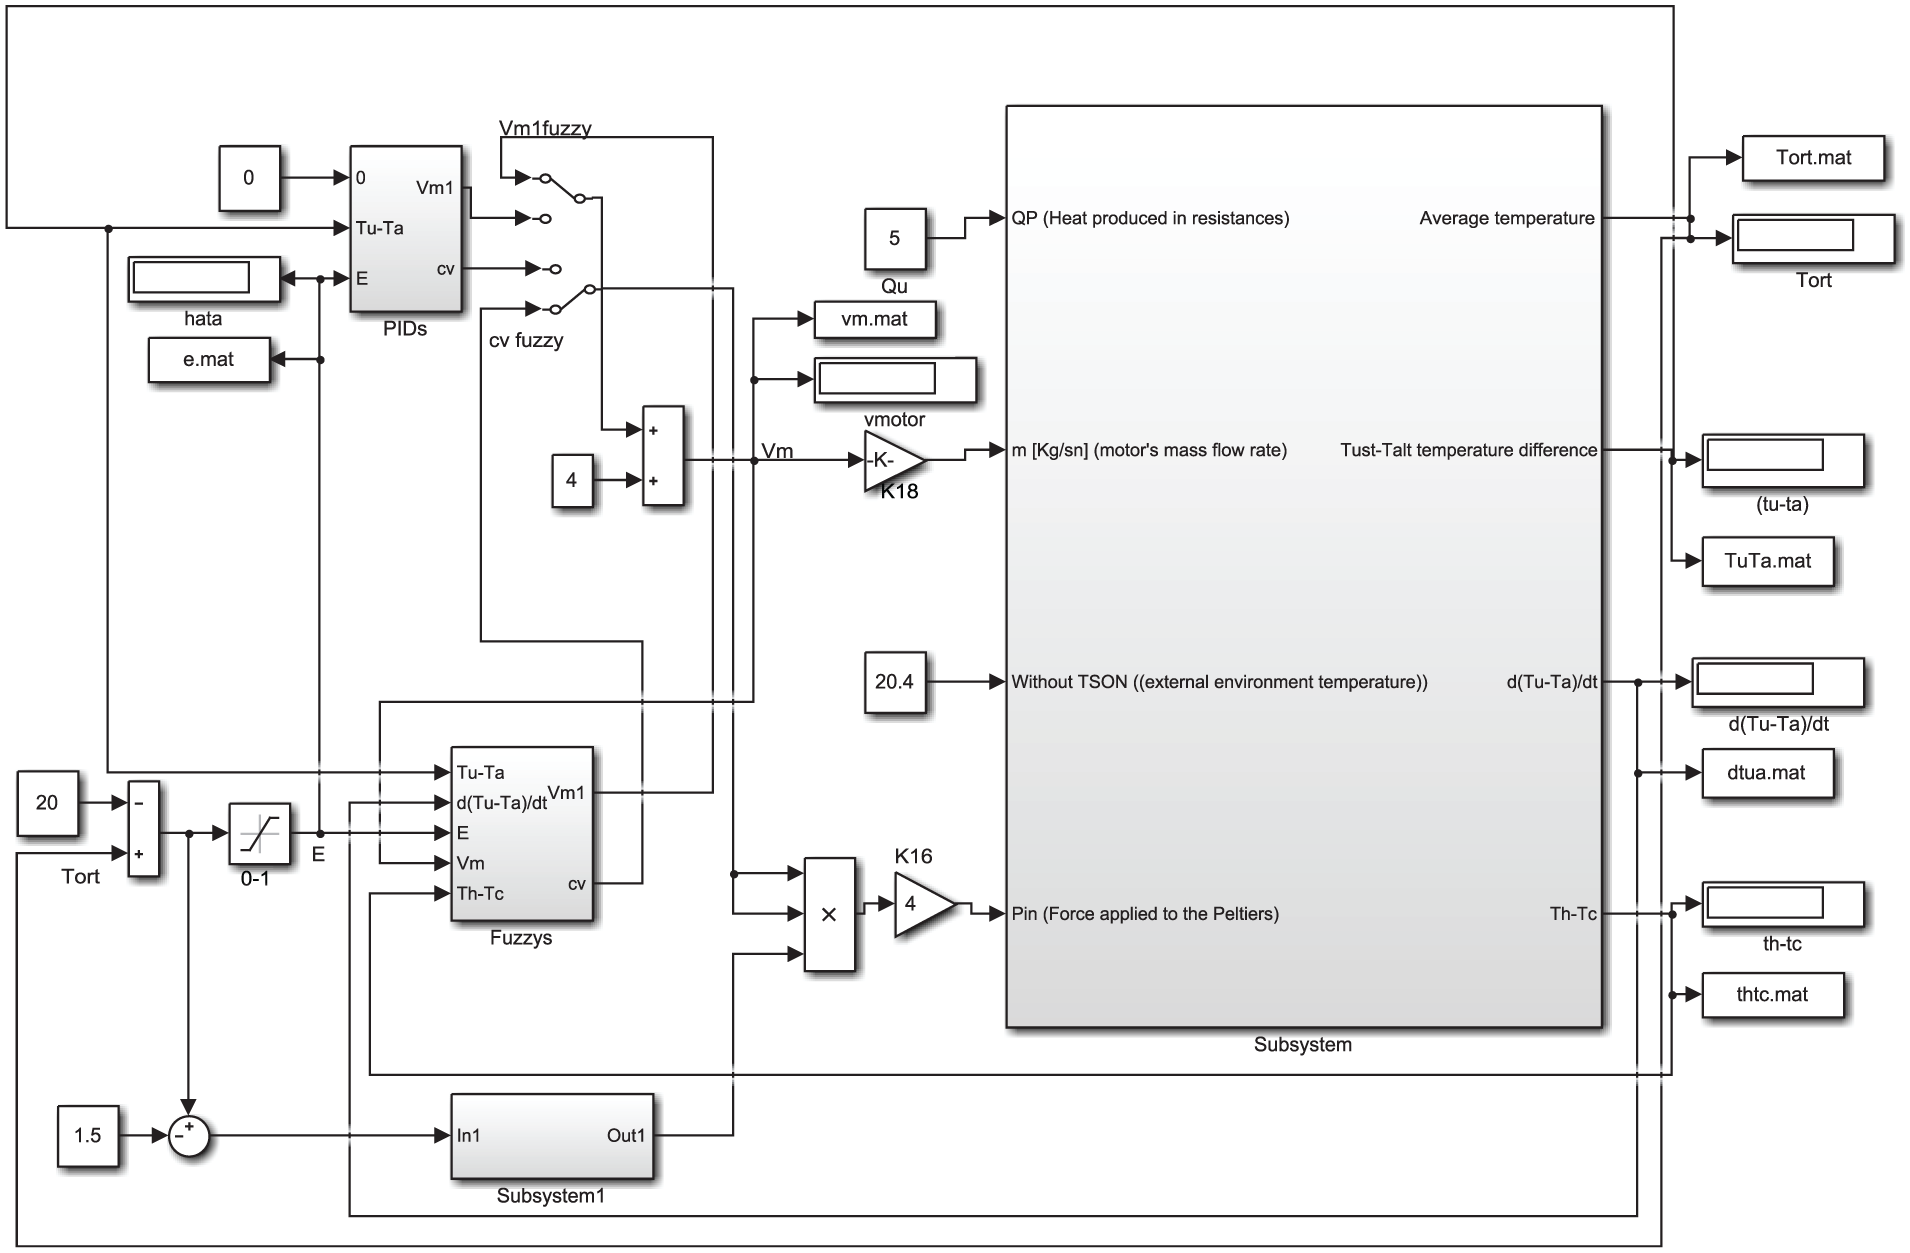
Simulink block diagram of the general feedback control system.
Results and discussion
Fuzzy control software prepared uses the sum-min method as a fuzzy inference method (OR and AND methods, respectively) and the center of gravity method for defuzzification processes. Minimum and maximum functions are utilized for implication and aggregation methods, respectively. 46 The same methods and parameters are used both in experimental and simulation applications.
In the fuzzy TD controller; eight rules are inherently active at the same time, and their defuzzification results determines and drives Vp. Similarly, four rules are simultaneously active for the VTG controller and drives Vm. The set value of the TD is 19.5 °C, and set value of the VTG is 0 °C.
Actual and simulation of fuzzy control results of the TOCyT is shown in Figure 13. Actual system and the model reach to the set value in 60 and 35 min, respectively. Around 0.2 °C of steady-state error occurred in the model response.
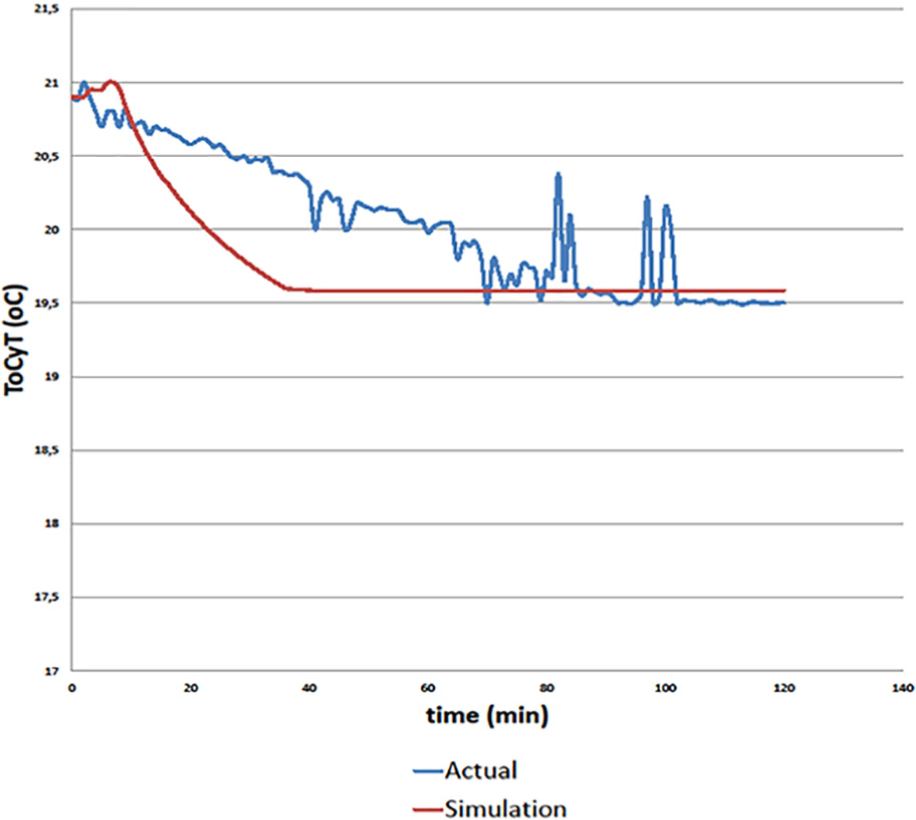
TOCyT time response for actual 45 and simulation of the system control.
Actual system yields an undershoot around 82nd minute, which is arisen from unpredictable turbulences in the circulation of the oil against natural convection. However, model follows general trend of the actual system. Actual TOCyT is obtained by average of measured data from Tupper (Figure 18) and Tlower (Figure 19) sensors (equation (2)) where the simulation model yields TOCyT in reference to its differential estimation, x2 (integration of equation (60) in Figure 4).
Since TOCyT should follow an average trend similar to as that of Tupper and Tlower, their graphics are given in the Appendix 2: Information acquired from Tupper and Tlower sensors is monitored in Figures 18 and 19, respectively. It is clear that the turbulence is originated around the Tupper sensor, which forced convected OCoT from the CoT, faced of heated OCyT risen by natural convection in the CyT.
Simulation results of Tupper and Tlower are shown in Figures 18 and 19. Tupper and Tlower values are important for determination of VTG and for adjusting the Vm. The results, which indicate the heat and mass transfer behavior, are approximately imitated by the proposed model.
In the controller section, Vp determines TOCoT. In this purpose, efficiency,
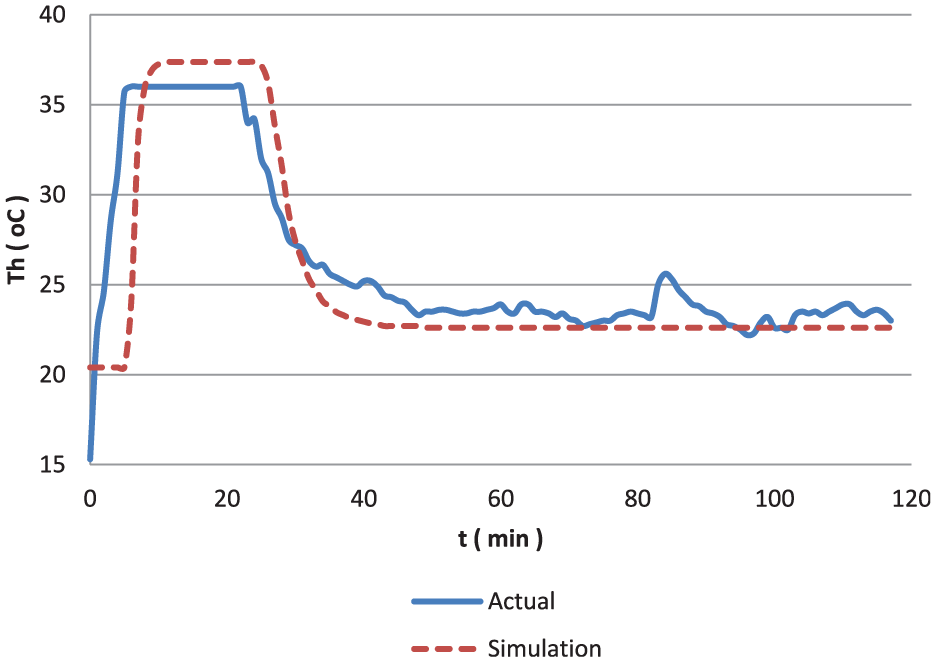
Time response of Th for actual 45 and simulation of the system control.
Th in the simulation model is derived from equation (60) (Figure 14(b)). Following an equilibrium situation, Th follows a trend corresponding the TD fuzzy logic controller (FLC) voltage, Vp, which is acquired from DAC card of the computer (Figure 15(a)) and drives the Peltiers. When TD exceeds 0–1 °C band, the controller behaves as on-off.
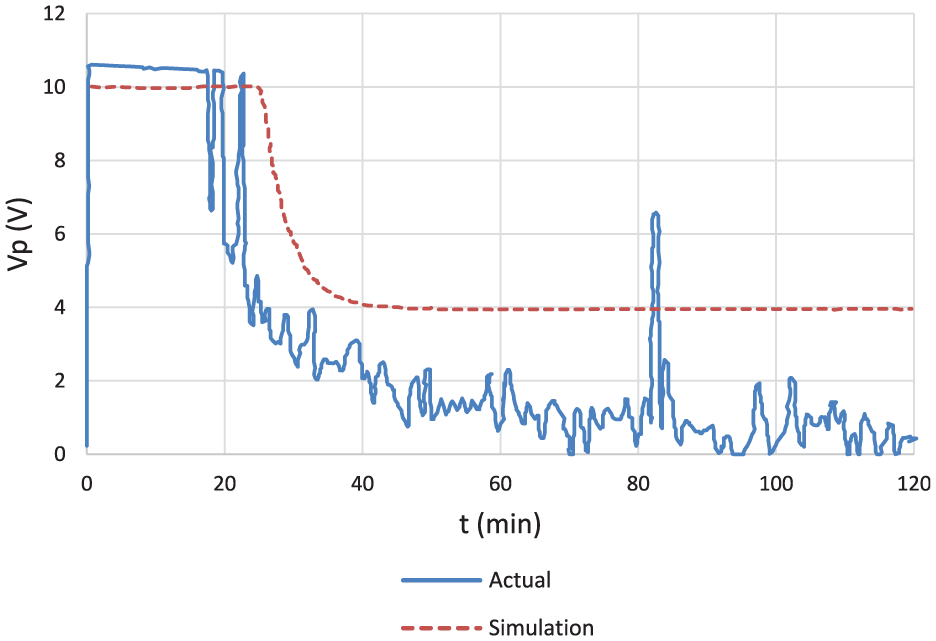
Vp time response for actual 45 and simulation of the system control.
TD FLC of the model behaves similar to the actual system. Second FLC controller feeds back Tupper − Tlower VTG (Figure 16(a)). Referring to the acquired VTG and its derivative, Vm is controlled (Figure 17(a)). By means of the FLC VTG controller, VTG does not exceed ±0.5 °C.
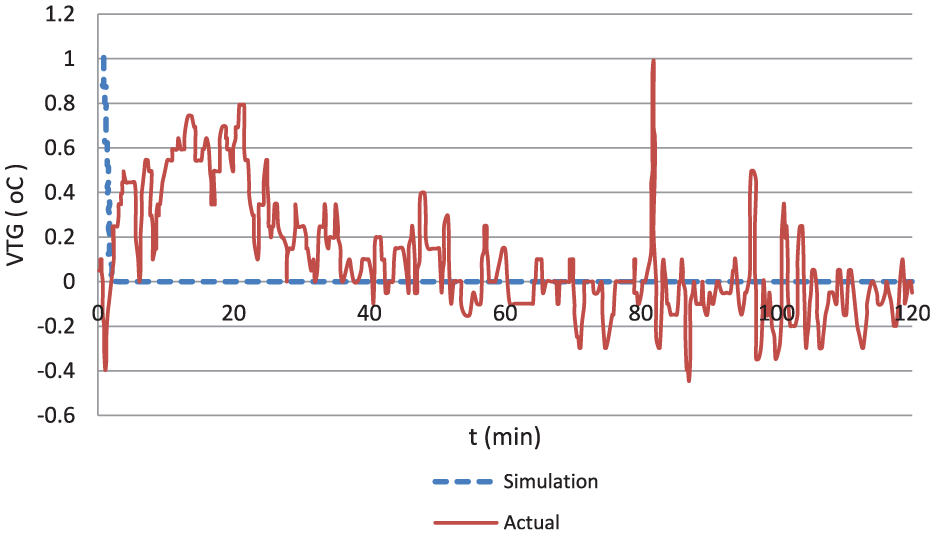
Tupper − Tlower VTG time response for actual 45 and simulation of the system control.
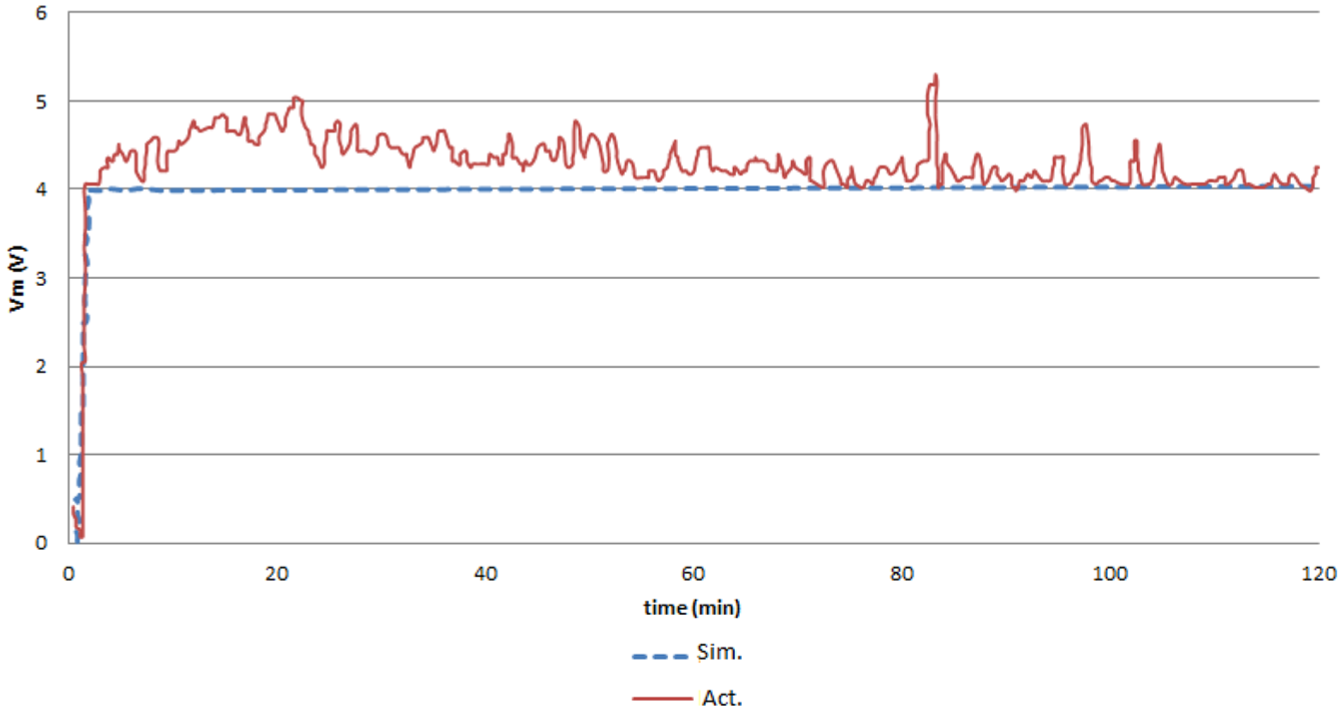
Vm time response for actual 45 and simulation of the system control.
Similarly, simulation model keeps VTG around zero (Figure 16(b)). Actual and simulation outputs of Vm are given in Figures 17(a) and (b), respectively.
The comparison of experimental results and modeling outputs is shown in the figures above. When these mappings are examined carefully, their results signify that the system is modeled considerably realistic.
Conclusion
Heat and mass transfer model interprets high voltages in terms of heat, which means higher voltages correspond to higher heats. Once the model is validated, it could be directly applied to higher voltages such as 100 and 200 kW. Since the backbone of the system is extracted, changes or annexes on the hardware could easily be adapted to the model as a mathematical expression.
Uncertainties arisen from both TD and VTG could be determined by a certain function. 45 Minimization of TD and VTG directly results in decreasing uncertainty and allows accurate HVDC measurements.
Experimental tests for HVDC systems with temperature control last for hours. Cooling of the oil and then returning of the system to initial conditions takes almost 4–5 h. Hence, modeling and simulation of such systems are unavoidable.
In this study, fuzzy control method is applied to the model. However, the proposed model could be used in performance comparison of new control methods. Application of new control methods and parameter changes will take considerably short time in the simulations compared to actual control applications.
Footnotes
Appendix 1
Appendix 2
Rule base of the TD controller.
| 1 | |
| 2 | |
| 3 | |
| 4 | |
| 5 | |
| 6 | |
| 7 | |
| 8 | |
| 9 | |
| 10 | |
| 11 | |
| 12 | |
| 13 | |
| 14 | |
| 15 | |
| 16 | |
| 17 | |
| 18 | |
| 19 | |
| 20 | |
| 21 | |
| 22 | |
| 23 | |
| 24 | |
| 25 | |
| 26 | |
| 27 | |
| 28 | |
| 29 | |
| 30 | |
| 31 | |
| 32 |
B: big; M: medium; S: small; L: low; TD: temperature difference; ZG: zero grade.
Acknowledgements
Authors have special thanks for Hasan DİNÇER, İbrahim EKSİN, Özcan KALENDERLİ, Dilber ÖZBAY, Serkan YAMAN and Reem ALMADHAJI for their valuable assistance on former studies that set light and refer to our current researches.
Declaration of conflicting interests
The author(s) declared no potential conflicts of interest with respect to the research, authorship and/or publication of this article.
Funding
The author(s) received no financial support for the research, authorship and/or publication of this article.