
Abstract
In this paper, the changes of oxidation temperature of sulfide corrosion and the deficiency of distributed optical fiber application were analyzed. The test platform of oxidation temperature of sulfide corrosion was established, and the performance test of optical fiber and the simulation of oxidation temperature of sulfide corrosion were realized. The hardware part of the control system used STM32 as the controller, the software part was based on the process characteristics of the controlled object, using MATLAB to carry out the simulation of PID, fuzzy, fuzzy PD plus I, fuzzy PID algorithms, and their performance are evaluated using both single indexes and comprehensive indexes. The experimental results also showed that the proposed fuzzy PID can achieve better control performance with less overshoot and shorter setting time. Therefore, the fuzzy PID was chosen as the temperature control algorithm to build the optical fiber sensor test platform, and an alarm method for testing the oxidation temperature of large area sulfide corrosion based on the optical fiber performance was obtained. Then, considering the influence of spatial resolution on optical fiber sensor, this paper used piecewise PID to simulate the temperature rise process of three stages of sulfurization corrosion and oxidation. The results showed that the alarm method of oxidation temperature of sulfurization corrosion has limitations for small-scale oxidation of sulfurization corrosion, and it needed to be combined with machine learning to identify temperature anomaly.
Keywords
Introduction
The sulfur corrosion and oxidation self-heating of crude oil storage tank is one of the main causes of fire and explosion accidents, which often brings disastrous consequences. 1 There are many sulfur-containing substances in crude oil, these sulfur substances have strong corrosion properties and are easy to react with metals. Therefore, they will slowly corrode the tank wall and floating roof and form complex sulfurized rust. After contacting with air, the sulfur iron compounds are prone to oxidation reaction and release heat, which leads to a sharp rise in tank temperature. If the distribution form of sulfurized rust and the surrounding environment are not conducive to heat dissipation, the oil gas between the secondary seal and the primary seal ring of the storage tank will be ignited after heat accumulation, and eventually a fire will occur. 2
Since abnormal temperature rise is the main index of self-heating of sulfide corrosion heat, it is the main method to monitor this kind of disaster by placing temperature sensors in the areas with high incidence of sulfide corrosion. At present, the temperature measurement by fiber grating (TBG) is mostly used in engineering, and the temperature alarm at the sealing ring is realized by setting the threshold value. However, TBG belongs to pseudo distributed temperature measurement, and there is a large temperature measurement blind area. In the long-term application, the fiber is easy to break and the temperature drift triggers false alarm. DOFT is a kind of real-time measurement of spatial temperature field. It not only has the advantages of ordinary optical fiber sensor, but also has the distributed sensing ability of temperature along the fiber. Optical fiber is not only the conductor of information transmission, but also the sensor of distributed measurement. It can continuously measure the temperature along the optical fiber, and is especially suitable for the places where large-scale multi-point measurement is needed. Therefore, this paper decided to use distributed optical fiber temperature measurement system to monitor the temperature of oil tank.
In the 1970s, two cruise ships carrying Qatari crude oil exploded in the waters of Thailand. The reason for the explosion was that the sulfur in the crude oil reacted with metal to form ferrous sulfide, which was eventually oxidized and self-heated. Hughes et al. 3 published in nature in 1974 about the fire and explosion of cruise ships caused by self-heating of iron sulfide compounds. Since then, the research on self-heating process of sulfide corrosion and oxidation has become a hot issue in the field of safety engineering. Asaki et al. 4 divided the oxidation process of ferrous sulfide powder into three stages through experimental research. Li et al. 5 tracked the self-heating process of FES for 19 h. It was found that the self-heating process of FES oxidation experienced three stages: induced oxidation stage, medium rate oxidation stage and accelerated oxidation stage. Zhang analyzed the chemical reagent ferrous sulfide by SDT. Zhao et al. 6 got the following conclusions through the analysis of enterprise field cases: iron sulfide has high oxidation self-heating activity. It can be oxidized quickly and give off a lot of heat when contacting with air at room temperature. If there are combustible materials around it, it will burn and cause fire and explosion accidents. Z.Dou7,8 studied the oxidation self-heating process of sulfurized rust on the top breathing valve of a crude oil storage tank in Nanjing Refinery of JinLing Petrochemical Company. The oxidation process was divided into three stages: electrochemical oxidation stage, electrochemical chemical oxidation stage and chemical oxidation stage, and the early warning index of oxidation process was proposed.
Some of the above research and application do not well answer how to use this theoretical knowledge to prevent the fire caused by sulfurized corrosion and oxidation of storage tanks. In fact, most people have installed temperature monitoring system on the upper edge of the secondary seal, considering the alarm after the fire, and not considering how to alarm at the early stage of sulfurization corrosion to avoid fire. The main reason is the lack of early temperature rise measurement performance evaluation technology and method. Even if the temperature measuring system such as temperature measuring optical fiber is arranged on the storage tank, the measurement data returned by the system cannot be used as a reliable alarm basis for early sulfurization corrosion accidents. If the researchers want to monitor the temperature rise index of early sulfurization corrosion, they first need to establish a reliable test platform to simulate the early temperature rise of sulfurization corrosion to verify the performance and reliability of the measurement system they have designed. In order to solve this problem, this paper established a set of sulfurization corrosion oxidation test platform to help researchers establish the temperature rise index to verify the system performance.
In this paper, based on the theory of sulfide corrosion and oxidation, through the analysis of the temperature change in the oxidation self-heating process of iron sulfide compounds, a sulfur corrosion oxidation test platform was established. Considering the influence of spatial resolution on the experiment, the experimental platform was divided into two parts according to the heating area: In the first part, when the heating area is larger than the spatial resolution of the optical fiber, the Fuzzy-PID was obtained as the best control algorithm through Simulink simulation by analyzing the process characteristics of the controlled object, and then the embedded controller was used to analyze the temperature difference of fixed temperature, and the optimal alarm threshold value of the oxidation temperature alarm for the corrosion of sulfurization was obtained. In the second part, when the heating area was less than the spatial resolution of optical fiber, according to the curve of vulcanization corrosion temperature, the complete change of sulfide corrosion oxidation temperature was simulated on the steel plate, and I analyzed the return temperature of distributed optical fiber.
Design of temperature controller
System architecture
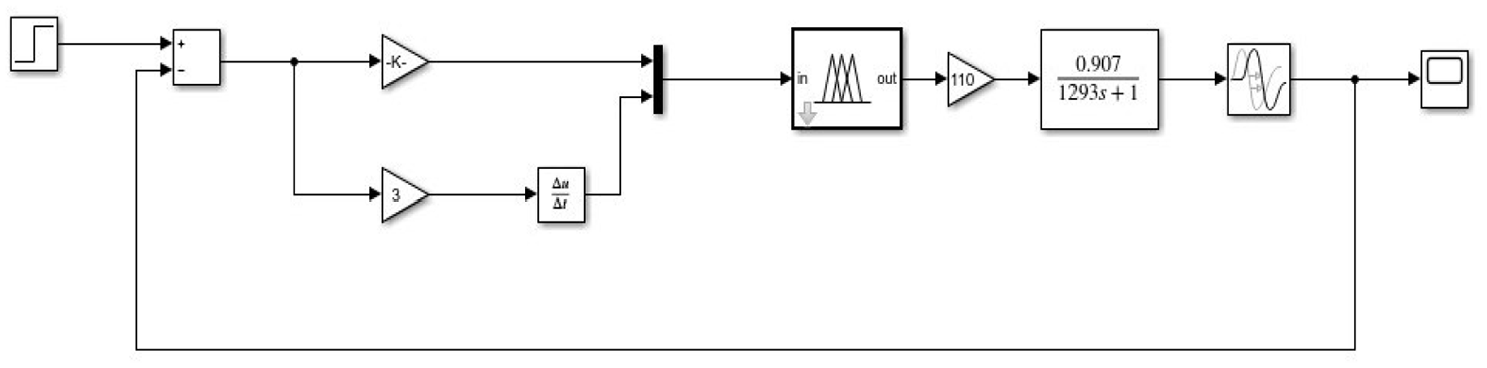
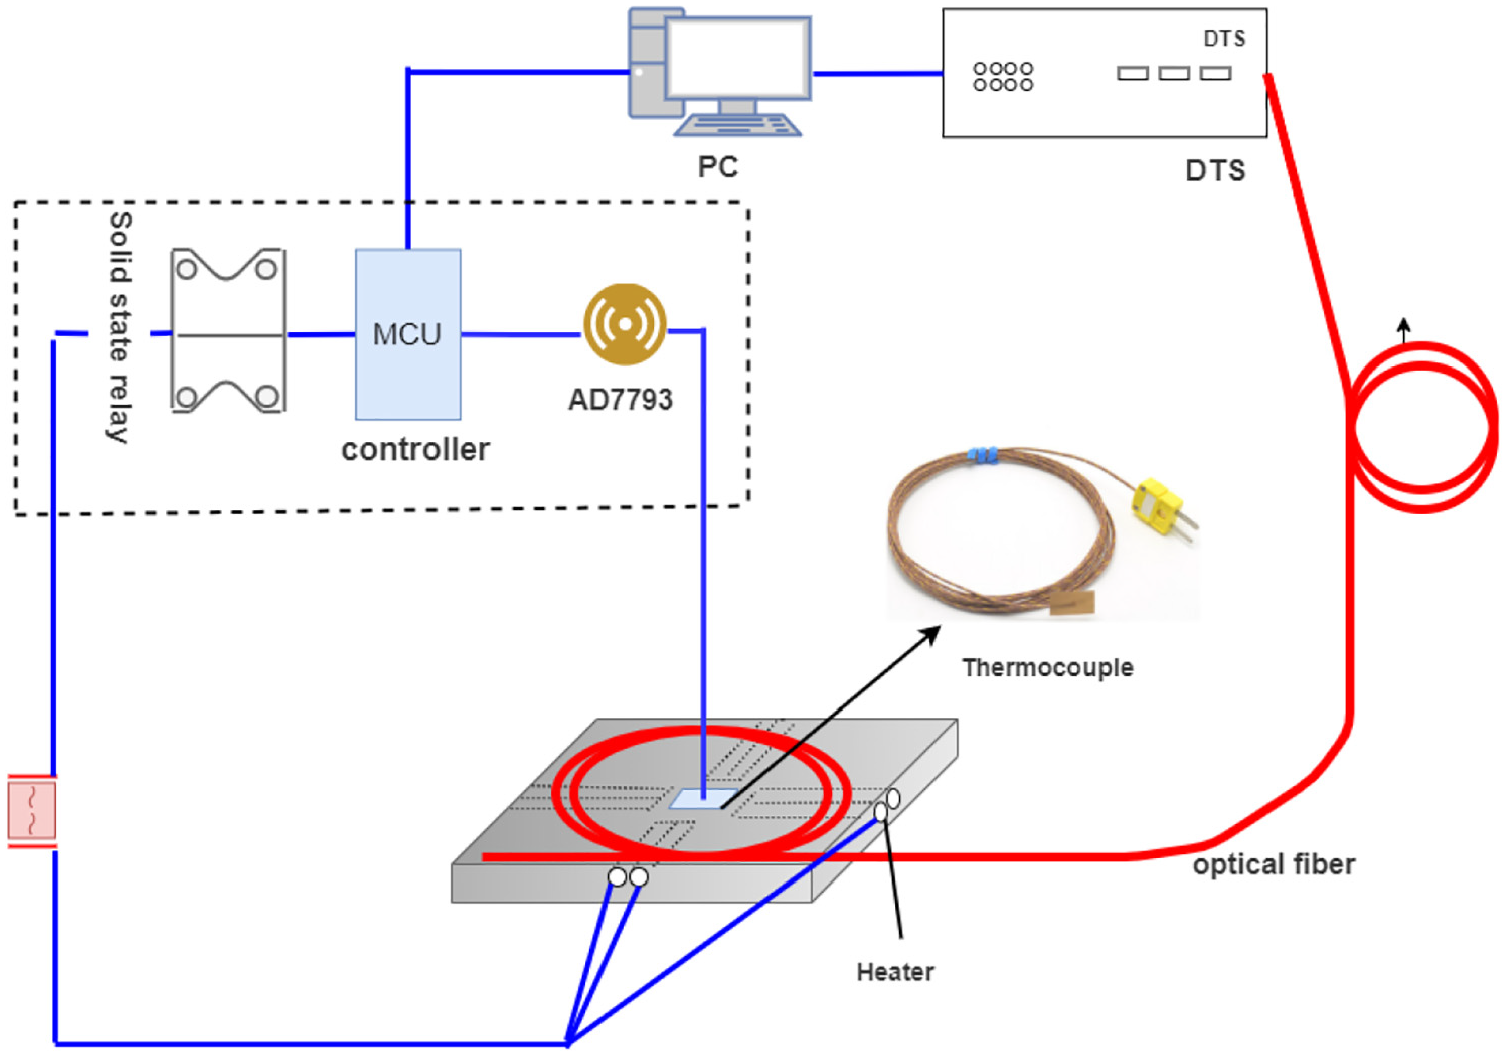
In the whole test platform design, the core was the temperature control of steel plate heat source. The steel plate temperature control system adopted the closed-loop control mode. Its principle was to set the temperature value first, and then transmited the temperature value obtained by the temperature measurement module to STM32, The error between the set value and the current temperature was calculated, and then the error was put into the set algorithm to calculate the output control quantity. The output size of the heating rod was controlled through the PWM output of STM32. Finally, the temperature was displayed on the upper computer and LCD screen. The whole process was carried out in the timer to ensure the sampling time is 1 s. The overall scheme of the specific system is shown in Figure 1.
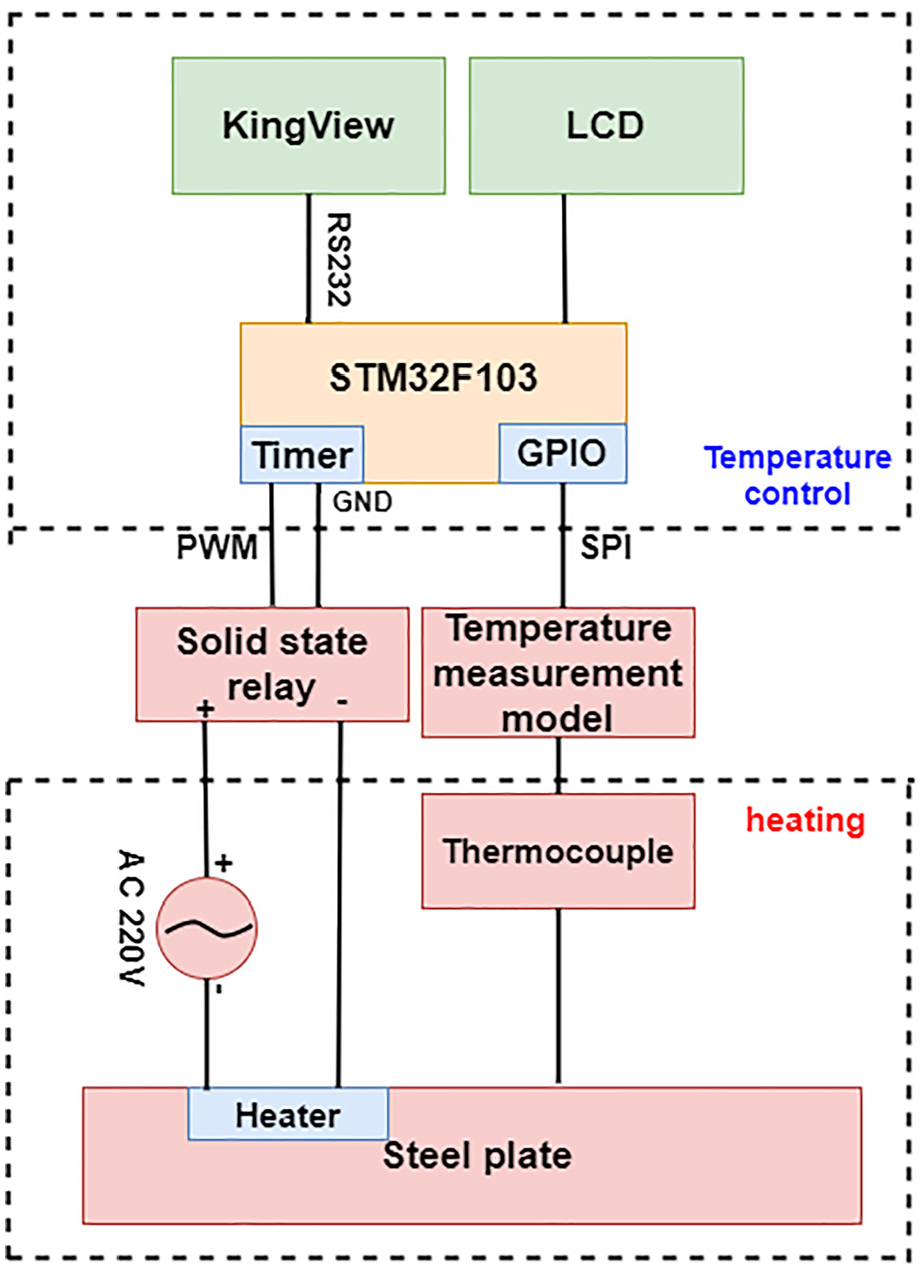
Overall scheme of the system.
Microprocessor
Temperature controller is the most important part of the whole control system. This paper selects STM32F103ZET6 as the core of the controller system. It is a 32-bit high-performance microprocessor with small package and low power consumption.
Temperature acquisition module
The resolution of distributed optical fiber temperature measurement host is 0.1°C. In order to ensure that the temperature error of steel plate is within 0.1°C, the resolution of the acquisition module must be less than 0.1°C. The control object of this paper was steel plate, and the steel plate has the characteristics of large thermal inertia and rapid temperature rise when heating, so it is necessary to ensure that the temperature measurement equipment has a wide range of temperature measurement and short response time. The temperature sensing device of the system includes K-type thermocouple, ad7793 and PT100 sensors. The K-type thermocouple has the characteristics of fast response, wide temperature measurement range and small error. Ad7793 is a 24-bit high-precision digital to analog conversion module with a resolution of 0.03. PT100 is a temperature compensation module. The temperature measurement system obtains the voltage value of thermocouple through ad7793, converts the compensation temperature obtained by PT100 into voltage value through look-up table method, adds the compensation temperature voltage value and the voltage obtained by ad7793, and then obtains the real temperature after compensation by looking up the table.
Temperature control equipment
The heating rod is inserted into the inside of the steel plate by means of a hole as a heat source heater. STM32 has PWM channel, the device used PWM square wave to control the current of heating rod. Solid state relay was selected as the connection of switch control circuit.
Transfer function
The transfer function of the target system
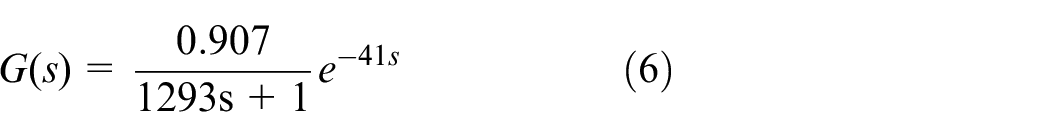
In order to verify the reliability of the temperature controller algorithm, the control algorithm was simulated by Simulink, and the premise of simulation was the establishment of transfer function. Since the steel plate heating involves many factors, it will be a great challenge for the controller itself. Therefore, it is necessary to simplify the transfer function and retain the main characteristics of the controlled system. In this paper, the electric heating steel plate system was taken as the controlled object, which has the characteristics of no vibration and self-balance under the step with time delay. It not only retains the main characteristics of the controlled object, but also is convenient for theoretical analysis and practical control input. Its transfer function can be described as a first-order transfer function. 9
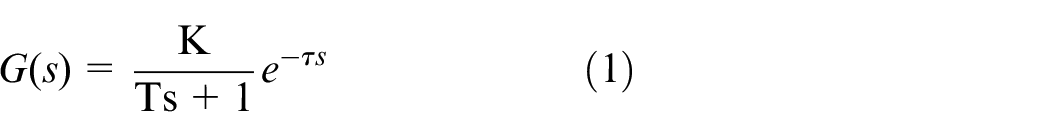
Where
System step response curve
In this paper, the method of step disturbance response was used to establish the system transfer function: the electric heating rod was used as the step input of the target control system, and the iron plate temperature was taken as the output of the system. The step response curve of the steel plate with time was obtained. According to the actual situation, the input control value was selected as 5% (the power input of heating rod is 96 w, the total power is 1920 w). The temperature time curve is shown in Figure 2.
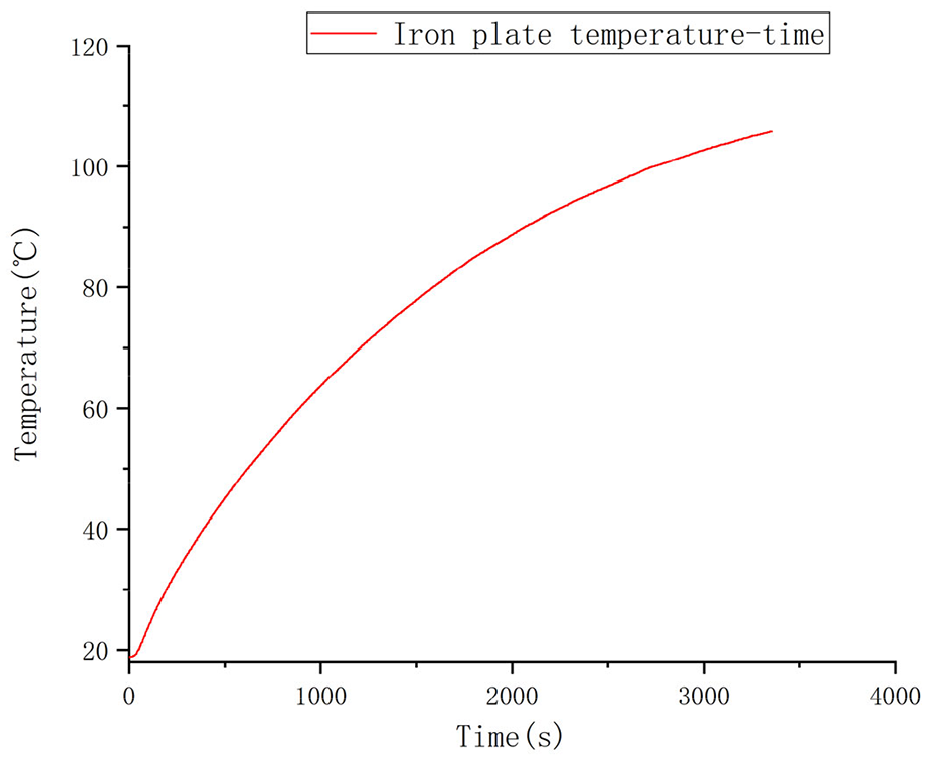
Heating temperature curve of steel plate.
Identification of transfer function parameters
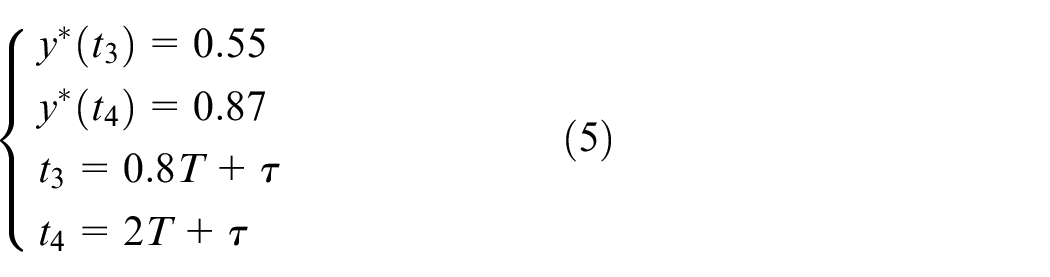
In this paper, the first-order approximation method and the system step response curve method were used to obtain the transfer function parameters. The relative value of the controlled object is expressed in dimensionless form.
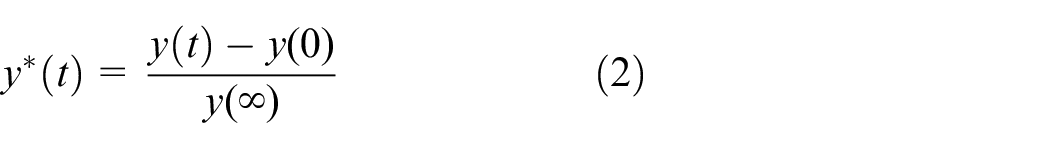
Where

According to Figure 2,
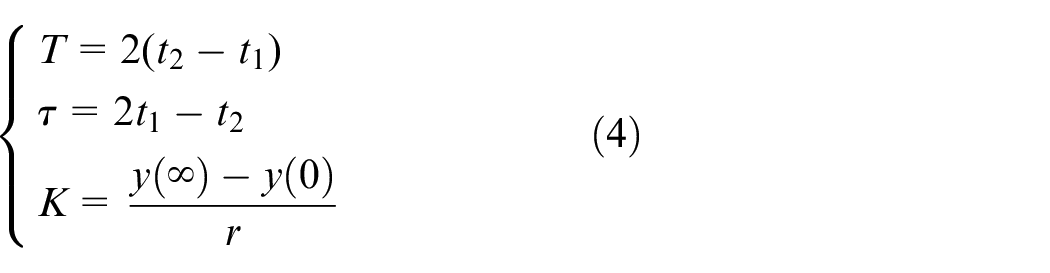
The parameters of the first order transfer function are obtained by substituting the above formula, where
Where
The system controller research and simulation
PID controller
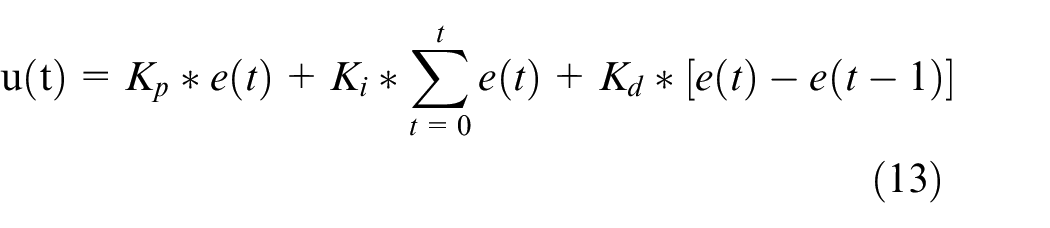
PID temperature controller is the most common and widely used control strategy in industrial control. At present, most control loops are designed by PID.10,11 The PID algorithm can be expressed as
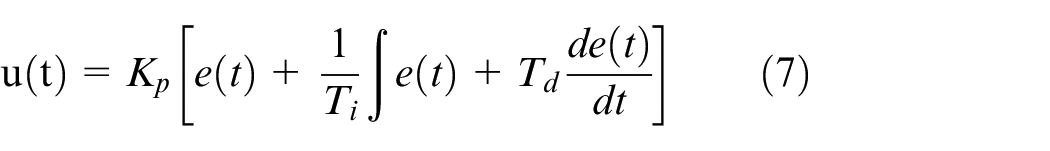
Where
In this paper, the critical proportion method was used to set the parameters of the controller simulation.12,13 According to the requirements of critical proportionality method, the control of differential and integral was disconnected. Under the action of pure proportion,
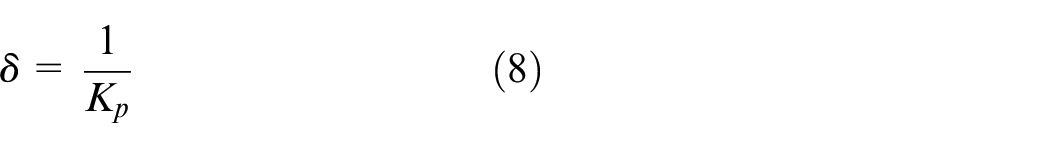
Where
Tuning controller parameters by critical proportion method.
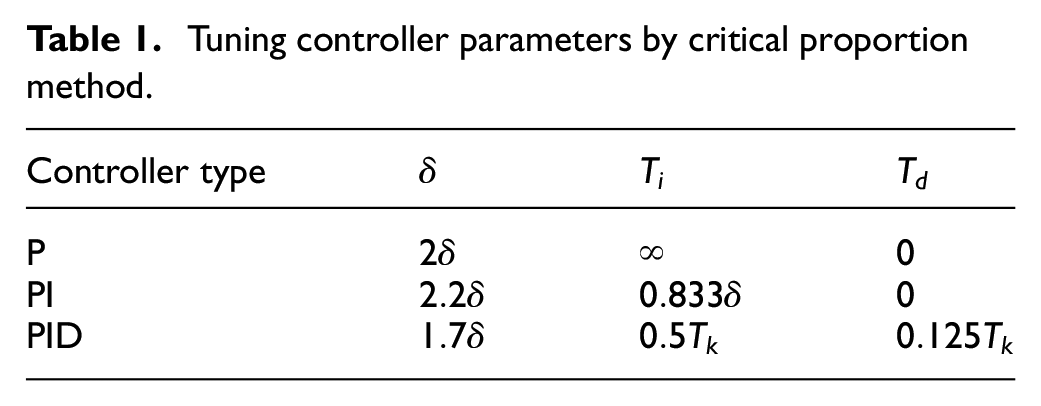
According to the solution of critical proportionality method, there was a constant amplitude oscillation at
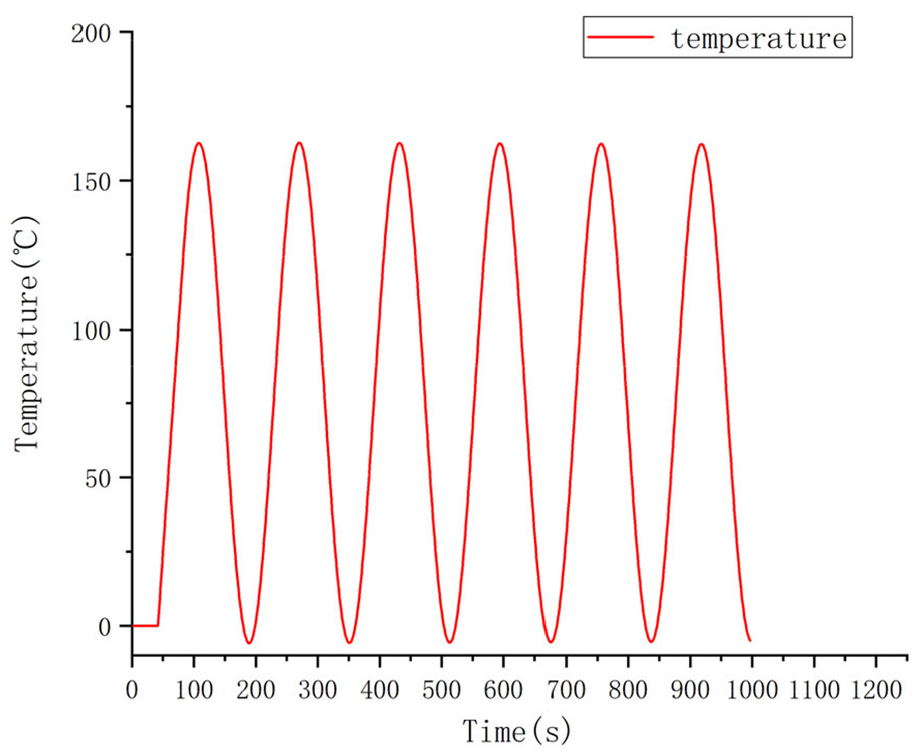
Simulation diagram of critical proportional equal amplitude oscillation.
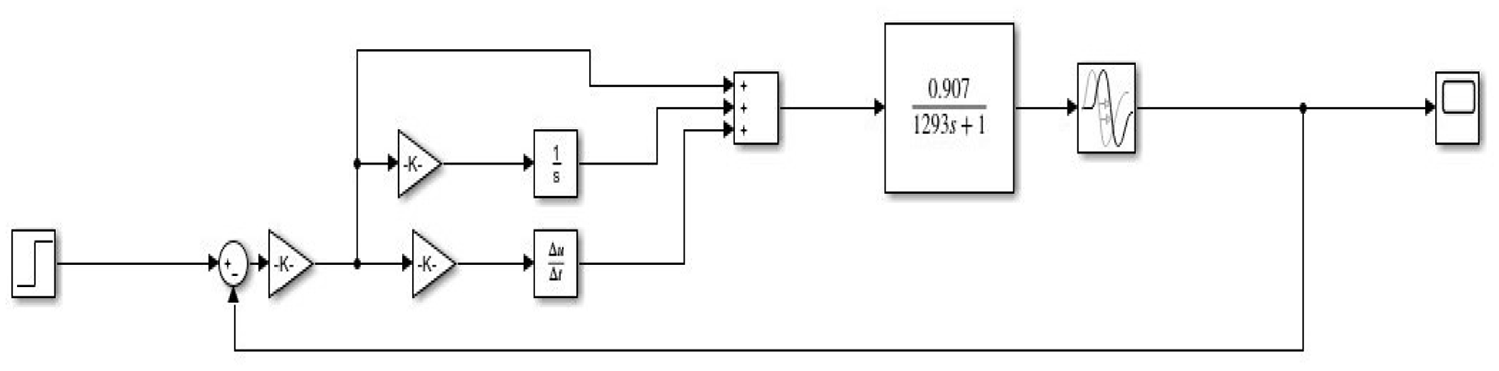
Simulation model of PID temperature controller.
Fuzzy controller
At present, fuzzy control is a common method.14,15 By introducing fuzzy logic language variables to build fuzzy relations for fuzzy reasoning, and then clear the output way, so that those cannot establish an accurate model of the controlled object can obtain a more accurate control effect. The system error
In the whole process of fuzzification, the fuzzy controller was a control system with two inputs and one output. The basic domain of error(
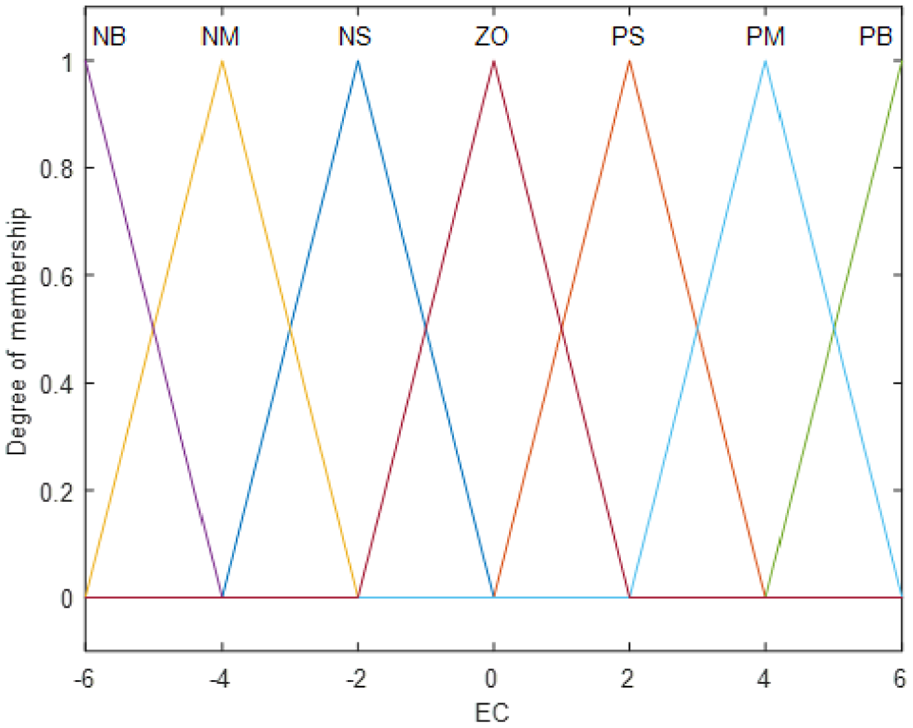
Membership function of variables.
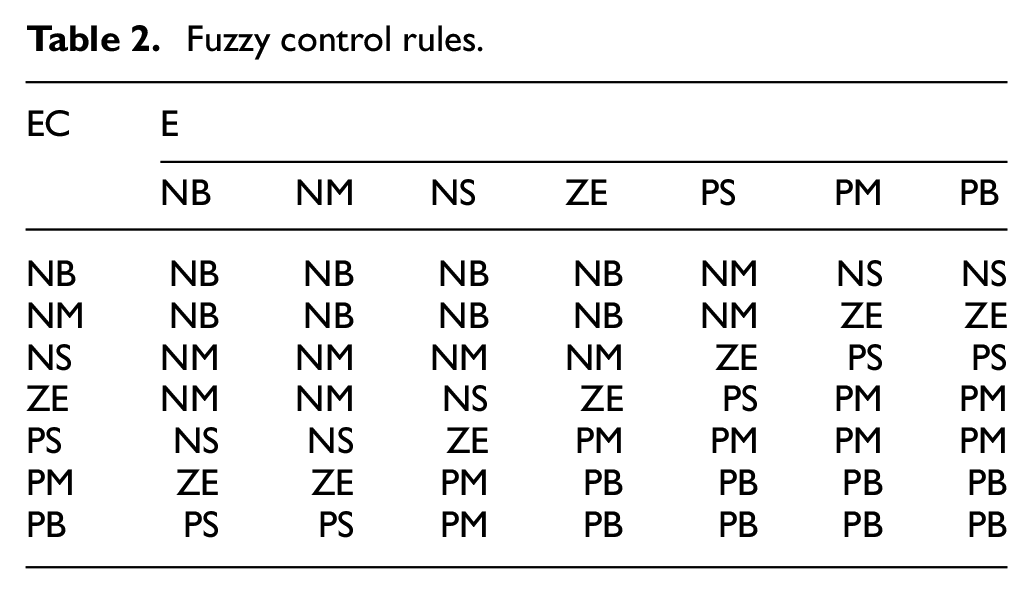
Fuzzy rule is the core of fuzzy control algorithm, which directly determines the effect of fuzzy control algorithm.16,17 The fuzzy rules were set according to the previous engineering experience, as shown in Table 2. In this paper, Fang et al. 16 fuzzy inference algorithm was used for reasoning, weighted average method was used for fuzzy elimination, and the simulation model of fuzzy controller was established as shown in Figure 6.
Fuzzy control rules.
Simulation model of fuzzy controller.
Fuzzy PD plus I controller
Due to the large static error of Fuzzy algorithm in the simulation, this paper tried to use Fuzzy PD plus I controller to realize the simulation of transfer function according to the process characteristics of the controlled object. Fuzzy PD plus I controller uses the parallel mode of Fuzzy controller and integral controller to jointly control the temperature change of the controlled object. The addition of linear integral controller is beneficial to eliminate the residual difference and improve the stability performance of the whole system.
18
The specific situation19,20 is shown in Figure 7, where
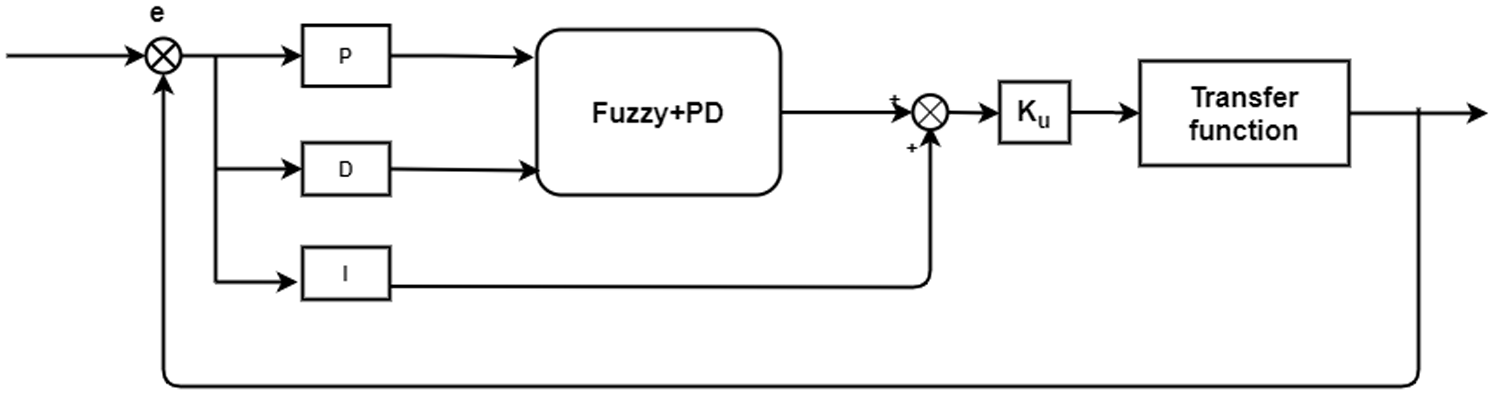
Basic structure of fuzzy PD plus I controller.
In the process of the whole control system, the fuzzy PD controller is a control system with two inputs and one output. The basic domain of error(
For fuzzy rules, widely used rules based on experience, all rules are composed of fuzzy relations. For fuzzy reasoning, Max-min method was adopted based on Mamdani type to clarify the output value, and the centroid method was used to clarify the output value. Table 2 shows Fuzzy PD plus I Fuzzy rules. The simulation diagram as shown in Figure 8 was established.
Simulation model of fuzzy PD plus I controller.
Fuzzy PID controller
The temperature control system is unstable in the process of control because of its hysteresis and large inertia. The traditional PID control can achieve the optimal control of the control system by adjusting the three parameters of PID, but the experimental process is more complicated, and it is not easy to control the parameters in real time, which cannot meet the precise control of time-varying and nonlinear systems.
21
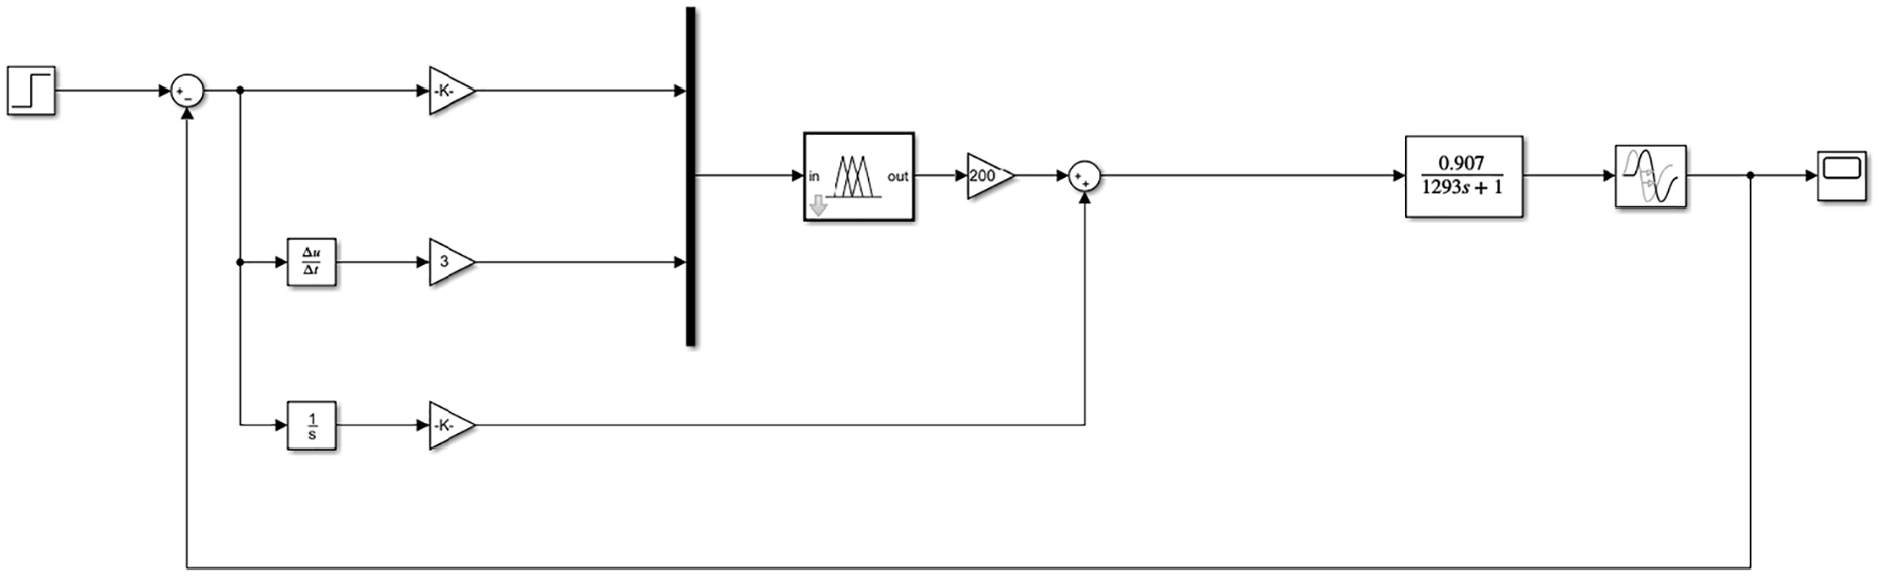
In this paper, fuzzy PID control was used to improve the PID controller, as shown in Figure 9. The system error(
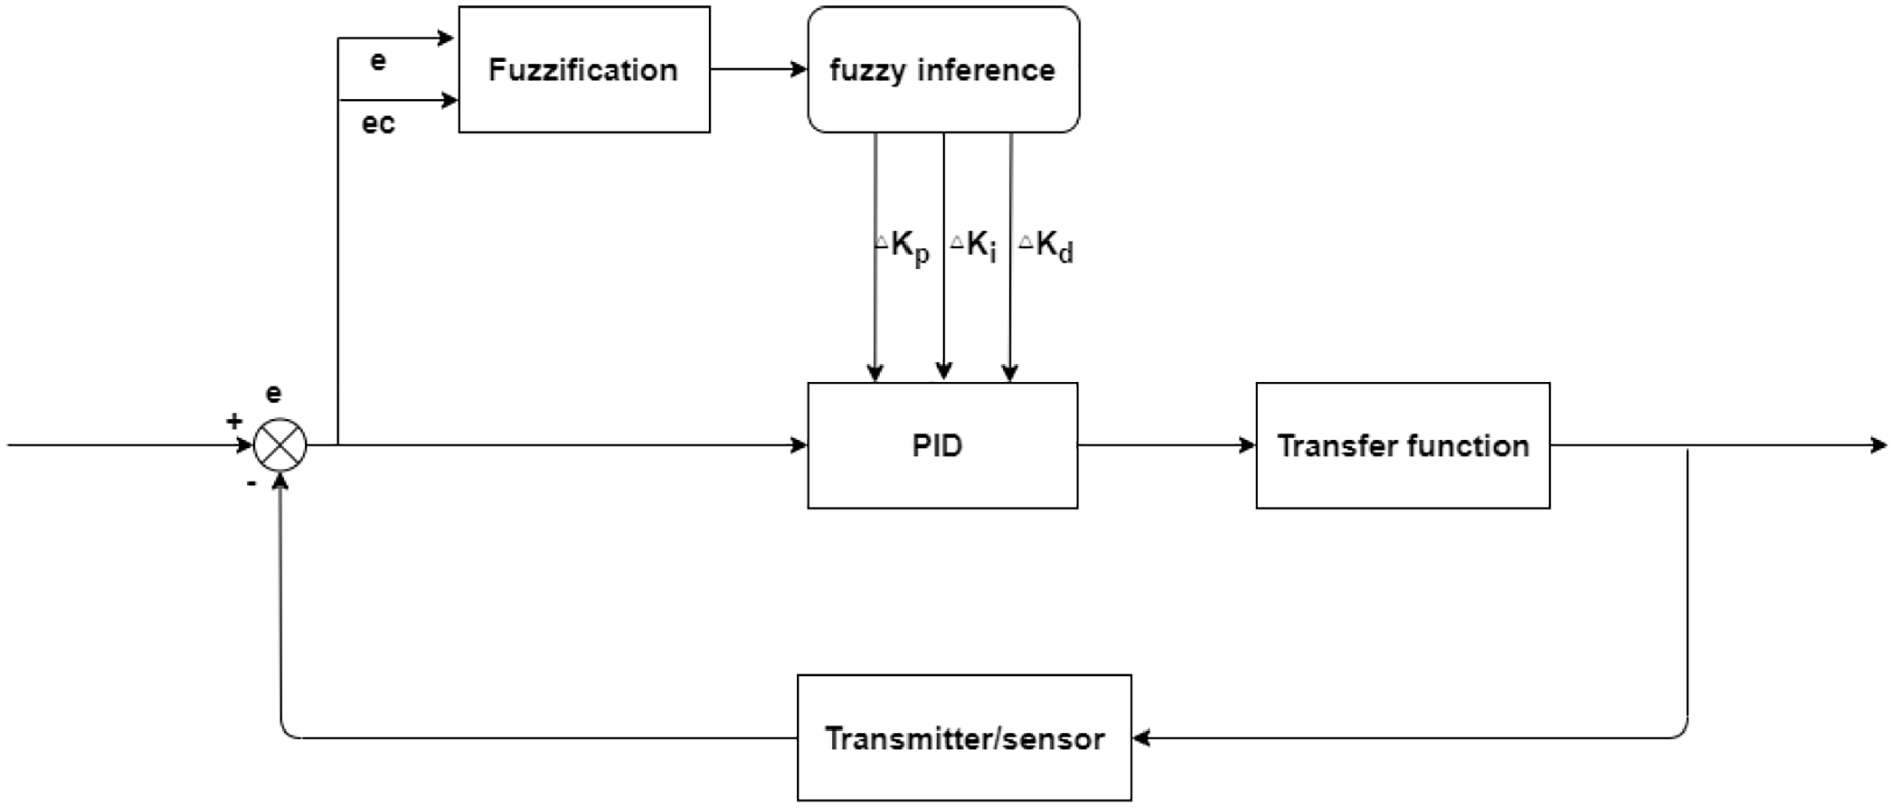
Structure of fuzzy-PID controller.
In the whole process of fuzzification, the fuzzy controller was a control system with two inputs and three outputs. The basic domain of error(
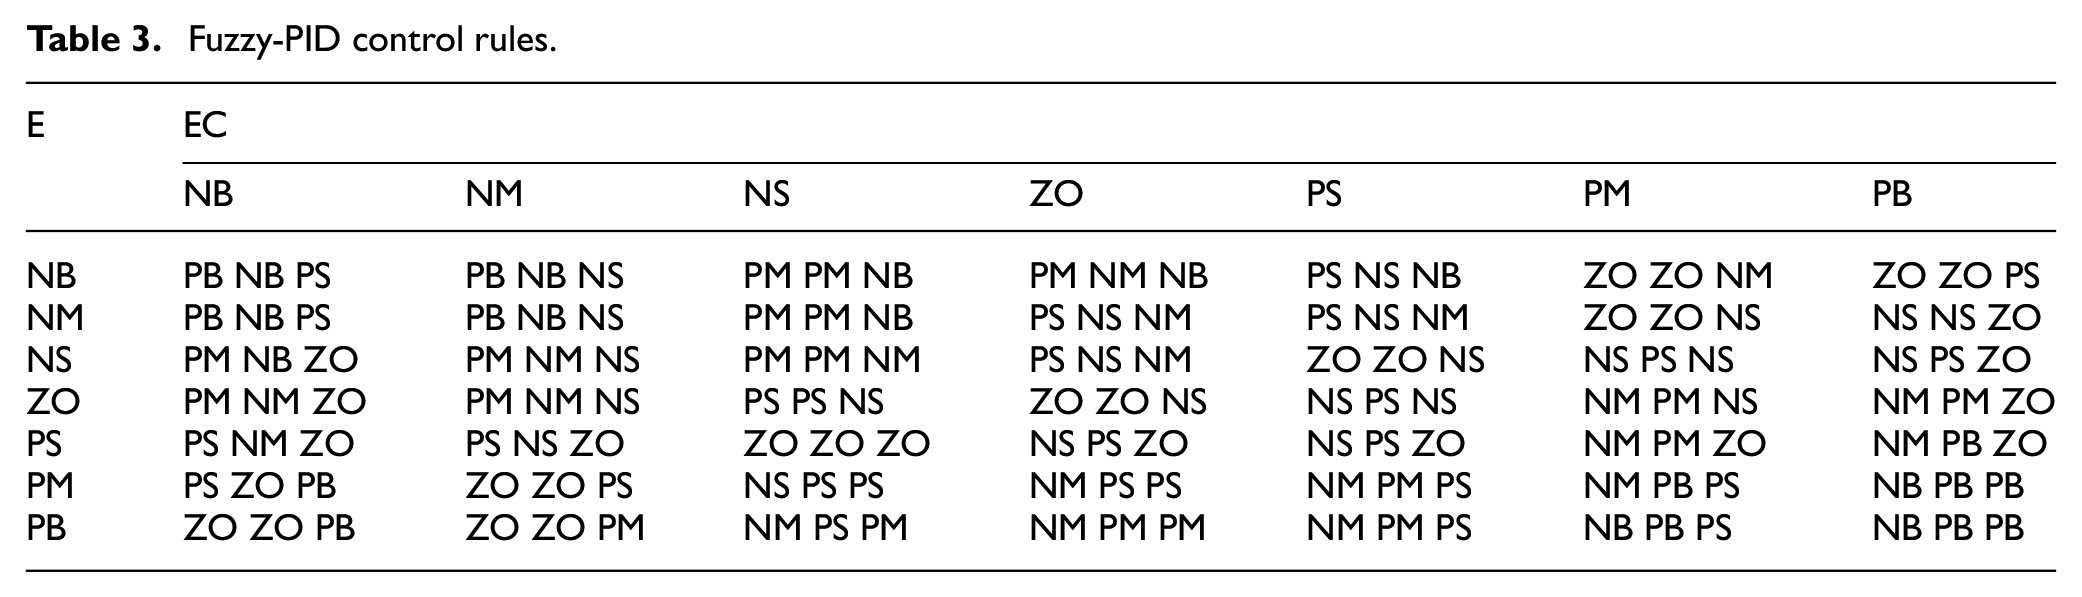
According to the previous engineering experience, the fuzzy rules are set as shown in Table 3. In this paper, Mamdani22,23 fuzzy reasoning algorithm was used for reasoning, and weighted average method is used for fuzzy elimination. The fuzzy values of the outputs (
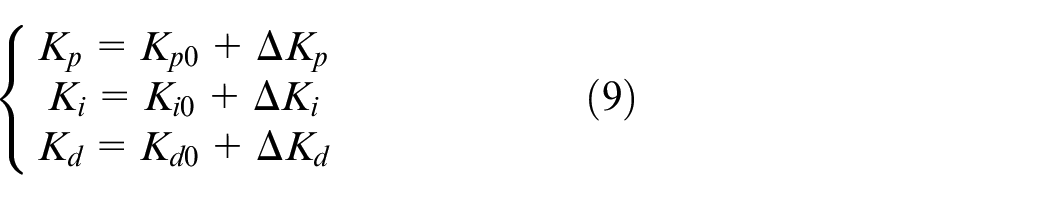
Where
Fuzzy-PID control rules.
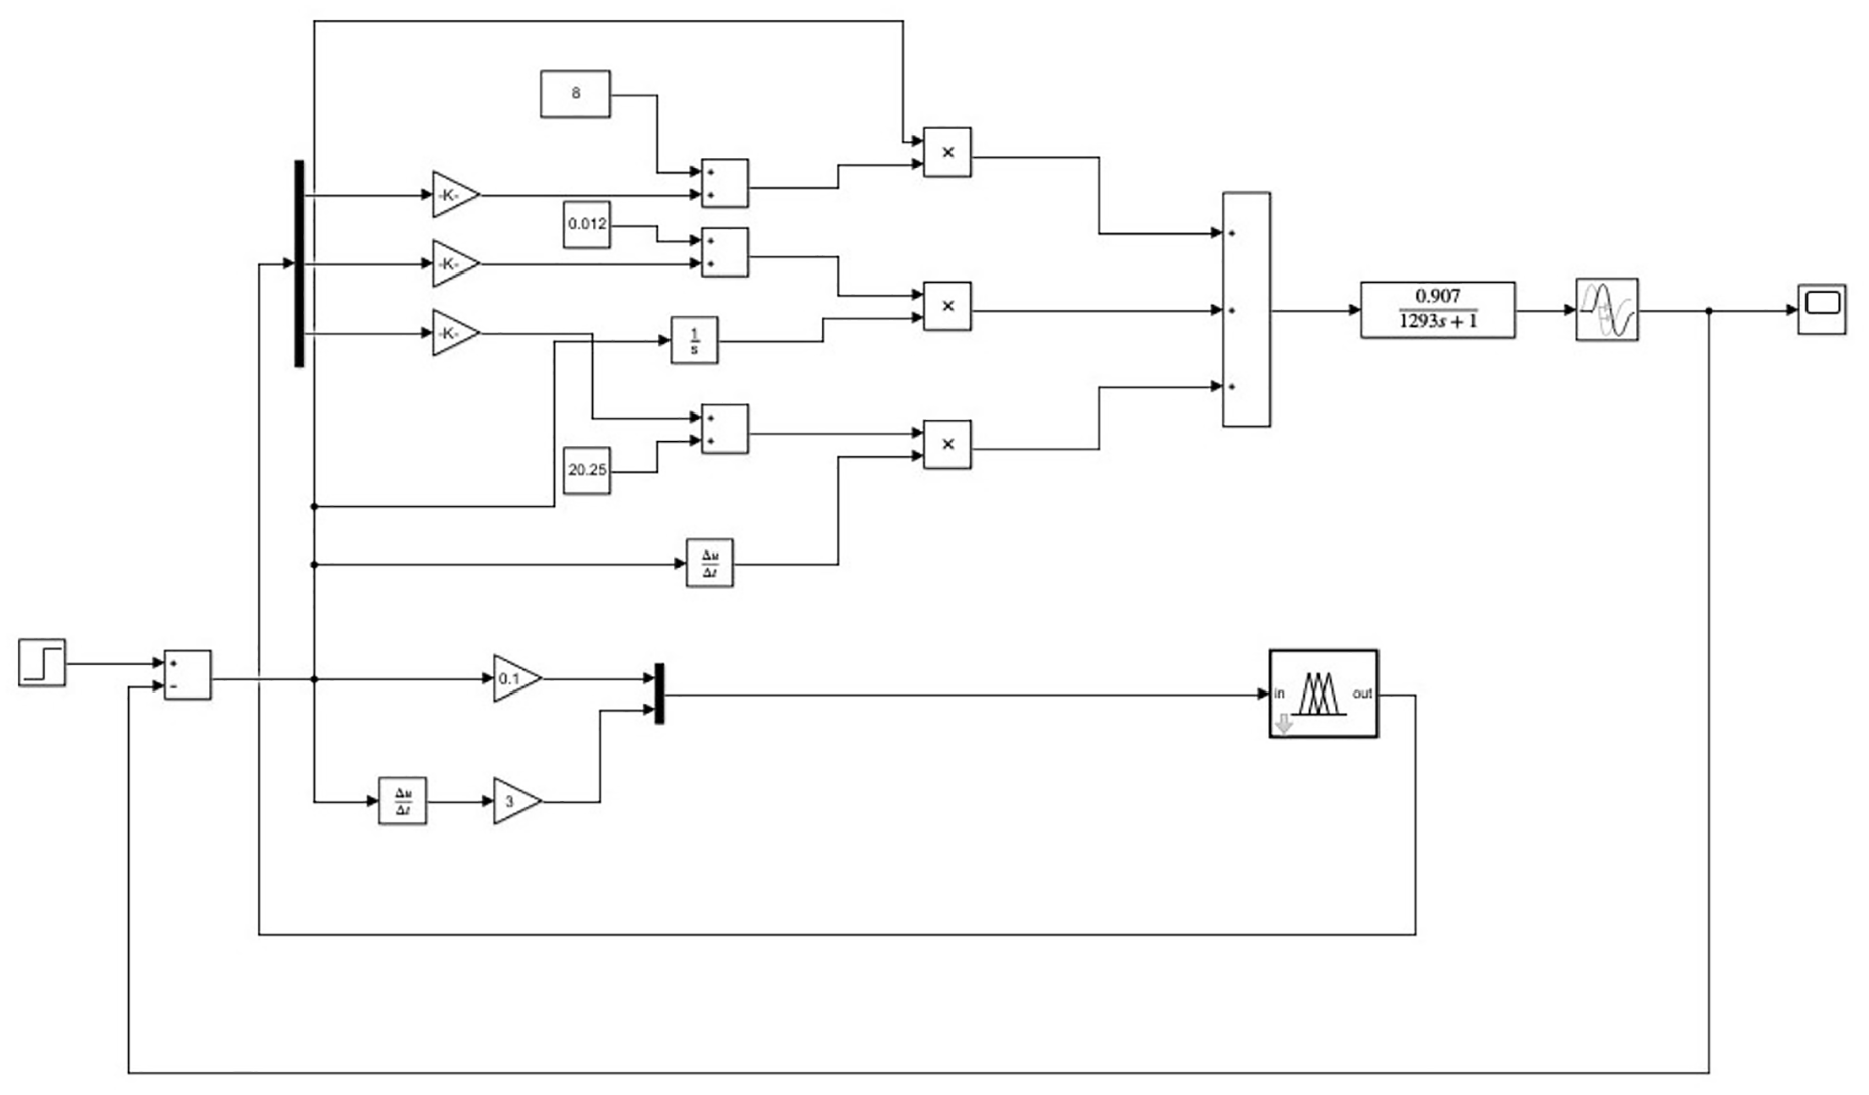
Fuzzy PID controller simulation model.
Analysis of simulation results
The simulation results of PID controller, fuzzy controller, fuzzy PD plus I controller and fuzzy PID controller were given in this paper. The maximum control temperature of optical fiber performance test experiment was 80°C as the simulation temperature. Sampling time was 1 s and simulation time was 5000 s. The step response curve shown in Figure 11 showed the simulation results obtained by the four control methods.
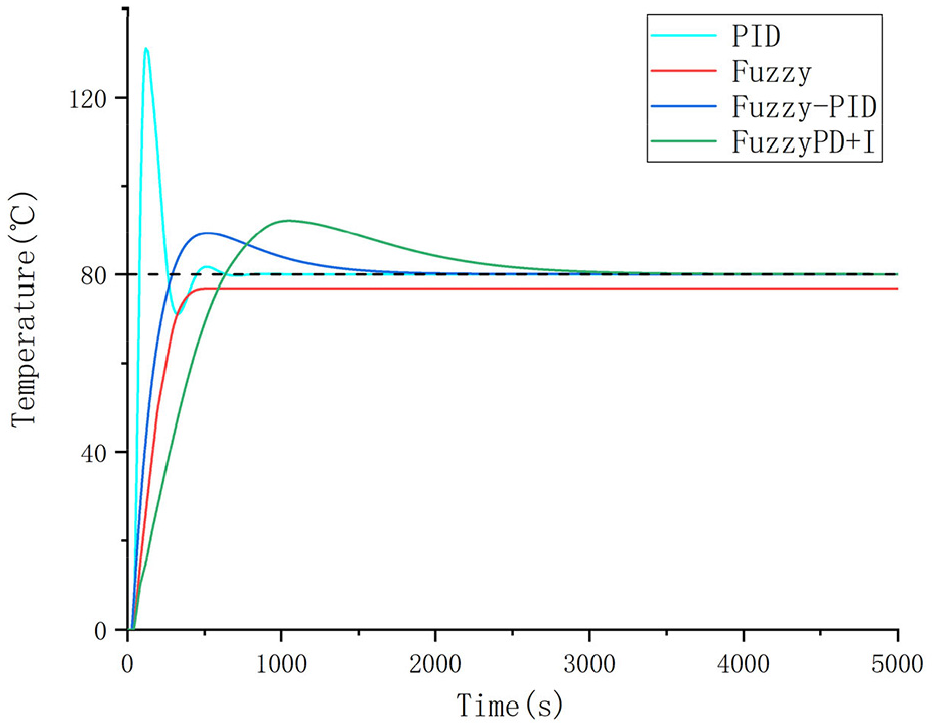
Controller simulation results.
Single index analysis
The performance of rapidity, stability, accuracy and oscillation amplitude of general control system is reflected by rise time (
In this paper, we needed to carry out constant temperature experiment on optical fiber, and used steel plate to simulate the temperature change of optical fiber under different temperature in real storage tank. However, the maximum temperature resistance of long-term optical fiber can only reach 90°C. Therefore, in addition to ensuring the stability and accuracy of the system, the overshoot should not exceed 12.5%. Excessive overshoot will cause overheating of steel plate, which will affect the temperature resistance of optical fiber. Through the simulation of the three systems, the specific parameters can be obtained, as shown in Table 4.
Performance index of three controllers.
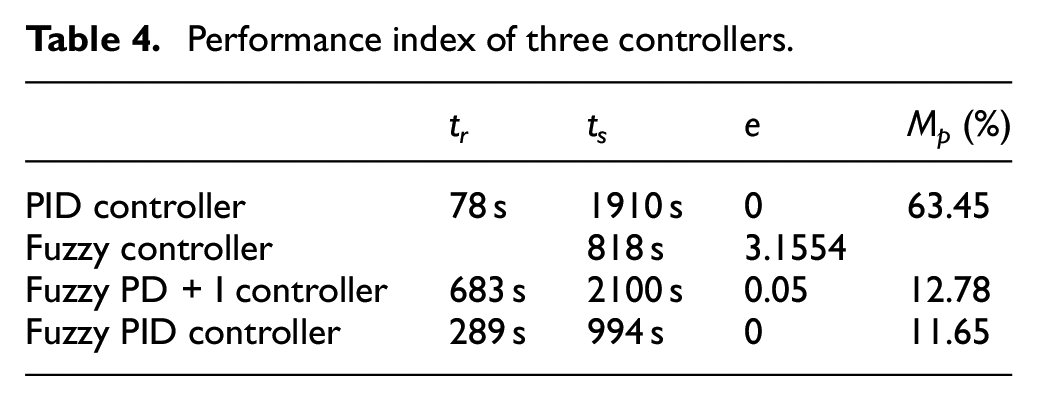
From the perspective of rapidity, compared with other controllers, PID had a shorter rising time and can reach the target temperature more quickly. From the perspective of stability, the stability time of fuzzy PID was shorter and the temperature can be stabilized more quickly. From the perspective of precision, the static error of the fuzzy PID controller and PID controller was 0, the fuzzy PD plus I controller had not reached the final temperature, and there was still a 0.05 error in 5000 s time, while the fuzzy algorithm has a large steady-state error. From the perspective of the performance of the oscillation range, although the PID control can accurately reach the target temperature, the highest temperature reached 130.76°C and the overshoot reached 63.45%, which will be a big threat to the optical fiber. The maximum temperature of the fuzzy PID controller was only 89.32°C, within the safe temperature range of optical fiber, while the fuzzy PD+I controller exceeded the temperature by 0.22°C.
Analysis of comprehensive indicators
The comprehensive index can reflect the quality of the control system. The form of comprehensive performance index is deviation integral. Both the stability time and rise time of the control system become longer, which indicates that the quality of the control system is getting worse. The smaller the deviation integral index, the better the quality of the control system. In this paper, IAE and ISE were selected as comprehensive performance indexes. The details are as follows:
(1) IAE (Integral Absolute value of Error)

2) ISE (Integral of Squared Error)

Where
In order to facilitate the calculation, the two comprehensive performance indexes were discretized and calculated as follows:

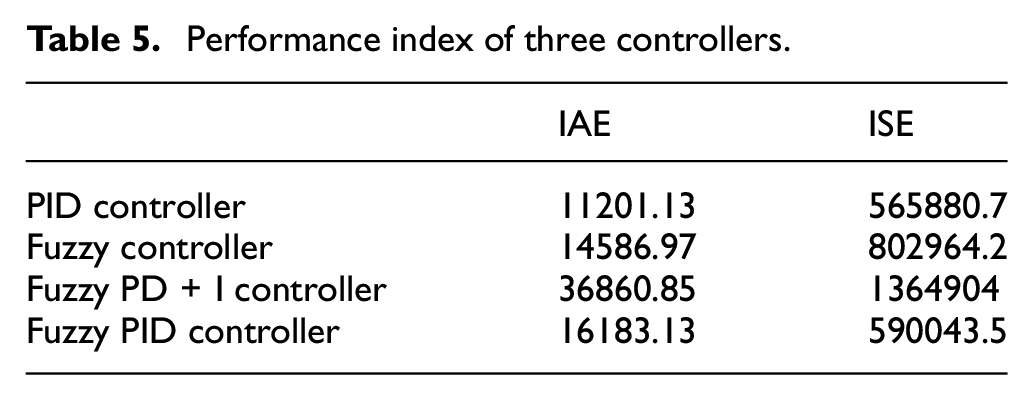
It can be seen from Table 5 that the comprehensive performance index of PID controller was smaller, and the quality of control system was better, followed by fuzzy PID controller. The reason was that the rise time and stability time of PID is low, which can achieve the target temperature more quickly and stably. However, the overshoot of PID will affect the performance of optical fiber, which cannot be ignored. Therefore, fuzzy PID was considered to test the performance of optical fiber temperature measurement system.
Performance index of three controllers.
Experimental
Spatial resolution
In order to ensure that the distributed optical fiber can return accurate temperature data, the heating length of the device needs to be larger than the spatial resolution of the optical fiber temperature measurement host. According to the temperature measurement standard of spatial resolution of optical fiber, the spatial resolution of optical fiber should be the length value of 10%–90% of the reading temperature rise of optical fiber system. When the optical fiber was placed on an iron plate at 80°C, the temperature curve distribution of the optical fiber was shown in Figure 12.
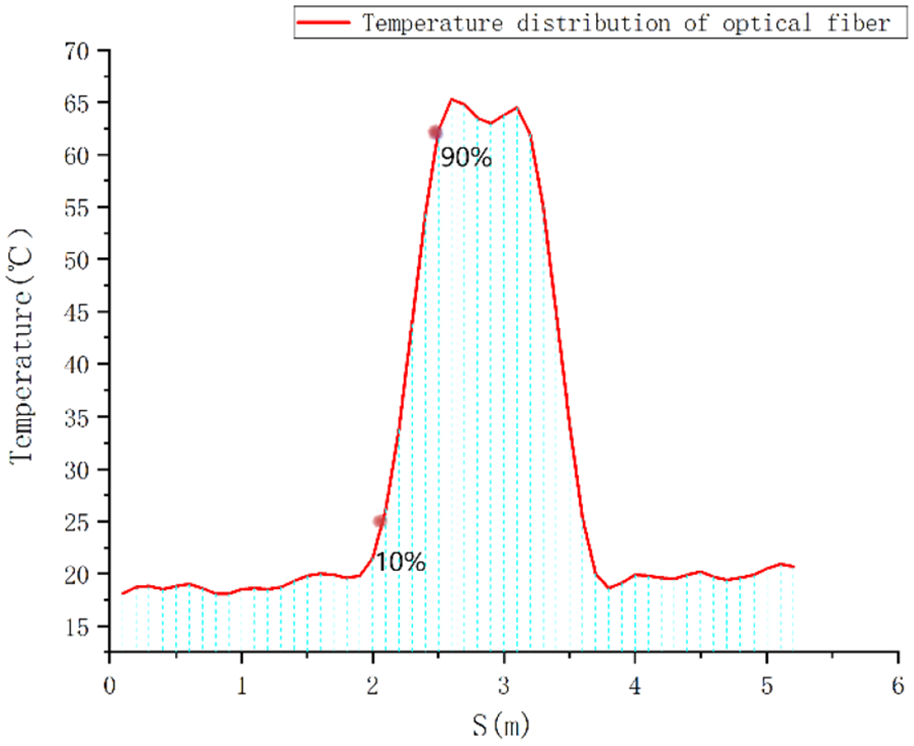
Spatial resolution analysis.
The experimental results show that when the positioning accuracy of the optical fiber temperature measurement system was 0.1 m, the spatial resolution of the optical fiber host was between 0.5 and 0.6 m, so the thermal part of the optical fiber should be greater than 0.6 m.
Analysis on oxidation temperature of sulfide corrosion
According to some accident investigation reports and scholar’s research, when the iron sulfide compound contains a small amount of water, the temperature change of oxidation reaction was the most severe after contacting with humid air. Z.Dou 7 and others analyzed the role of water in the self-heating process of oxidation of iron sulfide compounds by using the rust on the inner wall of breathing valve and safety valve of Jinling Petrochemical storage tank. By building a chemical experiment platform to simulate the sulfur iron compounds oxidation experiment system of the formation and natural oxidation of iron sulfide compounds in the industrial environment, the oxidation temperature curve of iron sulfide compounds in the industrial environment was obtained and divided into four categories. The temperature curve of the wet iron sulfide compounds was oxidized by wet air, wet sulfur iron compounds was oxidized by dry air, dry sulfur iron compounds was oxidized by wet air and dry iron sulfide was oxidized by dry air. Due to it is difficult for the distributed fiber thermometry host to monitor this set of system, the temperature change curve of which the oxidation self-thermal reaction is the most vigorous wet sulfur iron compound was oxidized by wet air is selected for the variation curves of four kinds of sulfur iron compounds based on previous research. The temperature control system of STM32 was used to simulate the change of oxidation temperature of sulfide corrosion and the simulated sulfide corrosion oxidation test system was established.
Since the wet iron oxide compounds are very complex with the wet air oxidation process, the whole oxidation process was divided into three stages in chronological order according to the change of the temperature of the solid phase species itself with time: the electrochemical oxidation stage, the electrochemical-chemical oxidation stage, and the chemical oxidation stage. Among them, the first stage was the electrochemical oxidation stage during this time the sulfur iron compound is just in contact with the oxidized molecule, and the temperature rose rapidly at a rate of 60°C/min with a duration of 61 s. Then the oxidation process proceeded to the electrochemical chemical oxidation phase, which in this process gradually decreased, and the temperature also exhibited a slow phase first decreasing and then rising, with a duration of 111 s. Until the completion of electrochemical oxidation, the oxidation process entered the chemical oxidation stage, which had rapid rise in temperature from 85°C to 276.2°C with a time of 426 s.
Optical fiber performance test
There are three main alarm ways for distributed fiber: temperature setting alarm, differential temperature alarm, and combination of temperature setting alarm and differential thermal alarms. To prevent the hazards caused by sulfide corrosion, it should be monitored for temperature and set an early warning value in the early stage of sulfide corrosion oxidation. According to the survey, the early warning temperature of sulfide corrosion oxidation was 70°C and the temperature rise rate was 60°C/min. Distributed fiber host thermometry in general factory the experiment of constant temperature environment with incubator will be used to verify the accuracy of fiber host thermometry. However, storage tank in the outdoor environment once sulfurization corrosion oxidation occurs, at this time the temperature change of the fiber is not in a constant temperature environment, the measurement error caused by the uneven temperature distribution. Because of the weak heat transfer ability of air, the temperature between the fiber contacting the tube wall and the fiber side contacting the air is not consistent, resulting in a low temperature value under one plane. In order to explore the real temperature response of the optical fiber placed on the storage tank under the condition of large area sulfide corrosion, Author designed the experimental device for the performance test of optical fiber arranged in the storage tank as shown in Figure 13. A 200 mm × 200 mm × 10 mm E235B steel plate was arranged horizontally, and the material used was consistent with the real tank material. Eight 80 mm × 8 mm 200 W heating rods were inserted horizontally into the steel plate. The heating rods were evenly distributed around the steel plate to ensure the uniform heating of the steel plate. The distributed optical fiber host was connected to the computer database through the gateway, which was convenient to obtain the temperature data of the optical fiber. The temperature controller was connected to the computer upper computer through the serial port to obtain the temperature data measured by the iron plate thermocouple. The thermocouple adopted the K-type thermocouple with chip type, which can be more accurate measure the temperature. Optical fiber performance testing experiment was mainly divided into constant temperature experiment and differential temperature experiment.
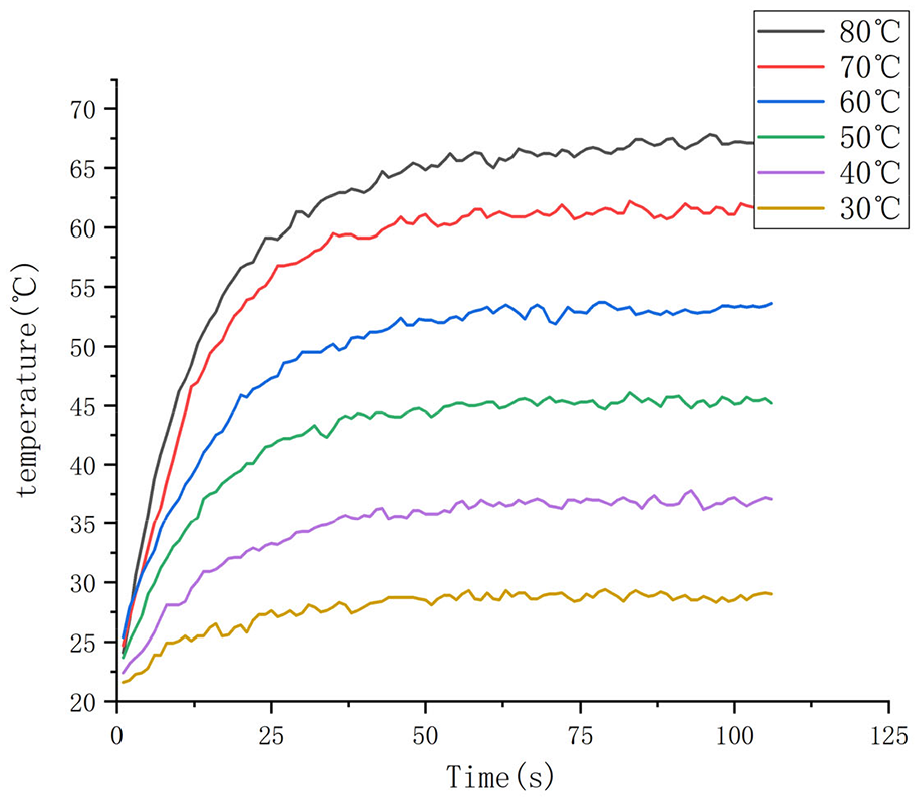
When the ambient temperature was normal temperature, the optical fiber was fixed on the steel plate around two circles (ensure that the heating part was greater than the spatial resolution), and heat the iron plate to 30, 40, 50, 60, 70, 80°C (the maximum temperature of optical fiber is 85°C), and test the maximum temperature that the optical fiber can finally reach. In the experiment, PID control and fuzzy PID control were used to analyze the temperature control of steel plate.
When the ambient temperature is normal temperature, the optical fiber was fixed on the steel plate around two circles (to ensure that the heating part was greater than the spatial resolution). The steel plate was heated to keep the steel plate at 10, 20, 30, 40, 50, 60, 70, 75°C/min (the limit temperature rate of steel plate heating), and the heating rate of optical fiber was tested. In the experiment, when the temperature controller heated the steel plate with constant heating power, the temperature of the steel plate in a small range (30°C–80°C) can also ensure a constant temperature rise rate. Therefore, this paper used PWM to control the heating rod to keep a constant rate to ensure a constant temperature rise rate in the early stage of steel plate. By setting different duty cycle, the steel plate can be heated at 10, 20, 30, 40, 50, 60, 70, 75°C/min.
Optical fiber performance test device.
Simulation of oxidation temperature of tank sulfide corrosion
Due to the existence of spatial resolution, the temperature has a large error when a small range of oxidation by sulfide corrosion occurs in the storage tank. In order to verify the change of temperature in the case that the oxidation area of sulfide corrosion is smaller than that in the case of spatial resolution, according to the temperature change in the oxidation temperature of sulfide corrosion of wet, iron sulfide compound bubbled air, a home-made temperature controlled system was utilized to achieve the temperature curve that approximates this aspect in this paper. In order to realize that the home-made temperature controlled system can simulate the temperature change of sulfurization corrosion oxidation self-heat entering humid air in the industrial field environment, E235B steel plates, which are the same material as reservoir tube walls, were chosen as the experimental plates in this paper. The steel plate size was 500 mm × 100 mm × 10 mm and the simulated tank walls were placed upright. In order to ensure that the home-made temperature controlled system can well control the heating of the experimental plate, and can achieve the same temperature as sulfide corrosion oxidation temperature change as well as the temperature rise rate, five 60 mm × 6 mm heaters were selected to achieve vertical insertion into the center of the steel plate by holes punched into the steel plate, and a small heat source was combined to generate heat for simulating the temperature curve close to that of the oxidation of sulfide corrosion. The design was shown in Figure 14. Thermometric fibers were directly taped to the steel plates. The computer transmits the set temperature information to the temperature control module. The temperature controller controls the heating rod to realize the temperature change of the steel plate, and returns the DTS data to the computer for analysis.
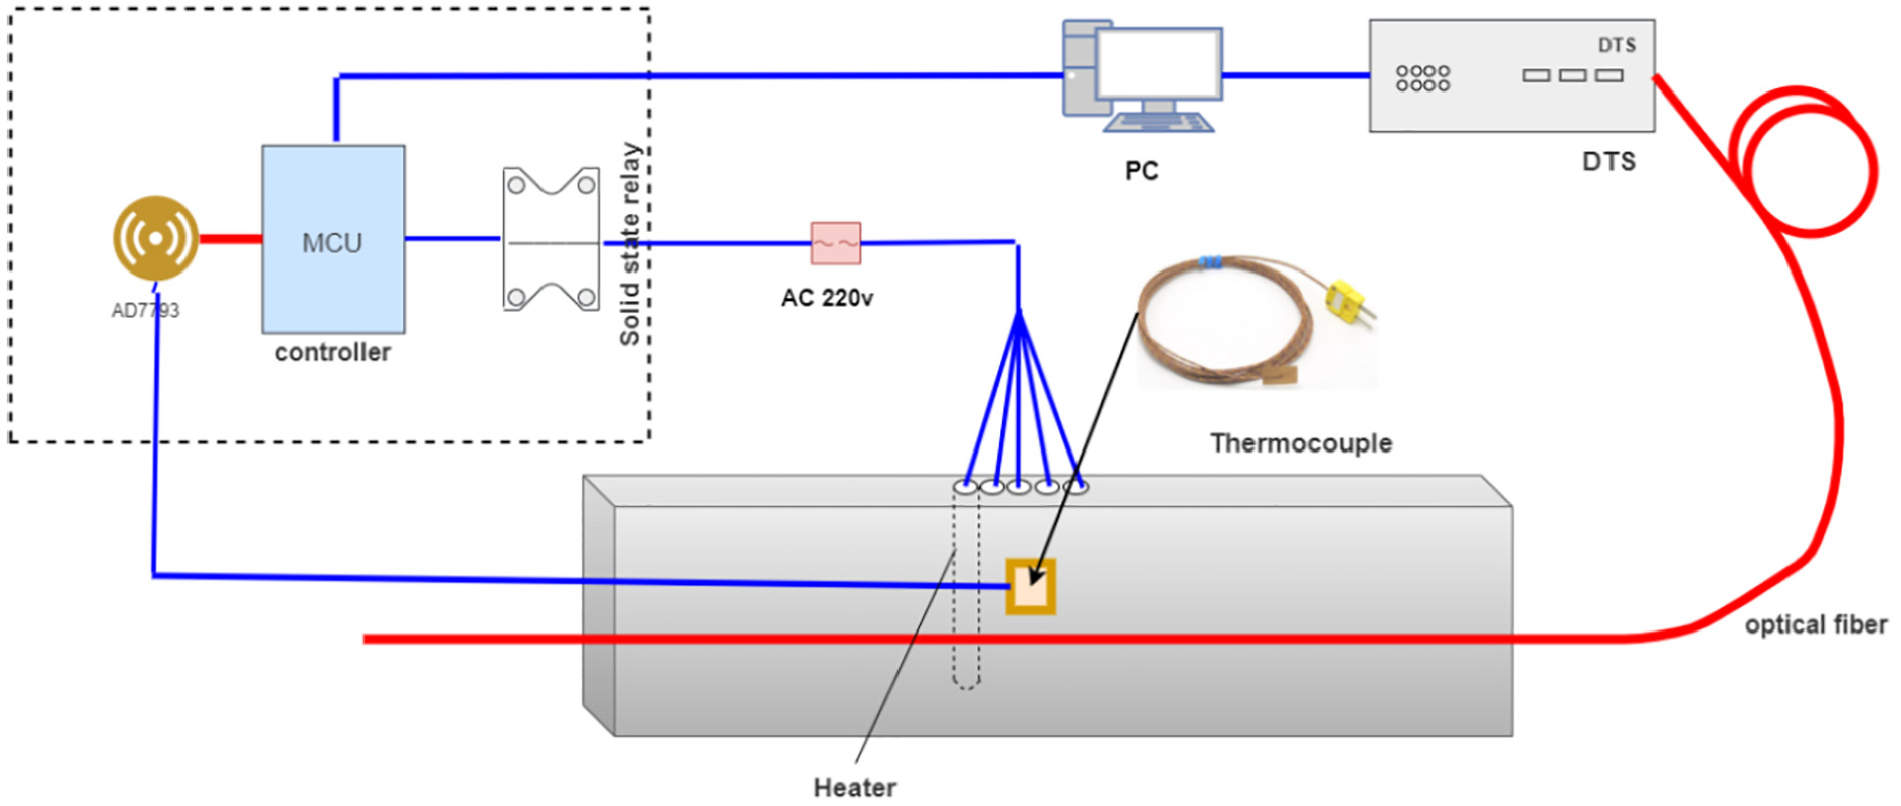
Experimental device for simulating self-heating of sulfide rust.
Due to the fuzzy-PID controller cannot control the temperature rising rate of the steel plate, the heating of the steel plate was controlled by the piecewise PID method in the experiment. The simulation process was also divided into early, middle and late stages according to the change of sulfur corrosion oxidation temperature curve.
In the actual application process, in order to facilitate the calculation, the following adjustments are made:
In the whole PID tuning process, the proportional control is to control the temperature rise rate, the integral control is to eliminate the static error, and the differential control is to reduce the overshoot. In the early stage of sulfide corrosion, the oxidation temperature increased from room temperature to 80°C, and the time to reach the maximum temperature was 60 s. According to the characteristics of PID control algorithm, by adjusting the parameters of PID, combined with the early sulfide corrosion temperature, the temperature rise rate gradually decreases from 70°C, so the early setting value is set at 70°C, and the overshoot is controlled to 14.3%, the maximum temperature reaches 80°C, and the time is about 61 s. According to this rule, the target temperature was 70°C and the early PID parameter was
Experimental results and analysis
Performance analysis of temperature controller
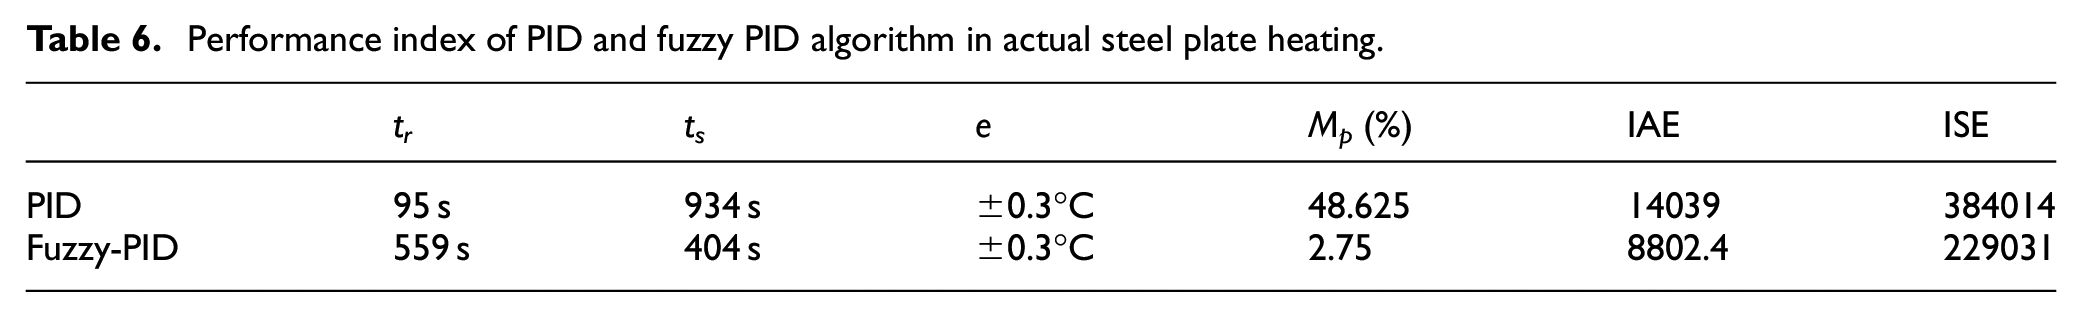
For optical fiber performance test, it is necessary to control the temperature of steel plate at 80°C. A comparison between PID controller and fuzzy-PID controller was completed by STM32. Figure 15 shows the temperature changes of PID controller and fuzzy-PID controller with time in the heating process of steel plate, and the relevant indexes are shown in Table 6. As shown in Table 6, during the heating process of steel plate, the overshoot of PID control was very large, the maximum temperature can reach 118.9°C, which was far beyond the temperature range that the optical fiber can bear. The maximum error of the two control algorithms in the temperature control accuracy is ± 0.3°C. From the point of view of stable time, the adjusting time of fuzzy PID was shorter than that of PID. The experimental results showed that the fuzzy-PID controller has better robustness as a test of fiber performance.
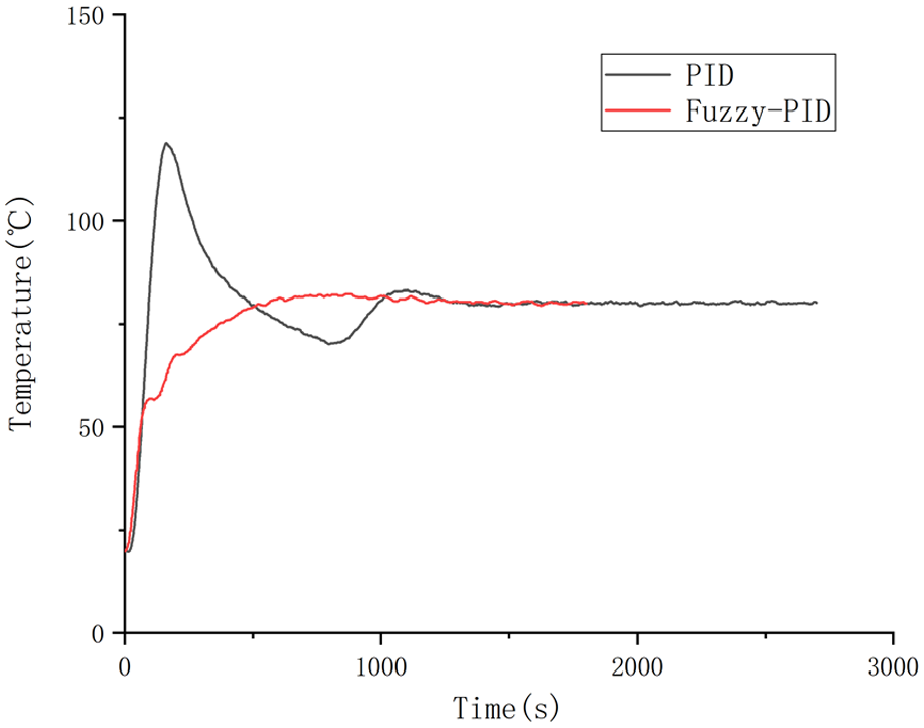
Temperature change of steel plate with time.
Performance index of PID and fuzzy PID algorithm in actual steel plate heating.
Alarm index of optical fiber
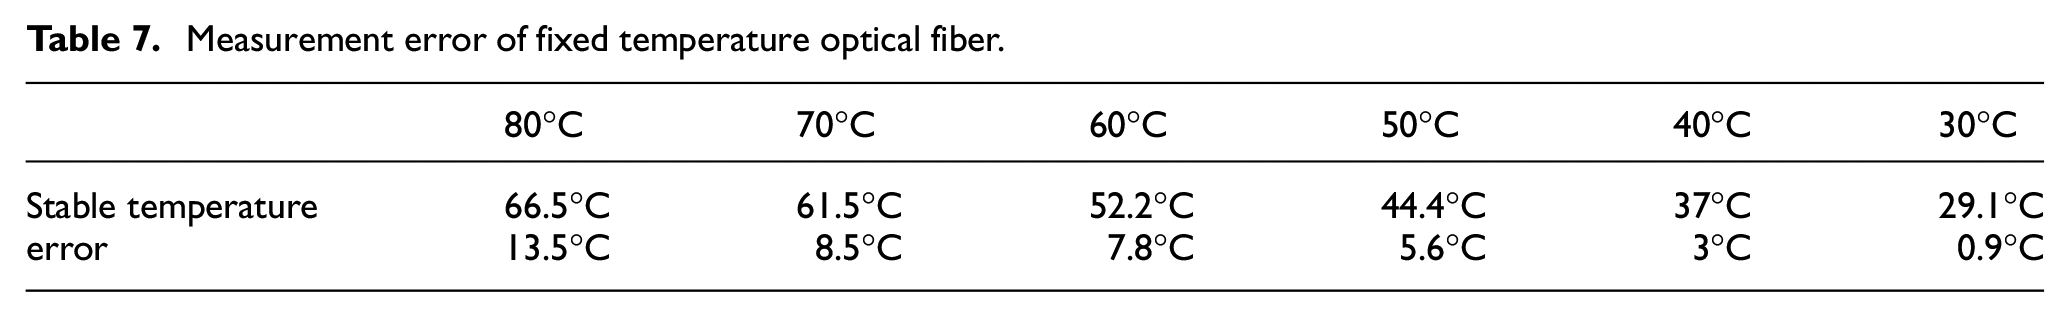
There are generally three alarm modes of optical fiber temperature measurement host: constant temperature alarm, differential temperature alarm, constant temperature and differential temperature joint alarm. It can be seen from Figure 16 that if the tank is actually arranged on the tank, the measured temperature may have a certain system error with the actual temperature generated by the pipe wall. Once a large area of sulfide corrosion and oxidation occurs, it is difficult to ensure that the received optical fiber data is the real temperature on the tank. The specific temperature error was shown in Table. 7. The early warning temperature of normal vulcanization corrosion is set at 70°C, and the test results of optical fiber constant temperature showed that the setting temperature of distributed optical fiber temperature measuring host should be set about 61.5°C.
Temperature monitoring of optical fiber at different steel plate temperatures.
Measurement error of fixed temperature optical fiber.
By testing, I found that the maximum temperature rise rate is about 12°C/min even in the hottest summer. According to Z.Dou 7 paper, the temperature rose from normal temperature to 80°C, the time was 1 min, and the temperature rise rate was about 60°C/min in the early stage. As shown in Figure 17, the optical fiber can track the change of heating rate under different steel plate heating rates. Experimental results showed that when the steel plate kept a constant rate of rise, the optical fiber can also maintain the corresponding constant temperature rise rate. When the temperature rise rate of steel plate was 60°C/min, the temperature rise rate of optical fiber was 21.6°C/min. Therefore, when the temperature rate of the storage tank measured by optical fiber reaches 21.6°C/min, the optical fiber needed to give differential temperature alarm. The specific temperature changes at different rates are shown in Figure 18.
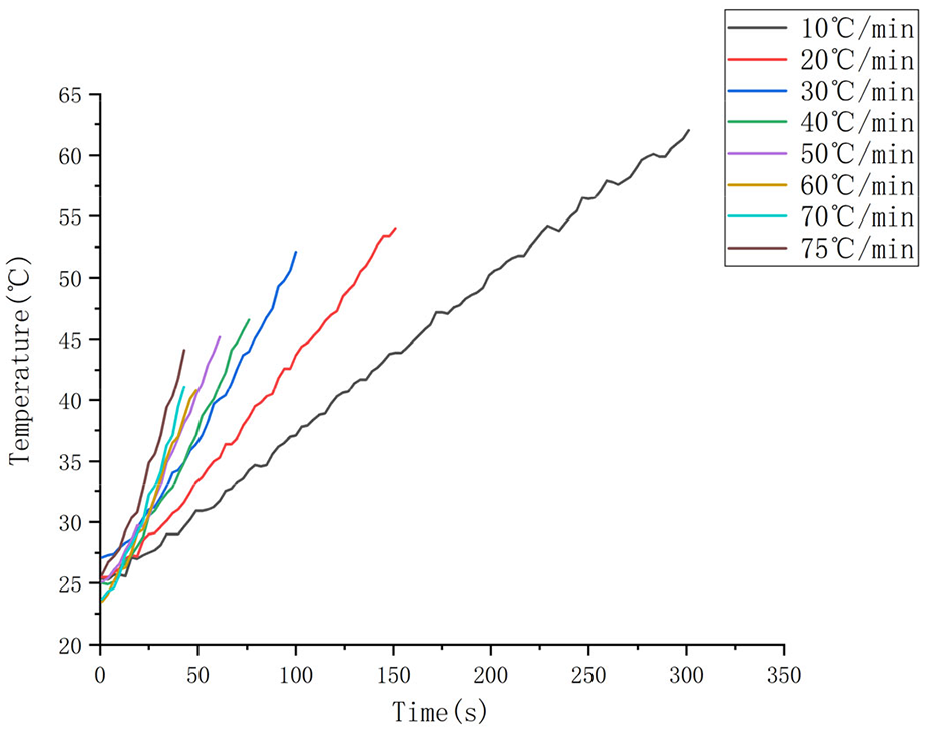
Temperature monitoring of optical fiber under different temperature rising rates of steel plate.
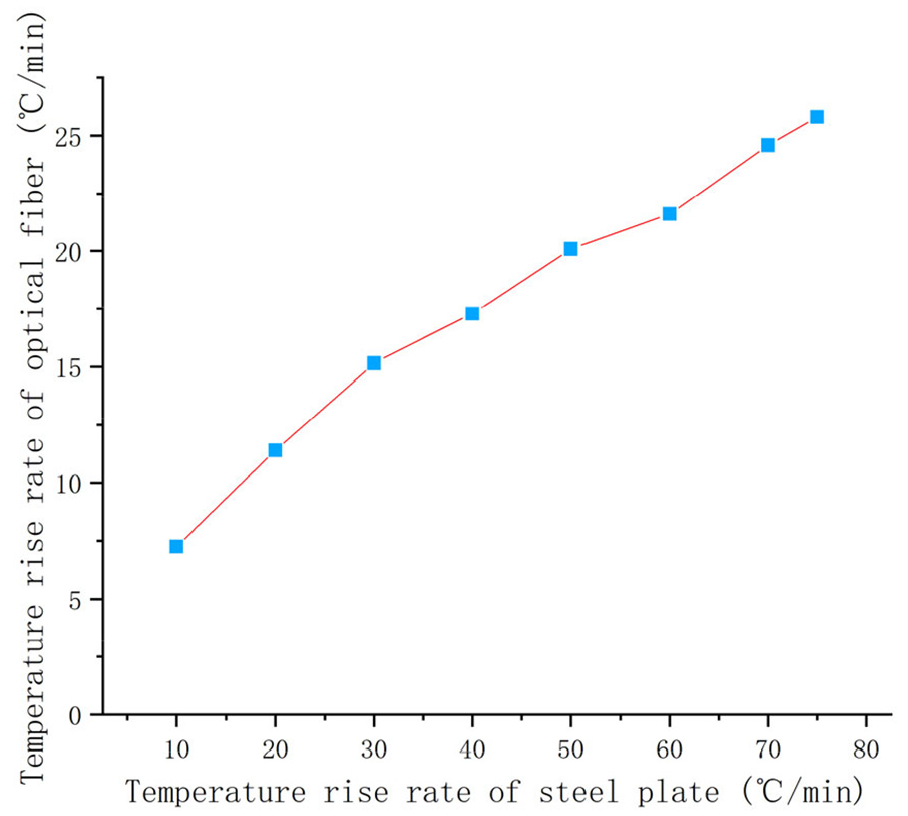
Temperature rise rate of optical fiber under different temperature rising rates of steel plate.
Simulation analysis of sulfide corrosion and oxidation of storage tank
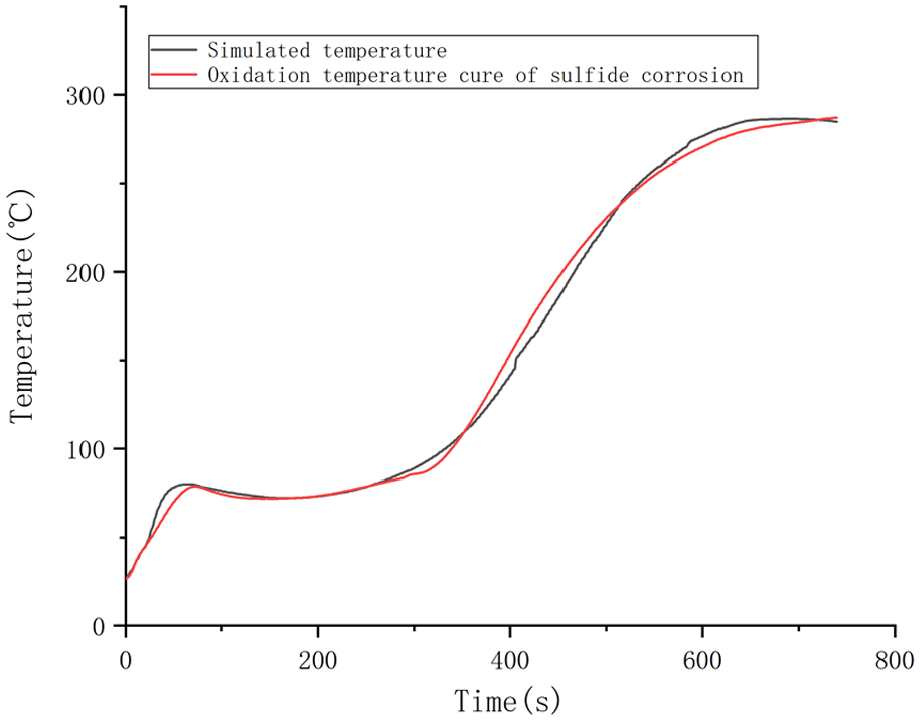
In order to solve the influence of small-scale sulfide corrosion and oxidation on the test system, in view of the whole sulfide corrosion oxidation reaction process, this paper proposed a heating rod instead of oxidation exothermic method. The heating range of the heating rod was (0.2–0.3 m). The temperature change of the whole vulcanization corrosion oxidation reaction process was simulated by using piecewise PID temperature control, as shown in Figure 17. The MSE and RMSE were 27.16 and 5.2, respectively. The maximum error of the first stage and the second stage was within 5°C, and the maximum error in the third stage was 12°C. The simulated temperature curve was close to the Oxidation temperature curve of sulfide corrosion from Dou et al., 7 which can be used to evaluate the sulfide corrosion oxidation test platform.
According to Figure 19, once the vulcanization corrosion reaches the late stage, the temperature will reach 286°C. At this time, the optical fiber can no longer work, and the storage tank will also cause fire due to high temperature. Therefore, it is necessary to monitor the temperature changes in the first stage of sulfide corrosion and oxidation.
Simulation of spontaneous combustion temperature of iron sulfide.
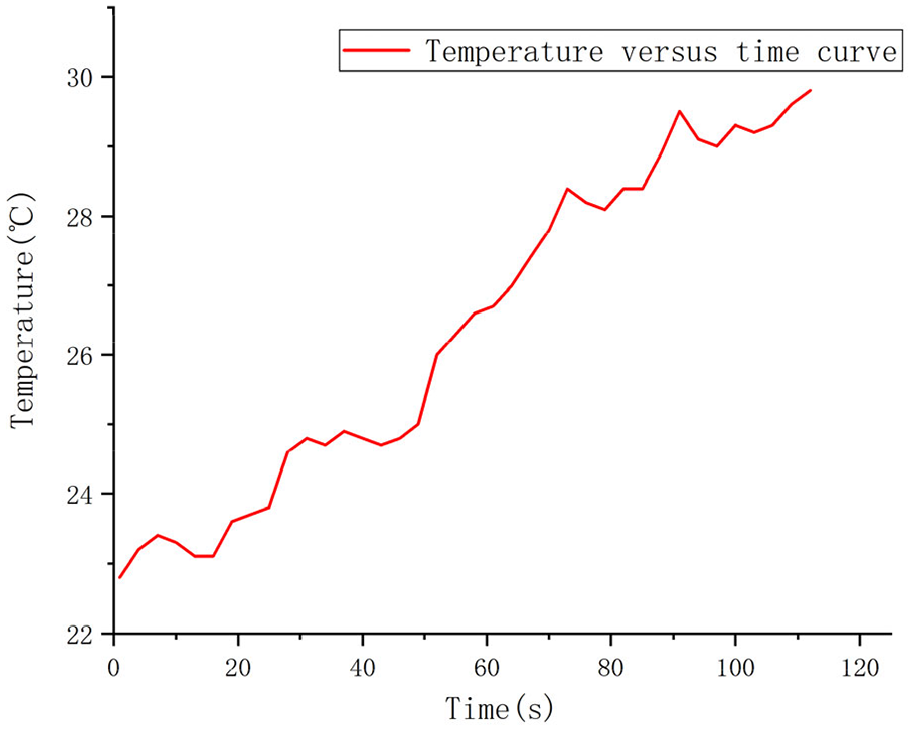
As shown in Figure 20 is the temperature change curve of the return temperature of the distributed optical fiber temperature measurement host closest to the heat source. In the early stage of small-scale vulcanization corrosion, the maximum temperature was 29.8°C, and the average temperature rise rate within the oxidation time was 3.24°C/min. therefore, once the small-scale vulcanization corrosion occurs, it is difficult to monitor the temperature change of vulcanization corrosion by setting the threshold alarm mode. At this time, it is necessary to introduce machine learning or deep learning to realize the vulcanization corrosion whether oxidation occurs or not.
Monitoring temperature change by early sulfurization corrosion oxidation optical fiber.
Conclusions
In this paper, the control algorithm for fiber performance test was analyzed. The first-order approximation method was used to establish the mathematical model of the test platform. The Simulink simulation results of PID algorithm, fuzzy algorithm and fuzzy-PID algorithm were compared. Because of the large error in the simulation of fuzzy algorithm, it had not been used in the actual system. From the point of view of PID and fuzzy PID, the two control algorithms had their own advantages and disadvantages. From the rise time point of view, the rise time of PID was faster, and can quickly reach the target temperature. From the perspective of precision, the control accuracy of the two control algorithms was not much different. From the perspective of overshoot and transition time, the fuzzy-PID algorithm had lower overshoot and shorter transition time. In order to meet the requirements of optical fiber performance, fuzzy-PID was selected as the performance test of optical fiber. The performance test of optical fiber showed that the temperature rises sharply and led to the difference between the temperature and the ambient temperature when the tank is exposed to sulfide corrosion. Therefore, it was necessary to set the alarm value of low temperature and temperature rise rate when realizing the sulfurized corrosion temperature alarm of optical fiber. A threshold alarm of 61.5°C for constant temperature and 21.6°C/min for differential temperature are also given through the above experiments. In order to verify that there was a large error in the measurement of small-scale vulcanization corrosion temperature due to the problem of spatial resolution, this paper proposed to use piecewise PID to control the heat source to realize the temperature curve simulation of small-scale vulcanization corrosion, and then used distributed optical fiber to collect and analyze.
Although the temperature change of the whole process of small-scale sulfide corrosion oxidation was simulated, there were still some problems worthy of further study:
The experimental results showed that the temperature is only 29.8°C and the average temperature rise rate was only 3.24°C/min when using optical fiber for small-scale sulfurization corrosion oxidation test. It was easy to confuse the temperature with the ambient temperature in summer and cause false alarm. If you want to make corresponding temperature alarm, some machine learning or deep learning algorithm should be introduced to identify the sulfide corrosion oxidation.
Footnotes
Declaration of conflicting interests
The author(s) declared no potential conflicts of interest with respect to the research, authorship, and/or publication of this article.
Funding
The author(s) disclosed receipt of the following financial support for the research, authorship, and/or publication of this article: The authors are grateful for the support given by the key project of National Natural Science Foundation of China under Grant No. 51834007.