
Abstract
The early fault signal of rolling bearings is very weak, and when analyzed under strong background noise, the traditional signal processing method is not ideal. To extract fault characteristic information more clearly, the second-order UCPSR method is applied to the early fault diagnosis of rolling bearings. The continuous potential function itself is a continuous sinusoidal function. The particle transition is smooth and the output is better. Because of its three parameters, the potential structure is more comprehensive and has more abundant characteristics. When the periodic signal, noise and potential function are the best match, the system exhibits better denoise compared to that of other methods. This paper discusses the influence of potential parameters on the motion state of particles between potential wells in combination with the potential parameter variation diagrams discussed. Then, the formula of output signal-to-noise ratio is derived to further study the relationships among potential parameters, and then the ant colony algorithm is used to optimize potential parameters in order to obtain the optimal output signal-to-noise ratio. Finally, an early weak fault diagnosis method for bearings based on the underdamped continuous potential stochastic resonance model is proposed. Through simulation and experimental verification, the underdamped continuous potential stochastic resonance results are compared with those of the time-delayed feedback stochastic resonance method, which proves the validity of the underdamped continuous potential stochastic resonance method.
Introduction
A rolling bearing is a frequently used part in rotary machinery. If a problem within this part occurs, production accuracy can be affected slightly, resulting in both the scrapping of a product, and seriously endangering the safety and property of machinery operators. Therefore, monitoring the operational status of these devices has become a top priority in the mechanical fault diagnosis industry. 1
To improve the effectiveness of early bearing fault extraction, scholars have proposed new methods such as acoustical signal extraction method, 2 frequency selection multiexpansion, 3 orthogonal matching pursuit, 4 wavelet transformation,5,6 empirical mode decomposition,7,8 time-domain averaging,9,10 and spectral kurtosis.11,12 The essence of the above methods is to suppress noise and highlight bearing fault features. Although these methods can effectively extract fault feature frequency, ultimately, useful information is lost while suppressing noise, which has an adverse effect on fault feature extraction. Stochastic resonance (SR) offers a new idea to signal processing. It utilizes the noise signal by transferring the noise energy to the target signal, then it enhances and extracts the fault characteristic frequency. The SR method 13 was first proposed by Italian scholars when they were studying climate problems and has been widely used in biology, 14 physics, 15 astronomy 16 and other fields. The earliest research on SR in the field of mechanical fault diagnosis focused on overcoming the problem of small-parameter limitation. However, the actual fault signals are mostly made up of large-parameter signals. Currently, the signal can be preprocessed through methods as modulation and demodulation, 17 secondary sampling, 18 and frequency shift scaling,19,20 so that the signal can meet the necessary small-parameter requirements.
After solving the problem of small parameter limitation, scholars applied different potential function SR to the field of mechanical fault diagnosis. Lu et al. 21 applied the Woods potential to the early fault diagnosis of bearings and improved the output signal-to-noise ratio (SNR) by adjusting the Woods-Saxon potential parameters. Moreover, the proposed method of this paper can adaptively match the input signal and yield better output results. Zhang et al. 22 applied a Woods-Saxon potential combined with a Gauss potential model SR to bearing fault diagnosis and found that detection is significantly improved over that of the traditional stochastic resonance (TSR) method. López et al. 23 studied the application of SR based on the FitzHug-Nagumo potential in vibration signals of rolling bearings, and then used particle swarm optimization to optimize potential parameters to identify the optimal output SNR. Zhang and Yang 24 applied periodic adaptive SR to the diagnosis of bearing weak faults. The particle swarm optimization algorithm was then used to optimize the parameters and optimize the output SNR. Xiao et al. 25 applied single potential well SR to bearing fault diagnosis and then found the optimal parameters by an adaptive method to improve the output. Qiao et al. 26 applied piecewise bistable potential SR to extract early faults of rotating machinery. Their method exhibited a good anti-noise ability and enhanced the fault signal well. Li et al. 27 applied a multistable potential function to the fault diagnosis of rotating machinery, which can be transformed into a monostable or bistable potential function. The multistable state can detect both high-SNR signals and low-SNR signals. Shi et al. 28 applied tristable potential SR to fault diagnosis, finding that the energy of a fault signal can be increased and that the fault frequency can be identified with appropriate delay feedback parameters. All these methods have achieved good results in the field of early fault diagnosis of bearings. However, the method proposed in the studies mainly addressed application of overdamped SR in bearing fault diagnosis. Although the research on underdamped SR is relatively rare, some studies have been conducted. He et al. 29 proposed an exponential potential underdamped SR method to study the influence of potential parameters on the performance of SR systems under different output SNRs and noise intensities. Bearing fault experiments demonstrates that this method produces larger output SNR and higher fault characteristic peak values than those of the TSR method. The TSR method suffers from having small-parameter limitations, and because mechanical fault signals mostly appear in nonlinear forms, so the TSR method cannot directly extract the fault. Therefore, in this paper, an underdamped continuous potential stochastic resonance (UCPSR) method is proposed and applied to the early fault diagnosis of bearings. Compared with the time-delayed feedback stochastic resonance (TFSR) method, the new potential function in the proposed method is a continuous sinusoidal function with smooth particle transition and no interval. In addition, because of the existence of multiple potential function parameters, the potential structure is more comprehensive, and has more abundant characteristics. Thus, the output obtained is better than that of the TFSR.
The rest of this paper is arranged as follows. In section “Introduction of UCPSR Method,” the method is introduced, the change of potential function parameters to its shape is discussed, and the SNR is deduced. Section “Simulation illustration” uses the simulated bearing fault to evaluate the performance of the proposed method and compare it with the TFSR processing results. Section “Experimental verification” validates the effectiveness of the new method through experiments. Section “Engineering verification” validates the proposed method through engineering data. Section “Conclusion” summarizes the paper.
Introduction of UCPSR method
Continuous potential model
The occurrence of SR requires the optimal matching of periodic signal, noise and potential function in a nonlinear systems. 30 The potential model has a great impact on the system output. In this paper, the following continuous potential model is introduced
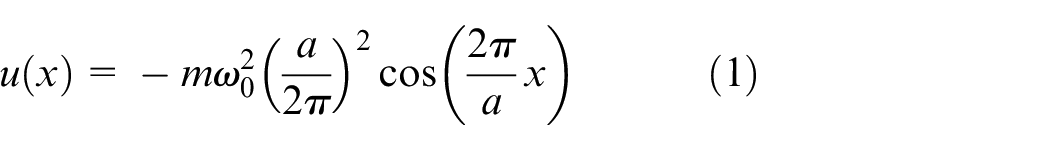
In equation (1), m, a, and
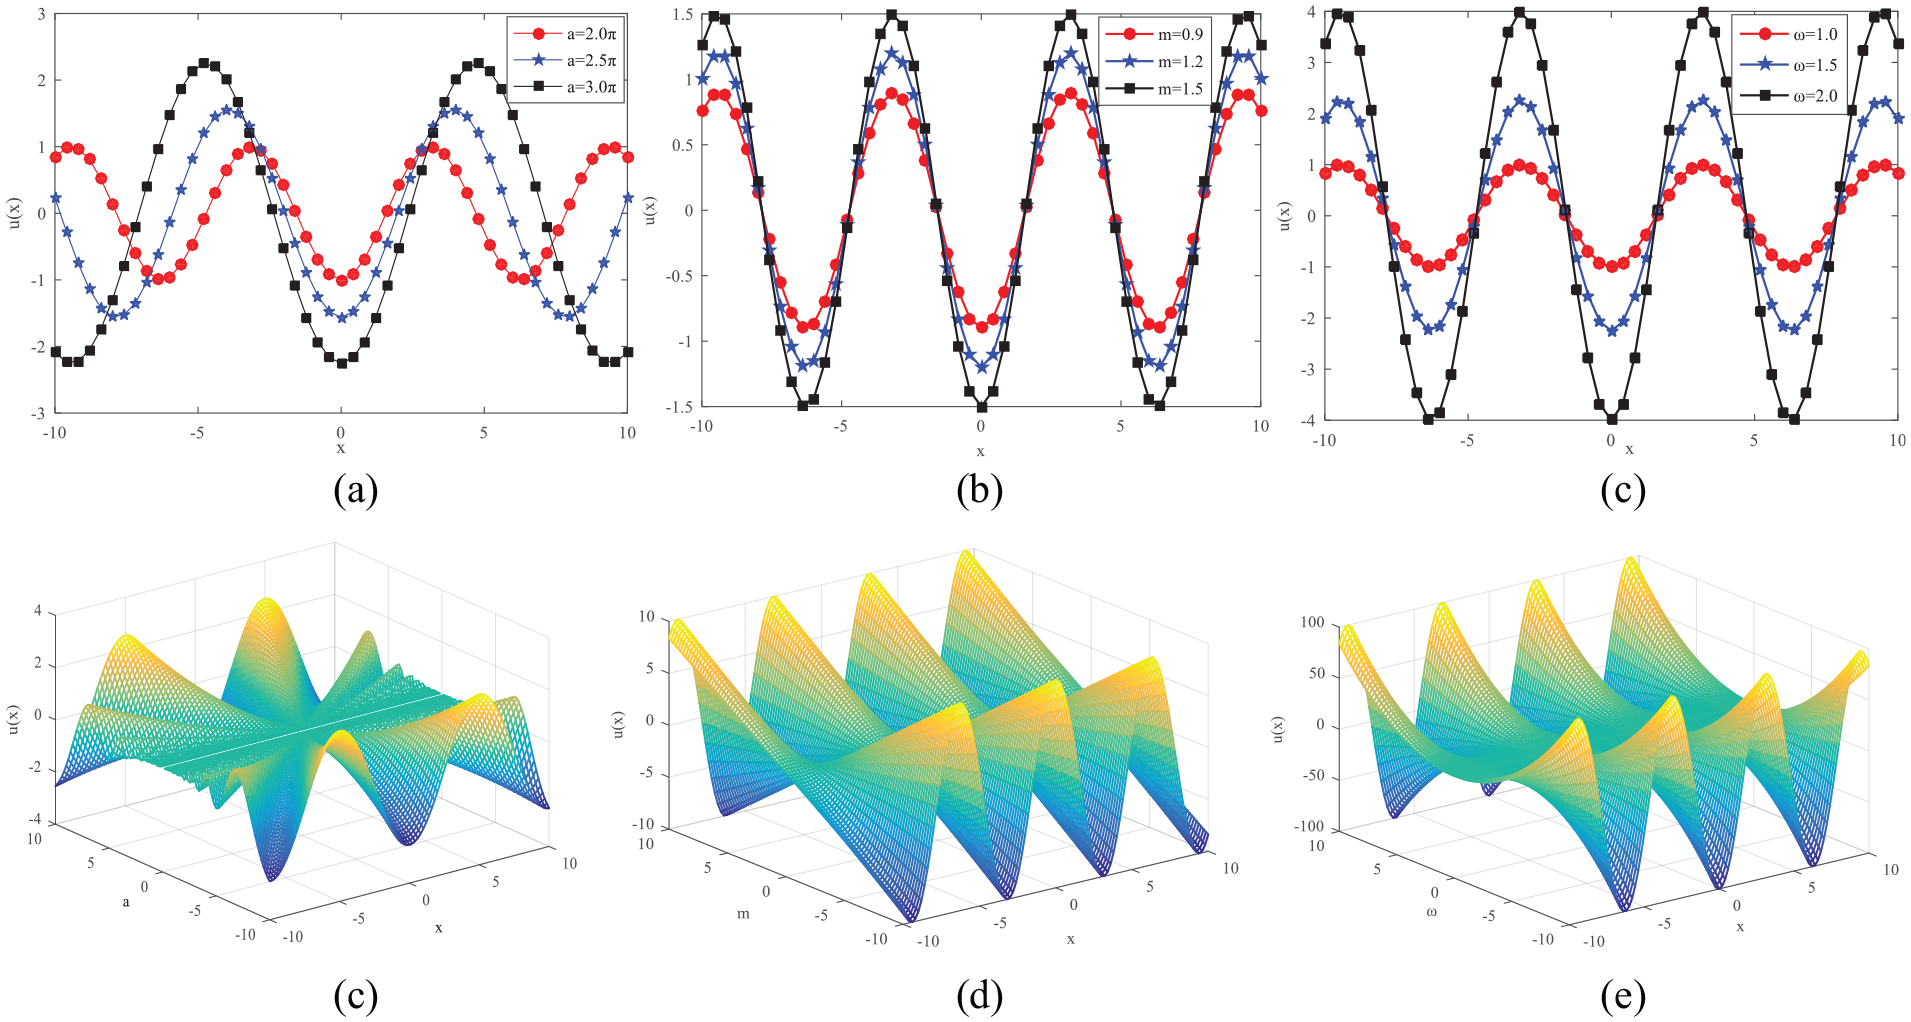
Continuous potential function variation with respect to different parameters. (a) and (d) Parameters are set to m = 1,
Figure 1(a) and (d) are two-dimensional and three-dimensional graphs, respectively, of the potential function with respect to the change of parameter a. It can be seen from Figure 1(a) that the potential function shifts to the right as parameter a increases. Owing to the inertia of the system, the particles can make better transitions, and it is easier to break through the barrier and obtain a better output. Figure 1(b) and (e) are two-dimensional and three-dimensional graphs, respectively, of the potential function with respect to the change of parameter m. The slope of the potential wall is changed by changing the potential function parameter m. The larger the value of m, the steeper the wall, and the more difficult it is for the particles to pass through the barrier. The smaller the value of m, the smaller both the barrier height and the depth of the well get. The height of the barrier is reduced, so the energy required for the transition between the two wells is further reduced. The noise and signal integrated energy are more easily transferred between the systems. The noise energy can then be more effectively converted into signal energy, making it possible for the fault signal to be amplified and for the noise to be suppressed. This results in a greatly improved system output SNR. Figure 1(c) and (f) show the two-dimensional and three-dimensional graphs, respectively, of the influence of potential parameter
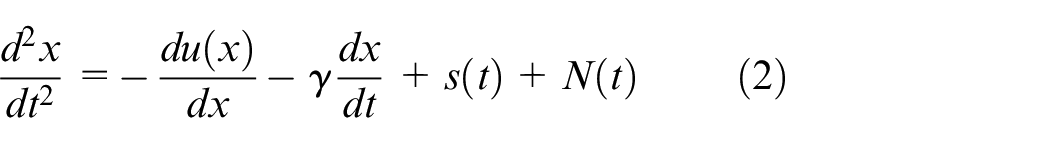
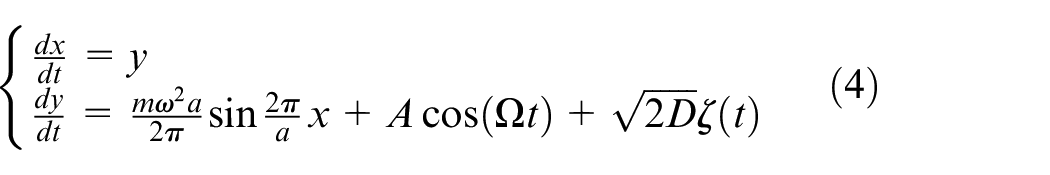
Underdamped second-order SR model
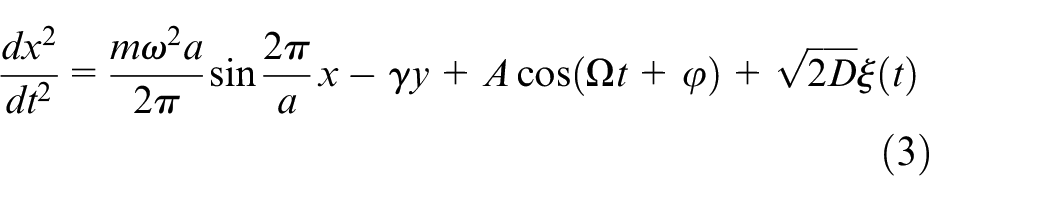
The traditional SR is an overdamped SR, but an underdamped SR is equivalent to quadratic filtering, which offers better output. In this paper, the following continuous potential underdamped SR model is proposed to replace the traditional bistable SR model
where
For simplicity of calculation, let
If we let
The probability density function of particle motion is equation (5)
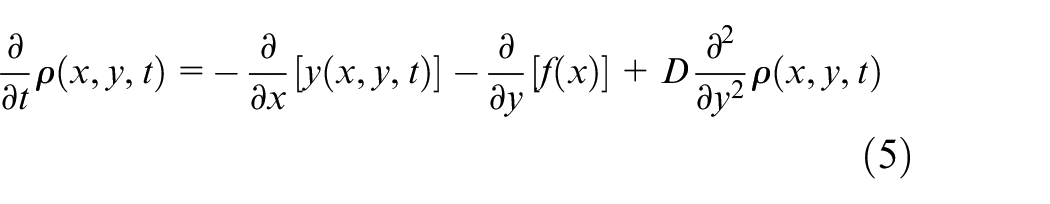
where
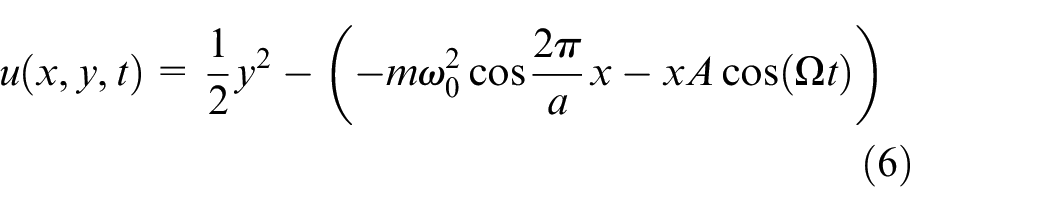
The probability of a particle transitioning between two potential wells can be expressed as
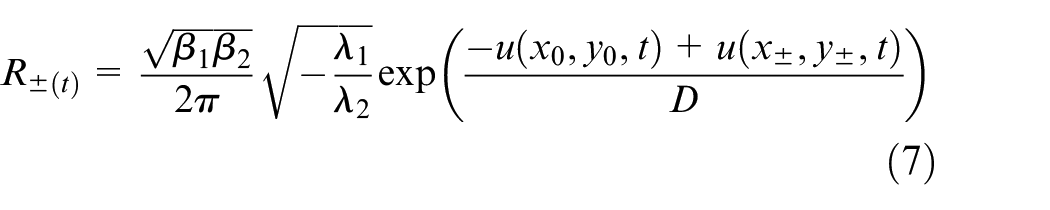
Substituting equation (6) into equation (7) results in
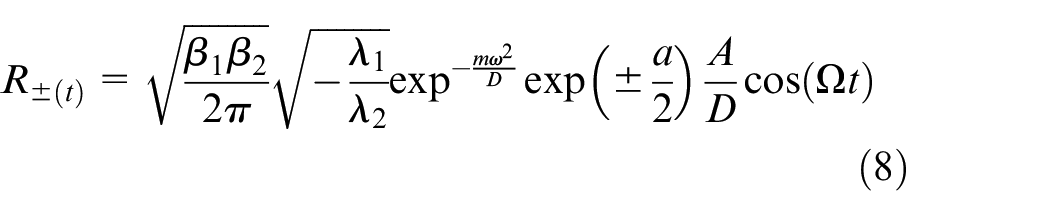
We are then able to create equation (8) by utilizing Taylor’s expansion formula
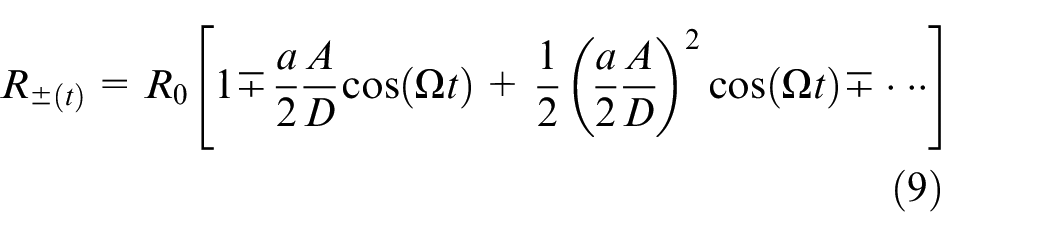
where
The system output power spectrum then becomes:
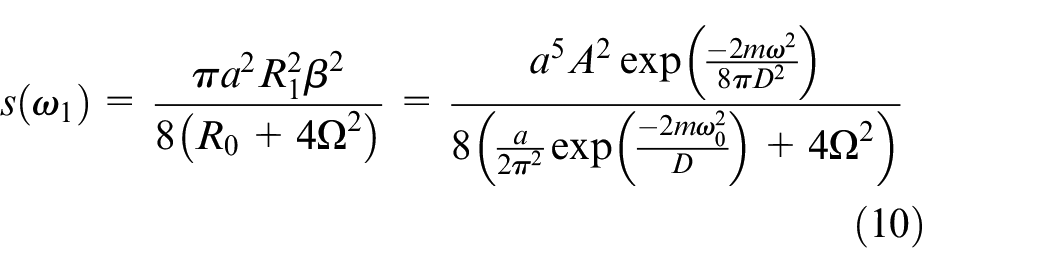
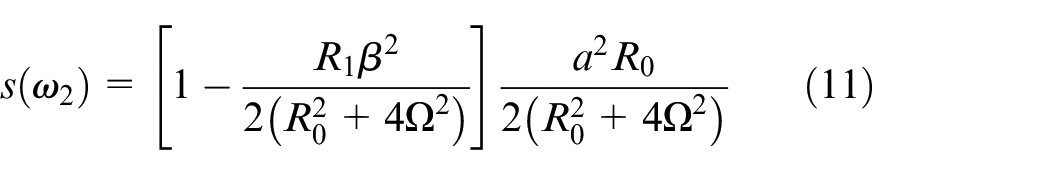
This makes it possible to obtain the output SNR as
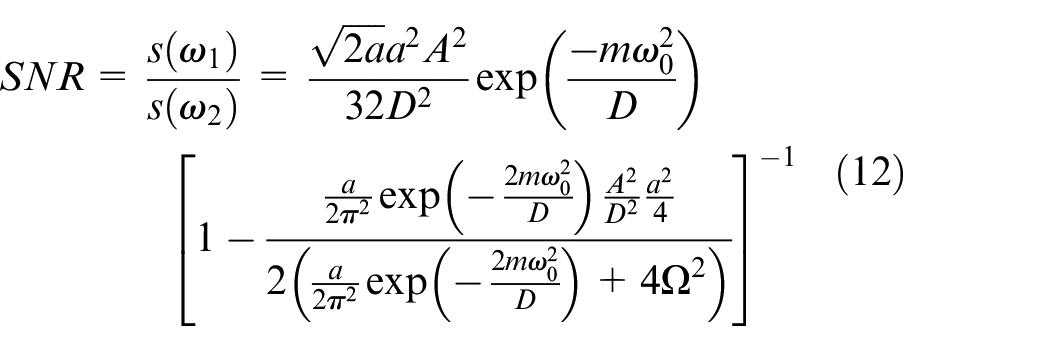
According to the derivation of the SNR from equation (12). Figure 2 sets the relevant parameters as:
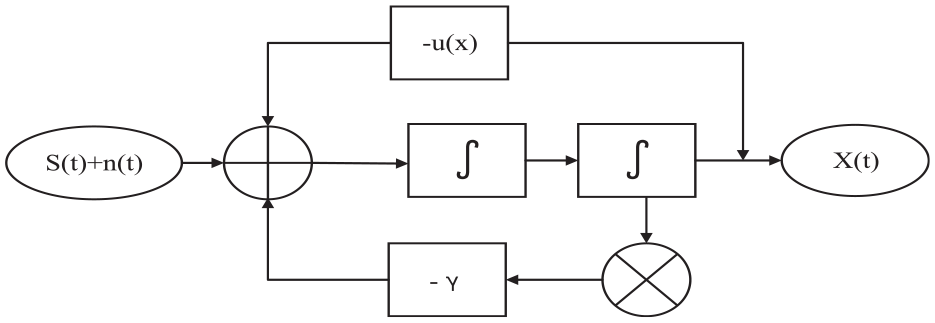
UCPSR system model.
Figure 3(b) shows the change of SNR by changing the size of parameter
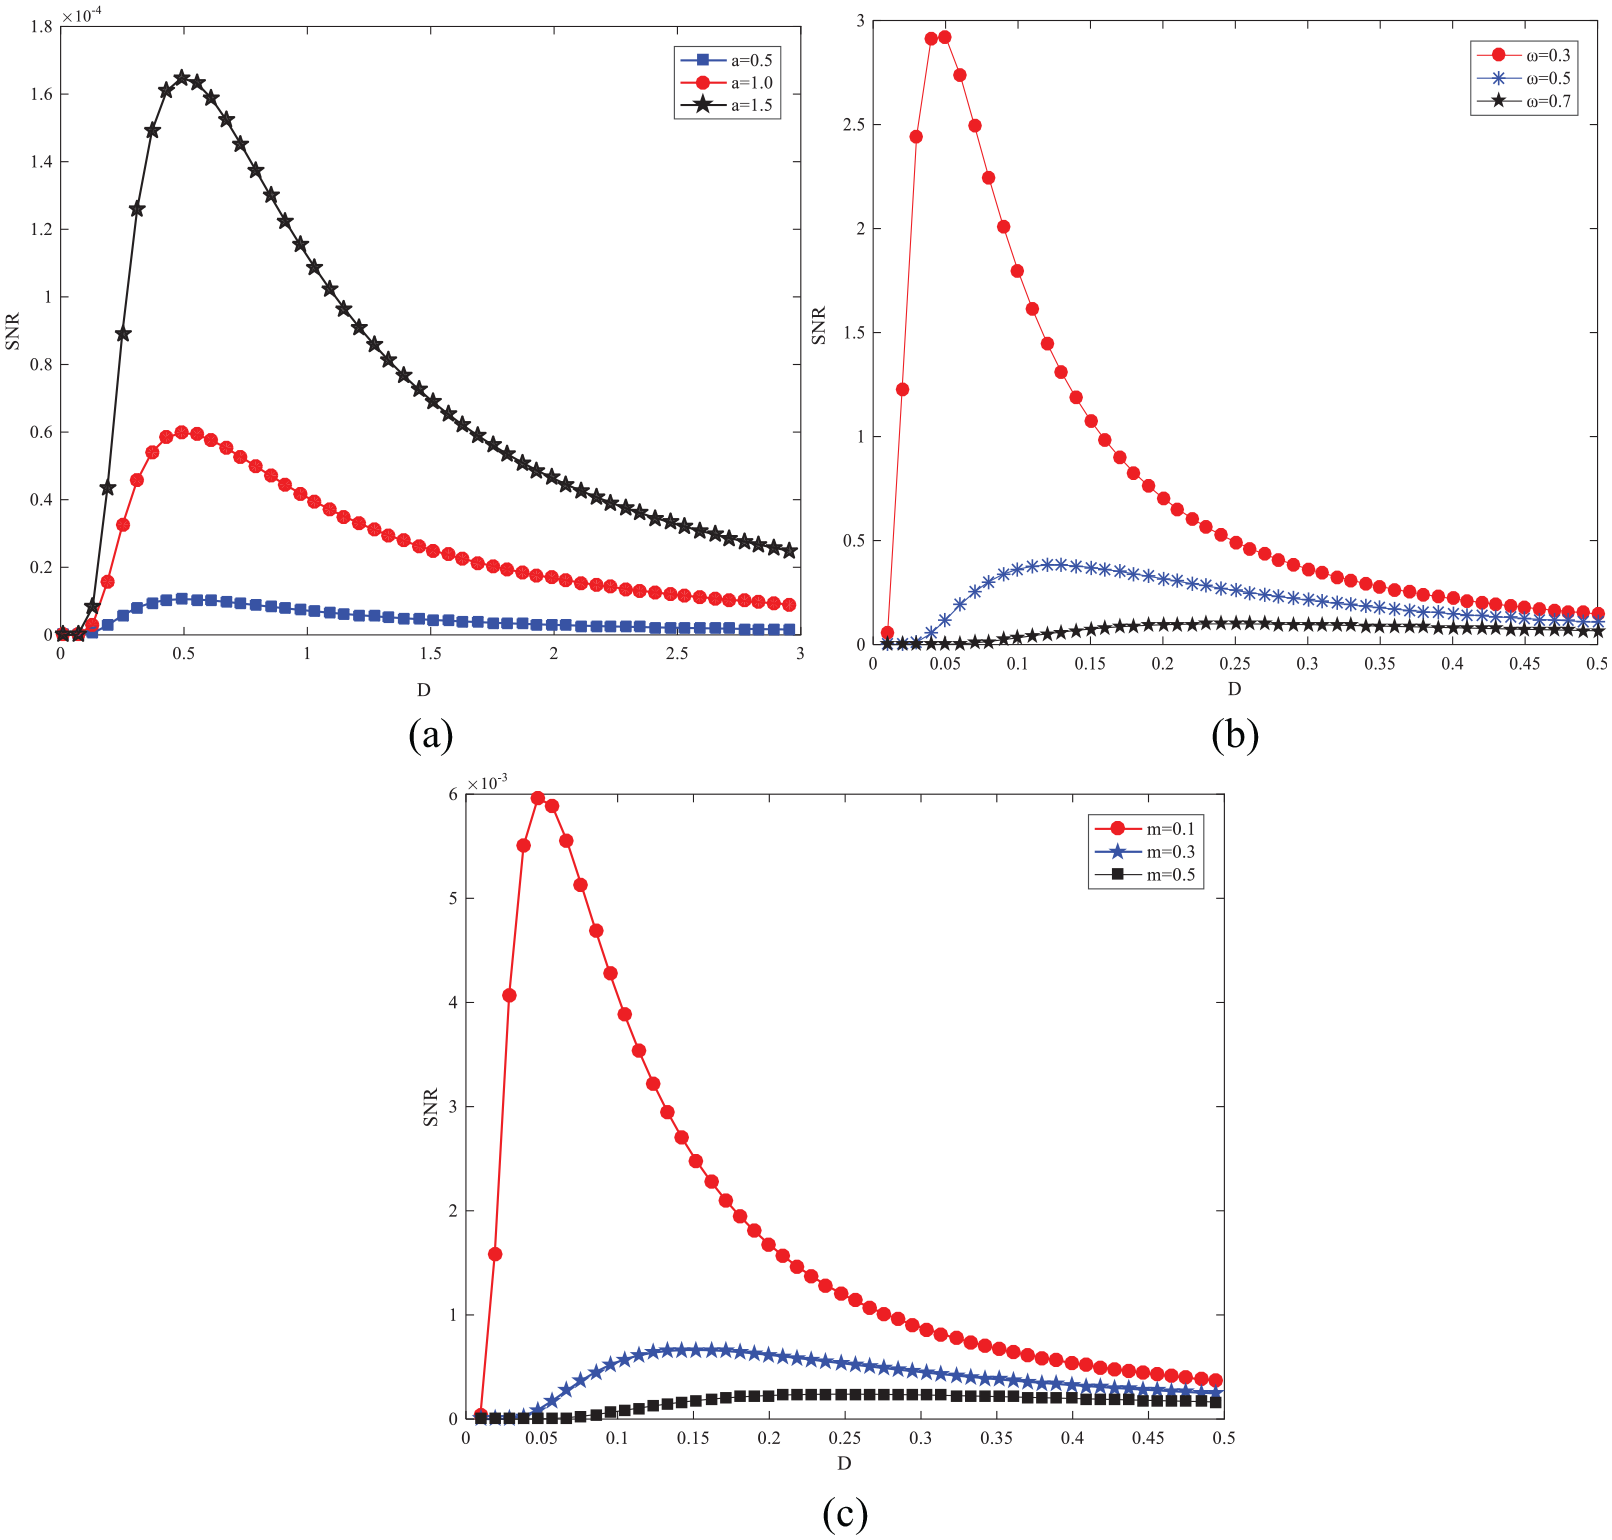
Variation diagram of SNR based on parameters a,
Fault diagnosis strategy for UCPSR weak signal
After discussing the continuous potential SR model and the output SNR, it is necessary to select appropriate parameters for the occurrence of SR, so that the system can reach the optimal matching point between the periodic signal and noise, thereby improving the output SNR of the system. We propose a UCPSR fault diagnosis strategy. The bearing fault signal is detected by the continuous potential SR method, and potential function parameters are optimized by the ant colony algorithm to improve signal output. The SNR is used to evaluate the output performance of the UCPSR method. The SNR is defined as
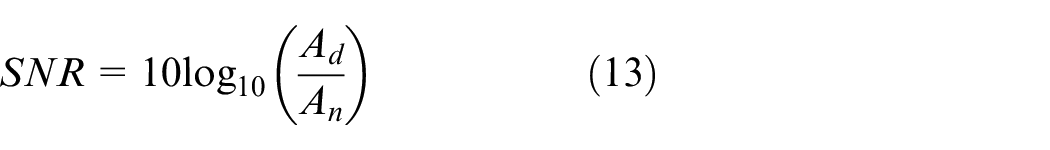
Where
Signal preprocessing. First, the envelope signal is obtained by Hilbert demodulation of the original signal. Then the envelope signal is frequency shifted and scaled to meet the requirements of small parameters.
Parameter initialization. The damping factor is fixed and the ranges of m, a, and
Output calculation. First, the fourth-order Runge-Kutta is used to solve the equation (4) and the output waveform is obtained. Then the output SNR of the system is calculated by using equation (13).
Output evaluation. The continuous potential model is combined with the ant colony algorithm to search for the optimal values of the potential parameters m, a, and
Signal post-processing. The optimal parameters are substituted into the potential model to obtain the optimal output. The fault characteristic frequency is identified by performing a Fourier transform analysis of the signal spectrum.
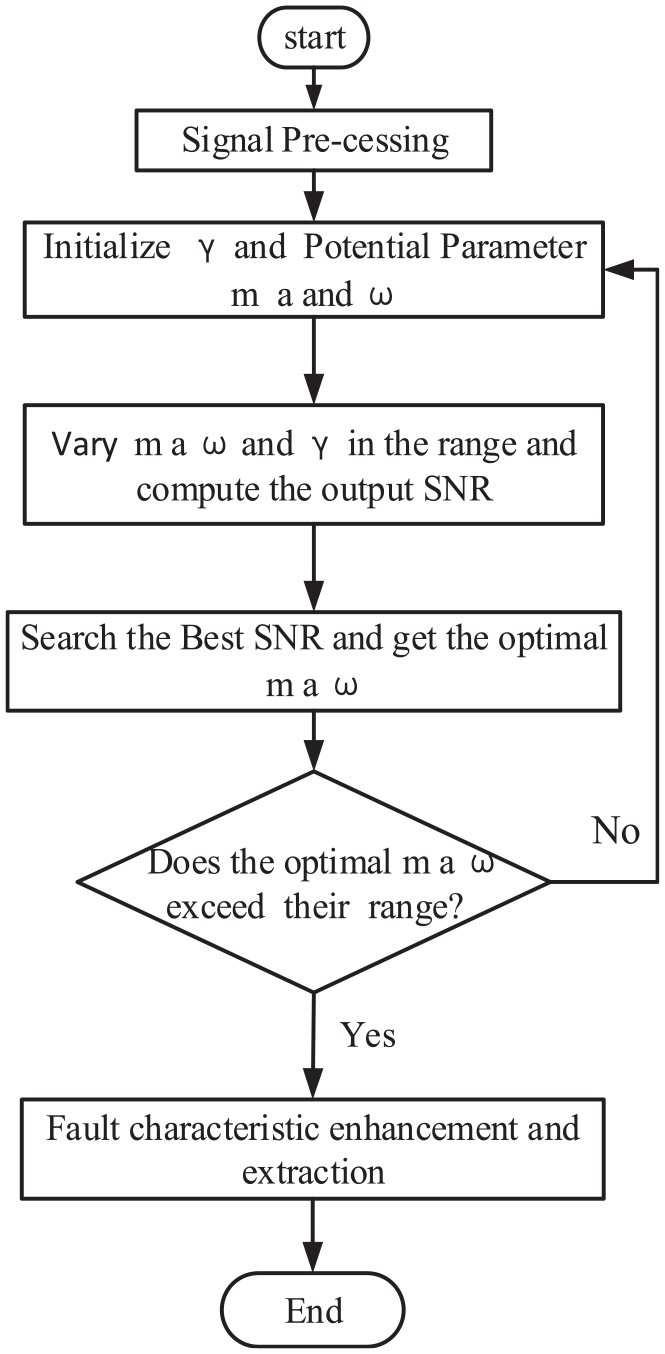
UCPSR fault diagnosis strategy.
Simulation illustration
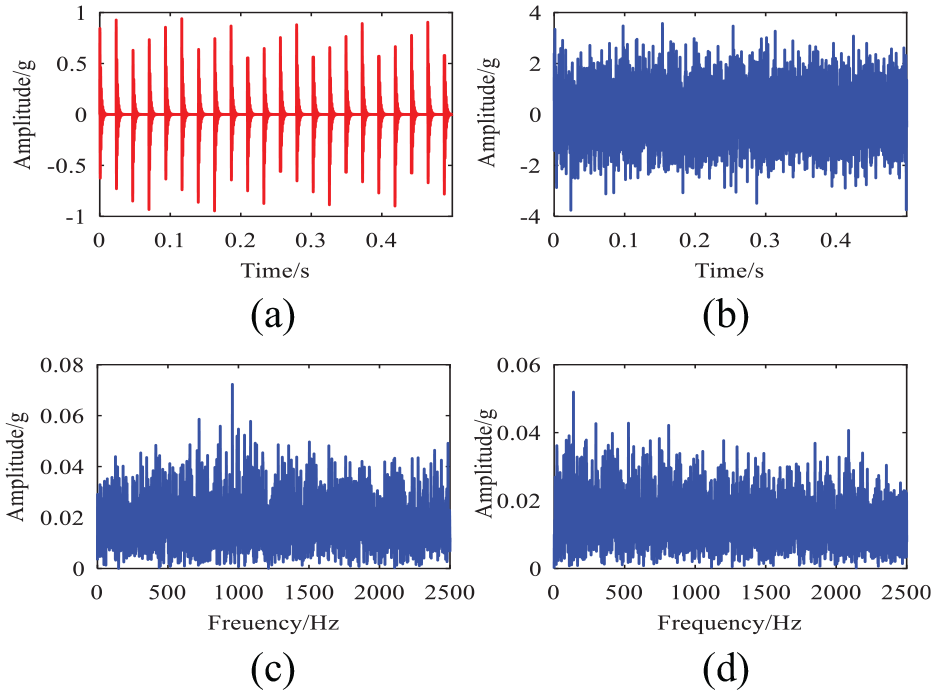
To verify the validity of the continuous potential function SR method, we performed simulation. First, we constructed a bearing fault signal by using the following equation
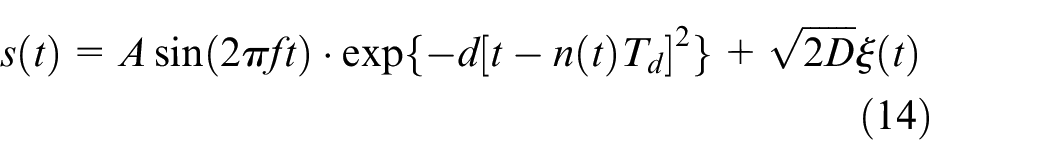
where A is the amplitude of the simulated signal, f is the modulation frequency, and d is the signal attenuation rate.
Figure 5 shows the signal simulation results: Figure 5(a) shows a clean signal with obvious periodic components. Figure 5(b) shows the signal after noise is added. The periodic signal is severely annihilated by the noise and no information can be discerned. Figure 5(c) shows the signal spectrum obtained by performing a Fast Fourier transform (FFT), but still no useful information can be revealed. Figure 5(d) shows the envelope spectrum obtained after performing a Hilbert demodulation.
Simulated bearing signal: (a) the clean periodic signal, (b) signal after noise is added, (c) the spectrogram, and (d) the envelope spectrum.
To illustrate the superiority of the UCPSR method, the Hilbert-demodulated envelope signal was frequency shifted and scaled to meet the requirements of small parameters. Then it was processed by using the TFSR 32 method, and the parameters in the potential function were optimized by the ant colony algorithm to obtain the optimal output SNR of 20.3322 dB. The TFSR time-domain diagram is show in Figure 6(a) and (b) is the TFSR spectrum. From Figure 6(b), it can be clearly seen that the fault characteristic frequency is 43 Hz that its peak value is 0.1123, thus the fault is clearly identified. It can be seen from Figure 6(b) that the noise component of the high-frequency part is obviously reduced, but the noise interference of the part near the fault characteristic frequency has certain influence on fault identification. Consequently, the signal was also processed by using the UCPSR method, and the output SNR was found to be 26.06 dB.
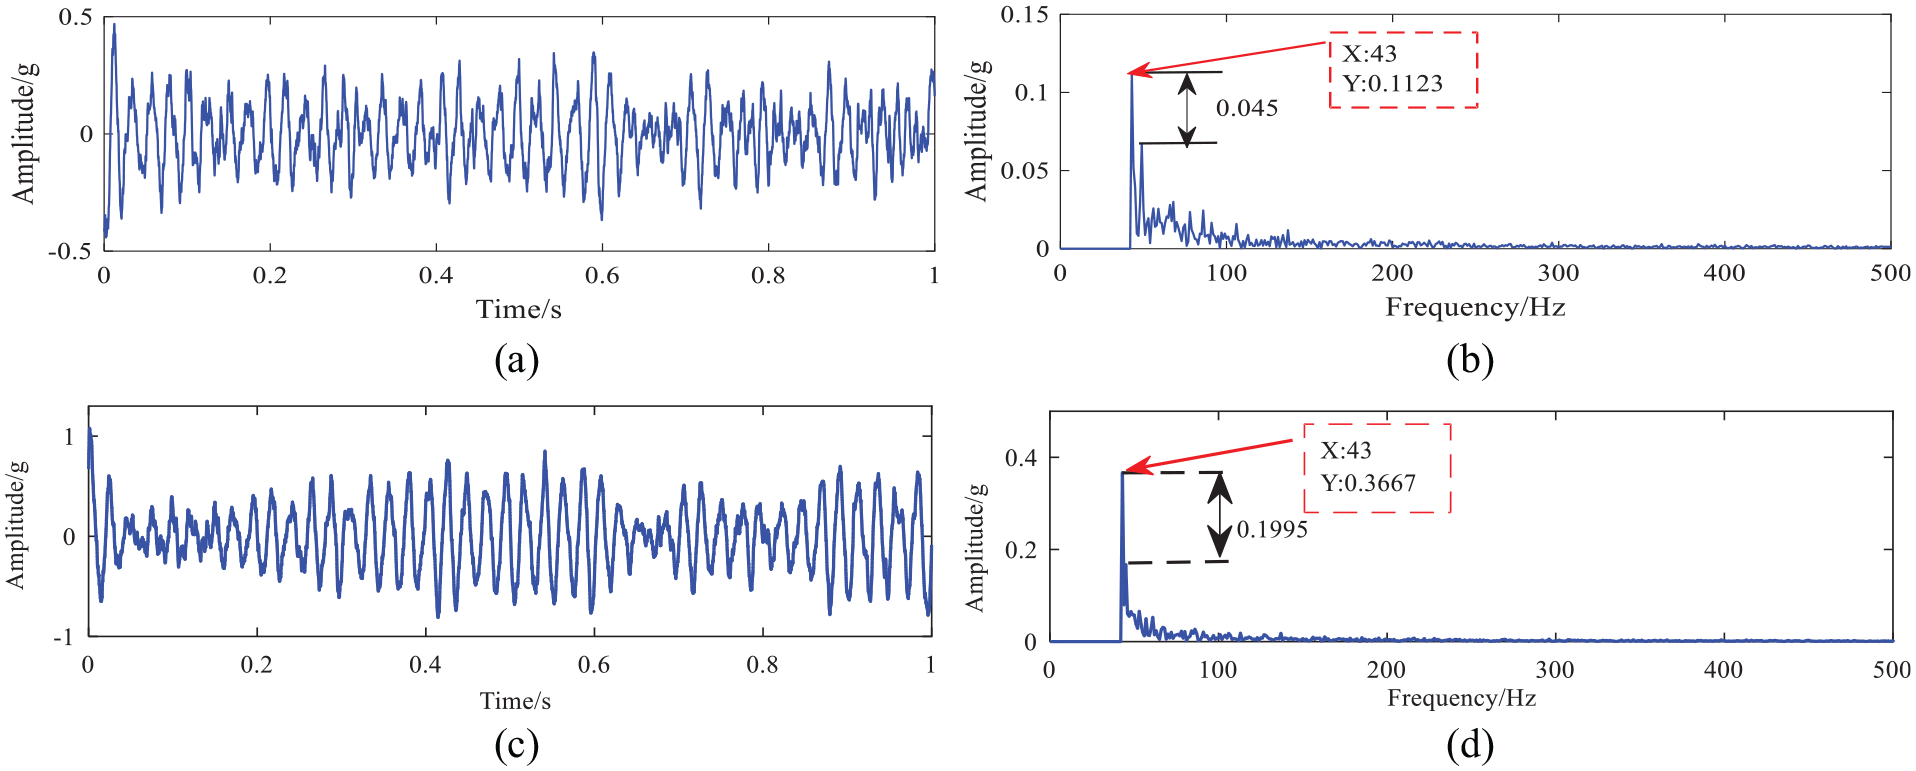
(a) Time-domain signal processed by using the TFSR, (b) spectrum processed by using the TFSR, (c) time-domain map processed by using UCPSR method, and (d) spectrum processed by using UCPSR method.
Figure 6(c) shows the time-domain waveform of UCPSR processing, and Figure 6(d) shows the spectrum of UCPSR processing. We compare the results of UCPSR with those of TFSR. By comparing Figure 6(d) with Figure 6(b), it can be seen that there is almost no noise interference in the low-frequency range of the spectrum processed by using the UCPSR method, and the fault characteristic frequency is 43 Hz and the peak value of the fault characteristic is 0.3667. The difference between the peak value of the fault and the peak value of the maximum noise(the recognition degree of fault feature) is 0.1995, which is an increase of 0.045 compared with the result of TFSR method. The noise component around the fault peak is significantly less than that of the TFSR method. From the above analysis, we can see that the effect of UCPSR method is more effective than the TFSR method.
Experimental verification
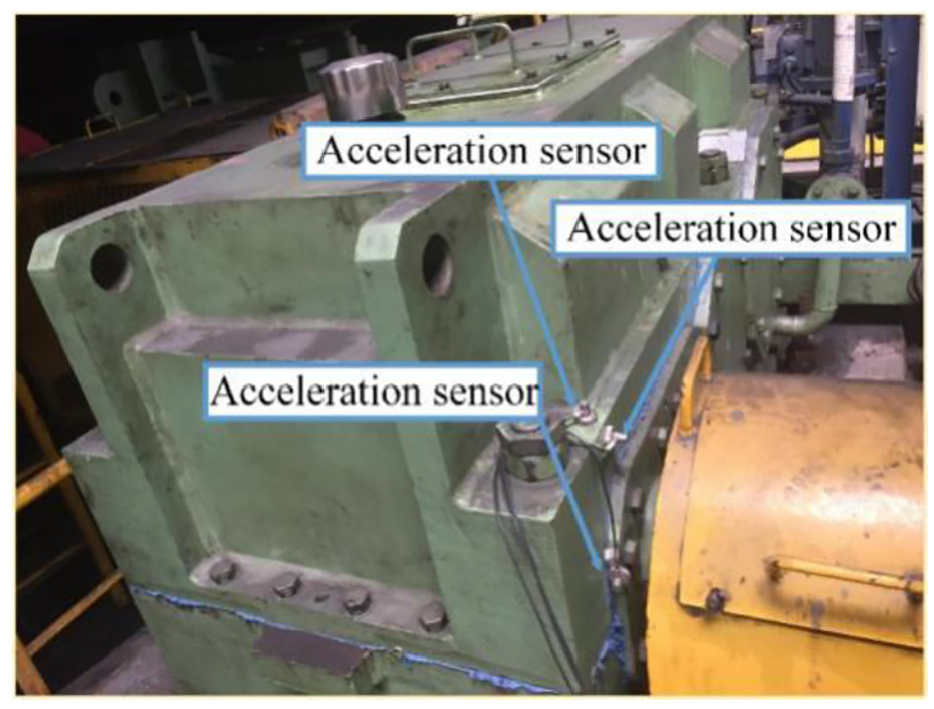
Rolling bearings are widely used in practical applications. However, long-term rotation will cause wear of a bearing’s inner ring, outer ring, or rolling element, all of which will affect the normal operation of the machine. To better identify early weak bearing faults, the proposed continuous potential function SR method was applied to fault feature extraction, and the results were compared with the TFSR method. We analyzed a set of inner rings fault data, and the experimental data were taken from a comprehensive test bench used for mechanical equipment fault diagnosis (see Figure 7). Three acceleration sensors, horizontal, vertical, and axial, are arranged in the bearing seat of the test bed to collect experimental data. In this experiment, the bearing model is the rolling bearing ER-12 K, the number of roller is 8, the rolling element diameter is 7.9375 mm, the bearing pitch diameter is 33.5 mm, and the pressure angle is
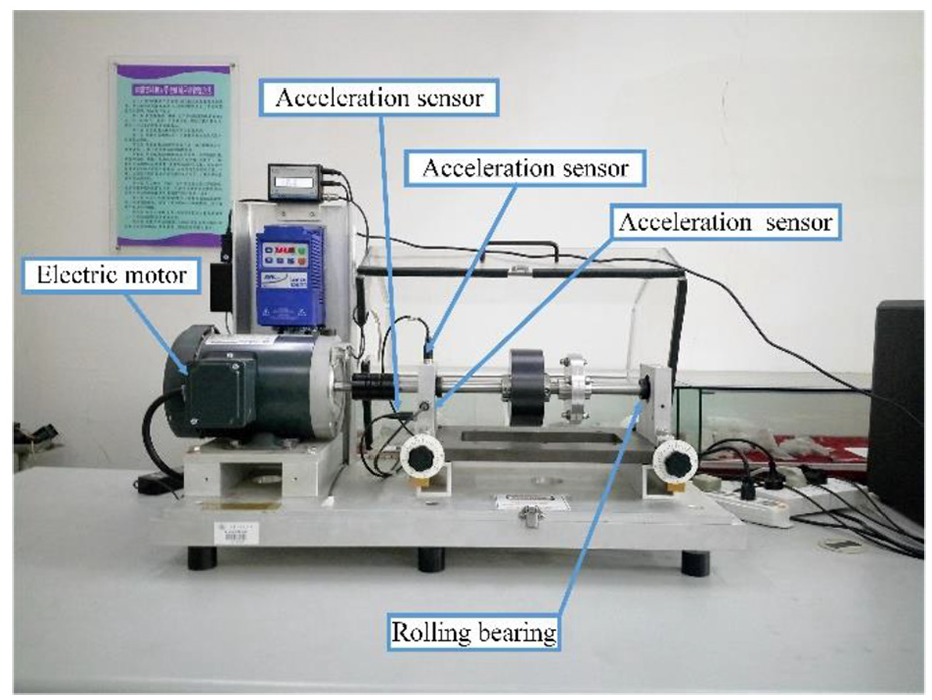
Mechanical comprehensive fault test bench.
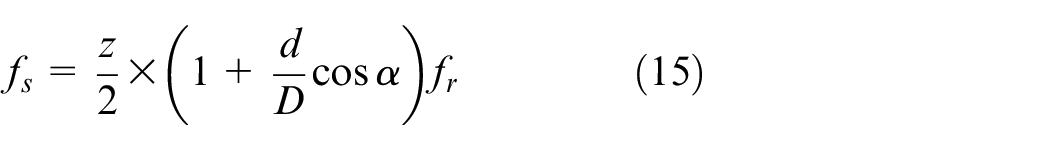
In the equation (15), z is the number of rolling elements, d is the diameter of the rolling element, D is the pitch diameter,
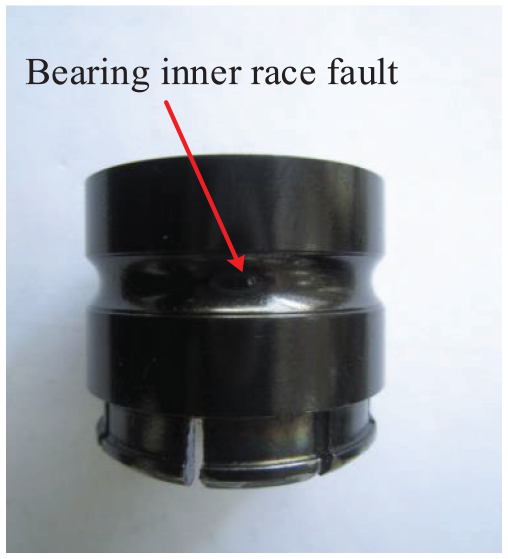
Experimental verification of faulty bearing parts.
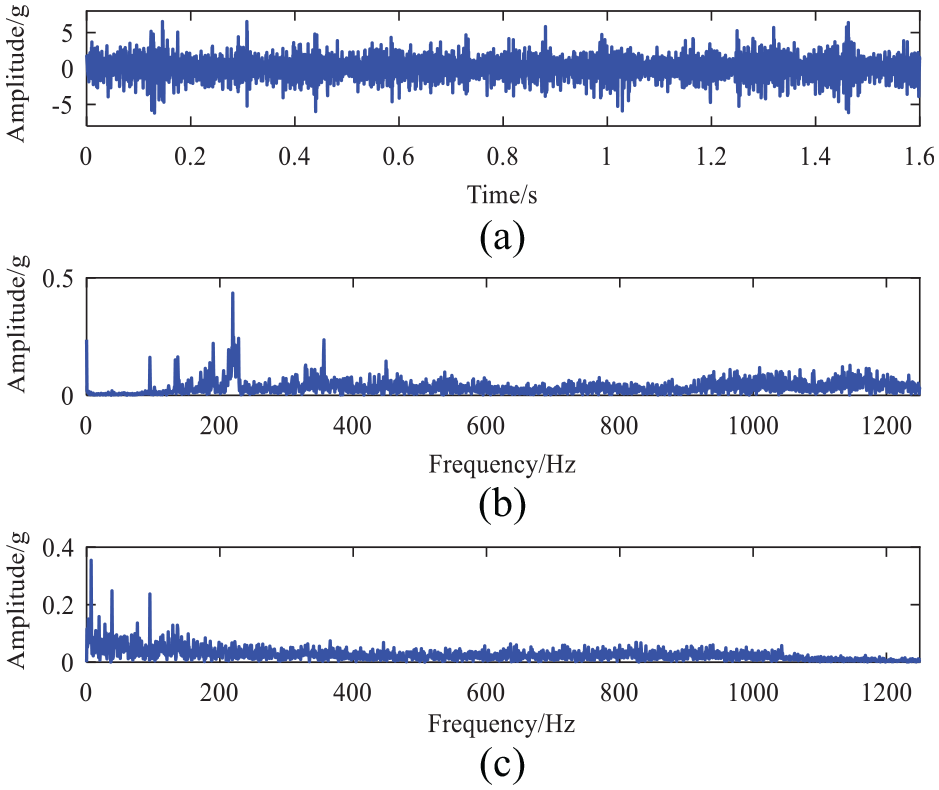
The time-domain diagram, frequency spectrum and envelope spectrum of the original signal obtained by using traditional signal analysis are shown in Figure 9. Because the signal is heavily covered by noise, the fault characteristic frequency cannot be seen from the time-domain diagram and frequency spectrum, while the fault characteristic frequency can be found from the envelope spectrum by Hilbert demodulation, but there is a lot of noise around the fault feature, so the fault cannot be accurately identified. The TFSR method was applied to extract fault features of rolling bearings. The output time-domain and spectrum diagrams are shown in Figure 10. The pulse contour caused by the fault characteristic frequencies is obviously enhanced in Figure 10(a). From Figure 10(b), it is clear that the characteristic frequency of the fault is 172 Hz, and that the peak value of the fault is 0.1016, which is much higher than the peak value of the surrounding noise, and that the high-frequency noise signal is significantly reduced. The TFSR method successfully extracts the characteristic frequency of the fault. The difference between the peak value of the fault and the peak value of the noise is 0.06874. However, some noise interference at the low frequency affects the accuracy of fault extraction. In order to illustrate the advantages of the UCPSR method, we investigated the effectiveness of UCPSR and TFSR. Figure 10(c) and (d) show the time domain and frequency spectrum obtained, respectively, by using UCPSR. From Figure 10(d), the characteristic frequency of the fault can be clearly found. The peak value of the fault is 0.1626, and the difference between the peak value of the fault and that of the noise is 0.118. Compared with the TFSR, the recognition degree of the fault characteristic frequency is higher, and the noise interference near the fault characteristic frequency is smaller. This fully proves that the UCPSR method offer better fault diagnosis effect than TFSR method.
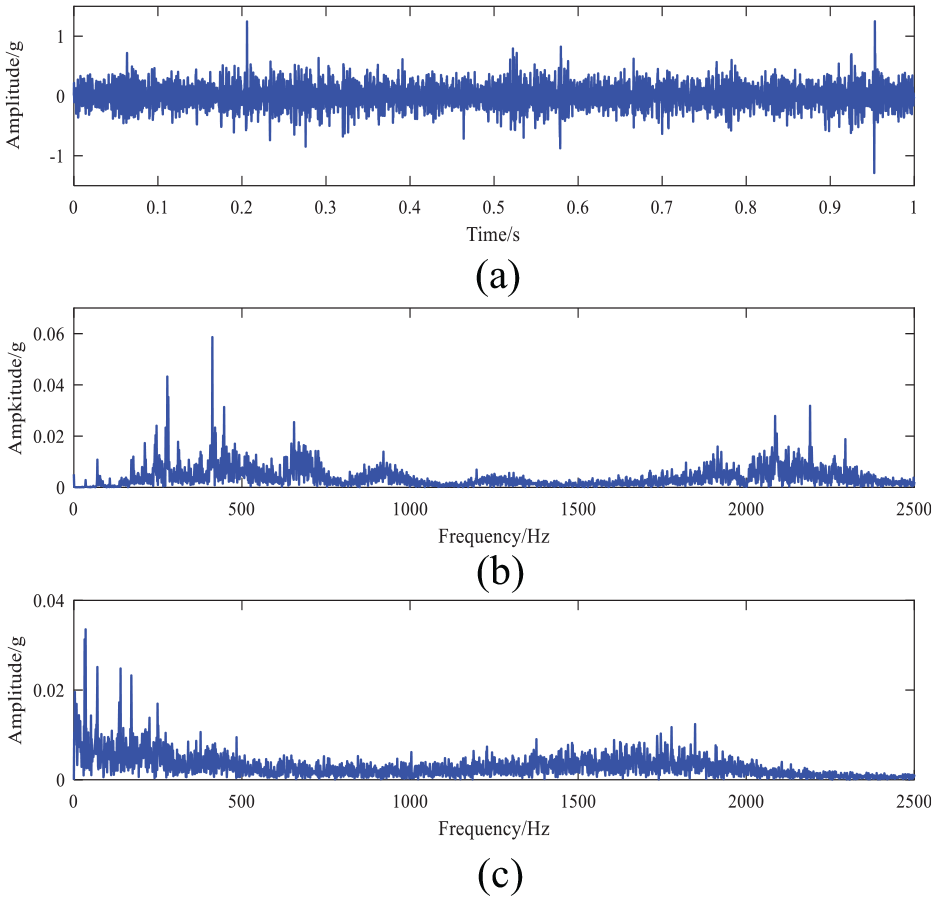
Vibration signal of bearing inner race: (a) time-domain diagram of the signal, (b) spectrogram, and (c) envelope spectrum.
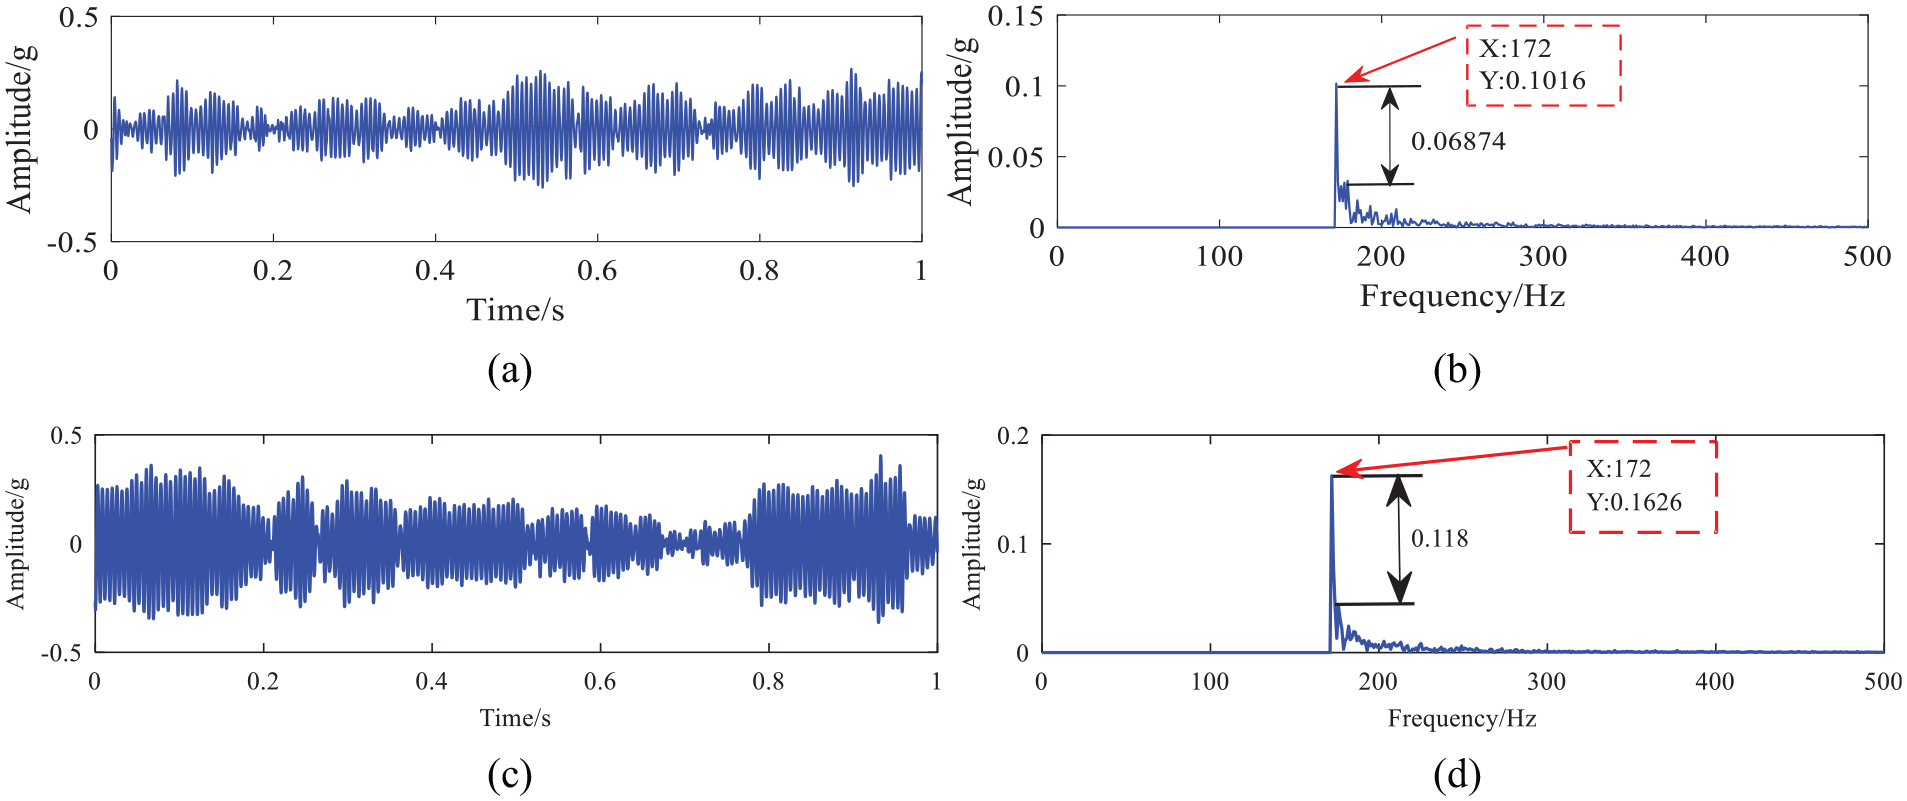
(a) Time-domain diagram processed by using TFSR method, (b) spectrum diagram processed by TFSR method, (c) time-domain diagram processed by using the UCPSR, and (d) spectrum diagram processed by using the UCPSR method.
Engineering verification
The new method has achieved good results in the bearing test verification and the following presents the engineering verification of the new proposed method. A tension roll reducer in a steel mill and the engineering equipment are shown in Figure 11. The bearing fault characteristic frequency is 38 Hz, and the sampling frequency is 2560 Hz. The results obtained by using the UCPSR are compared with those from TFSR method. Figure 12 shows the inner race of the factory fault bearing. Figure 13 shows the time-domain diagram, spectrum and envelope spectrum of the engineering signal. From the time domain and the spectrum, we cannot identify any useful information. Although the fault characteristic frequency can be found in the envelope spectrum, there are a lot of noise components around the fault characteristic frequency, so it is impossible to judge the fault. We use the TFSR method to process the fault data and optimize the parameters by using the ant colony algorithm to get the optimal output results as shown in Figure 14(a) and (b). From the spectrum in Figure 14(b), we can clearly identify the fault characteristic frequency. But the low-frequency part contains some noise components, which impact fault feature extraction. Therefore, the UCPSR method was used to process the signal, and the results are shown in Figure 14(c) and (d). In the time-domain of UCPSR Figure 14(c), it can be seen that the signal pulse profile is obviously enhanced. Comparing spectrum of Figure 14(d) and (b), we find that the noise component near the fault characteristic frequency is significantly reduced, and that the difference between the fault characteristic peak value and the noise peak value is 0.7645, which is larger than the difference between TFSR method fault peak value and its noise peak value of 0.12177, which has better fault recognition degree. This demonstrates that the new method is superior to TFSR methods and traditional signal analysis methods in engineering signal verification.
Tension roll reducer for a steel mill.
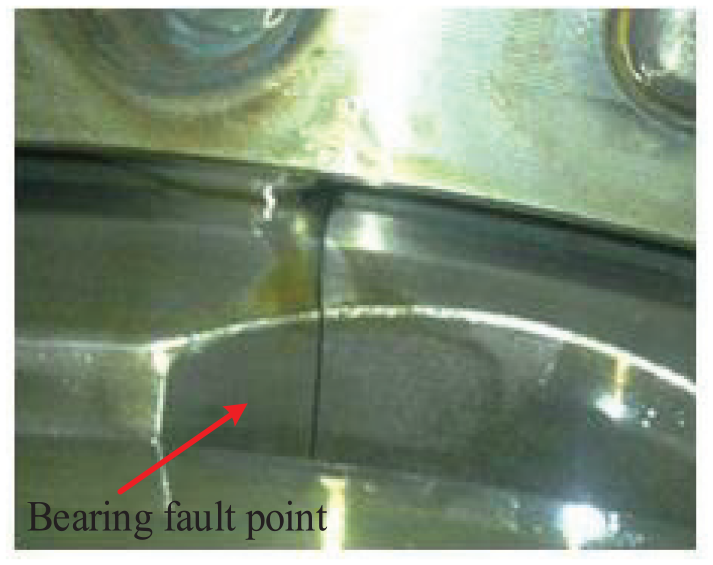
Engineering verification of faulty bearings.
Engineering data signal diagram: (a) time-domain signal, (b) spectrogram and (c) envelope spectrum.
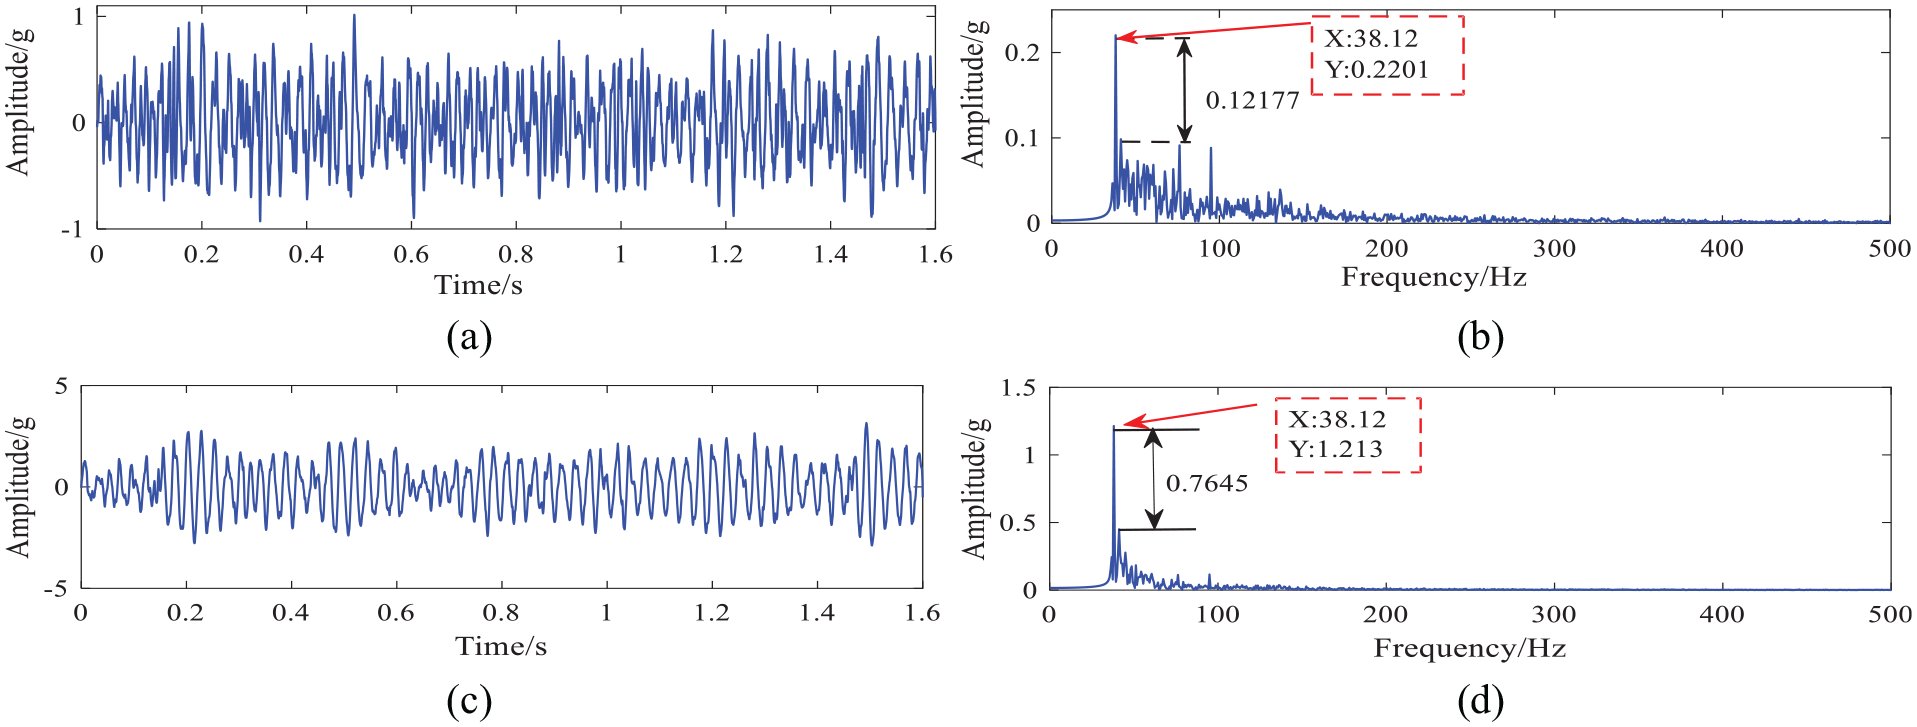
(a) Time-domain diagram of TFSR method, (b) spectrogram of TFSR method, (c) time-domain diagram of UCPSR method and (d) spectrogram of UCPSR method.
Conclusion
In this paper, a method of continuous potential second-order underdamped SR method is proposed and applied to early fault diagnosis of bearings. The new method can extract clear fault features from heavy background noise signals. Based on simulation and experimental verification, the following conclusions are as follows:
Because the traditional SR method is a first-order differential equation, the first-order model is equivalent to a filter link, whereas the proposed method is a second-order under-damped stochastic resonance method, and the second-order differential equation is equivalent to a second-order filter, so the second-order stochastic resonance model offers improved filtering effect.
The second-order SR is equivalent to secondary filtering, so the second-order underdamped continuous potential SR offers improved denoising compared to the traditional first-order SR. When the potential parameters are at a certain values, the system will reach its optimal output, and the parameters of the potential function can be optimized by the ant colony algorithm to obtain the maximum output SNR. The potential model is rich, and it can match with complex signals.
In this method, the ant colony algorithm is used to optimize the potential parameters, and the optimal parameters are obtained more quickly. Then the optimal output SNR is obtained for the SR system.
The effectiveness of the proposed method has achieved effective results in extracting weak fault signals of rolling bearings at an early stage. Given the method’s rapid fault identification and good accuracy, it is expected to be widely used in detecting weak periodic signals with heavy background noise, and it can be applied to early weak fault detection of rotating machinery such as planetary gearboxes at later stages.
Footnotes
Declaration of conflicting interests
The author(s) declared no potential conflicts of interest with respect to the research, authorship, and/or publication of this article.
Funding
The author(s) received no financial support for the research, authorship, and/or publication of this article.