Because fault characteristics are often difficult to extract from a strong noise background, it is essential for mechanical fault diagnosis to extract a weak characteristic signal with a very small signal-to-noise ratio from a noisy interference. Therefore, this paper proposes a new method for diagnosing weak faults in asymmetric potential stochastic resonance. Compared with the existing methods, the asymmetric potential stochastic resonance method not only has characteristics common to the symmetric potential stochastic resonance, but can also change the inclination of the barrier and slope of the wall to obtain a better model structure. The proposed method solves the local adjustment problem of the existing method from the perspective of potential structure and optimizes the asymmetric system shape to better target frequency detection during much interference from noise. After simulation, a bearing failure test, and rolling mill gearbox bearing failure experiments, we concluded that the asymmetric potential stochastic resonance detection technology can effectively identify faults. Compared with the symmetric potential stochastic resonance method, the proposed method has better recognition.
With the development of mechanical equipment, methods to detect faults have received much attention, and fault detection has become the key problem in improving product quality.1,2 Once a device fails to continue to work, it will often affect the normal operation of production, and serious failures may even lead to machine crashes.3,4
In a complicated industrial system where multiple devices are operating together, the weak fault signals of mechanical equipment will be submerged in a strong noise background and difficult to diagnose.5–7 Scholars have developed many detection methods and techniques for weak signal research. Some examples are wavelet analysis,8–10 singular value decomposition,11–13 ensemble empirical mode decomposition,14–16 and local mean decomposition.17–19 These methods can achieve the detection of weak signals, but there is also the problem of the noise signal itself being filtered out. In 1981, Benzi et al.20 first discovered and proposed the mechanism of stochastic resonance (SR) in the interpretation of the periodic recursion of the ice age. The phenomenon of SR shows that in a nonlinear system, noise and periodic signals are added at the same time, noise is enhanced within a certain range, and signal-to-noise ratio (SNR) is not reduced but will be enhanced. This has great significance for the detection of weak signals. Early studies were based on a common bistable SR. The classic SR requires very small parameters, and an actual fault causes a frequency greater than 1 Hz. Therefore, the early SR method is not suitable for fault diagnosis.21,22 To solve this technical disadvantage, Leng et al.23,24 studied a scale transformation SR, where the SR phenomenon can be achieved under large-parameter conditions. In the last few years, scholars have further studied SR for weak fault recognition. In terms of overdamped SR, Li and Shi25 studied the weak signal detection mechanism with confining potential to enable signal recognition in rotating machinery. Lu et al.26 studied an early detection method for SR based on the Woods–Saxon potential. Qiao et al.27 discussed the effect of multiplicative and additive noises on the potential asymmetry of overdamped SR and established a new segmented overdamped SR model, using the proposed method to diagnose planetary gearbox faults. In summary, most research has been based on the symmetric potential stochastic resonance (SPSR) model or other models such as the multi-steady state and the tristable state. However, there are few studies on the characteristics of asymmetric potential stochastic resonance (APSR). For this reason, we propose a weak fault detection mechanism based on APSR. Compared with existing methods, APSR not only has the property of SR with symmetrical potential but can also change the inclination of the barrier and the steepness of the wall to obtain a more abundant shape of the potential. Therefore, this detection technique avoids local adjustment of the potential of the existing method. The optimization of the potential structure is achieved to better detect the target frequency.
The rest of this paper is as follows: In section “APSR system model,” the characteristics are analyzed to explore the potential effects of various parameters on the asymmetric potential model. In section “Weak fault diagnosis strategy of the APSR method,” the weak fault diagnosis strategy of the APSR is described. Section “Simulation and experimental analysis” describes simulation bearing experiments and mill gearbox experiments used to verify the APSR detection technology. Finally, conclusion is provided in section “Conclusion”.
APSR system model
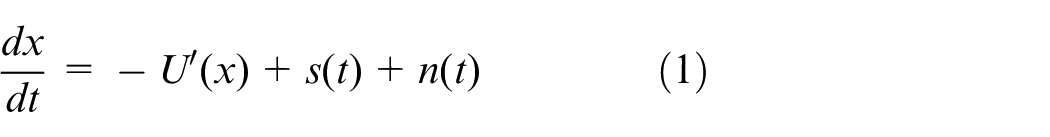
The basic principle of SR is the collective effect of input signals and noise signals in nonlinear systems. The formula is
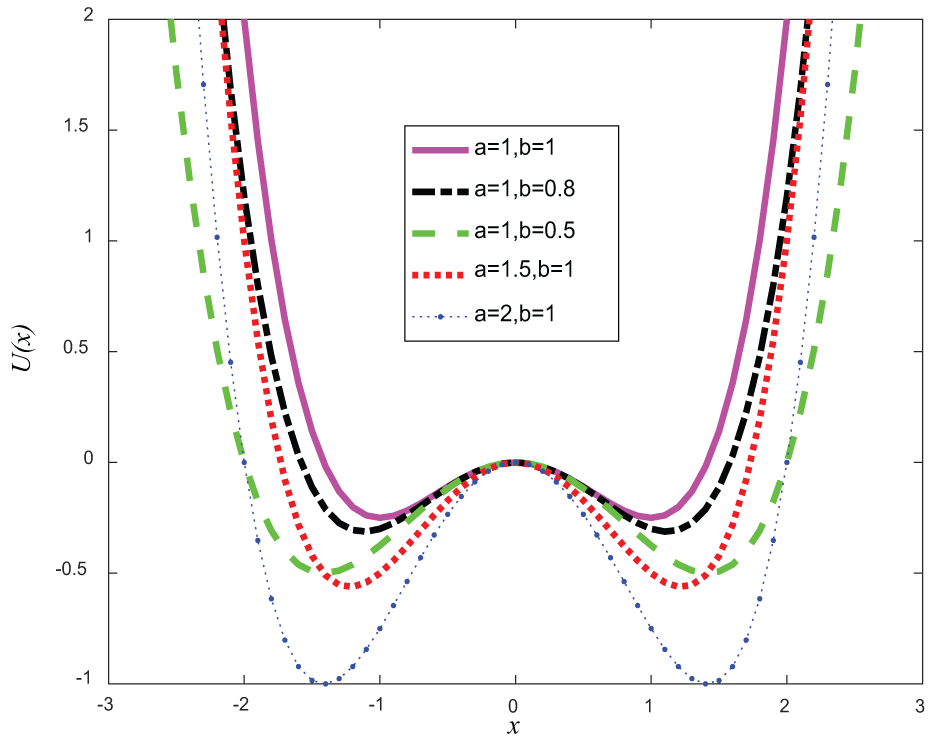
For SPSR systems, where , is the periodic signal, and is the added noise. As mentioned earlier, the process of detecting the weak signal by SR and it can be explained by the movement of particles in the potential well. The main factor that hinders the particle’s transition is the shape of the potential. Adjusting parameters and of the SPSR system that can achieve the purpose of changing the potential shape, the symmetrical potential function with different parameters as shown in Figure 1. When is fixed, the size of is adjusted, the bigger the , the smaller the barrier, and the smaller the width of the wall. When is fixed, the size of is adjusted, the larger the , the larger the barrier, and the width of the wall is correspondingly increased. That is, adjusting the size of and , the barrier height changes, and the corresponding potential wall also changes.
Symmetrical nonlinear potential model.
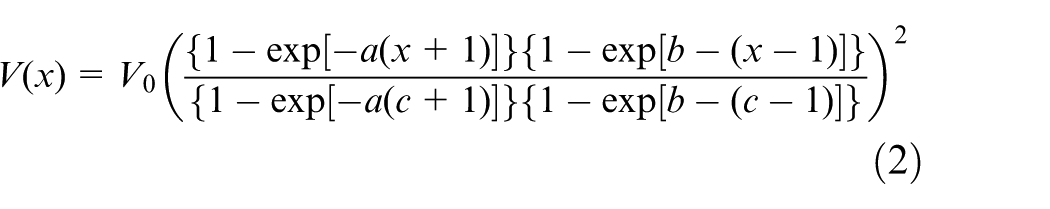
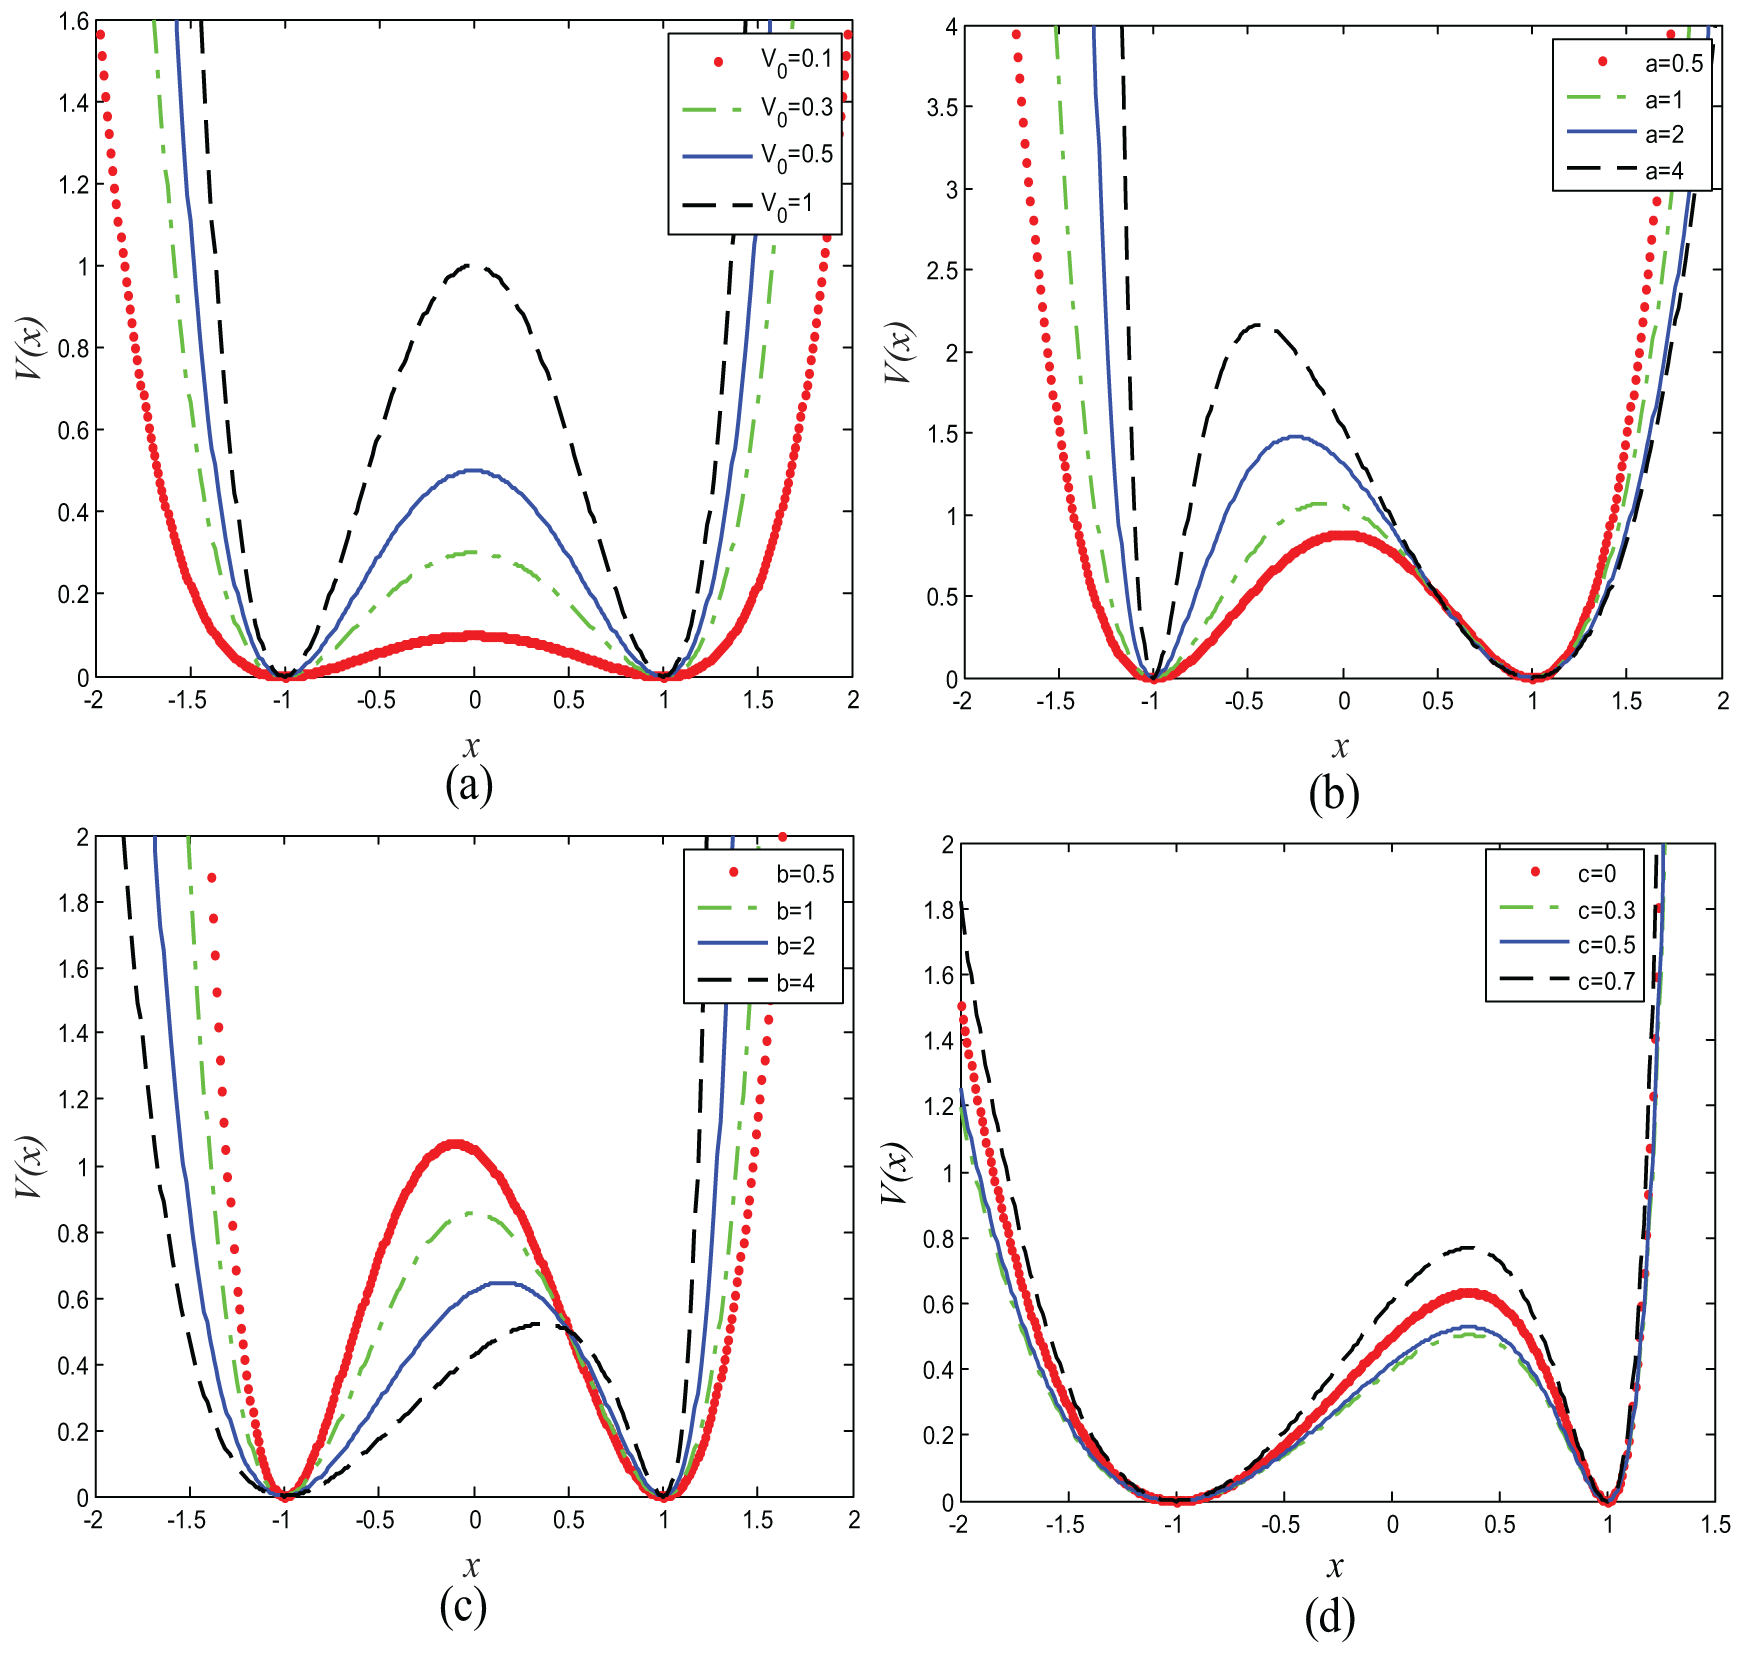
Similarly, the potential function expression for APSR is as follows28
The smallest position of potential is at . For the sake of convenience, parameters , , , and have been introduced to illustrate the position and height. For the SPSR model, the tunable parameters and control the slope of the bottom of the well. To compare the similarities and differences between the SPSR system and the APSR system, the curve of the adjustment function of the different parameters is shown in Figure 2.
Curves of different parameters to adjust the potential function: (a) when , , the potential model for changes; (b) when , ,, the potential model for changes; (c) when , , the potential model for changes; and (d) when , , the potential model for changes.
As mentioned above, the APSR system also has two wells and a barrier. In Figure 2(a), , , and are fixed, adjusting the size of the parameter , which can also achieve the adjustment of the barrier height, with the characteristics of SPSR. The difference is that the adjustment parameters can also realize the asymmetry of the potential shape. In Figure 2(b), when the parameter rises, not only the barrier but also the slope of the barrier gradually increases. Whereas Figure 2(c) is exactly the opposite of Figure 2(b), with the increase in parameter , the height of the barrier gradually decreases, but the slope of the barrier is similar to Figure 2(b) and it gradually increases. Therefore, adjusting the parameters and not only can realize the forward and reverse adjustment of the barrier height but also can be realized adjustment of barrier slope. In Figure 2(d), when , , and are fixed, and the size of is adjusted individually, the characteristics of the potential model are basically the same as the adjustment parameters . As the parameter increases, the barrier height increases. From the above analysis, it can be seen that the APSR can only change the barrier and the wall. APSR not only has the characteristics of SPSR but also can achieve independent adjustment of barrier height and inclination with more potential model shapes.
Weak fault diagnosis strategy of the APSR method
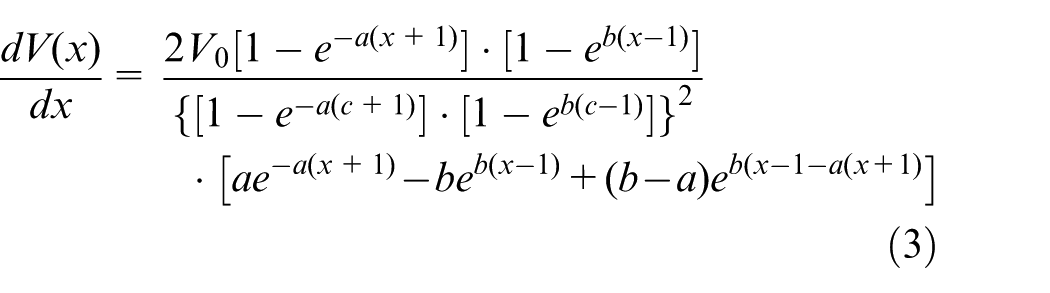
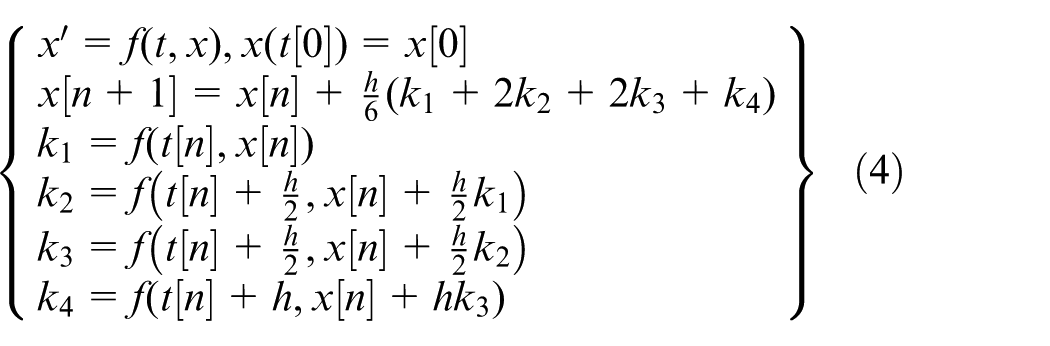
The essence of SR is that the particle cyclic motion between wells with the influence of noise, periodic signal, and potential model. In the actual project, the periodic signal and noise are fixed, and only the shape of the adjustment potential can make the optimal SR effect. Generally, when the barrier height is too high and the distance between the two sides of the wall is too far, the particles consume too much energy and cannot return to their original position from one potential well and can only oscillate in a potential well to form “underresonance.” When the inclinations of the two sides of the potential wall are too large and the peak of barrier is too small, the particles get too much energy to cause excessive acceleration, which causes the particles to jump back and forth between wells to form an “overresonance.” Therefore, only the optimal potential shape can enable the particles to periodically movement with the help of weak signal and noise, thus forming the best SR effect. As we all know, the SPSR achieves the optimal SR effect by adjusting system parameters and . When the barrier changes, the width of the potential wall also changes. Assuming that the width of the potential wall has reached its optimal state, the height of the barrier may not be the best. Therefore, the final state may not be the optimal potential shape. However, APSR system can not only change the height of barrier, guarantee the same characteristics as the SPSR system, but also can adjust the slope and the inclination of the barrier, steepness of the wall. For example, when the noise is too small, to achieve a smooth transition of particles, APSR system can reduce the height of the barrier and change the slope of the barrier and the wall, so the APSR system has a better effect. Therefore, to get the target signal frequency in strong noise background, the APSR optimizes the system parameters , , , and using the ant colony algorithm to get the optimal nonlinear potential structure. The optimal parameter combination is input to the first derivative of the APSR system and the expression is shown in equation (3). The Runge–Kutta equation is used to obtain the signal output, the Runge–Kutta as in equation (4) and using the SNR as the evaluation function
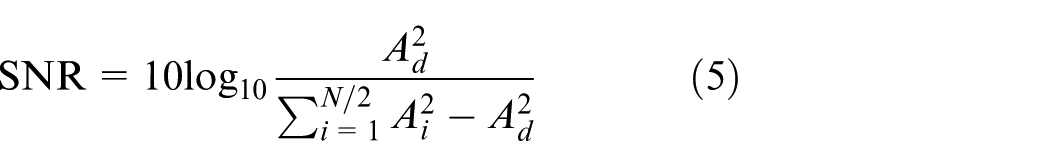
The is the potential model and is the calculated step, where , is sampling frequency. The output SNR is used as the evaluation index to evaluate the performance of the proposed method for extracting weak fault signals. The expression is as follows
where is the signal length. and are the amplitudes corresponding to the drive frequency and the strongest interference frequency , respectively.
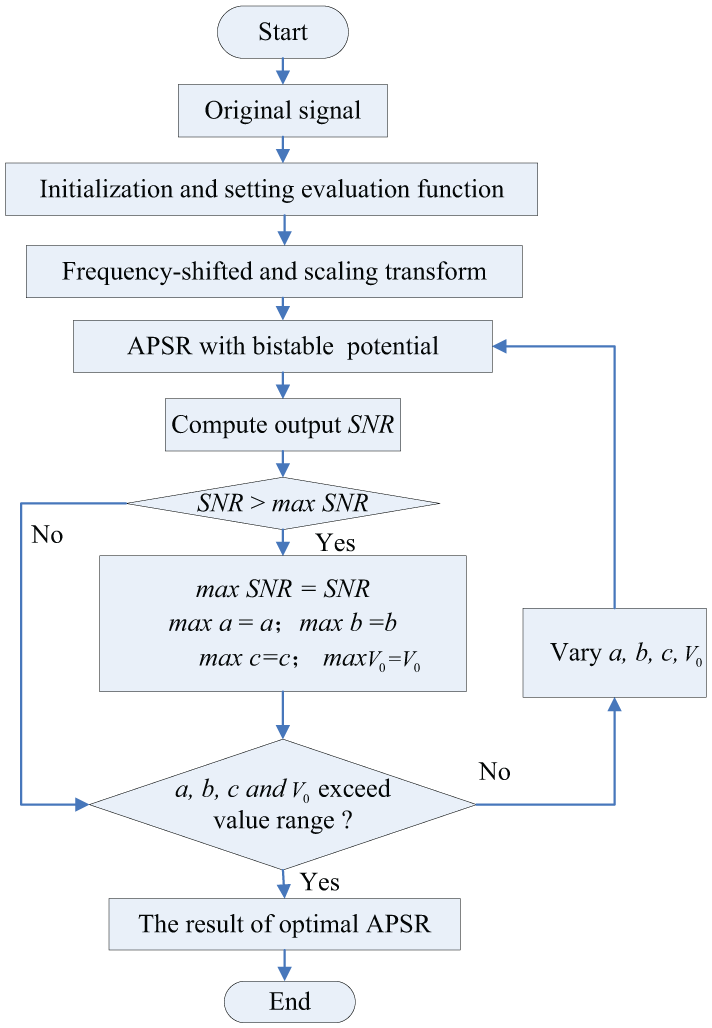
According to the above analysis, the flowchart and specific steps are as follows (Figure 3):
Signal preprocessing. The original signal is processed by Hilbert transform to obtain the envelope signal, and then the envelope signal is processed by frequency shift scaling to meet the small parameter requirement, and the compression ratio is set to 200.
Parameter optimization. The ant colony algorithm is used to match the parameters of the nonlinear system , , , and . The parameter optimization range is set to [0, 10].
Calculate the SNR. All the optimization parameter combination sequences are input to an APSR system and the output SNR is calculated.
The parameters are determined. Finding the maximum output SNR results in the best combination of the parameters , , , and .
Signal processing. The optimal combination parameters are input to the APSR system, and finally the fault diagnosis result is obtained.
Weak fault diagnosis method of the APSR method.
Simulation and experimental analysis
Simulation analysis
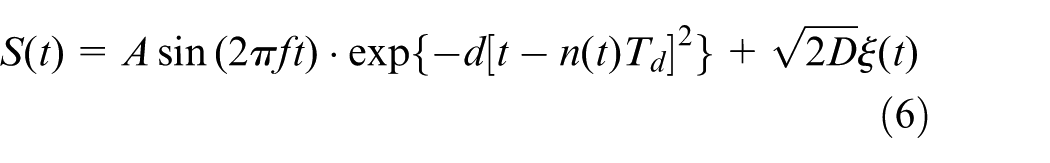
To illustrate the effectiveness of the APSR method, simulating a periodic signal with the following expression
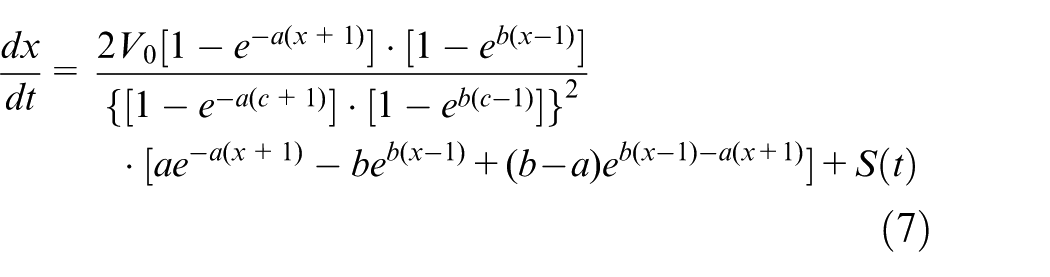
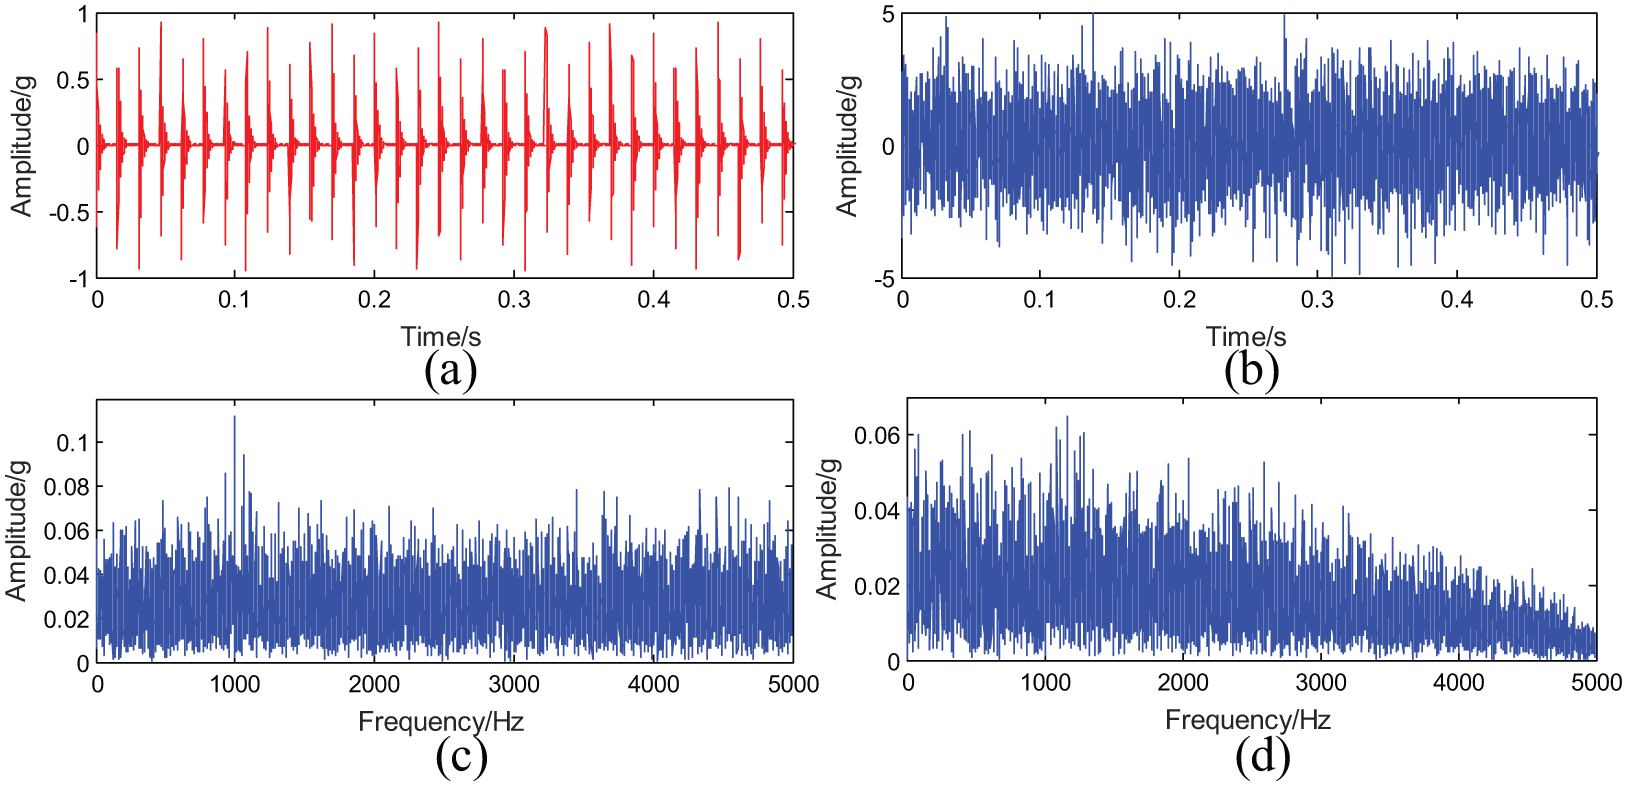
where is the periodic signal intensity, is the frequency, ( kHz is the sampling frequency), dominates the pulses appear cyclical, is the Gaussian white noise, is the external noise intensity, and is the pulse interval ( is the simulated bearing signal frequency). The periodic signal and interfered signal are shown in Figure 4(a) and (b). The frequency spectrum obtained by Fourier transform is shown in Figure 4(c). Due to strong noise interference, it is difficult to obtain target fault signal through spectrum analysis0. Then, the envelope spectrum is obtained as displayed in Figure 4(d), but the target signal is still not available in the graph. To further extract weak fault characteristics, according to frequency-shifted scaling transform method, the pass frequency and cutoff frequency of the high pass filter are 62 and 50 Hz, respectively. The modulation frequency is 50 Hz and the variable scale compression rate is 200. After pretreatment, the target frequency is compressed to (65–50)/200 = 0.075 Hz, the compressed frequency meets the requirement of small parameters. Then an APSR model is established. The APSR system for processing the failure signal is as follows
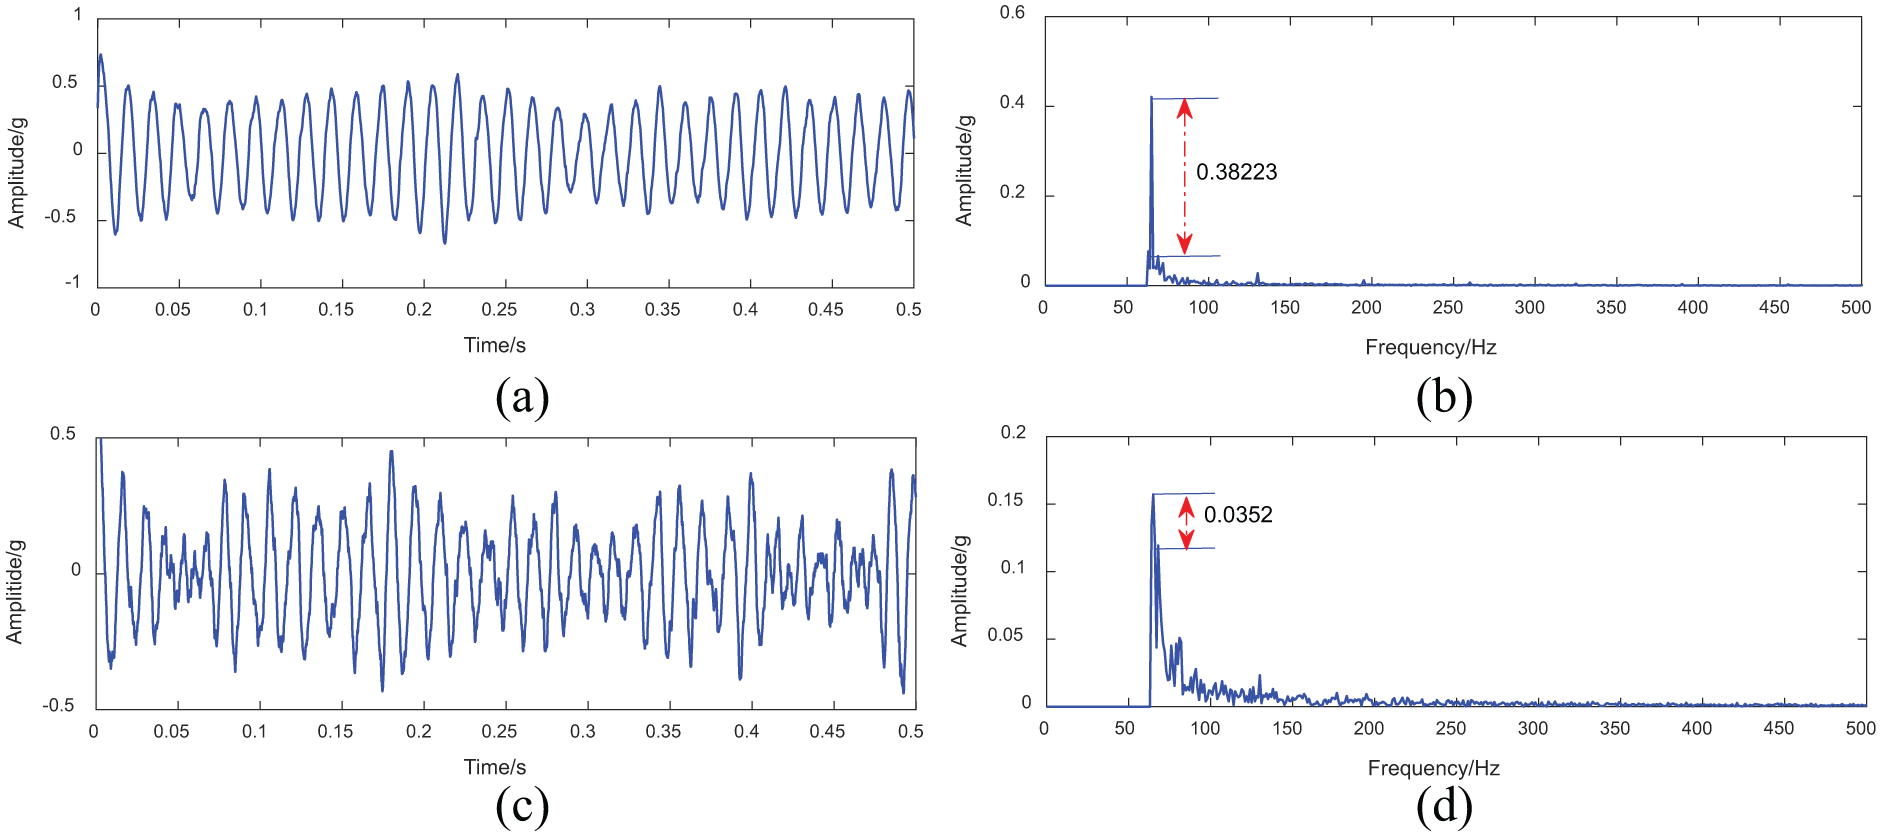
Using ant colony algorithm to optimize the parameters , , , and , the simulated bearing signal input to the SR system is processed. Figure 5(a) displays the output after being processed by APSR method. The final Fourier transform is displayed in Figure 5(b). The target frequency is clearly displayed, and amplitude is 0.38223 higher than the surrounding noise. Therefore, the proposed APSR method is effective and feasible. The exact same simulation data are processed by the SPSR. The ant colony algorithm optimizes the SPSR model parameters a and b, and the optimization results are , . SPSR method for processing the data is displayed in Figure 5(c) and (d). As shown in Figure 5(d), the characteristic frequency is also higher than the ambient noise, but the amplitude of the characteristic frequency is only 0.0352 higher than the ambient noise. Therefore, it can be determined that the SPSR method restricts the change of the potential shape due to the symmetry of the nonlinear system and forms the local optimum of the nonlinear system shape. In contrast, in Figure 5(b) and (d), it is found that the peak value of the characteristic frequency by the proposed method is significantly enhanced, indicating that the SR phenomenon of the APSR method is more obvious. Therefore, the proposed APSR method is better than the SPSR method for detecting weak characteristics.
Simulation signal: (a) periodic signal without noise, (b) periodic signal with noise, (c) spectrum, and (d) envelope spectrum.
APSR method for simulated signals: (a) time signal and (b) spectrum. SPSR method for simulated signal: (c) time signal and (d) spectrum.
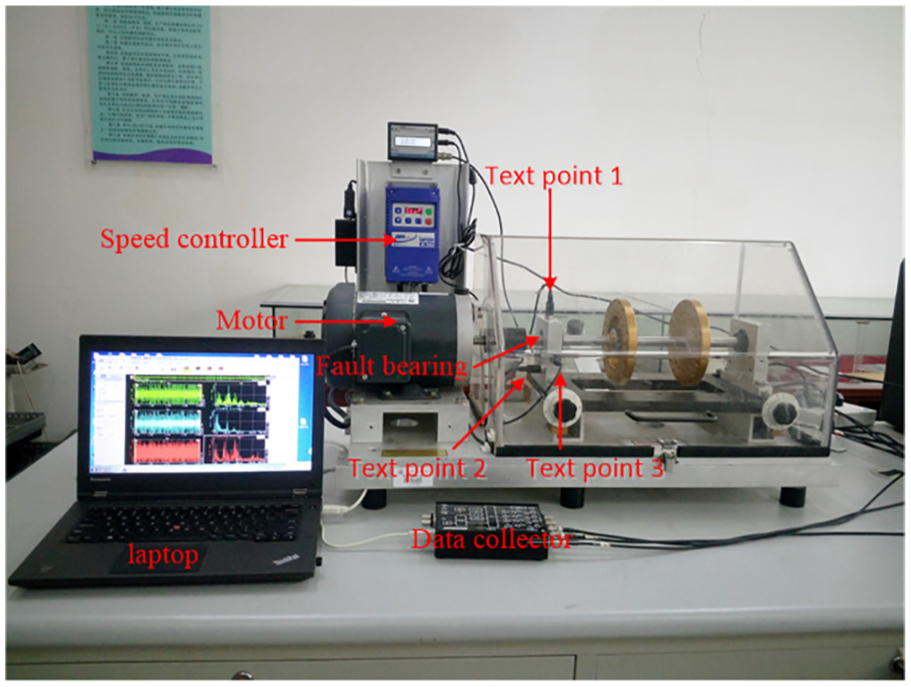
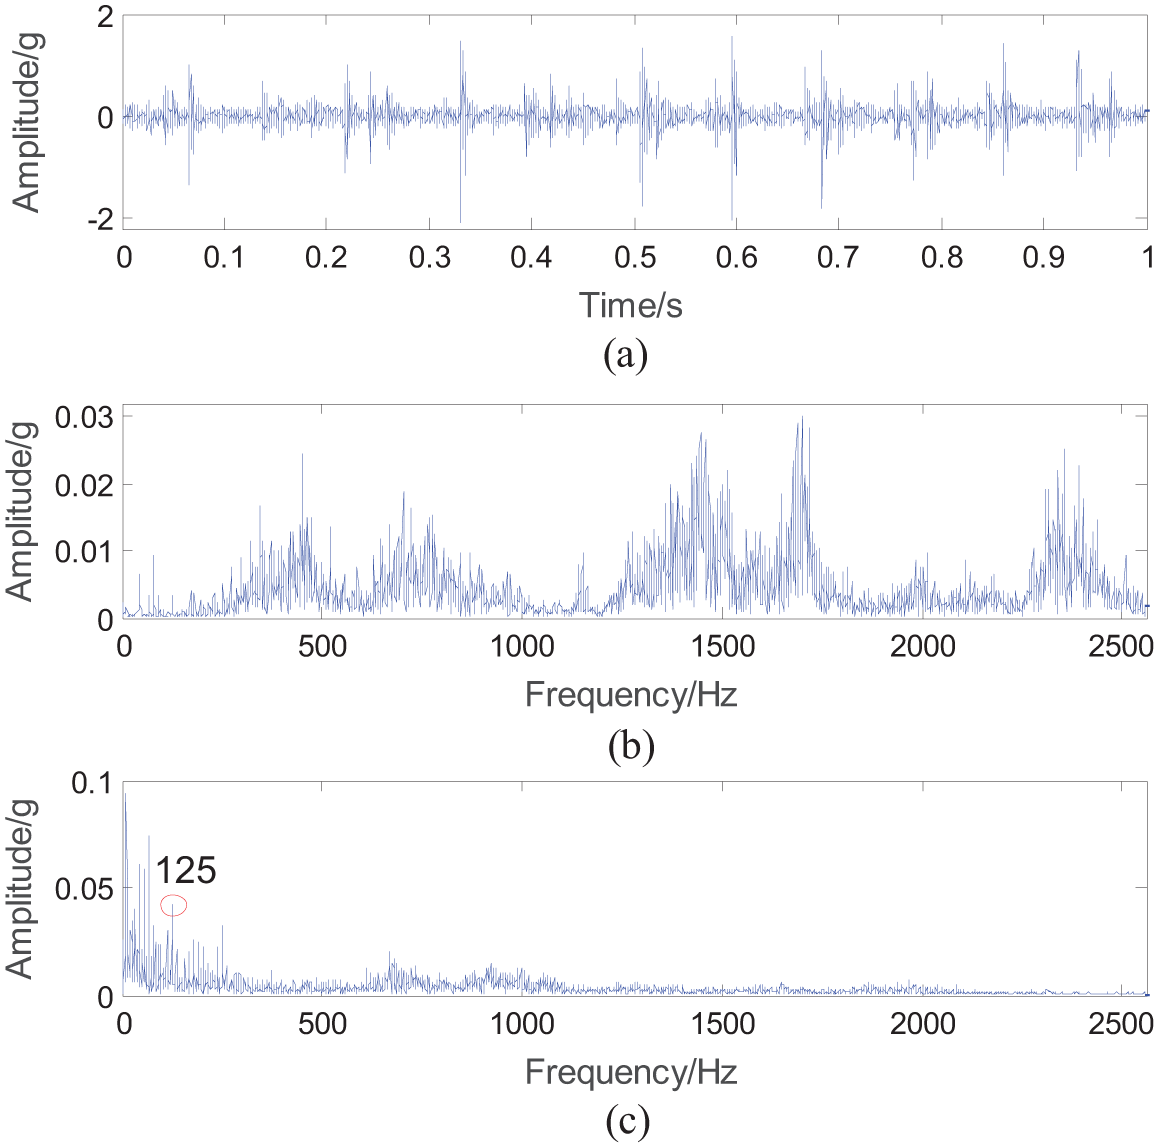
Bearing test verification
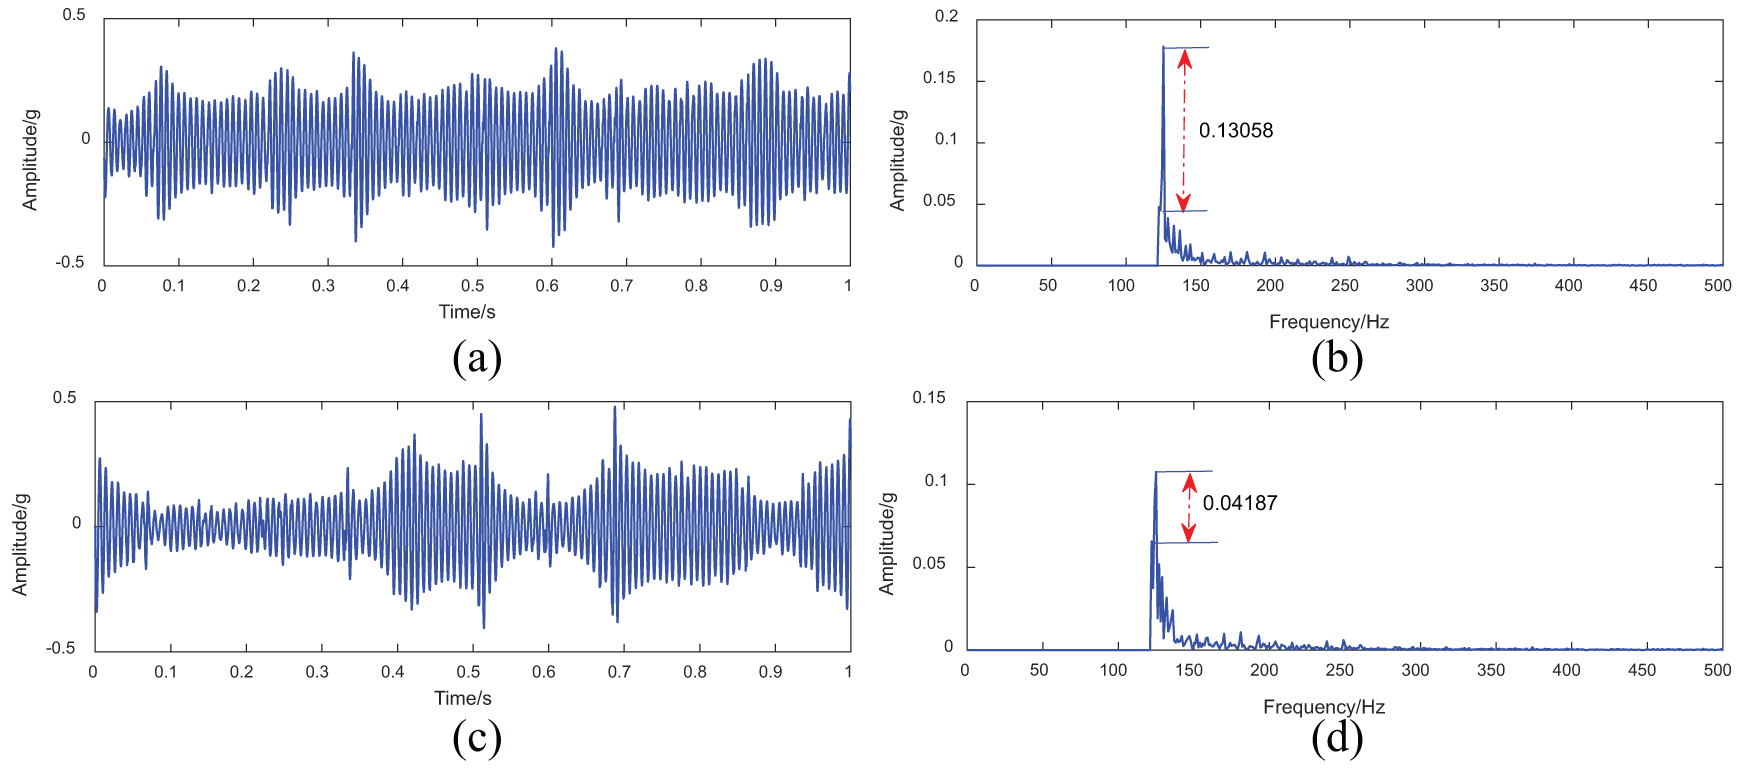
To further verify the novel method, the fault experiment platform is used to detect the bearing fault, as shown in Figure 6. ER-16k is used as a failed bearing for inspection and inner ring has wear, and its size ,,, , , . According to the principle of vibration, the bearing inner race characteristic frequency is 124.729 Hz. First, the time-domain waveform, power spectrum, and envelope spectrum of the original signal are calculated as displayed in Figure 7. In Figure 7(b), due to noise interference, the fault characteristic frequency is completely covered and cannot be extracted. In Figure 7(c), we can see the fault characteristic frequency 125 Hz, but there are multiple peak interferences around the target frequency, and the target signal cannot be accurately identified. The APSR detection technology is used to target frequency detection. The envelope signal is input to the APSR system. The parameters of the APSR system obtained by using the ant colony algorithm are , , , and . The time-domain waveforms and spectrum are shown in Figure 8(a) and (b). In Figure 8(b), it can see that that the target frequency is clearly demonstrated, and the target frequency amplitude is higher than the surrounding noise 0.13058. Therefore, it can be concluded that the APSR detection technology can be used as a weak signal detection for bearings and can achieve remarkable results. The same original signal is detected by the SPSR. The ant colony algorithm optimizes the parameters to get , and brings it into the SPSR system to obtain the time-domain waveform and spectrum, as displayed in Figure 8. In Figure 8(d), the highest point of the target peak value is only 0.04187 higher than the surrounding noise. Compared with the SPSR method, the APSR detection technology has better local filtering effect and better weak signal enhancement ability.
Bearing inspection platform.
Bearing signals: (a) original waveform, (b) spectrum, (c) envelope spectrum.
APSR method for bearing signals: (a) time signal and (b) spectrum. SPSR method for bearing signals: (c) time signal and (d) spectrum.
Bearing failure verification of rolling mill gearbox
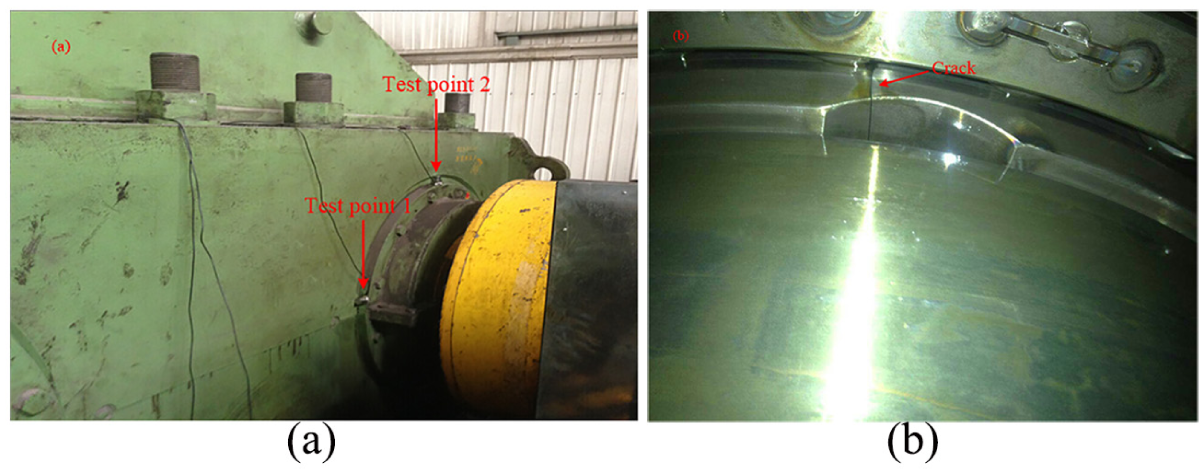
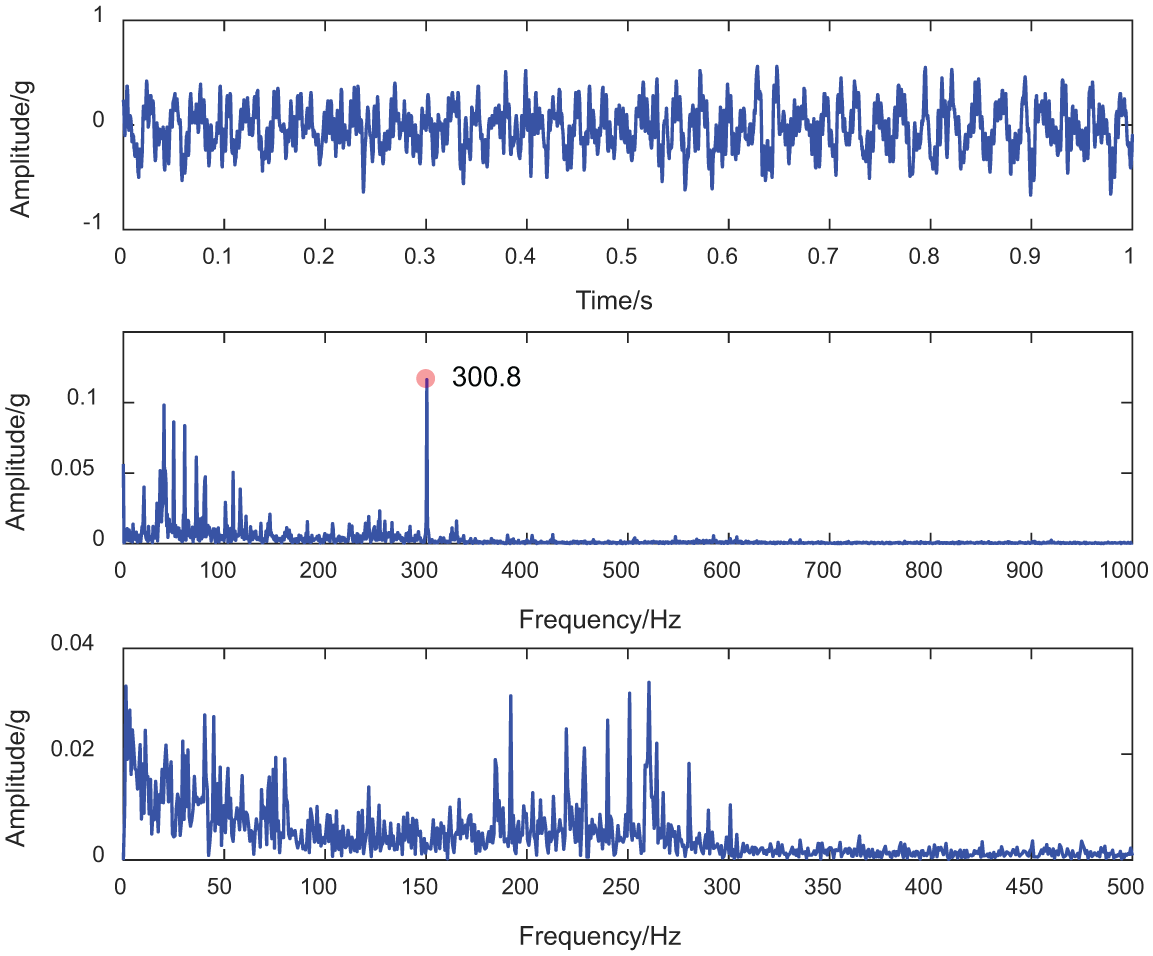
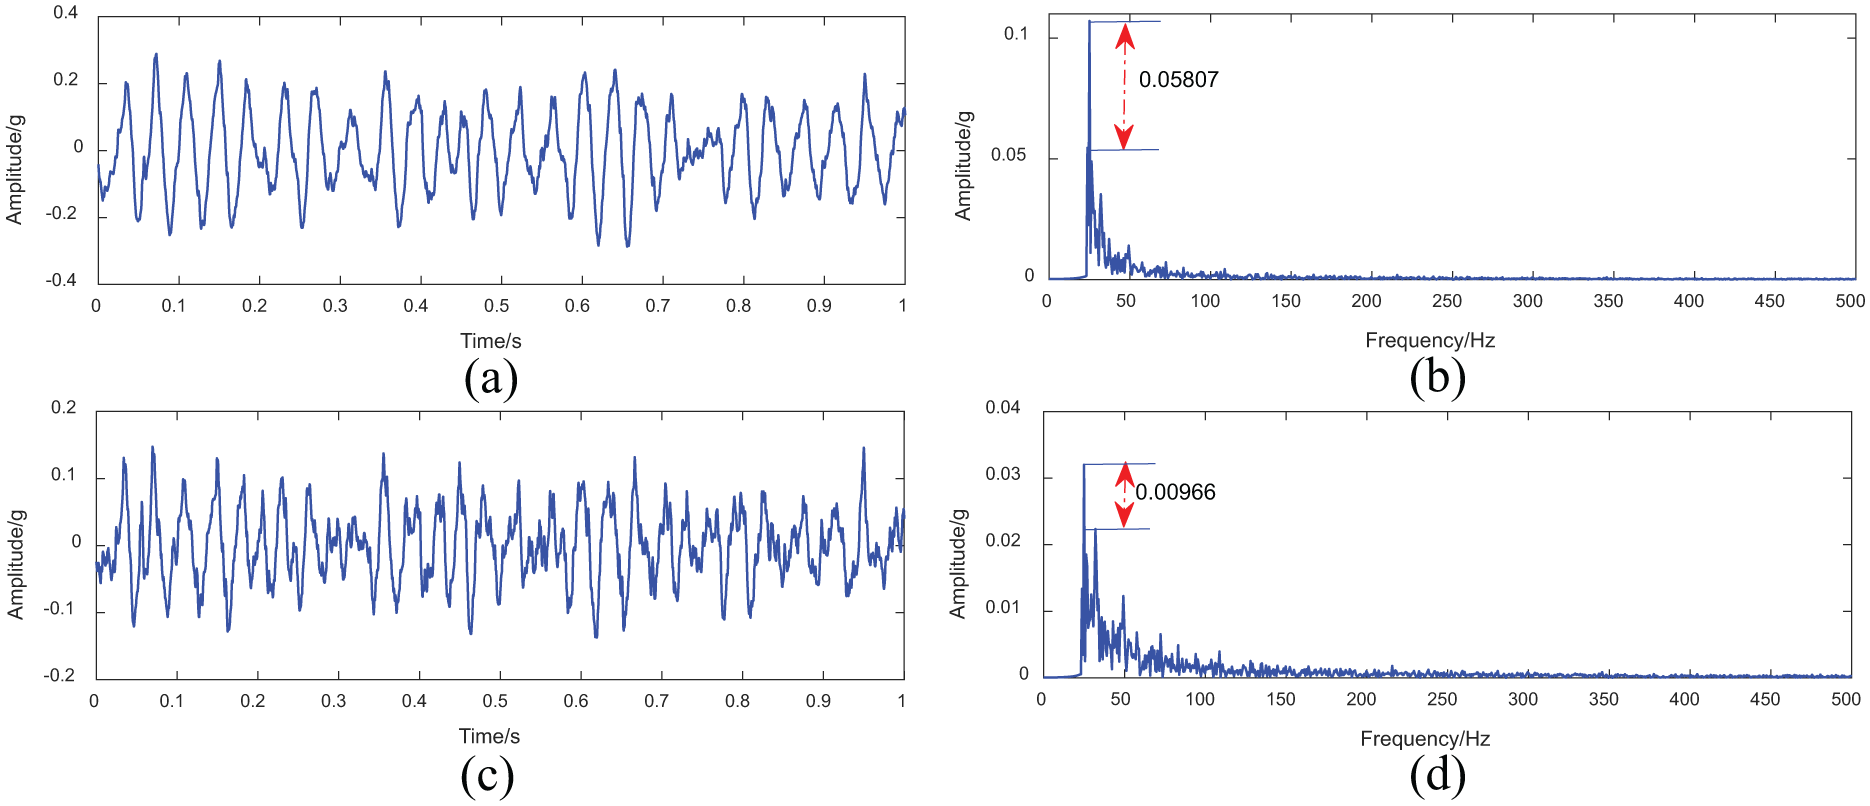
In this section, the used signals are collected in the rolling mill gearbox. Because the gearbox often has slight vibration during operation, to judge whether there is any fault, the gearbox inspection is done. The inspection site is shown in Figure 9(a). The sampling frequency is 2560 Hz, and the sampling point is 5, 000. The results of the collected vibration data are shown in Figure 10. In Figure 10(b), we can see that there is a larger impact frequency is 300.8 Hz. The impact frequency has nothing to do with the characteristic frequency of the gearbox, so it can be judged to be noise interference. In Figure 10(c), due to multiple peak components, we are also unable to determine whether the gearbox has failed. To further judge whether there is a fault, the ant colony algorithm optimizes the APSR system, and the parameters obtained by the two methods can be seen separately. The APSR system is optimized, and the obtained parameters are , , , . The SPSR system is optimized, and the obtained parameters are , . In Figure 11, the frequency of the processed signal is obviously displayed by the APSR method, and the SPSR method also extracts the same fault characteristic frequency of 24.22 Hz. It is very close to the fault characteristic of the bearing and it can be preliminarily judged that the bearing has failed. Looking the inside of the gearbox through the endoscope, it was found that the bearing has cracked, as shown in Figure 9(b). Therefore, it can be judged that both methods can identify the fault. Comparing the APSR and SPSR methods, the SPSR method extracts the fault characteristic frequency, but the target frequency is much less than the APSR method. In Figure 11, the target frequency amplitude obtained is 0.05807 higher than the surrounding noise by the APSR method and the SPSR method is 0.00966. Therefore, it can be concluded that the APSR method can not only effectively extract weak faults in simulation and bearing experiments but also has better weak signal enhancement effects for complex signals with strong noise interference in engineering. According to the above analysis, because the APSR system potential model has richer adjustment characteristics, a better potential structure can be obtained to match the vibration signal, so a better SR effect can be obtained.
(a) Rolling mill gearbox inspection point and (b) failed bearing.
Rolling mill gearbox signals: (a) original waveform, (b) spectrum, and (c) envelope spectrum.
APSR method for rolling mill gearbox signals: (a) time signal and (b) spectrum. SPSR method for bearing signals: (c) time signal and (d) spectrum.
Conclusion
Aiming at the symmetry of the classical SR potential shape, this manuscript presents a novel APSR method for the weak fault detection and applied to weak feature signal extraction in strong noise background, and following conclusions are drawn:
The shape of the nonlinear system plays an important role in the SR. The multiparameter optimization of APSR method can make the shape of the SR diversify. Not only can the potential barrier height and potential width be adjusted individually, but also the inclination of the barrier, steepness of the wall that can be independently adjusted. Therefore, the best potential shape can be obtained.
Using simulation, bearing experiments, and engineering verification, it can be judged that APSR method can not only extract fault characteristics effectively but also obtain larger amplitude and better fault characteristic recognition than SPSR method, indicating better weak signal enhancement ability.
For complex signals in engineering, the APSR method can effectively extract fault characteristics, indicating that the APSR method has better interference noise filtering ability and has better engineering practical significance.
Footnotes
Declaration of conflicting interests
The author(s) declared no potential conflicts of interest with respect to the research, authorship, and/or publication of this article.
Funding
This research was supported by the National Science Foundation of China—research on key techniques for early fault diagnosis of planetary gearbox with confining potential stochastic resonance (51805275).
ORCID iD
Zhixing Li
References
1.
HongJLuY.Improved Hilbertâ Huang transform based weak signal detection methodology and its application on incipient fault diagnosis and ECG signal analysis. Signal Process2014; 98: 74–78.
2.
ZakrajsekJHandschuhRDeckerH.Application of fault detection techniques to spiral bevel gear fatigue data. Adv Mater Process Technol Mech Fail Prev1994; 14: 93–104.
3.
WangYXuGLiangLet al. Detection of weak transient signals based on wavelet packet transform and manifold learning for rolling element bearing fault diagnosis. Mech Syst Signal Pr2015; 54–55: 259–276.
4.
LinJChenQ.Fault diagnosis of rolling bearings based on multifractal detrended fluctuation analysis and Mahalanobis distance criterion. Mech Syst Signal Pr2013; 38(2): 515–533.
5.
FuQJingBHePJet al. Fault feature selection and diagnosis of rolling bearings based on EEMD and optimized Elman_AdaBoost algorithm. Sensors2017; 18(12): 5024–5034.
6.
LuCWangZQinWet al. Fault diagnosis of rotary machinery components using a stacked denoising autoencoder-based health state identification. Signal Process2017; 130(C): 377–388.
7.
YangBLiuRChenX.Fault diagnosis for a wind turbine generator bearing via sparse representation and shift-invariant K-SVD. IEEE T Ind Inform2017; 13(3): 1321–1331.
8.
HemmatiFOrfaliWGadalaRollerM.Bearing acoustic signature extraction by wavelet packet transform, applications in fault detection and size estimation. Appl Acoust2016; 104: 101–118.
9.
WangJHeQ.Wavelet packet envelope manifold for fault diagnosis of rolling element bearings. IEEE T Instrum Meas2016; 65(11): 2566838.
10.
KompellaKRaoMRaoR.Bearing fault detection in a 3 phase induction motor using stator current frequency spectral subtraction with various wavelet decomposition techniques. Ain Shams Eng J2017; 9: 2427–2439.
11.
LiZShiB.Extracting weak fault characteristics with adaptive singular value decomposition and stochastic resonance. Trans Chin Soc Agric Eng2017; 33(11): 60–67.
12.
LuQWangTLiZet al. Detection method of series arcing fault based on wavelet transform and singular value decomposition. Trans China Electrotech Soc2017; 32(17): 208–217.
13.
GolafshanRSanliturkKY.SVD and Hankel matrix based de-noising approach for ball bearing fault detection and its assessment using artificial faults. Mech Syst Signal Pr2016; 70–71: 36–50.
14.
ChengJYuDTangJet al. Application of SVM and SVD technique based on EMD to the fault diagnosis of the rotating machinery. Shock Vib2009; 16(1): 89–98.
XiangJZhongY.A new fault detection strategy using the enhancement ensemble empirical mode decomposition. J Phys Conf Ser2017; 842(1): 012002.
17.
ZhangCLiZHuCet al. An optimized ensemble local mean decomposition method for fault detection of mechanical components. Meas Sci Technol2017; 28(3): 035102.
18.
WuZYangSZhangJ.Bearing fault feature extraction method based on LMD adaptive multiscale morphology and energy operator demodulating. J Vib Shock2016; 35: 7–13.
19.
ChengGLiHHuXet al. Fault diagnosis of gearbox based on local mean decomposition and discrete hidden Markov models. Proc IMechE, Part C: J Mechanical Engineering Science2016; 231(14): 2706–2717.
20.
BenziRSuteraAVulpianiA.The mechanism of stochastic resonance. J Phys A1981; 14: L453–L457.
21.
HeQWangJLiuYet al. Bearing defect diagnosis by stochastic resonance with parameter tuning. In: Prognostics and system health management conference, Shenzhen, China, 24–25 May 2011, pp. 1–5. New York: IEEE.
22.
HaoJTaihangDJiangCet al. Application of parameter-tuning stochastic resonance for detecting weak signal with ultrahigh frequency. J Comput Appl2016; 36: 2374–2380.
23.
FanSWangTLengYet al. Detection of Weak periodic impact signals based on scale transformation stochastic resonance. China Mech Eng2006; 17(4): 387–390.
24.
LengYWangTLiXet al. Scale transformation stochastic resonance for the monitoring and diagnosis of electromotor faults. Proc CSEE2003; 23: 111–115.
25.
LiZShiB.Fault diagnosis of rotating machinery based on stochastic resonance with a bistable confining potential. Shock Vib2018; 2018: 8452509.
26.
LuSHeQKongF.Stochastic resonance with Woods-Saxon potential for rolling element bearing fault diagnosis. Mech Syst Signal Pr2014; 45(2): 488–503.
27.
QiaoZLeiYLinJet al. Stochastic resonance subject to multiplicative and additive noise: the influence of potential asymmetries. Phys Rev E2016; 94: 052214.
28.
BorromeoMMarchesoniF.Double stochastic resonance over an asymmetric barrier. Phys Rev E2010; 81(1): 012102.