
Abstract
Tungsten inert gas welding is one of the established joining processes for stainless steel. But hitherto very little has been reported on induced residual stresses in circular thin pipe joints during tungsten inert gas welding of SS 304. This paper reports the effect of welding parameters such as welding speed, welding current and shielding gas flow rate of tungsten inert gas welding on micro-hardness, width of the heat-affected zone, residual stresses and microstructural properties of SS 304 thin pipe joints. The results indicate that the welding current and the welding speed have a significant effect on micro-hardness of weld bead and width of the heat-affected zone. Further changes in the microstructure of the joints were studied in terms of dendrite formation. It has been observed that there is proportional increase in depth/width of the heat-affected zone with the heat input during the joining process, resulting in a decrease of micro-hardness. The results are also supported by radiographic analysis and X-ray diffraction data to understand the nature of residual stresses which was observed as compressive at the weld bead and tensile along the axis of thin welded pipe joints. Finally, the process capability analysis based on Cp and Cpk values of ≥1 suggests that the process can be gainfully used for mass production.
Introduction
Industrial pipes are very important for fluid transportation in the chemical, petrochemical, nuclear and petroleum industries. Most defects can be detected by non-destructive techniques. The elimination of defects in welds contributes significantly to assure good performance. Although some kinds of failure do not depend on preexisting defects, the vectors associated with the failure are generally difficult to be detected and it is not always possible to eliminate them, such as residual stresses. Among the more important types of failure, which frequently occur in industrial pipes, are fatigue and stress corrosion cracking (SCC). The main factors associated with fatigue damage in welded structures, industrial equipment and pipelines are residual stress, stress concentration and the mechanical properties of the material, which are commonly dependent on the microstructures. To ensure sound welded joints, welding parameters must be chosen in a way to avoid surface defects. The most common failures occurring in industrial pipes are due to stress concentration. This type of failure usually occurs when the surface hardness goes above 250 HV in SS 304. 1 In other words, these failures are associated with the increased hardness, change in the microstructure and higher residual stresses. The study of mechanical and microstructural properties in tungsten inert gas (TIG) welded SS 304 reports that the weld joints prepared with the low heat input are having more tensile strength and the grain coursing in the heat-affected zone (HAZ) occurs with high welding heat input. 2 Mechanical properties of HAZ of the welded joints have been explored by some researchers. 3 The increase in the arc energy from 0.4 to 0.8 kJ/mm caused the decrease in the hardness value and increase in the width of the HAZ. Input parameters such as the welding current, welding voltage and the arc travel speed have significant effect on micro-hardness and tensile strength in TIG welding. 4 It has been observed that the micro-hardness in weldment is higher than the base material. 5 In another study, the effect of heat input on various mechanical properties, microstructure and corrosion behavior of SS 304 and low nickel welded joints made by different welding processes were investigated. 6 With the scanning electron microscopy (SEM) investigations found that the delta ferrite was reduced with the increase in the heat input whereas the inter-dendrite length increased with the increased heat input.6,7 To get maximum impact strength and hardness of welded joints, the effect of welding process parameters on micro-hardness, depth and microstructure of L450 HSLA steel was studied 8 and it was reported that that the increase in welding speed from 1 to 2.5 mm/s tends to increase in micro-hardness whereas decrease in the width of HAZ. 9 Codes and standards of assembly of pipe and repair associate the hardness of weld metal and HAZ with the option of SCC failure.10,11 The material having hardness above 245 HV has high vulnerability to the SCC failure.12,13
The reported literature reveals that the effect of welding parameters on the linear joints has been explored by many researchers but hitherto little work has been reported on the circumferential TIG welded thin pipe joints of SS 304. This work aims to present experimental investigations concerning the effect of TIG welding parameters on micro-hardness, width of HAZ, residual stresses and microstructural changes of the thin pipe welded joints of SS 304. The proposal is to evaluate the parameters for the lower hardness value of the HAZ.
Experimentation
Material
The materials used in this experiment were two sections of pipes with the same outside diameter (OD), inside diameter (ID) and thickness. The pipe material used was SS 304. Figure 1 shows the SS 304 pipe of 84.22 mm OD, 80 mm ID and 2.11 mm thickness. The filler material used in this experiment was ER 304 SS with diameter of 1.2 mm. The chemical constituent of the workpiece is given in Table 1.
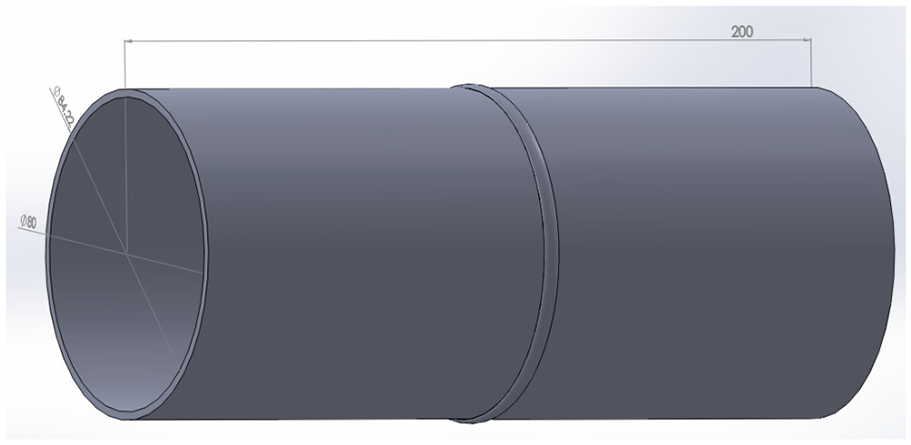
Schematic illustration of the weldment.
Chemical composition of the workpiece (in weight percentage) as determined by optical emission spectroscopy.
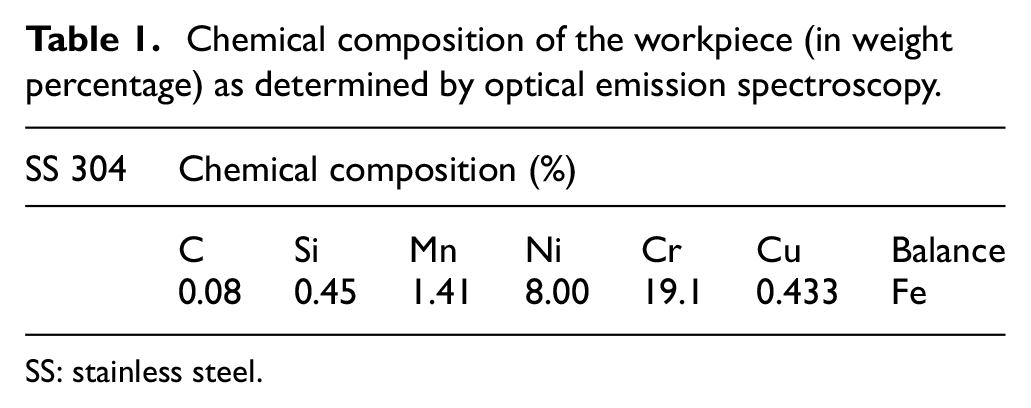
SS: stainless steel.
Design of experiment
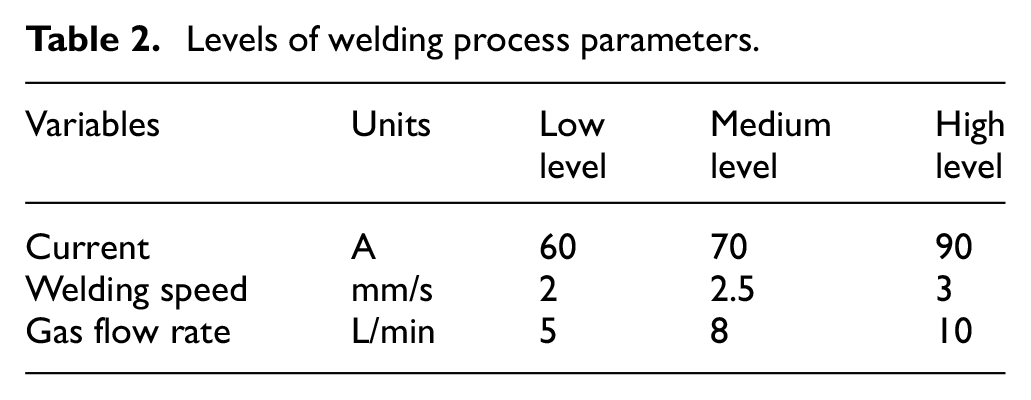
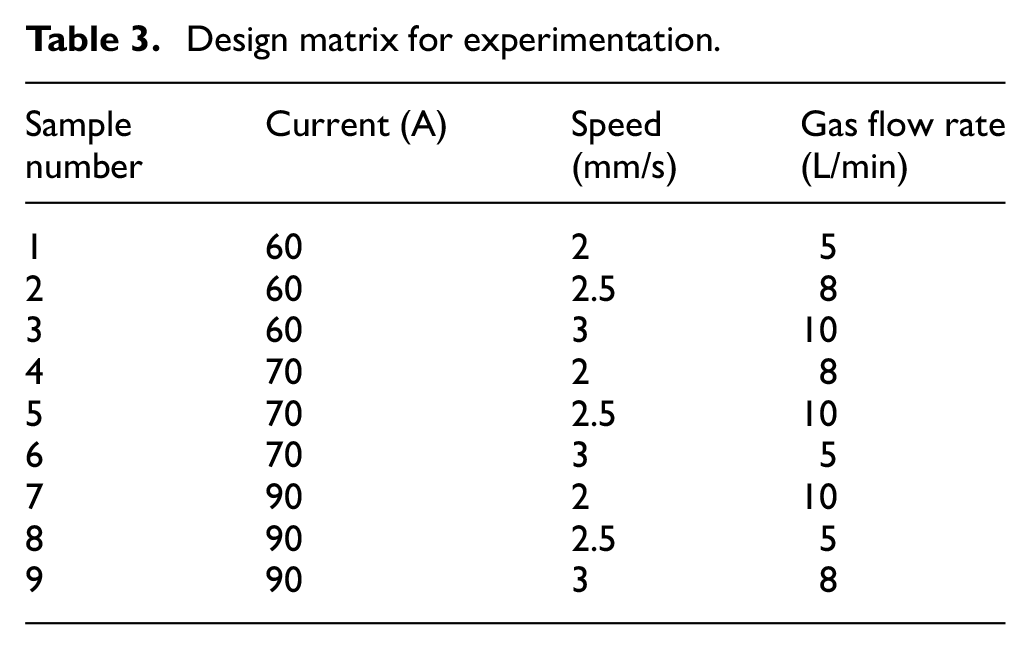
The limits of each controllable welding process parameters were obtained by conducting trial runs in order to get full penetration weld and must be free from any visible defects. In the present study, three different levels of welding parameters were taken (see Table 2) and Taguchi L9 orthogonal array (OA)-based design of experiment (DOE) has been selected for final experimentation. Three input variables: welding current (Amp), travel speed (mm/s) and the gas flow rate (L/min) with two output variables: micro-hardness (HV) and width of the HAZ were selected. Each factor was subjected to three levels which were low medium and high levels. Table 3 shows the experimental layout. Based on Table 3, Figure 2 shows different TIG welded specimens.
Levels of welding process parameters.
Design matrix for experimentation.
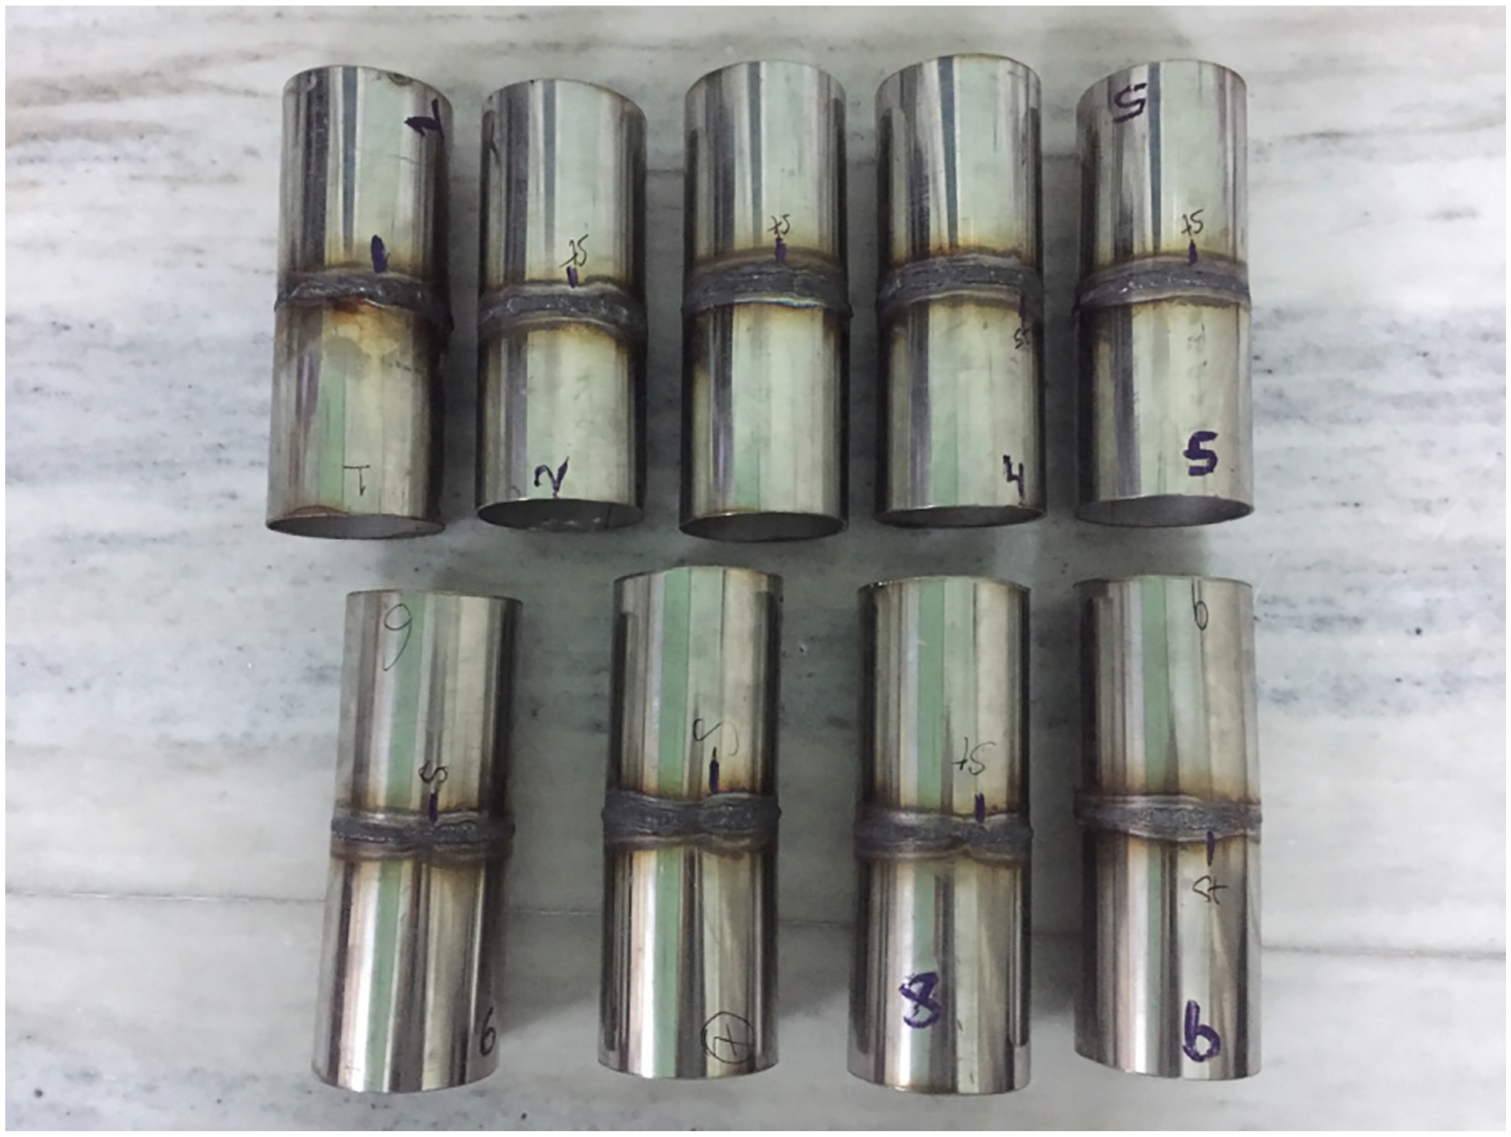
Welded sample of thin SS 304 pipes.
Welding process
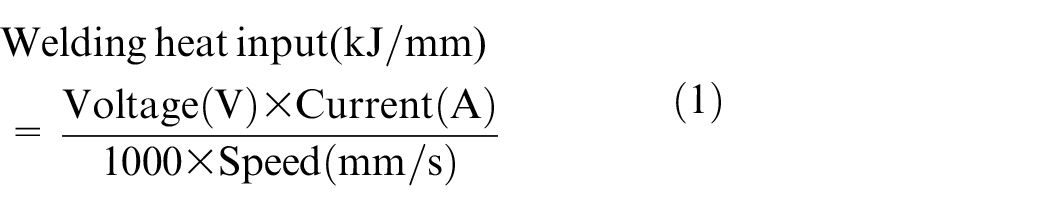
Pipes were held on the setup prepared with a rotational jig, perpendicular to the welding torch (see Figure 3). The torch was held in the center of the weld line. The shielding gas that was used in this experiment was a mixture of 80% argon and 20% CO2. Rotational jig was used in this experiment to hold and rotate the pipe to perform tailored orbital welding. The rotational jig was connected to the welding machine used. The jig is rotated with the help of motor having 900 r/min with horse power of 0.5 hp. This motor is connected with the control unit by which one can control the speed of the motor and can get a minimum speed of 10 r/min. With the help of this, circumferential weld at different constant speeds was made. Different heat inputs were obtained by varying welding speed and current. The direct current electrode negative (DCEN) mode was used in this study. Mainly, the mechanical properties are dependent on the heat input which depends on the welding parameters such as welding current and welding speed. With the help of experimental trial runs, the welding current and welding speed levels were selected. Welding current below 60 A results in the lack of weld penetration whereas welding current above 90 A melts the 2.11-mm thick pipe. Hereby, welding current is 60–90 A and welding speed is 2–3 mm/s. The welding heat input was calculated as follows 14
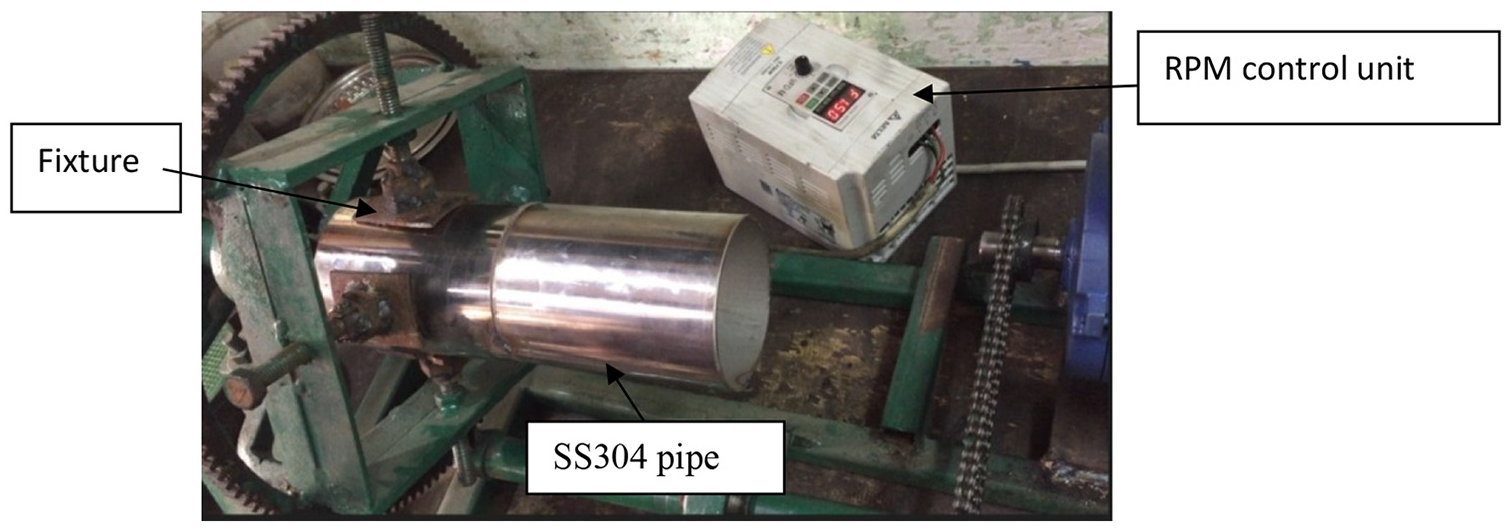
Rotational jig for welding with constant speed.
Microstructural and micro-hardness testing
For the study of microstructure and calculation of hardness, samples were taken of 15 × 15 mm normal to the weld bead. The samples were grounded on an emery paper with a sequence of 150, 600, 1200 and 1500 grade and then on the cloth with 0.7 µm alumina powder and finally mirror polished with the diamond paste. 15 Marble’s solution (50 mL hydrochloric acid (hydrogen chloride), 10 g copper sulfate, and 50 mL distilled water) was taken as an etching agent for the microstructure of the weldment. For micro-hardness test, the sample was cut and the test was conducted in accordance with ASTM E92 for the Vickers test. 16 The micro-hardness test was performed using a Mitutoyo HR-523 machine, Vickers micro-hardness tester. The micro-hardness measurement was carried out by applying a load of 5 N with 20 s dwell time. Micro-hardness values were recorded from the center to 2.5 mm along the normal side of the weld bead.
Results and discussion
Radiographic testing
In this study, SS 304 welded pipes were inspected according to the ASME Section V Article 2. The X-radiation was used according to the thickness of the welded pipe. The results are shown in Figure 4. Based on visual observations, samples 4, 7 and 8 are acceptable (having uniform welding bead) with best conditions observed in sample 7 and poorest in sample 3.
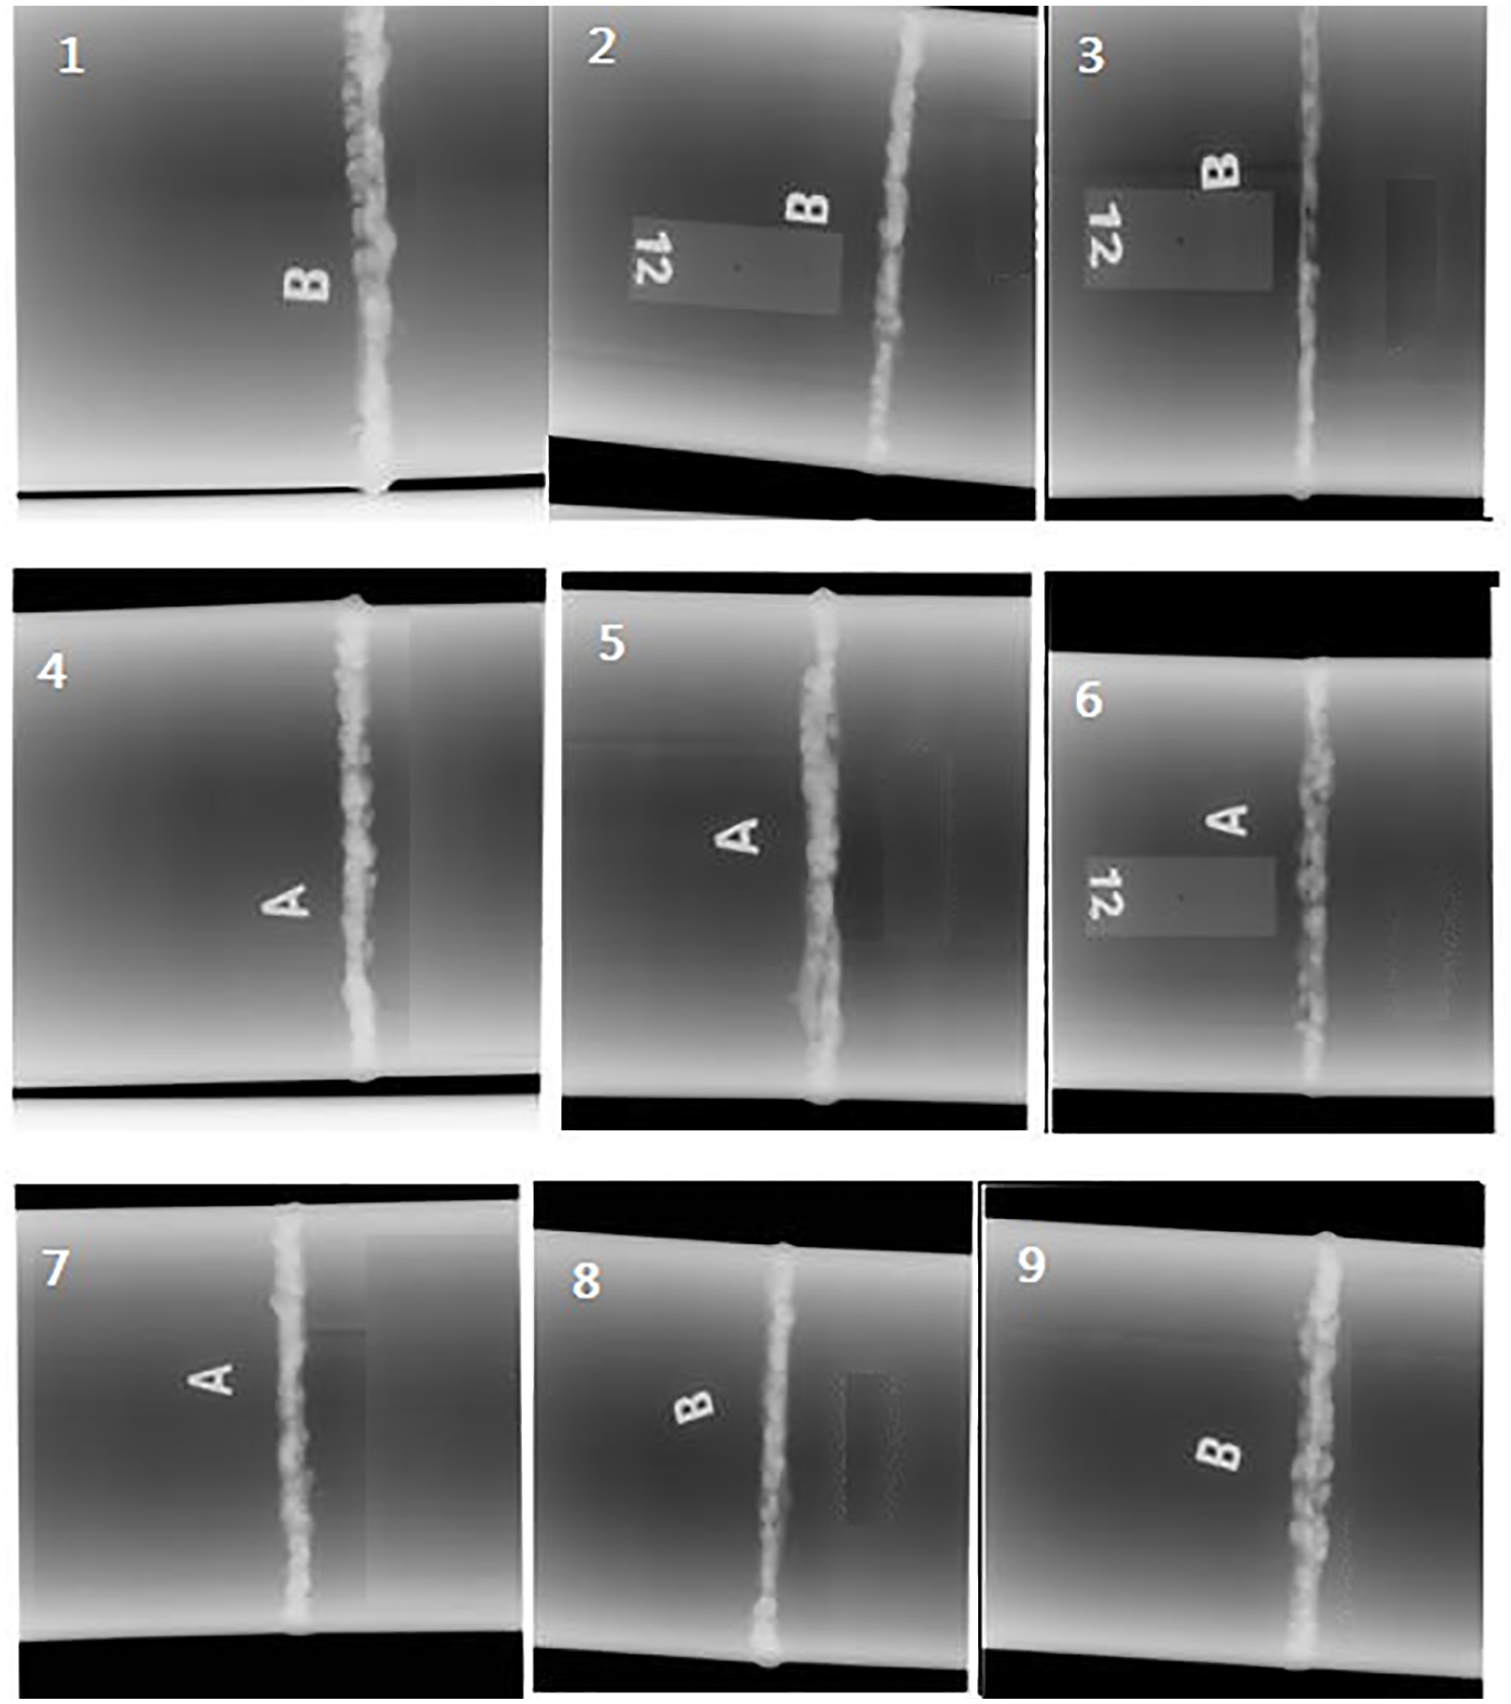
Radiography of samples (as per Table 3).
Micro-hardness
Based on the DOE (Table 3), experiments were conducted and the values of the responses are taken. The values of hardness at various locations on the weld bead and HAZ are shown in Figure 5. The aim is to get the combination of parameters for the improved properties of weld bead and HAZ and the effects of the process parameters on these variables are identified. The characteristic values are selected by the hardness of HAZ and the width of HAZ (zone with partial re-crystallization and carbide dissolution), since a decent result is obtained by the smaller HAZ width and smaller hardness, the lower the better (LB) is preferred for HAZ width and for the hardness value on weld bead. Furthermore, based on Table 3, Table 4 shows the experimental results for welding heat input, highest hardness value at joint and width of HAZ. As shown in Table 4, sample 3 has highest hardness value of 298 HV and sample 7 has 214 HV, although width of HAZ in sample 3 is significantly less. Here again, based on HAZ and hardness requirement in SS 304 joints, sample 7 may be considered as a better option. Based on Table 4, Table 5 shows signal-to-noise (SN) ratio for hardness and HAZ for smaller the better type case. Furthermore, based on Table 5, Figures 6–7 show the contour plot for hardness and width of HAZ. As observed from Figure 6, the best setting of input parameters for hardness is current of 90 A, velocity of 2 mm/s and gas flow rate of 10 L/min, whereas that for HAZ is current of 60 A, velocity of 3 mm/s and gas flow rate of 10 L/min. It should be noted that these results were obtained by maximizing the SN ratios for smaller the better type case. Also, the input parametric condition recommended well lies in DOE (Table 3). Again based on Table 5, Figure 8 shows the main effect plot of SN ratio for hardness and HAZ. As observed from Figure 8(a), the best settings for minimum hardness are current of 90 A, speed of 2 mm/s and gas flow rate of 5 L/min. However, the reason for high current and low welding speed for controlling the hardness is obvious as this setting may have contributed to better heat flow rate, thus finally controlling the grain size and structure. With regard to HAZ, the best settings are current of 60 A, speed of 3 mm/s and gas flow rate of 10 L/min (Figure 8(b)). However, the reason for minimum HAZ width at this setting is obvious because minimum current, maximum velocity and highest flow rate resulted in minimum heat flow (see Table 5, sample 3).
Design matrix with experimental results for hardness and width of HAZ.
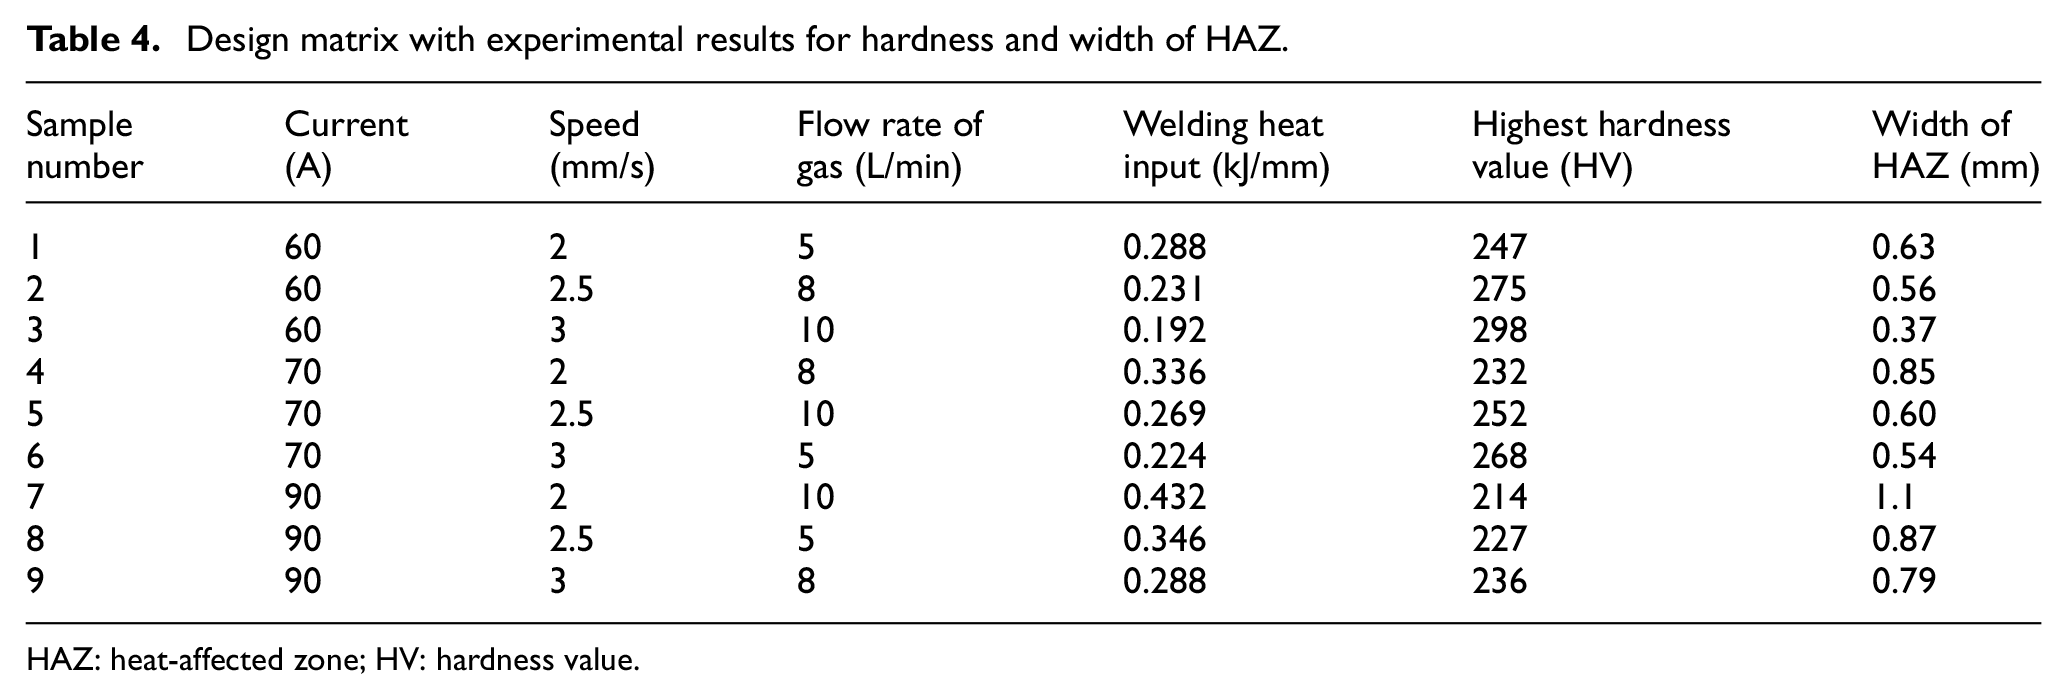
HAZ: heat-affected zone; HV: hardness value.
SN ratio of hardness and HAZ (S/N ratios: smaller is better type case).
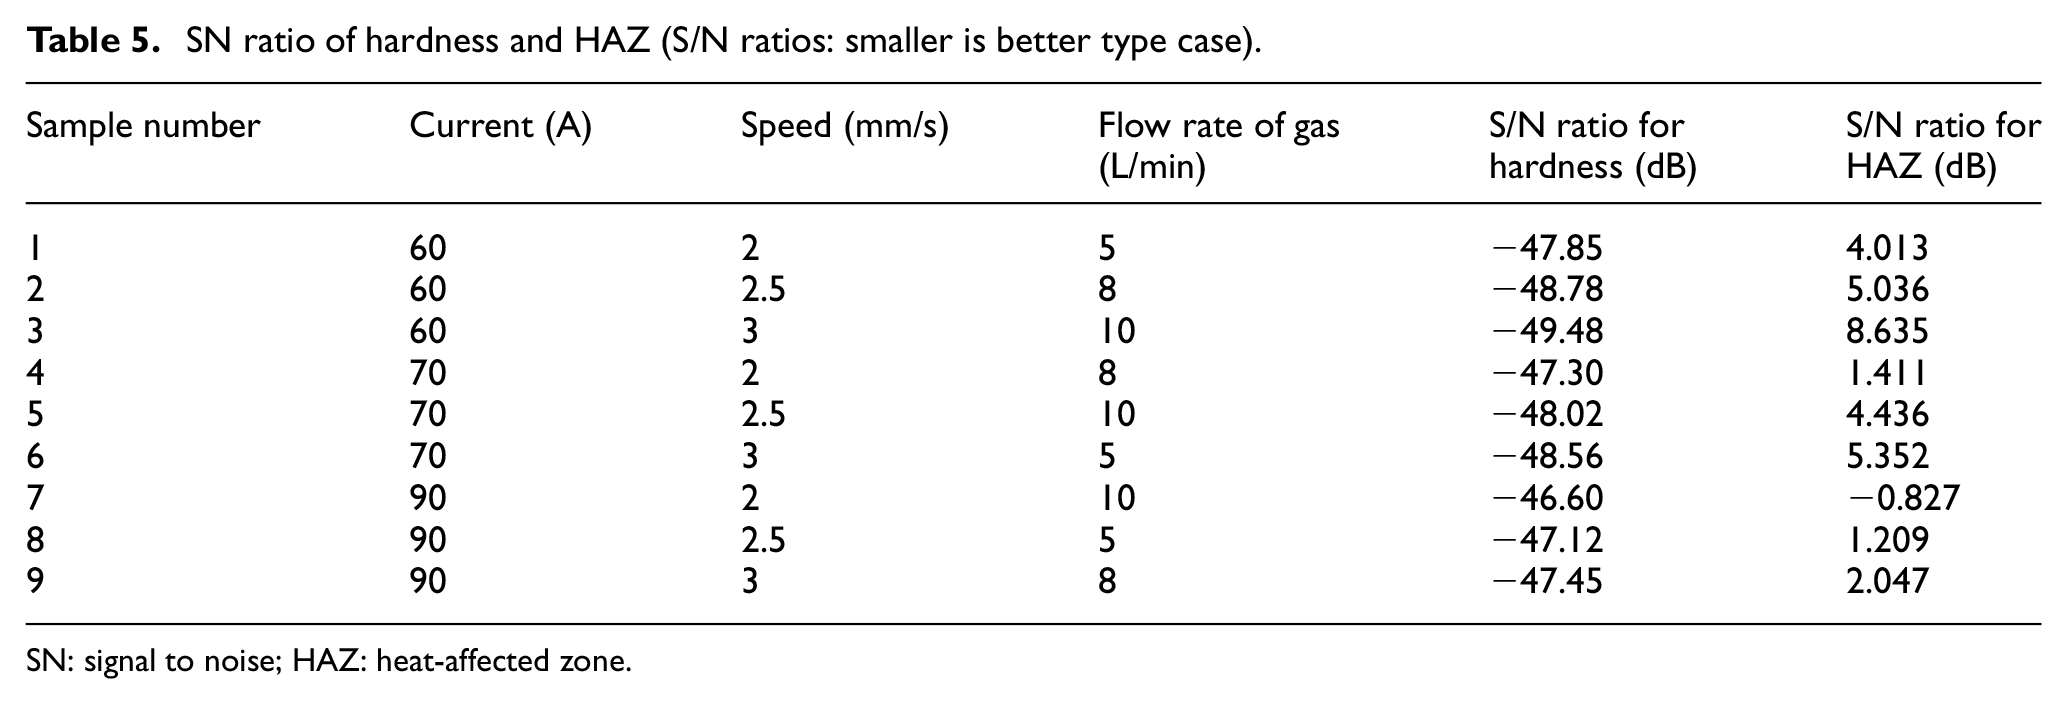
SN: signal to noise; HAZ: heat-affected zone.
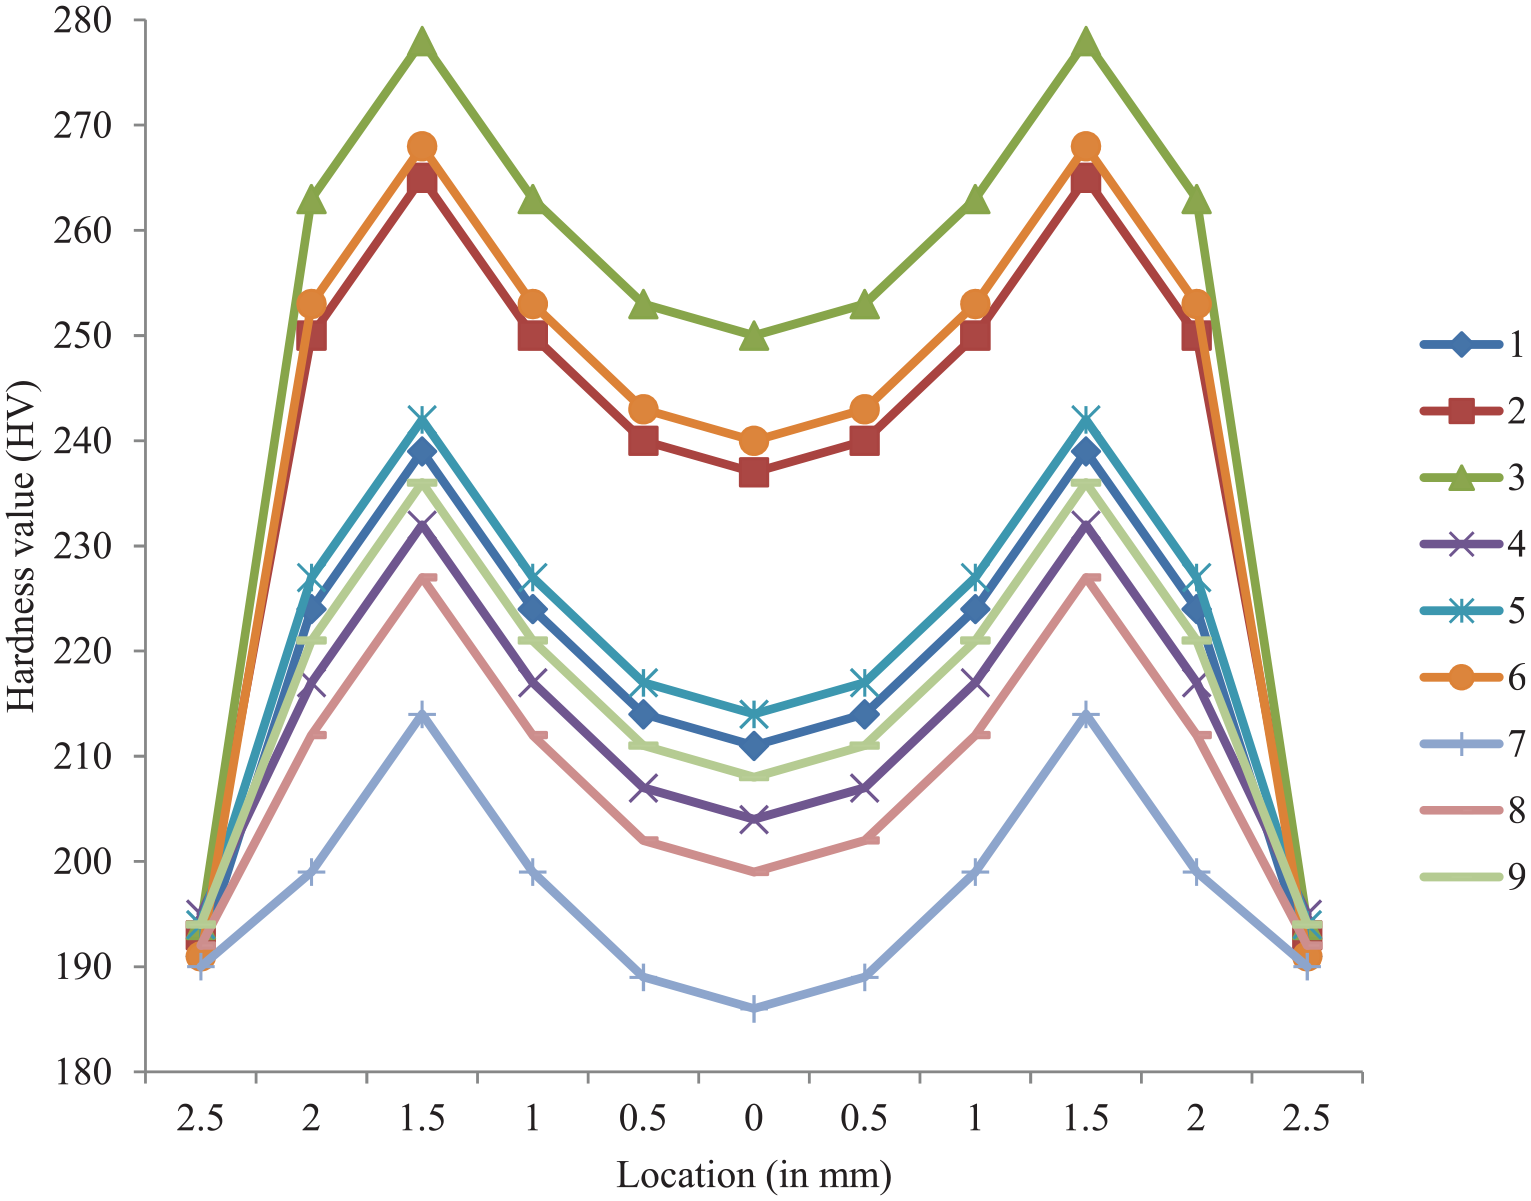
Micro-hardness of specimens at different locations (as per Table 3).
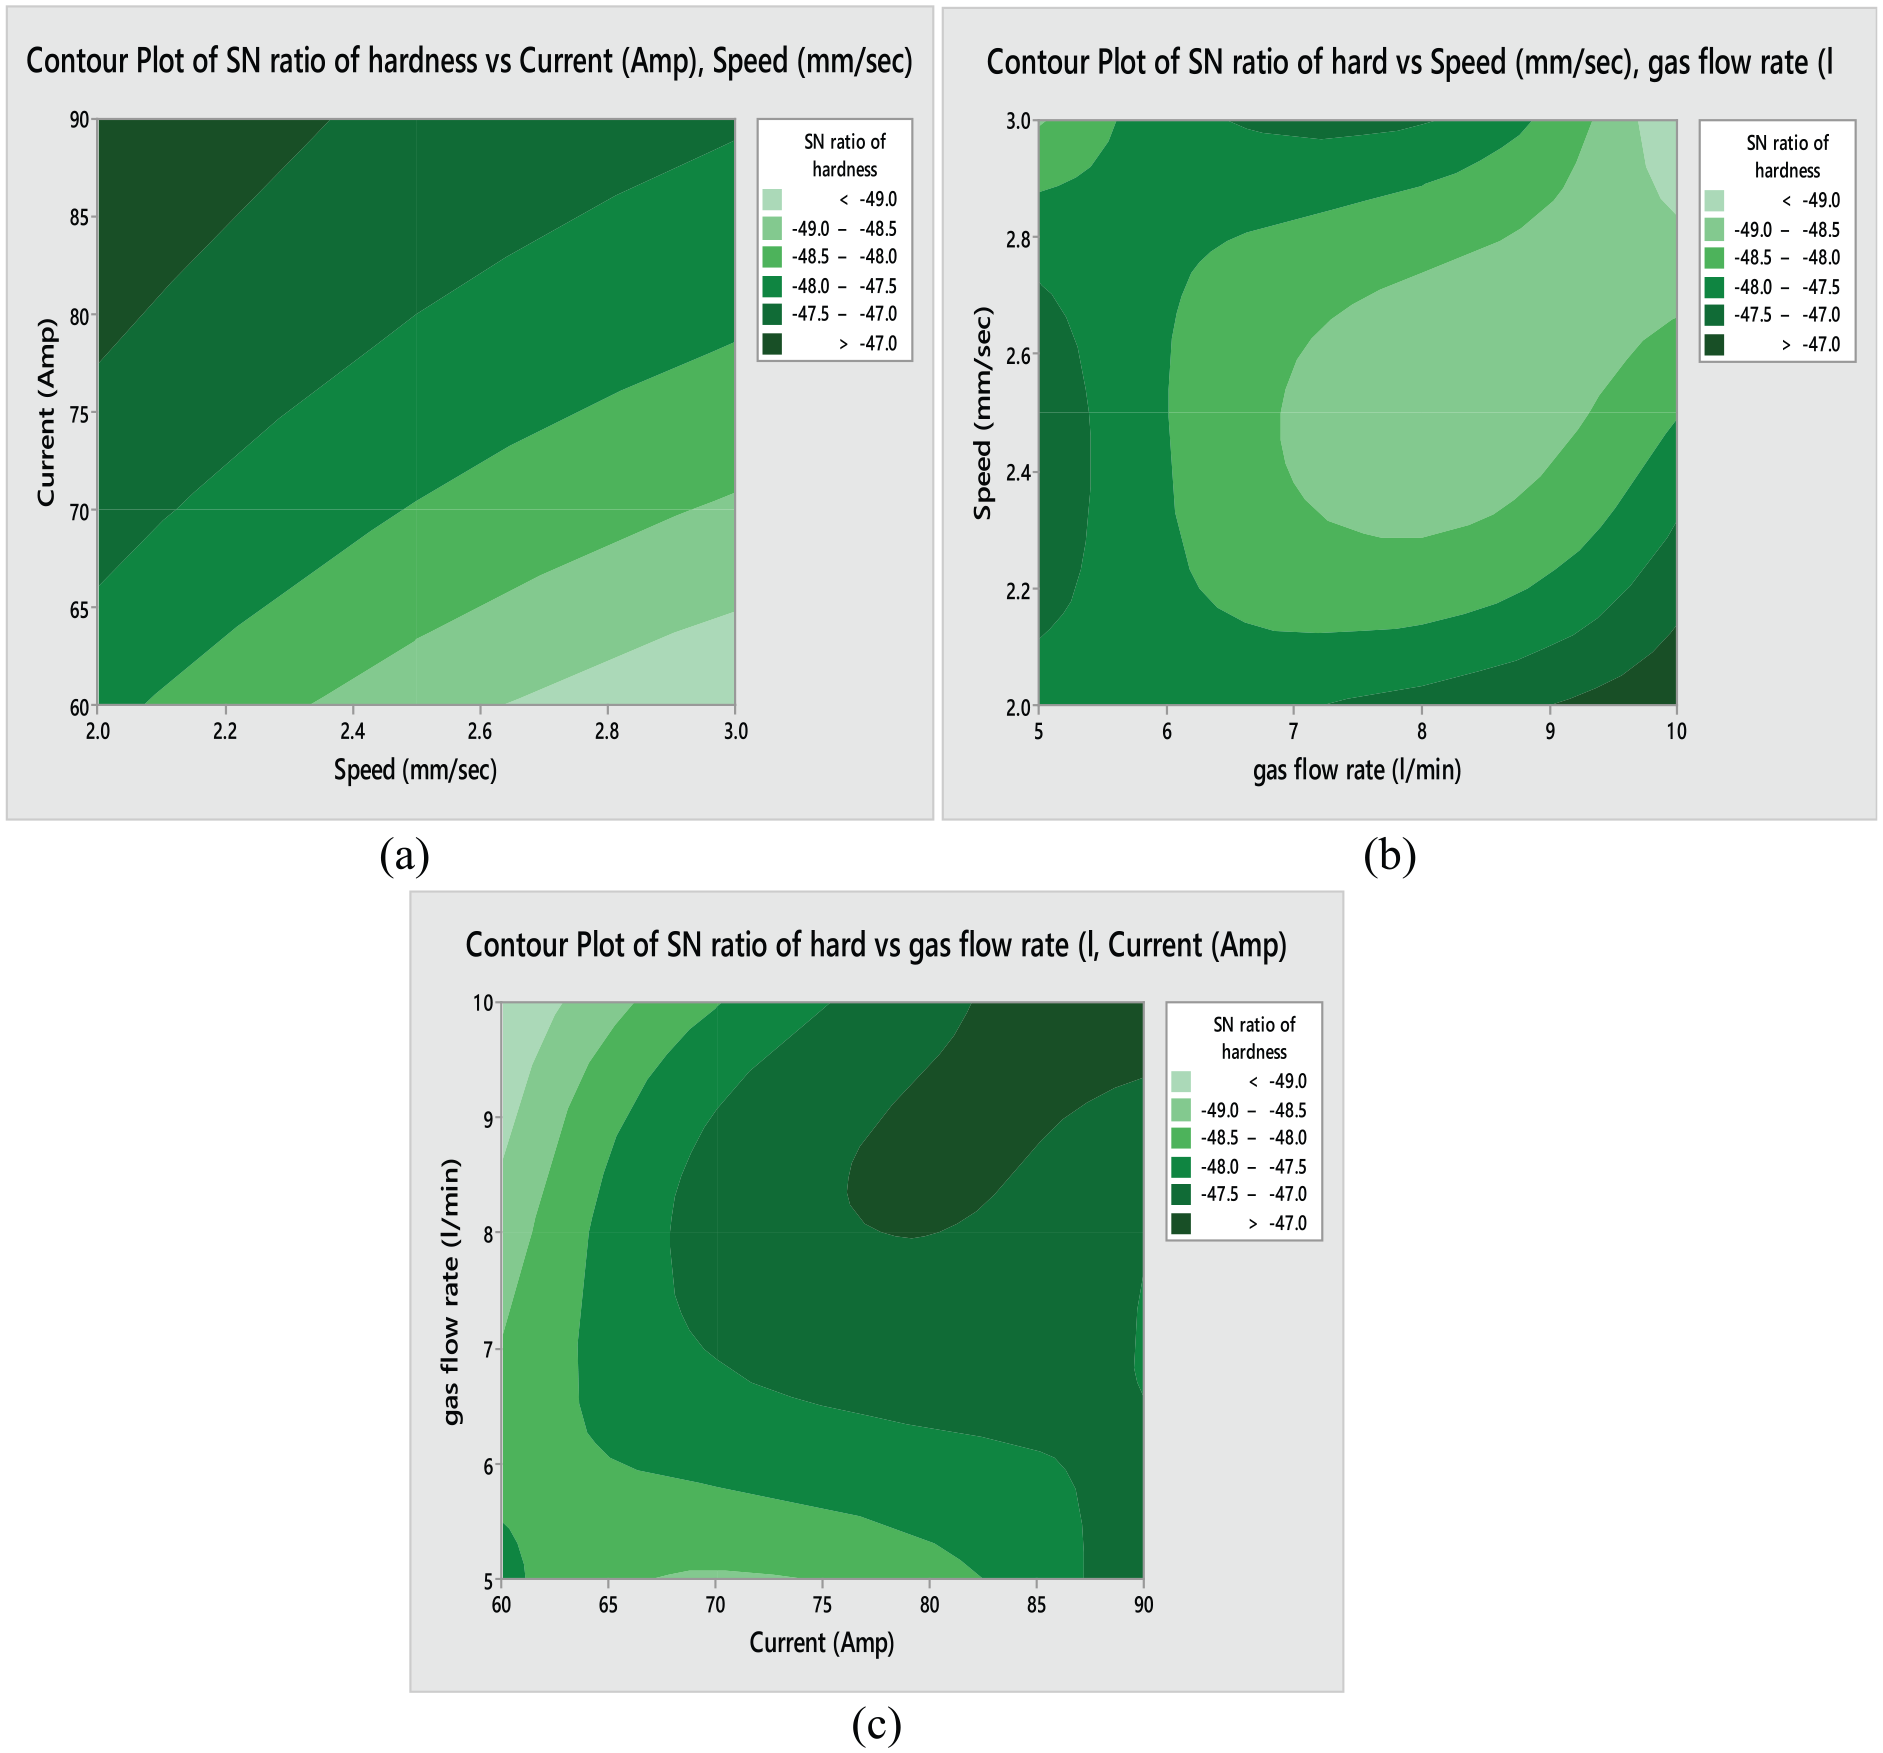
Contour plot of SN ratio for hardness: (a) between current and speed, (b) between gas flow rate and speed and (c) between current and gas flow rate.
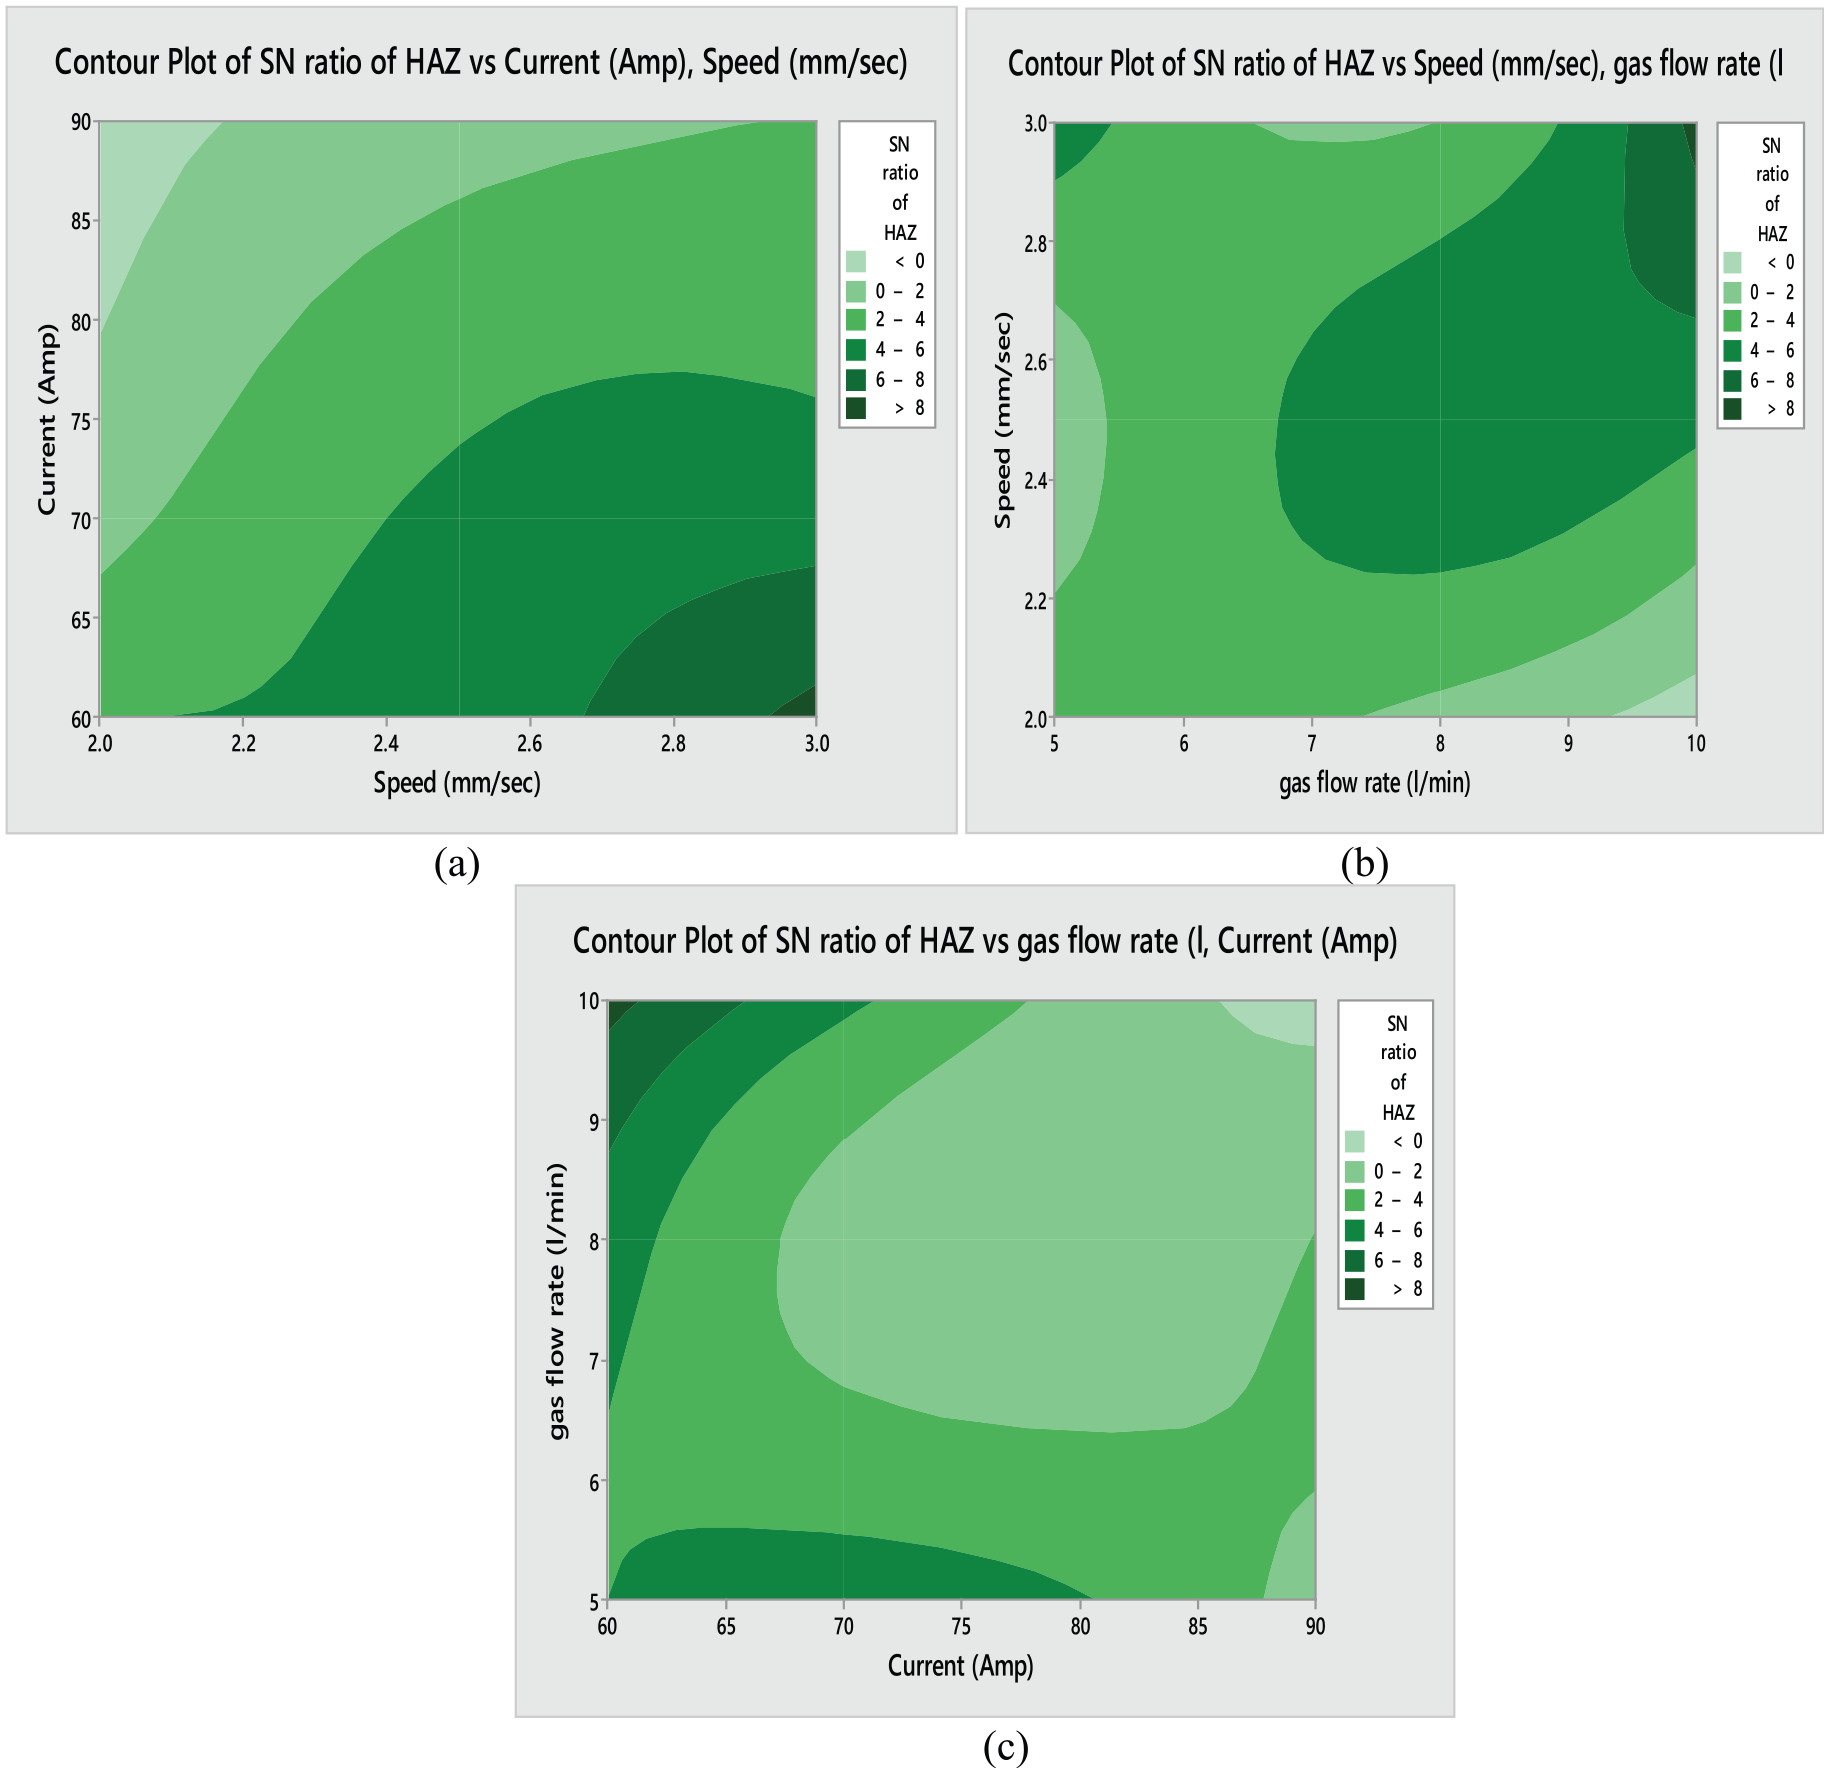
Contour plot of SN ratio for HAZ: (a) between current and speed, (b) between gas flow rate and speed and (c) between current and gas flow rate.
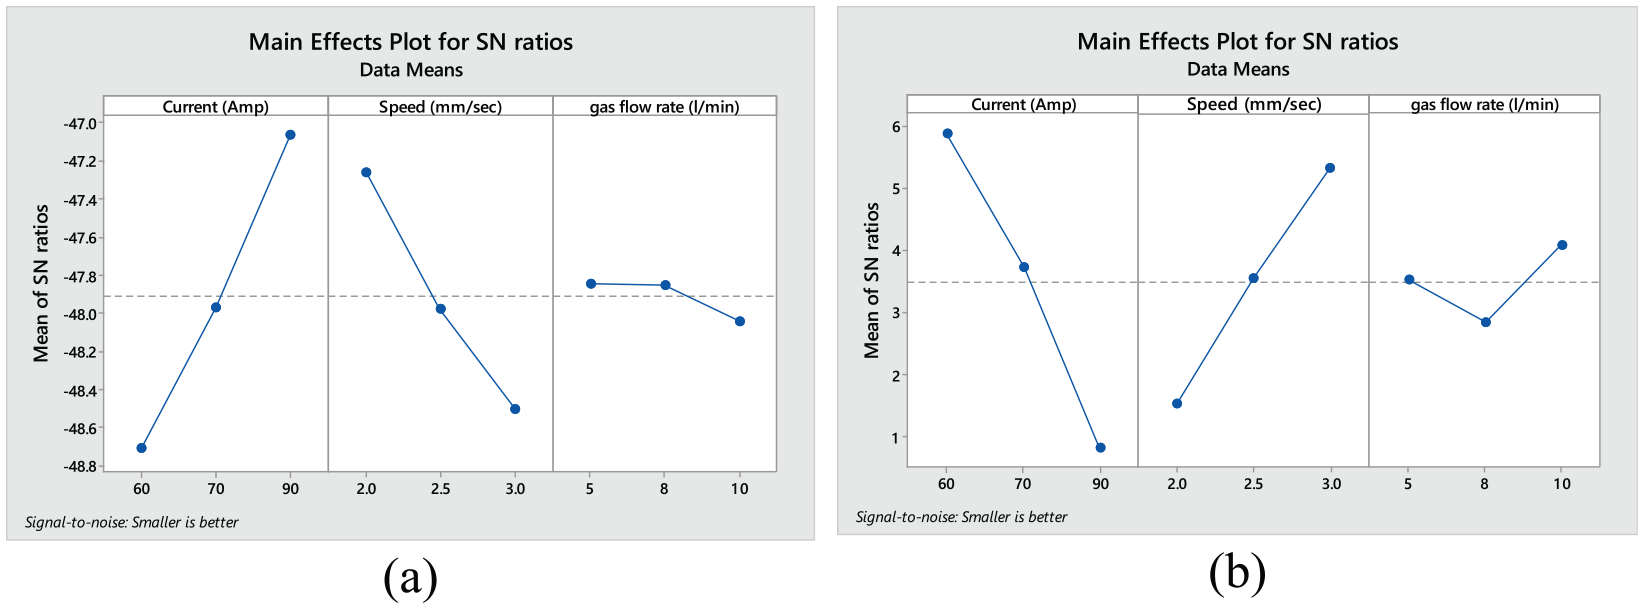
(a) SN ratio for hardness and (b) SN ratio for HAZ.
It has been observed (Figures 6–8) that predictions for the best settings are different for hardness and HAZ, so further based on Table 5, multi-factor optimization was performed using Minitab 17 statistical package. Figure 9 shows graphical representation for the overall optimized SN ratio using a response optimizer, which states that optimal settings are current of 90 A, speed of 2 mm/s and gas flow rate of 5 L/min.
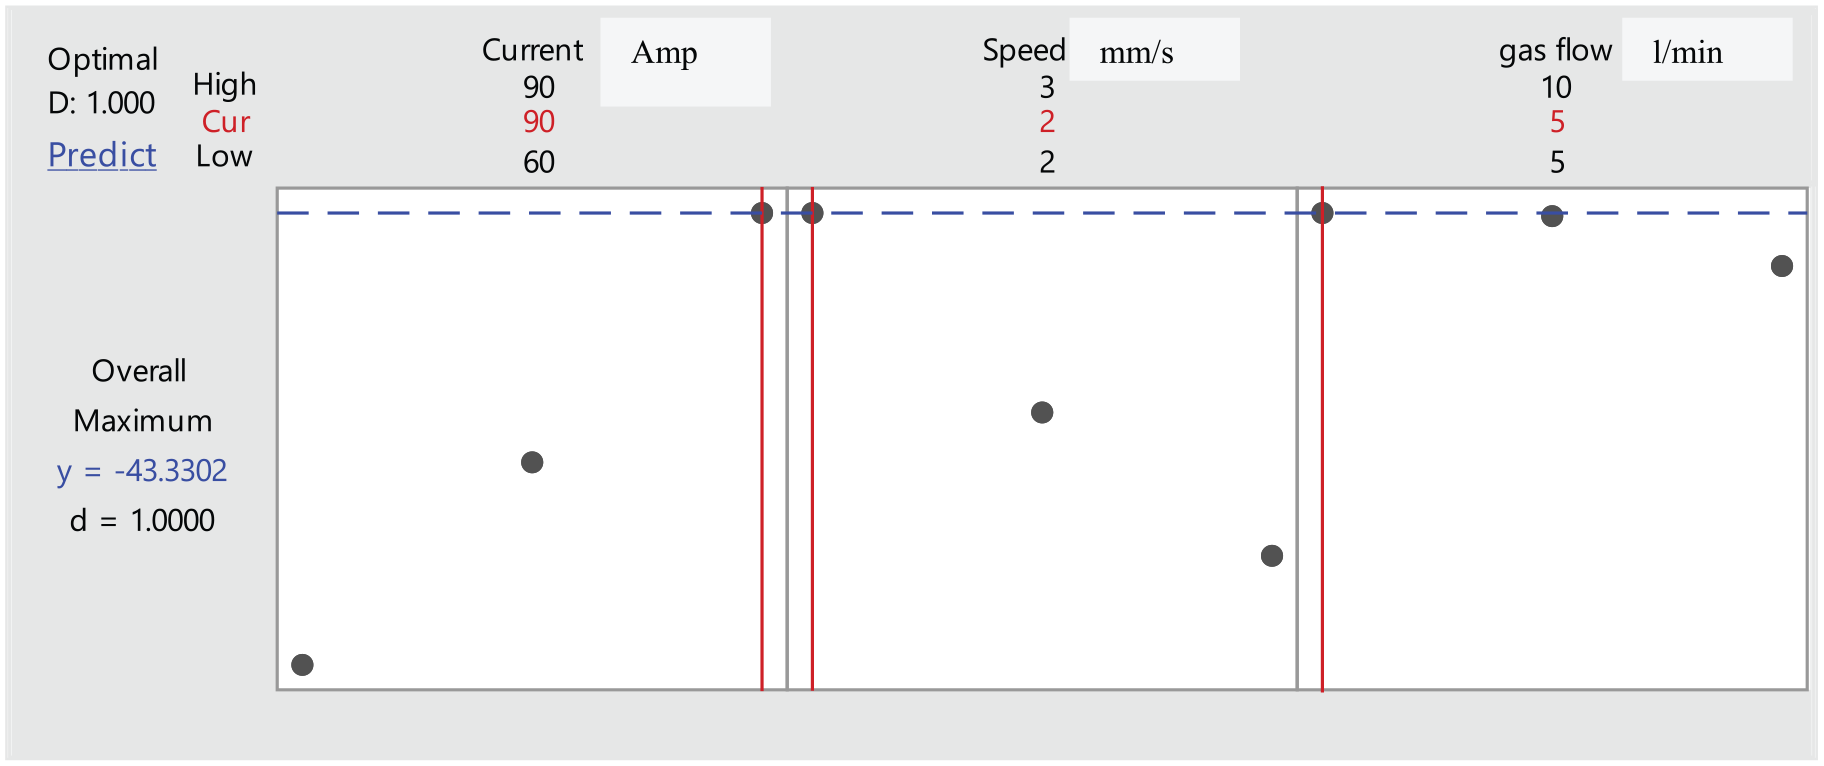
Response optimizer for combined optimization.
Morphological characterization
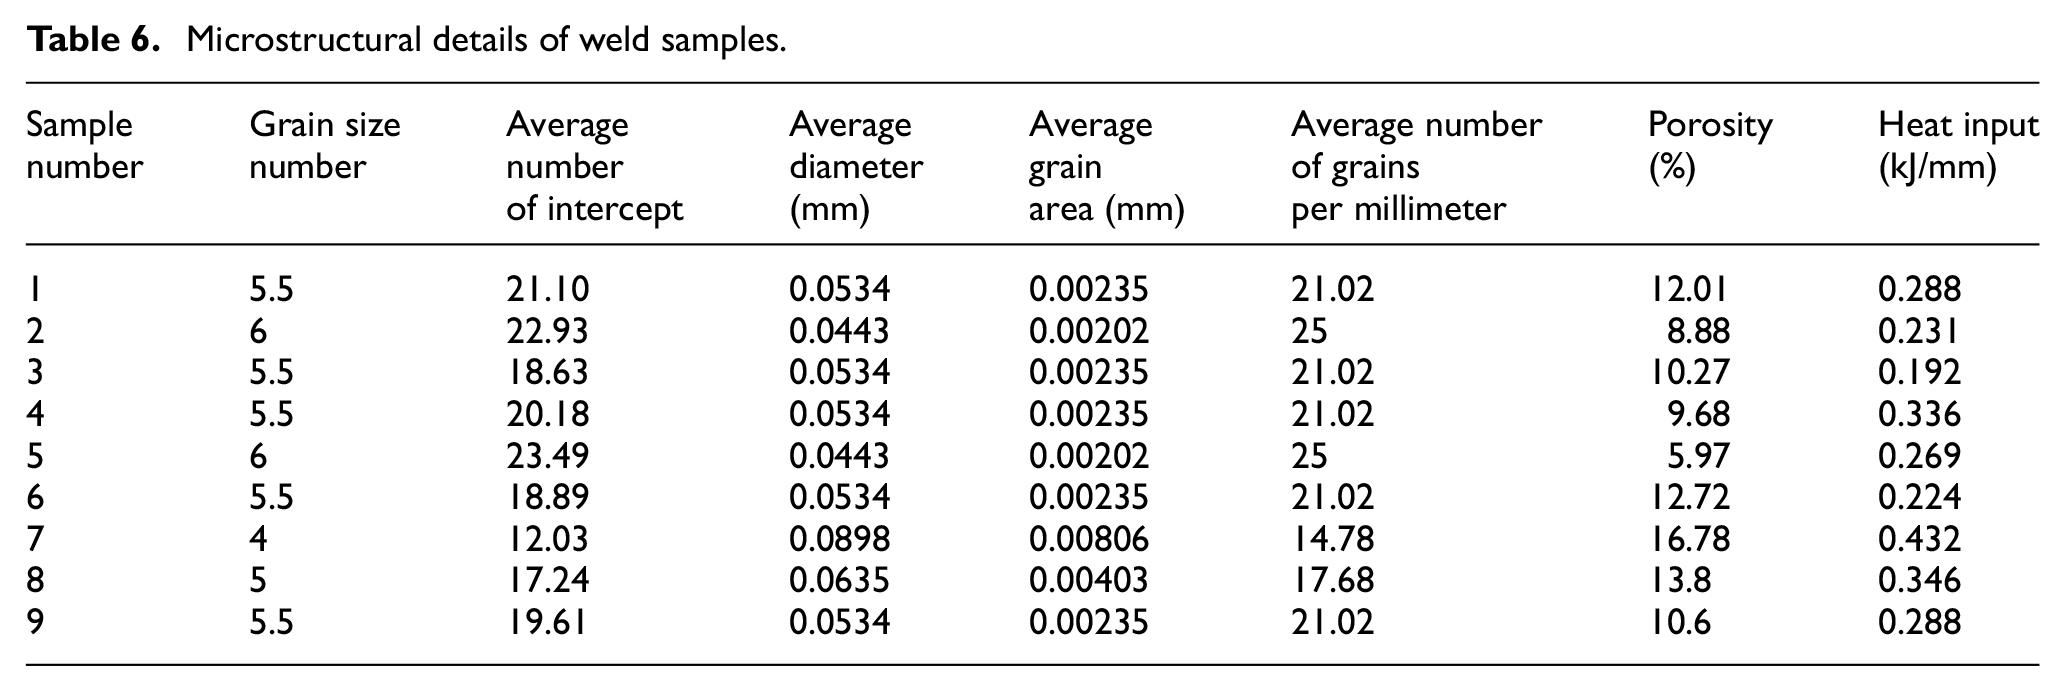
The microstructures of weldment (as per Table 3) are presented in Figure 10. The measured values of grain size number with the average diameter of the grain and the average number of grains per millimeter are mentioned in Table 6. It has been observed that with the low welding heat input, the martensitic phase’s transformation occurred (sample 3), whereas by increasing the welding heat input the formation of bainite and the ferrite was prominent in HAZ (sample 7). Furthermore, the average number of grains per millimeter in sample 3 is more than sample 7, which also contributes to high hardness. As observed from Figure 9, sample 3 shows the formation of an equiaxed structure whereas sample 7 has dendrite. Therefore, there are chances of re-crystallization which may have contributed to more hardness. This may be the reason that porosity (%) for sample 3 is less than that for sample 7. For the characterization point of view, the rendered images of photomicrographs and surface roughness (Ra) profiles for all welded surfaces were captured using image processing software. It has been observed that no direct relation can be made between Ra profiles, porosity and hardness values. Only the grain orientations/distribution may be considered as the basic reason for the improvement in surface properties. These are in line with the observations made otherwise. 17
Microstructural details of weld samples.
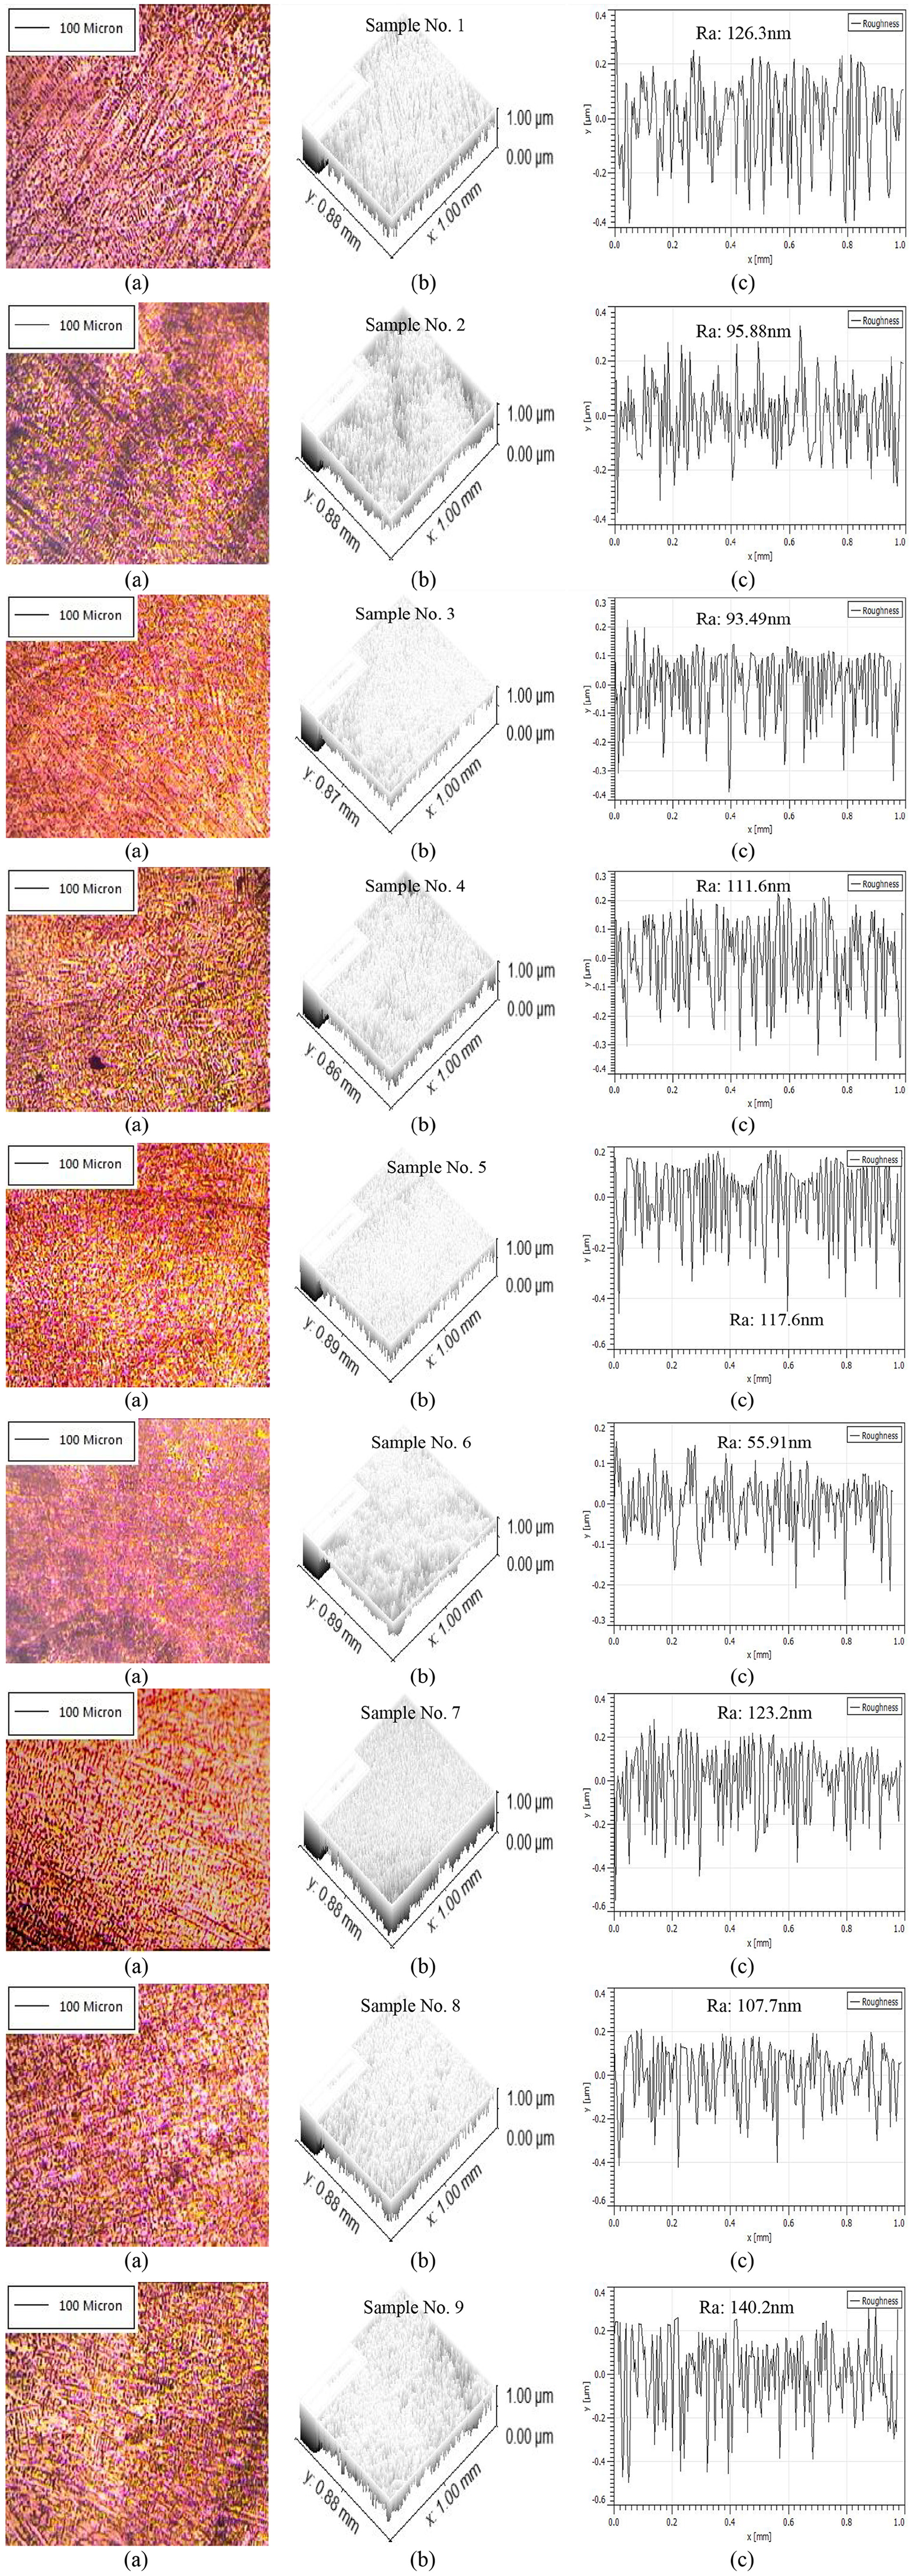
Optical micrographs of weld samples at (a) 100× magnification, (b) rendered image of photomicrographs and (c) Ra profile.
Residual stresses
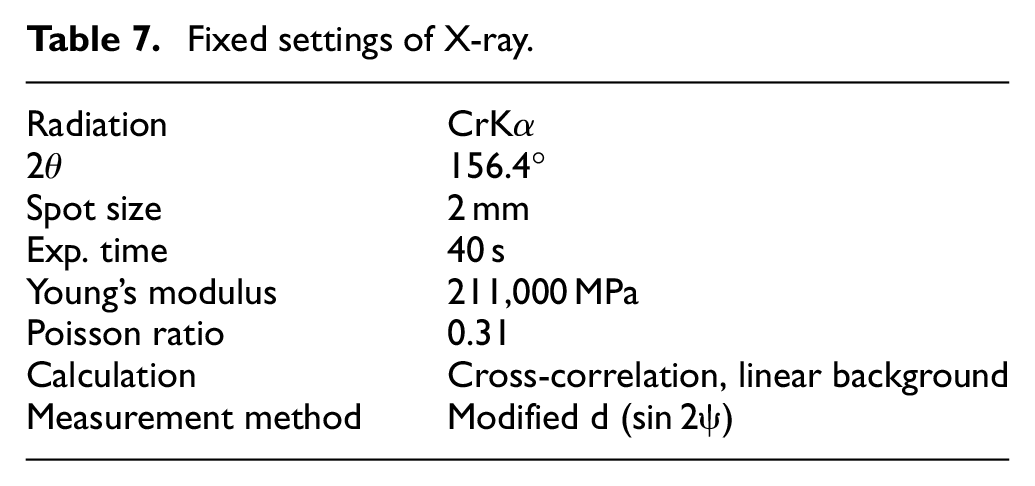
Stresses which are left in the object even after the removal of the exterior forces are called the residual stresses. Non-destructive method (X-ray diffraction) was used to measure the longitudinal residual stresses at various locations from the weld bead in the transverse direction (away from the weld bead). 18 Finally, sample 7 (as per Table 3) based on a minimum hardness value was subjected to residual stress analysis. The fixed parameters of the X-ray diffraction method and final output are shown in Tables 7 and 8.
Fixed settings of X-ray.
Residual stress values.
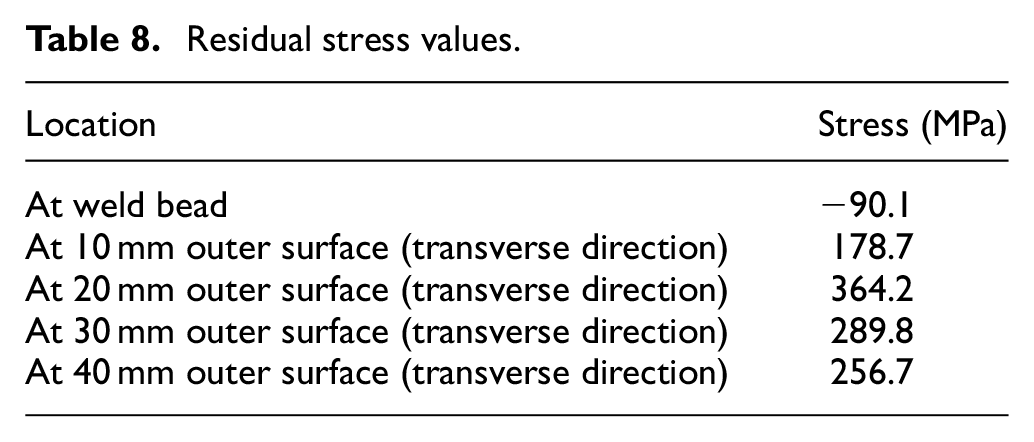
It has been observed that the residual stresses were compressive near the welded region around 90 MPa, while they were tensile away from the weld region around 28 MPa for the highest heat input of 0.432 KJ/mm, which is acceptable as per industrial requirements.
Process capability analysis
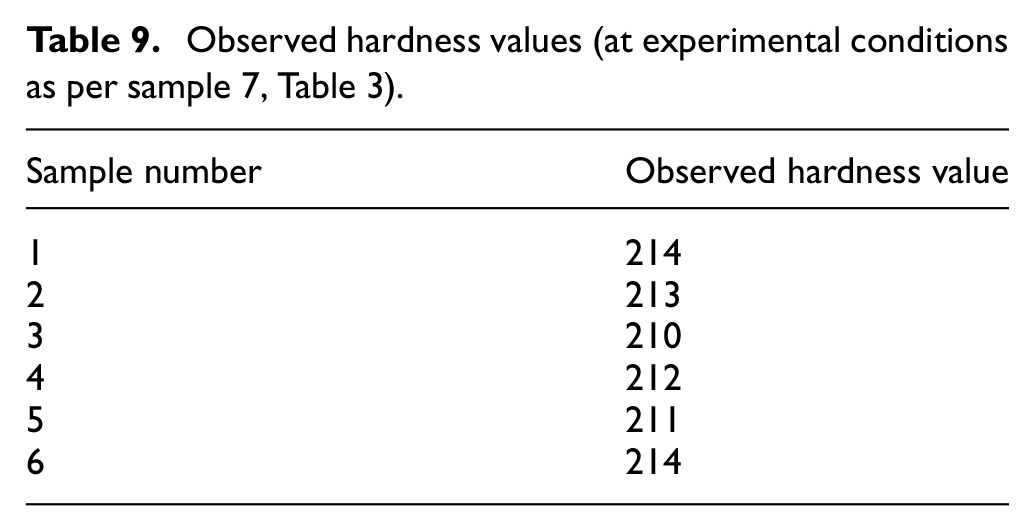
Furthermore, based on Table 3, six repetitive trials were made for hardness measurement as per settings suggested in sample 7 (see Table 9). Based on the observed hardness values process, capability indices (Cp and Cpk) were calculated (Table 10) and process capability histograms and normal probability plots (Figure 11) were obtained.
Observed hardness values (at experimental conditions as per sample 7, Table 3).
Capability statistics.
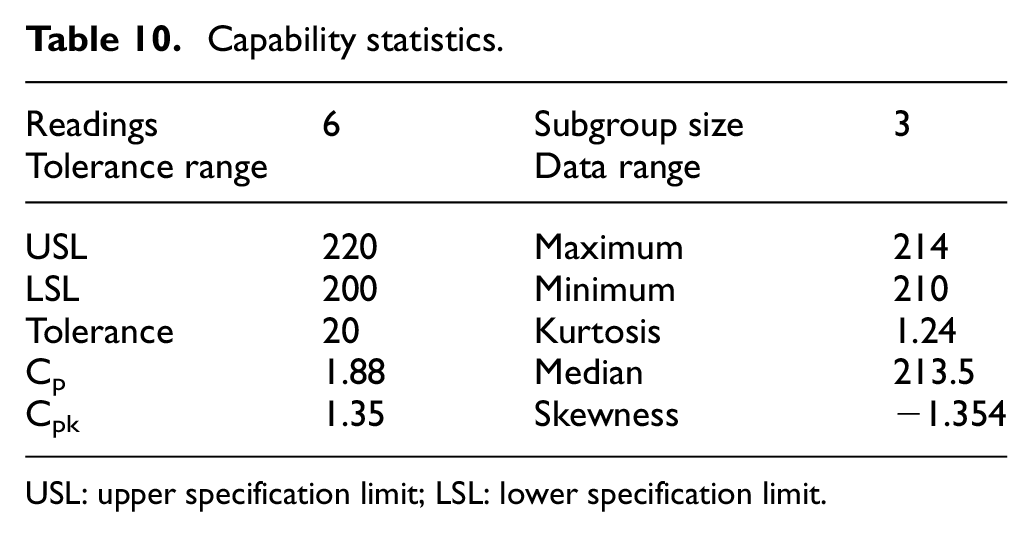
USL: upper specification limit; LSL: lower specification limit.
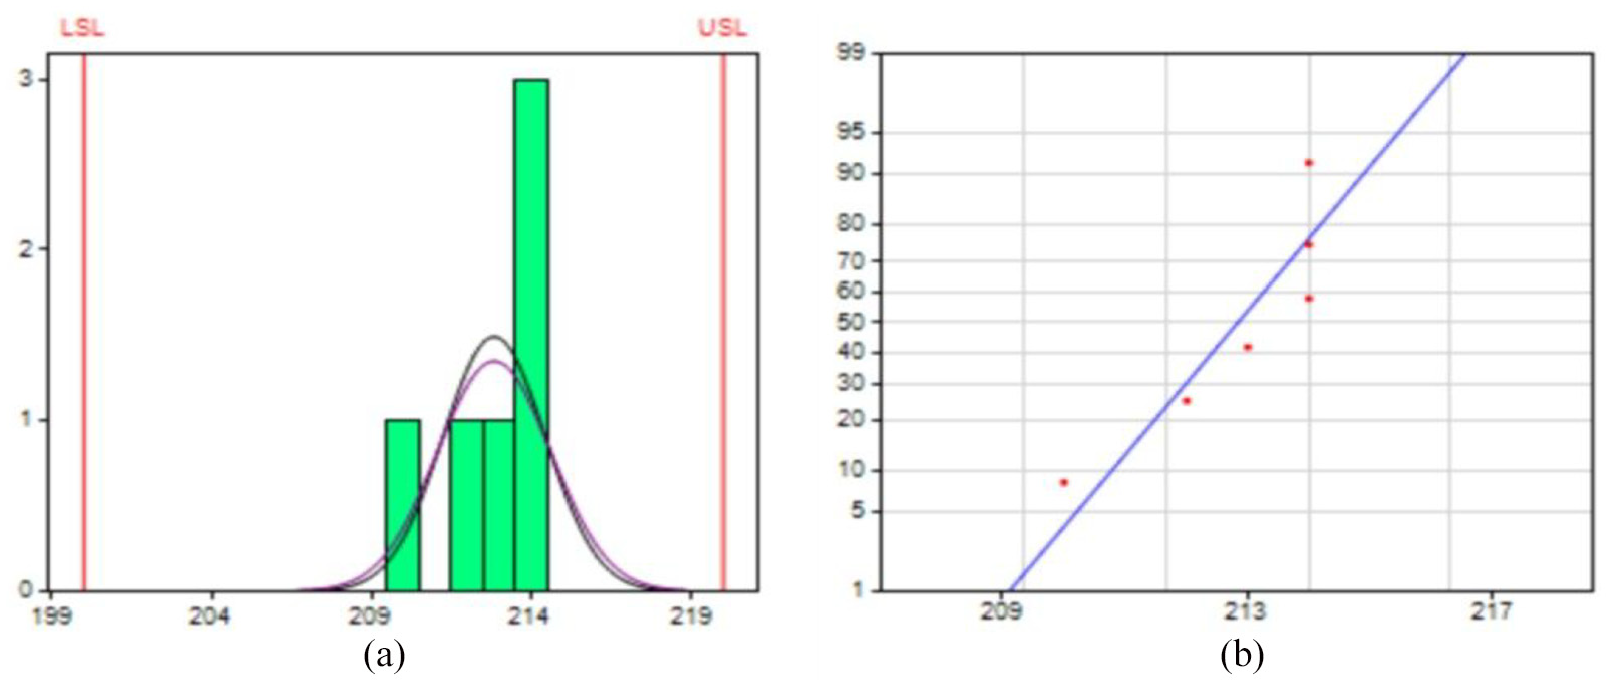
(a) Process capability histogram and (b) normal probability plot for hardness.
As observed from Table 10, the Cp and Cpk values are ≥1. Hence, the process is in statistical control which has been counter verified based on normal probability plot and process capability histogram.
Conclusion
Following are the conclusions from the study:
The hardness of weld bead decreases with maximum welding current and low welding speed combination. The minimum value of hardness observed in this experimental study was 214 HV with the heat input of 0.432 kJ/mm and the width of the HAZ was 1.1 mm, and the maximum value of hardness was 298 HV with the heat input of 0.192 kJ/mm and the width of HAZ was 0.37 mm.
From statistical quality control viewpoint, the observed Cp and Cpk values are ≥1; hence, the process can be gainfully used for mass production.
The predicted best settings for minimum hardness and minimum HAZ are current (90 A), speed (2 mm/s) and gas flow rate (5 L/min).
The microstructure with the low welding heat input in this case study resulted in the formation of equiaxed grains whereas at high input dendrite was observed. Also, it has been observed that residual stresses for the best sample with minimum hardness were compressive near the welded region while they were tensile away from the weld region for the highest heat input of 0.432 kJ/mm.
Footnotes
Acknowledgements
The authors are thankful to Manufacturing Research Center, Department of Production Engineering, Guru Nanak Dev Engineering College, Ludhiana, and I.K. Gujral Punjab Technical University, Jalandhar, for providing the research facilities.
Declaration of conflicting interests
The author(s) declared no potential conflicts of interest with respect to the research, authorship and/or publication of this article.
Funding
The author(s) received no financial support for the research, authorship and/or publication of this article.