
Abstract
Measuring large batches of solution concentrations is a cumbersome task that is time consuming and involves many reagents. Determining how to improve the measurement efficiency of batch concentrations is an urgent problem to be solved. This paper introduces an efficient method for the measurement of batch solution concentrations based on normalized compressed sensing. The method is based on the sparsity of natural signals and can reconstruct the original batch concentration signals with a high level of accuracy while taking fewer measurements. The proposed method extracts subsamples from the original samples according to a sampling matrix; the number of subsamples can be much smaller than the original number of samples. Then the solution concentration of the original samples can be reconstructed by measuring the subsamples. The specific process includes sparse signal representation, non-related observation, and nonlinear optimization reconstruction. Compared with the traditional measurement method, the proposed method is demonstrably superior for the measurement of batch solution concentrations; satisfactory batch solution concentration distribution results can be obtained with a number of measurements that is much smaller than the number of samples. The proposed method will greatly reduce the time and cost of measurement.
Keywords
Introduction
Compressed sensing is a technology at the forefront of the fields of fast magnetic resonance imaging,1,2 image denoising,3–5 single-pixel camera development, 6 and so on. In this paper, compressed sensing is used for batch solution concentration measurement. Solution concentration measurements has a wide range of applications in various fields, such as water monitoring, soil analysis, materials testing, and medical diagnosis. With the progress of science and technology, modern industry and agriculture require new measurement methods with high performance, and there are technical requirements for the production of various products. Medical diagnosis is also significantly dependent on various biochemical tests, which require accurate, timely, and economical measurements of solution concentrations. However, there is little literature on the use of compressed sensing in batch solution concentration measurements. At present, all samples require a large number of measurements, which is time consuming and expensive. The compressed sensing method is introduced into batch solution concentration measurement to solve the above problem.
In this paper, we propose a method based on compressed sensing. Sampling is normalized during the process to ensure that the samples are not depleted during the test. The proposed method reduces the number of measurements by using normalized compressed sampling of the original batch concentration signals and can obtain a satisfactory solution concentration distribution. This approach can save considerable measurement time and reduce expensive test reagent costs.
Theory of compressed sensing
Compressed sensing is a new sampling theory. By using the sparse characteristics of a signal, discrete samples of the signal are obtained by random sampling at a level that is much smaller than the Nyquist sampling rate, and then the signal is perfectly reconstructed using a nonlinear reconstruction algorithm.
Compressed sensing theory includes three key parts: sparse signal representation, non-related observation, and nonlinear optimization reconstruction. 7
Sparse signal representation
Most of the components of the signal representation coefficients are close to zero, and the signal is said to be compressible.
It is assumed that the signal
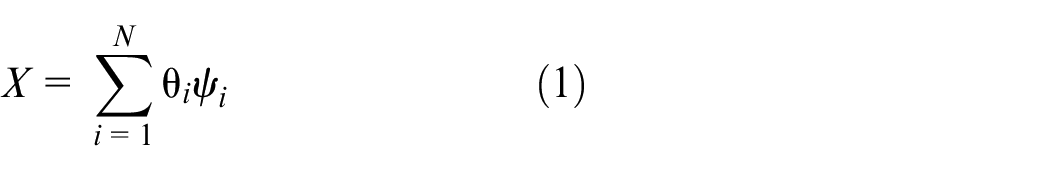
Equation (1) can be rewritten in matrix form

where
Non-related observation
The original signal

where

where the CS information operator is represented as
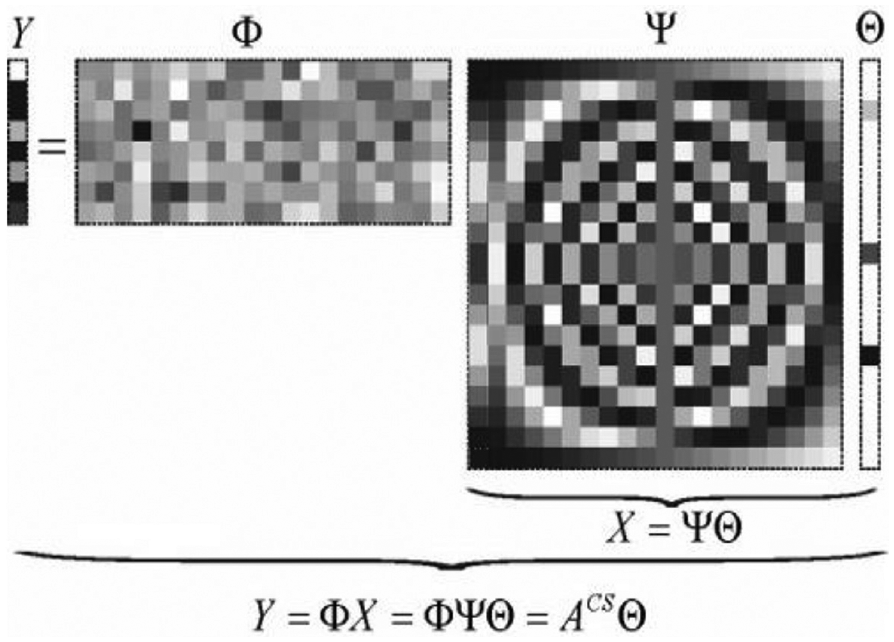
Representation of the compressed sensing observation.
The measurement vector
Nonlinear optimization reconstruction
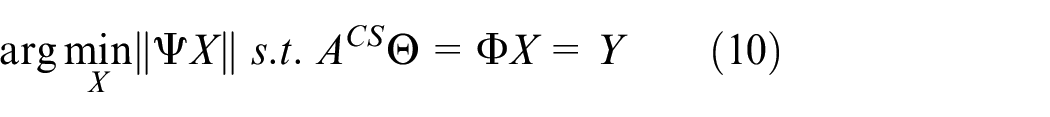
In order to efficiently reconstruct the original signal, the optimization problem must be solved under the
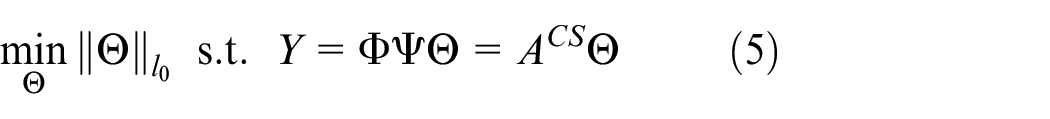
Equation (5) is a typical
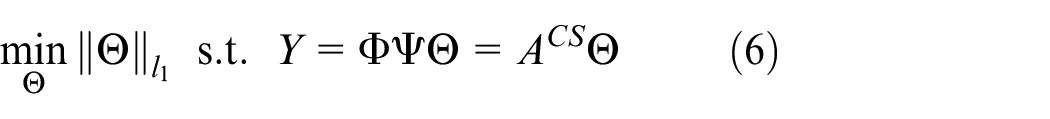
Some algorithms, such as the Basis Pursuit (BP) Algorithm, 12 the Matching Pursuit (MP) Algorithm, 13 the Total Variation Algorithm, 5 and the Conjugate Gradient Algorithm, 14 are used to solve equation (6).
Batch measurement of the solution concentration
The proposed method was used to measure the concentration of fluoride in a river flowing through an industrial park in batches. The fluoride ion concentration distribution in a river can reflect the level of water pollution. In order to find the source of the pollution, the fluoride ion concentrations in several different river sections were viewed, so that reasonable and effective pollution prevention and control measures can be proposed. The specific measurement steps are as follows.
Obtaining the measurement sample
A number of water samples containing fluoride ions were collected from the Hanjiang River, a tributary of the Yangtze River. Water samples were taken at intervals of 50 m with a collected volume of 20 mL each time, for a total of 200 samples. The total length of the sampled river is 10 km.
Normalized compressed observation
A plurality of the samples containing fluoride ions to be tested were placed in a test box, arranged in order according to the Han River sampling sequence, and sequentially numbered as a one-dimensional distribution vector of the fluoride ion concentration. A Gaussian random sampling matrix was generated. The row vectors in the matrix were sequentially removed as the sampling reference data. The liquid in samples containing fluoride ions in a plurality of the measurement containers was sequentially concentrated.
The generated Gaussian random sampling matrix is
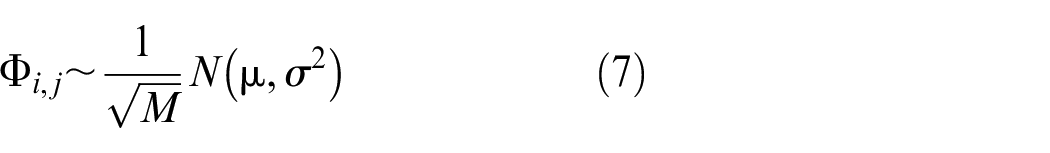
In practice, some other types of random sampling matrices can be used, such as the Bernoulli sampling matrix.
Because sample volume is limited in actual samples, to prevent samples from being depleted before testing, the above generation matrix should be normalized as follows
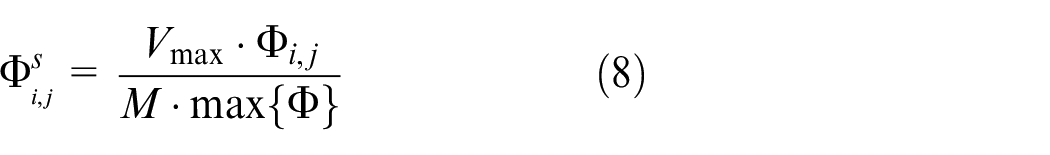
In equation (8),
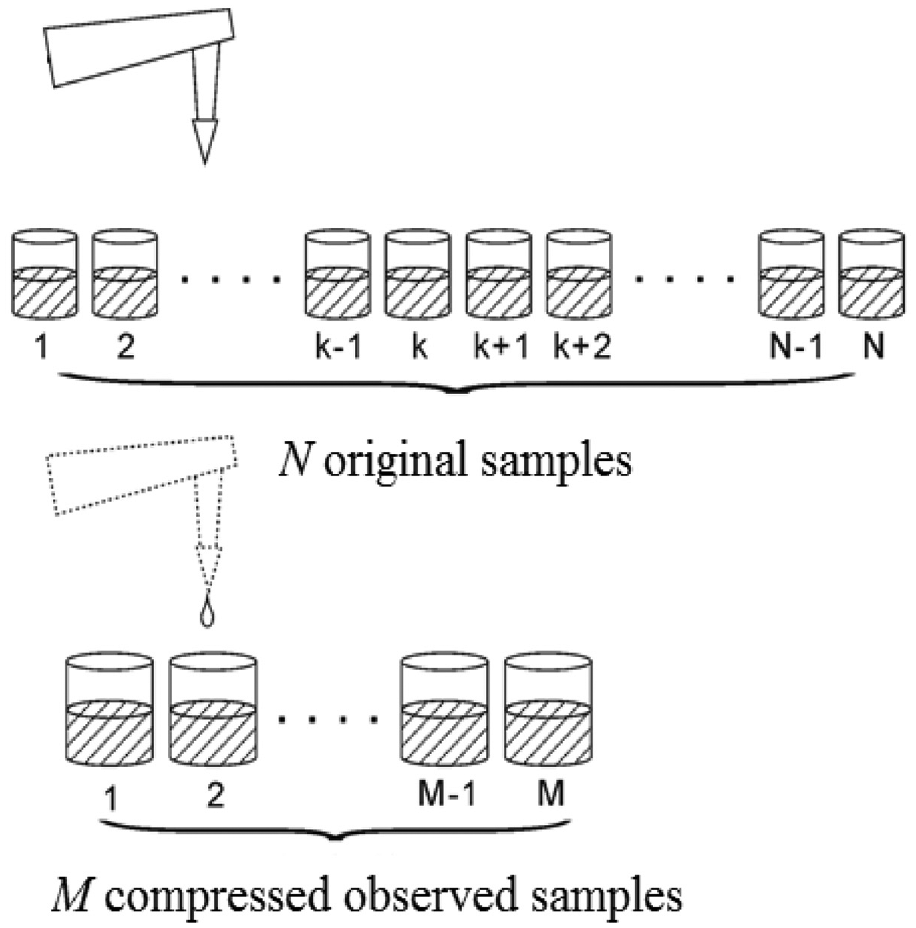
Sampling process.
Determining the compressed observation value
Spectrophotometry is usually used to measure fluoride concentrations. The sample values of the fluoride ion concentrations corresponding to different row vectors in the sampling matrix are measured according to the equation m = ρV, where m is the mass of the sampled ions, ρ is the measured mass concentration of the sampled ions, and V is the total volume of the sampled liquid. Multiplying each sample ion concentration by the corresponding volume, the fluoride ion mass sample vector
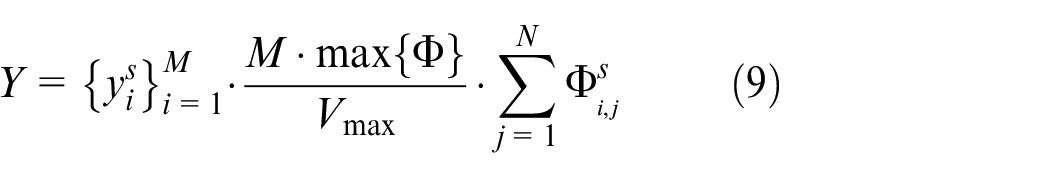
where
Constructing the overcomplete dictionary
In this paper, the discrete cosine transform (DCT) is selected as the sparse transformation of the concentration distribution of fluorine ions.
Concentration data reconstruction
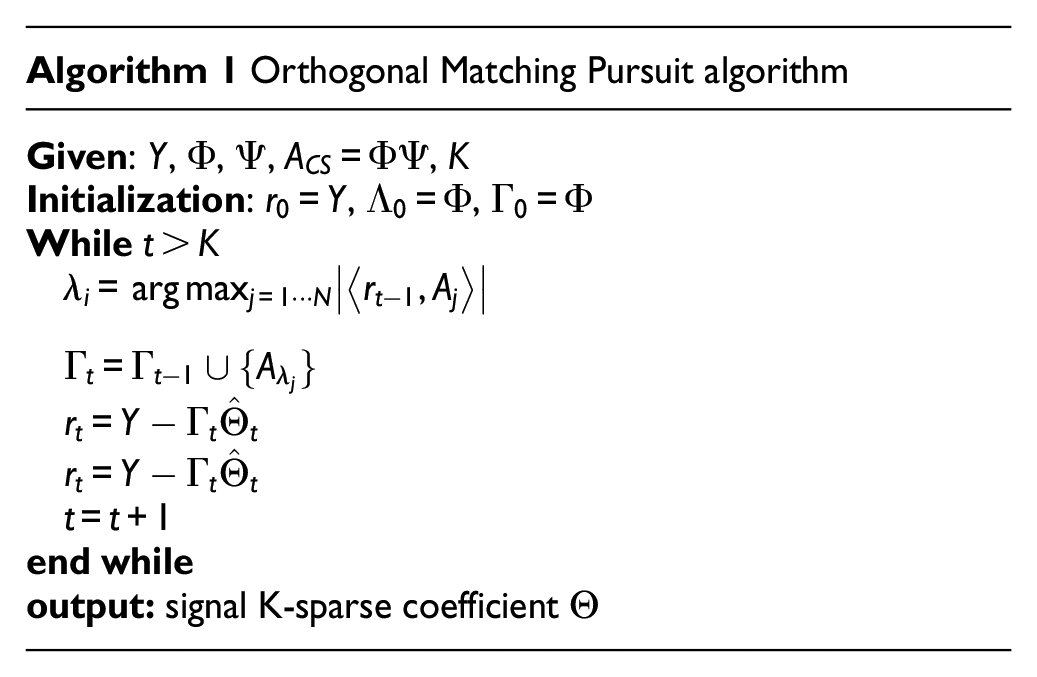
The two main types of recovery algorithms are the greedy algorithm 15 and the convex relaxation method; 16 both are efficient, and the greedy algorithm is used here. The BP, 17 MP, 18 Orthogonal Matching Pursuit (OMP), 19 and other recovery algorithms can be used to reconstruct the fluoride ion concentration distribution in batches of samples. Because the distribution data of batch fluoride ion concentrations can be sparse, OMP is used in this paper to solve the undetermined equations
where
Other sparse methods include wavelet transform, discrete Fourier transform, and so on.
The degree of sparsity
The OMP algorithm is used as follows:
Experiments and numerical results
The traditional point-by-point measurements were used to compare with the proposed method. To reconstruct the fluoride ion concentration signal, we used the BP, MP, and OMP algorithms based on normalized compressed sensing. The DCT was used as the sparse transform, and normalized Gaussian random observation matrix was used as the observation matrix. The sample rates were from 10% to 50% with an interval of 10%. MSE and R_d were used as the evaluation parameters to assess the performance of reconstruction algorithm.
MSE is the average sum of squares of the differences between the prediction data and the original data
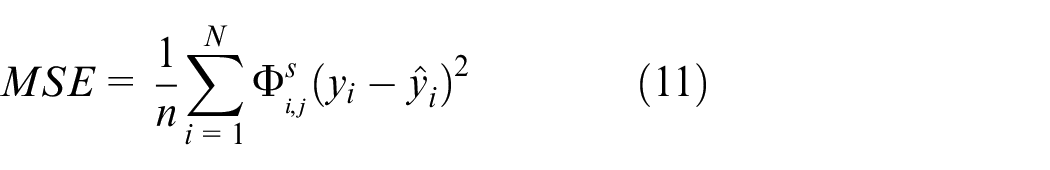
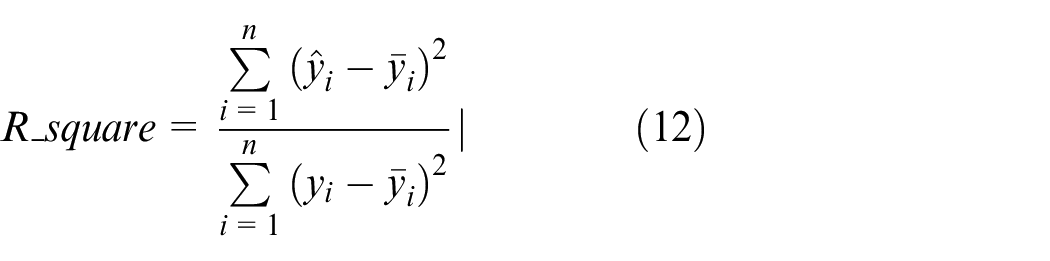
Let

As shown in Figure 3, Discrete points represent the original distribution of the solution concentration obtained by point-by-point measurements. The continuous line segment represents the result of signal reconstruction after sampling.
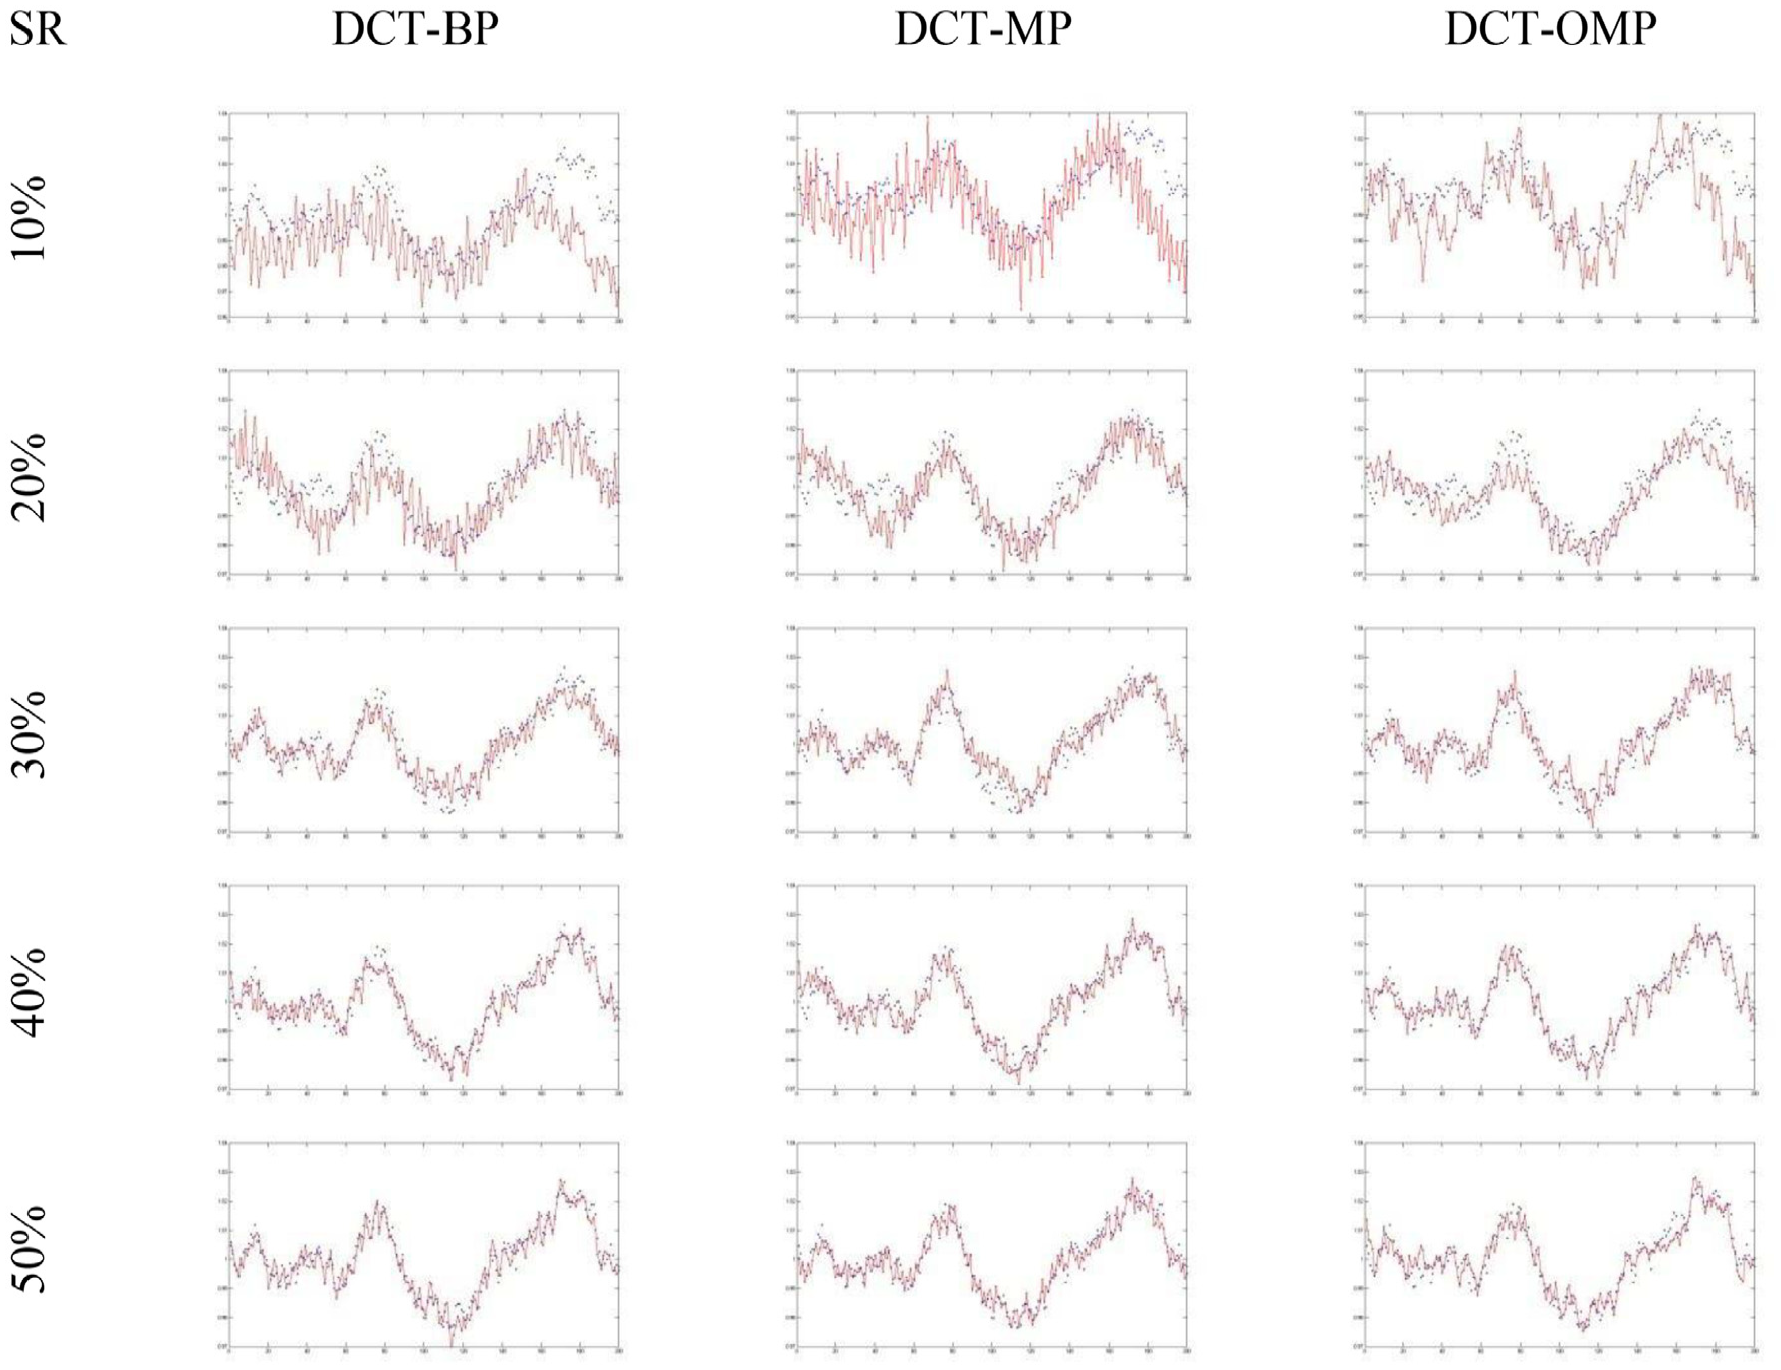
Signal reconstruction with BP, MP, and OMP.
When the sample number reaches 200 or more and the sample rate reaches 30% or less, the one-dimensional distribution of ion solution concentration can be recovered well. The larger the number of samples is, the higher the measurement accuracy is, and the smaller the number of measurements that are needed. The specific numerical results are shown in Table 1.
Comparison of MSE and R_d of three reconstruction methods at different sample rates.
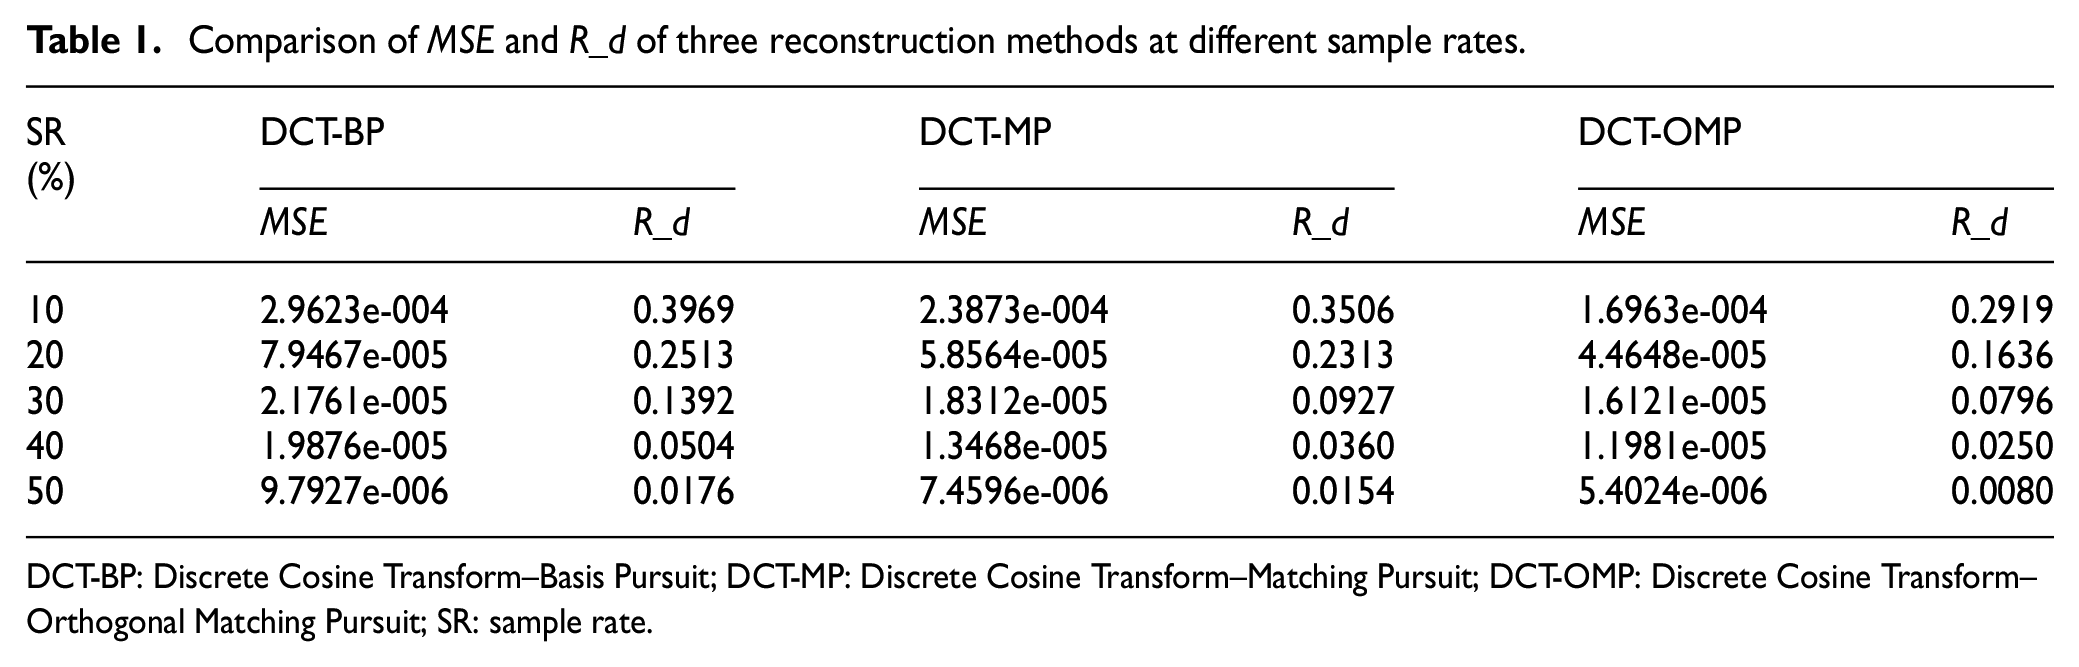
DCT-BP: Discrete Cosine Transform–Basis Pursuit; DCT-MP: Discrete Cosine Transform–Matching Pursuit; DCT-OMP: Discrete Cosine Transform–Orthogonal Matching Pursuit; SR: sample rate.
Conclusion
In this paper, we proposed a novel batch concentration measurement method based on normalized compressed sensing. The method used a normalized observation matrix and DCT-OMP algorithm for reconstruction. Compared to traditional point-by-point measurement methods, this method can greatly reduce the number of measurements needed while maintaining small reconstruction errors. It is especially suitable for a measurement field in which a single measurement is very time consuming or a test reagent is expensive.
Footnotes
Declaration of conflicting interests
The author(s) declared no potential conflicts of interest with respect to the research, authorship, and/or publication of this article.
Funding
The author(s) received no financial support for the research, authorship, and/or publication of this article.