
Abstract
Dockless bike-sharing systems provide parking anywhere feature and environment-friendly approach for commuter. It is booming all over the world. Different from dockless bike-sharing systems, for example, previous studies focus on rental mode and docking stations planning. Yet, due to the fact that human mobility patterns of temporal and geographic lead to bike imbalance problem, we modeled human mobility patterns, predicted bike usage, and optimized management of the bike-sharing service. First, we proposed adaptive Geohash-grid clustering to classify bike flow patterns. For simplicity and rapid modeling, we defined three queuing models: over-demand, self-balance, and over-supply. Second, we improved adaptive Geohash-grid clustering-support vector machine algorithm to recognize self-balance pattern. Third, based on the result of adaptive Geohash-grid clustering-support vector machine, we proposed Markov state prediction model and Poisson mixture model expectation-maximization algorithm. Based on data set from Mobike and OFO, we conduct experiments to evaluate models. Results show that our models offer better prediction and optimization performance.
Keywords
Introduction
With the development of technology, dockless bike-sharing systems (BSSs) have been solved the last mile problem in intelligent city life. 1 BSSs are booming all over the world, especially in large cities. In the traditional self-service mode, users have to rent or return bike sharing at fixed stations. Based on mobile Internet, global positioning system (GPS), and location-based service (LBS), BSSs allow users to start or end service in community curbside, subway stations, and central business district (CBD) parking zone.
Since about 2015, the central problems for municipal administration to solve include acquiring space to park the bikes and achieve efficient use of the bikes. According to bike sharing park-anywhere feature, the core of the issue is focused on two factors:
Attribute to the human mobility patterns and spatiotemporal factor, the imbalance problem is difficult to model and predict in dockless BSS.
The phenomenon of “bike-sharing graveyard” takes place anywhere, for example, curbsides, which blocks the path of pedestrian.
This is a supply and demand planning problem that changes with temporal and geographic. 2 The truck-based 3 and the user-based approaches are two baseline approaches to solve the bike imbalance issue.
However, the truck recycling approach depends on demand prediction and manual intervention.
Motivation and incitement
In dockless BSSs, bikes are widely used in our daily life. In recent study, many previous methods focus on demand prediction in dock BSSs. The researcher had implemented different strategies to address the occurrence of rebalance, such as sending cargo trucks to relocation bikes before rush hours. Due to lack of supervision and control strategy, the BSS is toward extreme phenomenon. That is too many illegal parking at curbside, bus station, community, and so on. The imbalanced usage pattern of bikes causes over-demand and over-supply issues not only to commuter but also to cities. Motivated by the aforementioned challenge, we examine three methods: station-centric model with global features, 4 demand prediction,5,6 and free-floating bike-sharing model. 7
Based on the limitations of approach, our prediction model by adaptive Geohash-grid clustering (AGC) technology to preprocess parking coordinates data. We describe the stage of imbalance changed in different Geohash grids. Then, we propose a dockless sharing bike demand modeling: over-demand model, over-supply model, and self-balance model. Expectation-maximization (EM) algorithm is derived to learn the parameters of Poisson mixture model (PMM). According to queuing theory, we modeled bike usage patterns and human mobility patterns, predicted demand, and optimized the parameters.
We also showed that the prediction and optimization algorithms improve convergence and achieve a better performance compared with existing algorithms.
Literature review
This section summarizes research work on modeling, demand prediction, and parameter optimization. Mathematical modeling is the first step in solving prediction and optimization problems. From the viewpoint of BSS designers, route determination and demand prediction are relocated. Parameter value is a critical decision indicator for managers and controllers to optimize BSS. In our literature review, we concentrate on spatiotemporal, demand, and rebalance problems.
There are many researchers focusing on BSS modeling. Mathematical modeling 8 have been used in recent work such as planning model, 9 probability model, 10 clustering algorithms, 11 loss function, 3 and so on. Especially, the auto-regressive integrated moving average models 12 and auto-regressive moving average (ARMA) 13 models are widely used in modeling of human mobility patterns. According to BSS stations usage profile, Sayarshad et al. 9 proposed a multi-periodic optimization formulation for planning problems. Crisostomi et al. 10 propose a Markov chain model. In the BSS, Markov decision process was a tool to solve commuter mobility patterns. Based on the discriminative functional mixture (DFM) model, Bouveyron et al. 11 proposed FunFEM methodology. To minimize the total cost, Hu and Liu 3 proposed allocation model to solve bike rental stations and truck dispatching depot problems. According to travel patterns, MY Du et al. 14 proposed a multinomial logit (MNL) model. In free-floating bike-sharing model of MNL consists of three categories, such as origin to destination pattern (ODP), travel cycle pattern (TCP), and transfer pattern (TP).
In order to redistribute the number of bikes, spatiotemporal analysis method is widely used in prediction algorithm. It is help to analyze a strategic design model for BSS. According to temporal and spatial factors, Yang and Hu 15 proposed a spatiotemporal bicycle mobility model. The temporal and geographic mobility patterns are applied to demand prediction. 16 Based on spatiotemporal analysis, Froehlich et al. 17 proposed clustering technique in Barcelona’s BSSs.
From the viewpoint of bike-sharing operators, demand prediction is a critical performance indicator. We can predict the number of rental bikes according to cluster algorithm. Ciancia et al. 2 propose station occupancy predictor. This is a data mining framework to predict the occupancy levels of the stations by Bayesian and associative classifiers. Based on station usage, long-term stability, and short-term volatility, Yao et al. 18 proposed three-step demand estimation model. However, tensor factorization is widely used in routing prediction of BSS. YX Li et al. 19 proposed a hierarchical prediction model by tensor factorization to extract latent user activity patterns. Based on clustering algorithm to forecast bikes’ and docks’ availability for each station, 20 Gaussian mixture model (GMM)21,22 and PMM 23 are common prediction schemes. LB Chen et al. 24 proposed dynamic cluster-based framework for demand prediction.
Optimization of resource allocation is necessary to improve system performance (e.g. bike usage patterns and rebalancing problem). Based on BSS optimization configuration, Ling et al. 25 developed a novel deep reinforcement learning algorithm called hierarchical reinforcement pricing (HRP) for optimized rebalance problem in BSS. Based on optimal facility allocation and pool sizing for BSSs,26–28 Guoming and Lukasz 29 propose two bikeshare pool sizing techniques which guarantee bike availability with high probability. Based on resource of bike-sharing optimization, similar problems are single vehicle one commodity capacitated pickup and delivery problem (SVOCPDP), 30 one commodity pickup and delivery traveling salesman problem (1PDTSP), 31 Swapping Problem, 32 and split delivery problem. 33 These optimization algorithms above mentioned aim to find a minimum cost route for users to renting and returning bicycles. Mostly, split delivery problem and branch-and-cut algorithm are solved through a tabu search algorithm. 33 The SVOCPDP gathers aspects from both the Swapping Problem 32 and the 1PDTSP. 31 The objective of optimization is to find the costless function by heuristics algorithm. In the literature, artificial immune systems support vector machine (AIS-SVM), 34 artificial neural network (ANN)-SVM, 35 and particle swarm optimization methods have been widely applied in optimization and classification problems.
Currently, some papers adopt Monte Carlo simulation to predict the demand of cluster. 29 Simulation results are different from real results. In our review of the related literature, there is little research available regarding modeling and predicting user behaviors in dockless systems. 2 In this paper, we focus on predicting imbalance stage and optimized parameter in dockless BSSs. Based on the real-world bike-sharing data set from Beijing city, we combined Geohash coding and queuing theory approaches to improve the SVM and to optimize the parameters of the EM algorithm to adjust the weight value in PMM.
Contribution and paper organization
As is evident from the review, there is abundant research regarding BSSs. To tackle our problem, we carefully design solutions to overcome the above drawbacks of literature. Based on geographic-grid clustering, we proposed AGC approach preprocessing check-in/out from parking data set. Starting from parking anywhere and mobility point, we research on improved SVM (ISVM) classification and optimized EM parameter in queuing models.
Our main contributions are as follows:
For bike flow pattern parking-anywhere problem, we formally define the state of over-demand, over-supply, and self-balance by processing coordinate data, transition state modeling by queuing theory.
For demand prediction, we improved bi-classification algorithm to solve three-stage classification problem. Based on Markov state prediction (MSP), we propose AGC-SVM cope with dynamic demand.
For rebalance systems, we proposed PMM-EM model by PMM-EM algorithm.
The optimized parameters πL and λL guarantee high probability of bike system running.
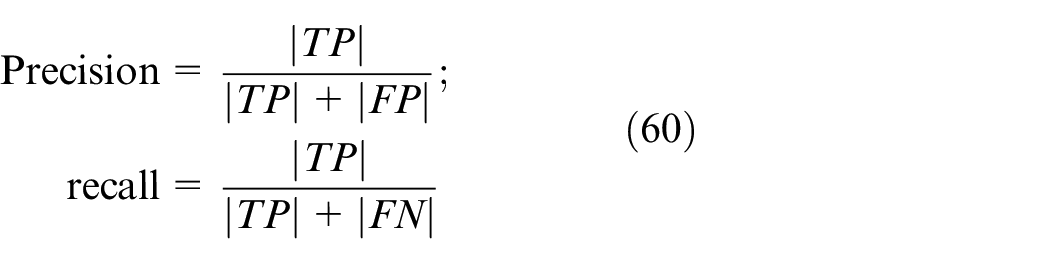
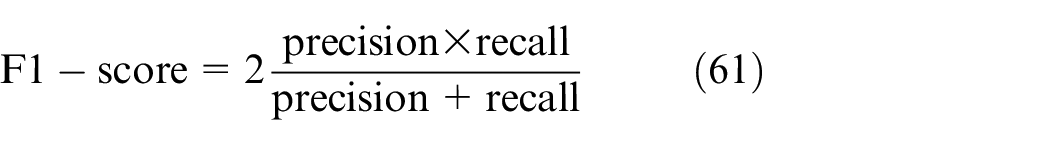
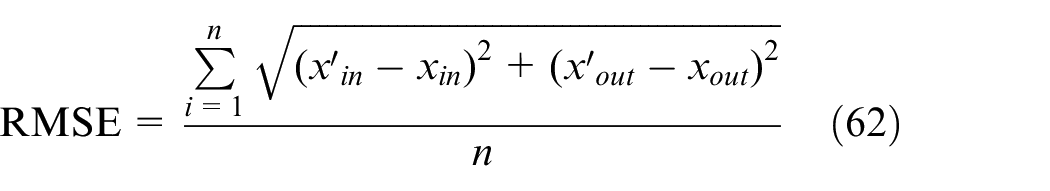
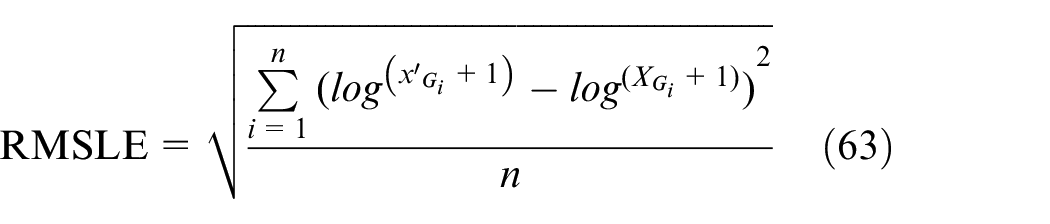
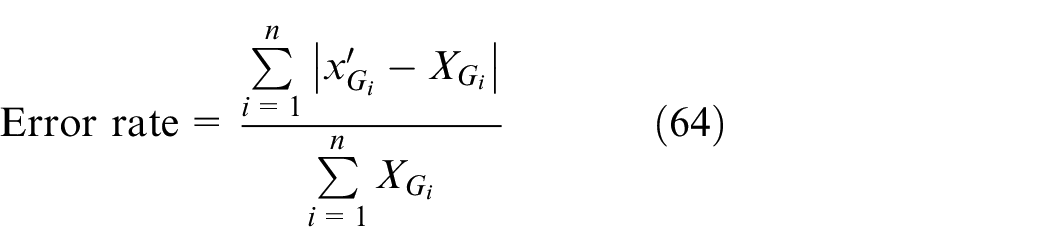
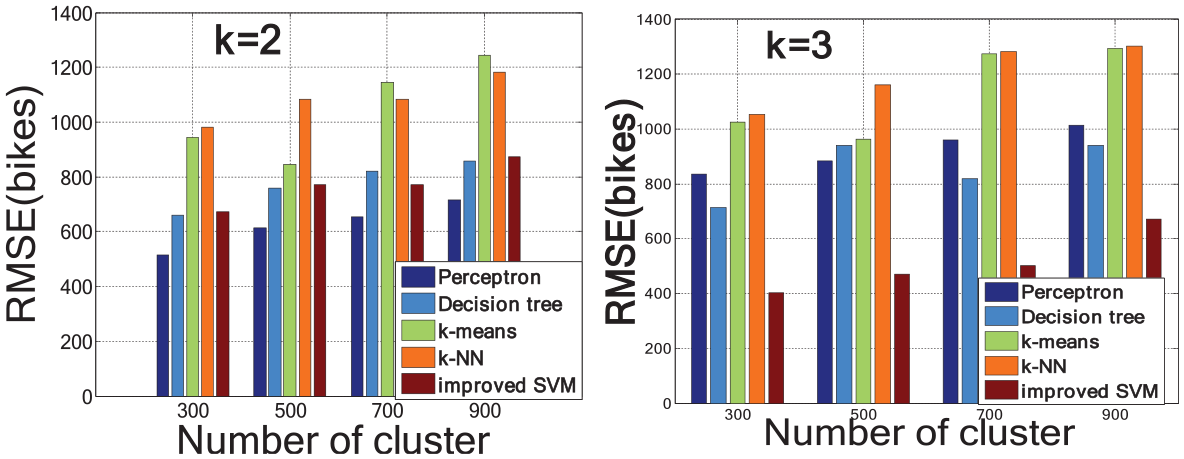
In order to validate our methods, we use real-world data under eight baseline methods, such as perceptron, decision tree, gradient boosting regression tree (GBRT), k-nearest neighbor (k-NN), k-means, ARMA, Kalman filter, and hidden Markov model (HMM). We adopt measure accuracy of classification and regression algorithm through root mean squared error (RMSE), root mean squared logarithmic error (RMSLE), error rate, precision, recall, and F1 to evaluate that our models outperform significantly.
This paper is organized as follows: in section “Overview,” we definitions our models, in subsection “framework,” we discussed bike flow pattern models in BSS. In section “Methodology,” we defined AGC to solve check-in/out dynamic demand. Based on three-stage classification problem, we improved SVM algorithm. We proposed PMM-EM model for imbalance stage prediction and rebalance parameter optimization. In section “Experiments,” we present experimental results to validate our method and discuss the merits and potential limitations of approaches, which give us guidance on when to use which model in practice. In section “Conclusion and future works,” we outline future research directions.
Overview
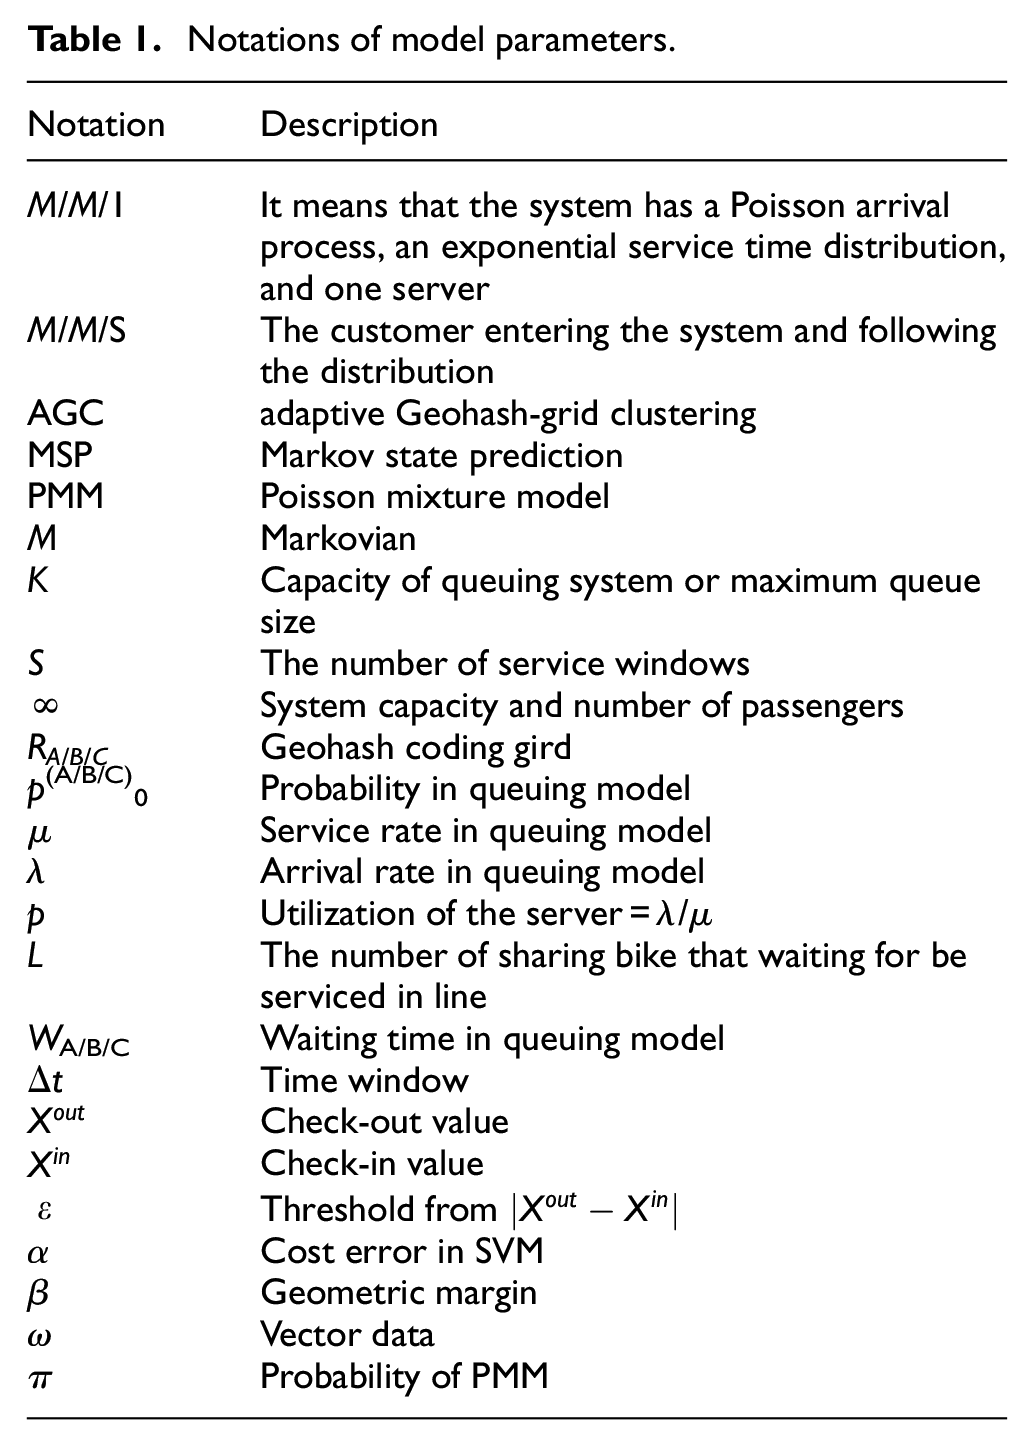
This section defines the notations (see Table 1) and terminologies used in this paper.
Notations of model parameters.
Preliminary and problem definition
Then, we define the terms used in this paper as follows.
Definition 1: Geohash coding
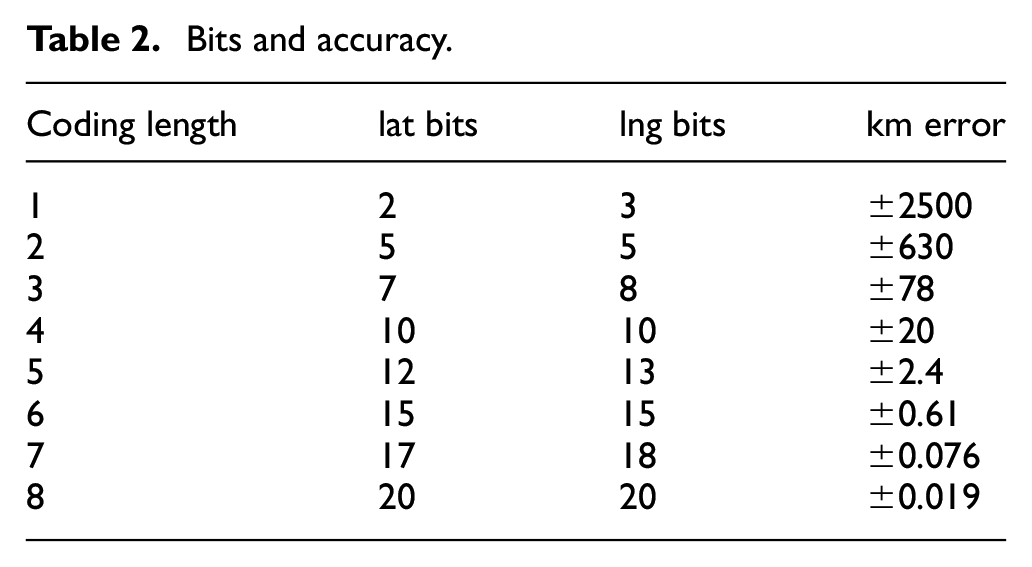
Geohash is a public domain geocode system invented in 2008 by Gustavo Niemeyer. The Geohash encoding generated by latitude is stored in List 1, whereas that generated by longitude is stored in List 2. Lists 1 and 2 encodings are merged. The odd number positions denote the latitude, whereas the even number positions indicate the longitude. A total of 32 characters, namely, 0−9 and b−z (remove a, i, l, o), are used for the base 32 encoding, that is, List 3. The purpose of privacy protection is to publish different encoding lengths. For example, the 6-bit code can represent a range of approximately 0.34 km2. A length of 7 bit can represent the range of 76 × 76 m2, as shown in Table 2.
Bits and accuracy.
Definition 2: Geohash grid
Geospatial index technique is a search method that efficiently deals with the roads, streets, and districts data. The grid index uses a hash data structure. Each grid corresponds to a bucket of the hash map (Figure 5).
Definition 3: bike flow patterns of check-in/out
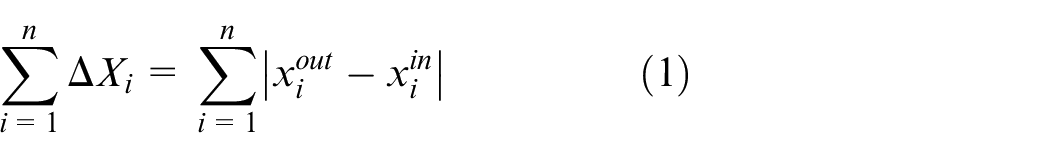
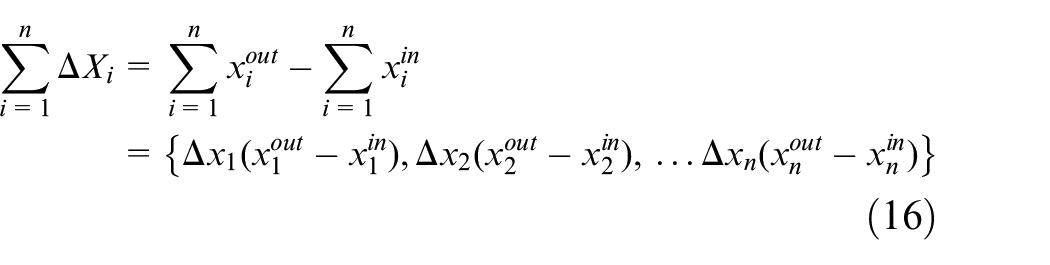
In a given time window, [t, t + Δt] is defined as a tuple XΔt = {Xin, Xout}, where
Definition 4: grid state
Sharing bikes is used by commuters who pick it up anywhere and anytime. According to statistic consequent from data set
Definition 5: queuing theory
Queuing theory is the mathematical study of waiting lines or queues. In this paper, we explore queuing theory by modeling and analyzing the number of sharing bikes for service, waiting times, and so on. In Geohash gird, sharing bikes are considered customers and parking be defined as entering the queuing system. Queue represents customers or sharing bikes waiting for service. We propose three queuing models, described by Kendall’s notation (the standard system used to describe and classify a queuing node). For example: M/M/1/∞ describes over-demand stage, M/M/1/K describes over-supply stage, and M/M/S/K describes self-balance stage.
Definition 6: time window Δt
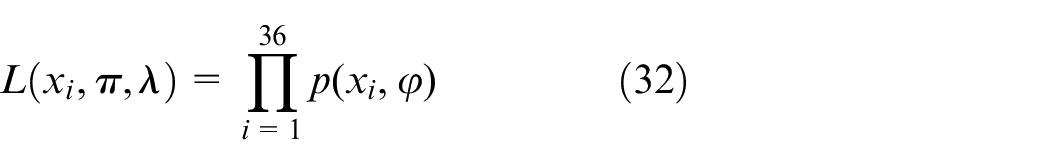
In dynamic patterns of bike sharing, we researched the range of time 6:00 a.m–24:00 p.m–01:00 a.m. It was divided into 36Δt (30 min per section) in training data set.
Framework
Based on bike flow pattern, we simulate the three classification results by queuing theory. Based on the fact that bike pattern of return and rental obeys Poisson process, we define three states convert to each other by bikes flow, as shown in Figure 1.
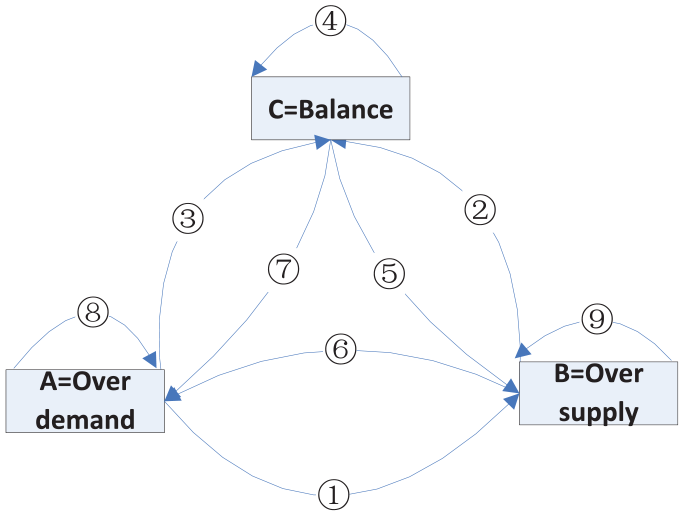
Imbalance and rebalance dynamic model.
Label A: over-demand stage
This type of state in Geohash grid is named RA. For example, bus station region, office building. Label RA describes the model in over-demand stage. This stage means a little sharing bikes arriving at the parking area in a period of time, shown in the following equation

The capacity is ∞ in the sharing bike queuing system. The time interval of commuters arriving at RA grid follows negative exponential distribution. We proposed over-demand RA stage by M/M/1/∞ queuing theory. The working of the model is shown in Figure 2.
Over-demand stage modeling.
Figure 2 shows how to model works.
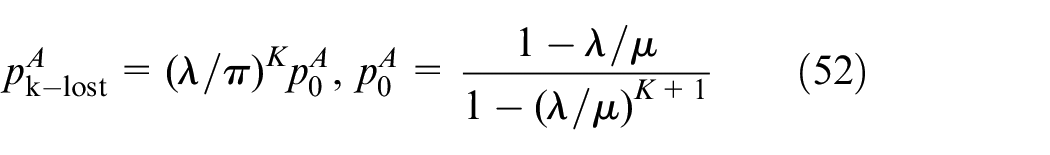
In the model, the idle probability is
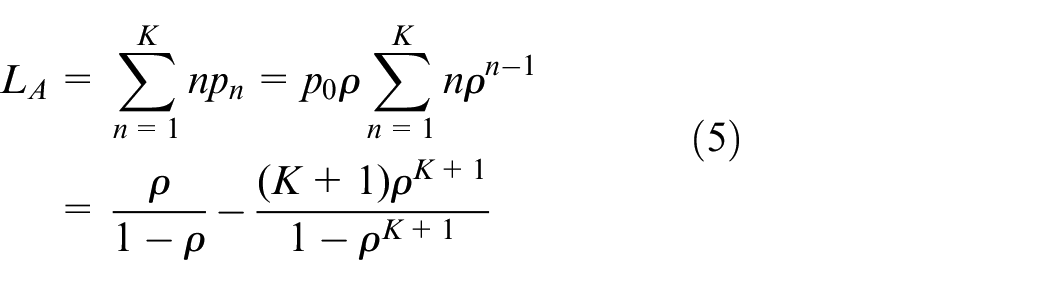
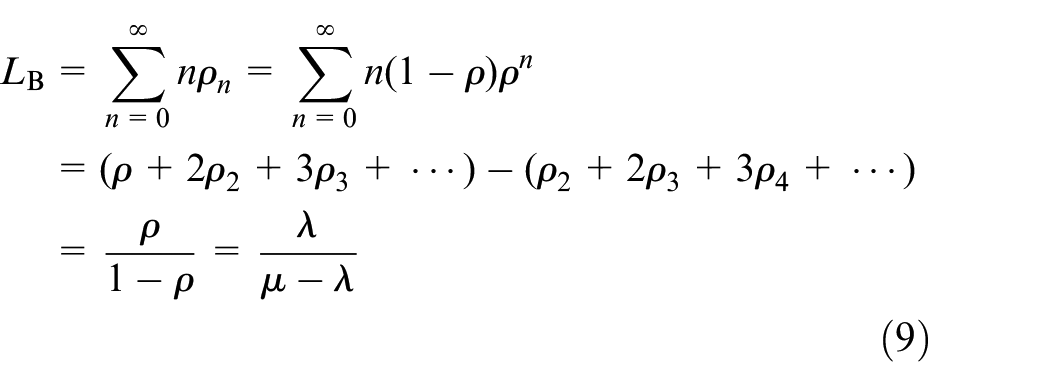
When K ≠ 1 and K ≠ 0. The number of customers waiting in line for bikes is obtained as
Shown as (8): It means the systems are kept at over-demand stage.
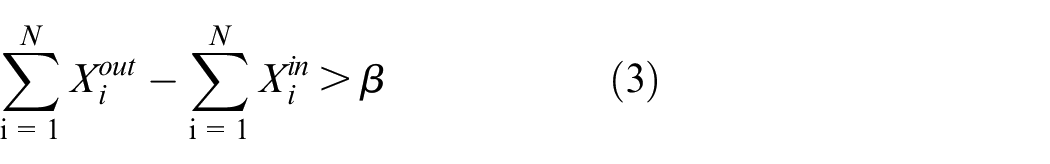
Shown as (3): Following the changed bikes’ flow pattern, arrow (3) means
Shown as (1): Following the growth of commuter terminated service, arrow (1) means
Label B: Over-supply stage
Label RB describes over-supply stage. This state means a lot of sharing bikes arriving at this region

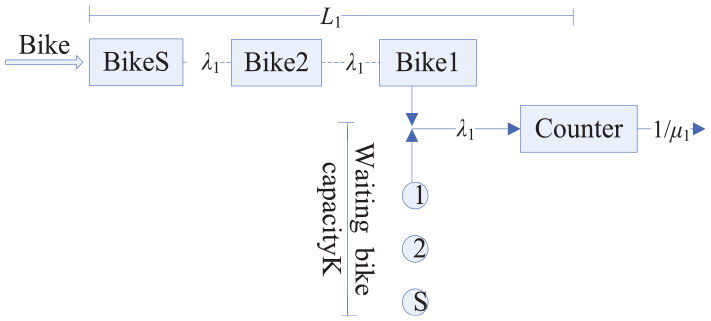
For example, in subway station region, we named over-supply stage as RB. The capacity of the RB is K. we proposed over-supply RB stage by M/M/1/K queuing theory, as shown in Figure 3.
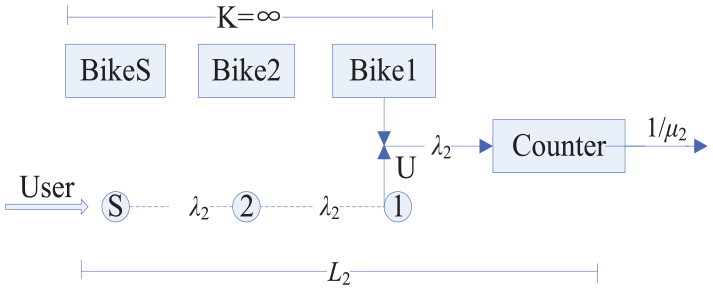
Over-supply stage modeling.
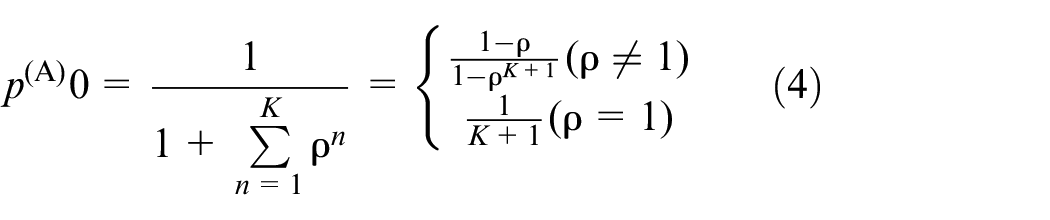
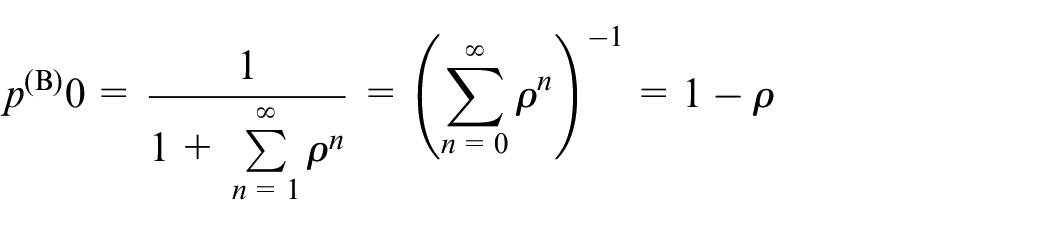
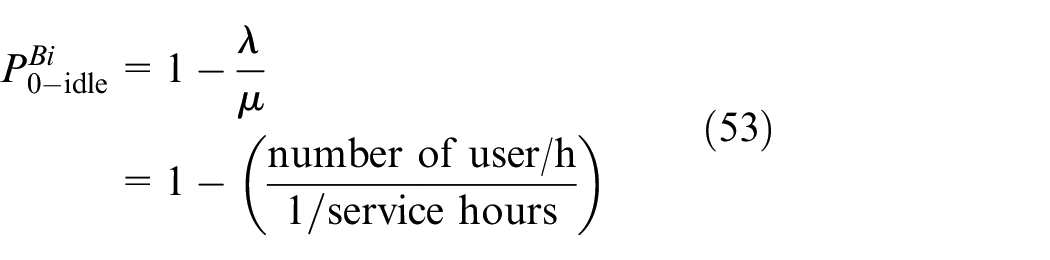
In this model, the idle probability of sharing bikes is

Shown as (9):It means that the systems are kept at over-supply stage.
Shown as (2): Following the changed bikes’ flow pattern, arrow (2) means
Shown as (6): Following the growth of commuter, arrow (6) means
Label C: Self-balance stage
RC stage is self-balance. It means

Different from defined RA and RB before, this queuing system have several service centers. The capacity of the RC stage is K. We named self-balance stage as RC stage by M/M/S/K queuing theory. In self-balance stage, the gird of RC has high user density and high demand for sharing bikes. The working of the model is shown in Figure 4.
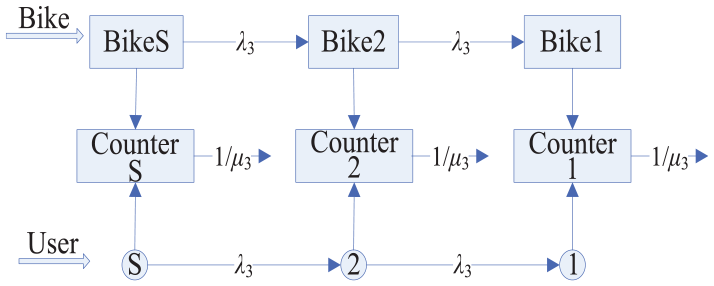
Self-balance stage modeling.
In this model, the number of supplemented shared bikes is
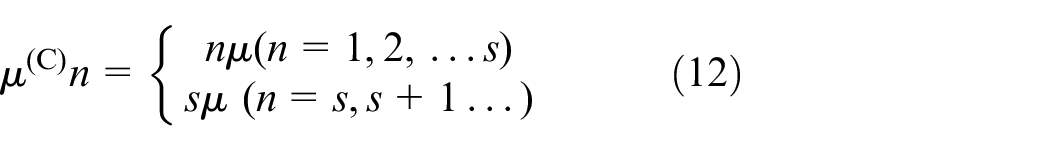
The probability of n bikes in the platform is
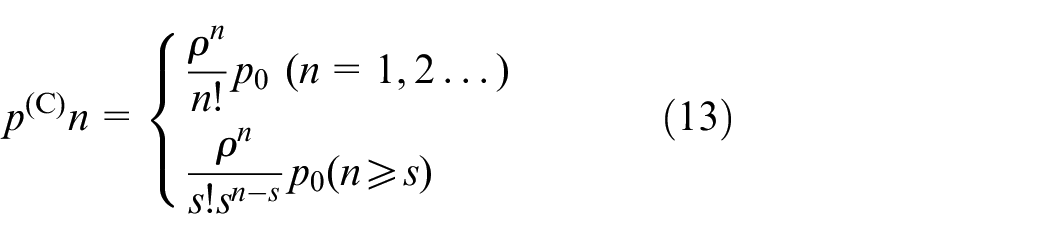
The idle probability of sharing bikes is
The mean number of waiting users is denoted by
Shown as (4): It means the systems are kept at self-balance stage.
Shown as (7): Following the changed bikes’ flow pattern, arrow (7) means
Shown as (5): Following the growth of commuter, arrow (5) means
Methodology
We formulate bike flow pattern as a Poisson process and modeled by queuing system. Based on predicted imbalance stage and optimized rebalance parameters, we improved AGC and AGC-SVM approaches. We proposed PMM-EM model in which key components of problems are described in the following subsection.
AGC
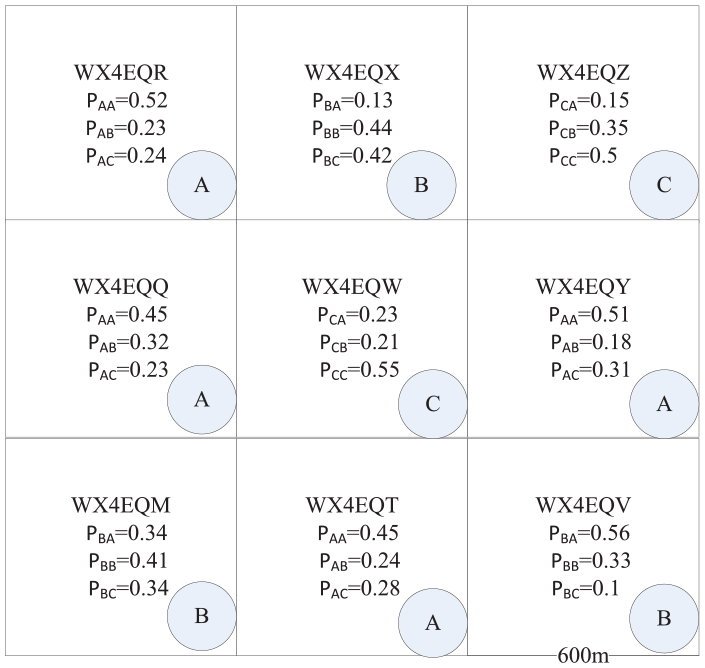
Geohash coding means longitude and latitude point data transform algorithm. It is a hierarchical spatial data structure that subdivides space into buckets with a grid shape. In order to find the statistic of bike, we proposed AGC. First of all, we use the Geohash coding algorithm to process parking data. Latitude and longitude coordinate data are transformed into grid layers on the map, as shown in Figure 5. For Geohash code tagging, we statistics
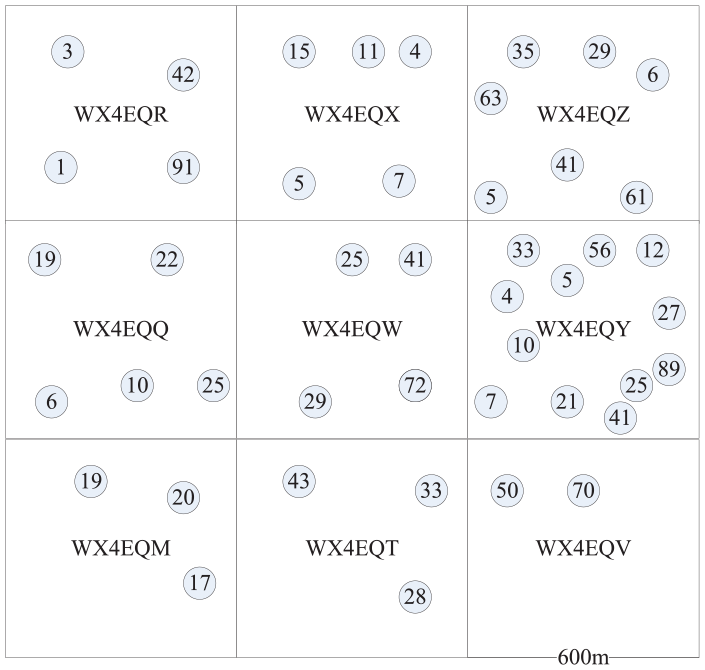
Adaptive Geohash-grid clustering.
A cluster consists of all density of parking points, for example, WX4EQY tagging over-supply stage and WX4EQV tagging over-demand stage.
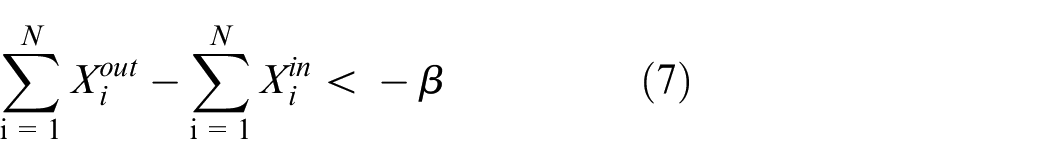
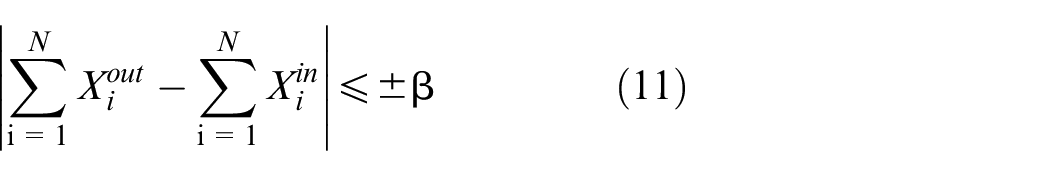
With the same Geohash coding length of the prefix letter, we evaluated the statistical result by threshold parameters β and
According to the number of bikes, we adjust Geohash-grid size by choosing suitable prefix lengths. Different periods have different usage stages in the same Geohash grid. The adaptive Geohash grid not only predicted imbalance stage but also protect privacy. In next subsection, we introduce stage label classification by ISVM algorithm.
ISVM label classification
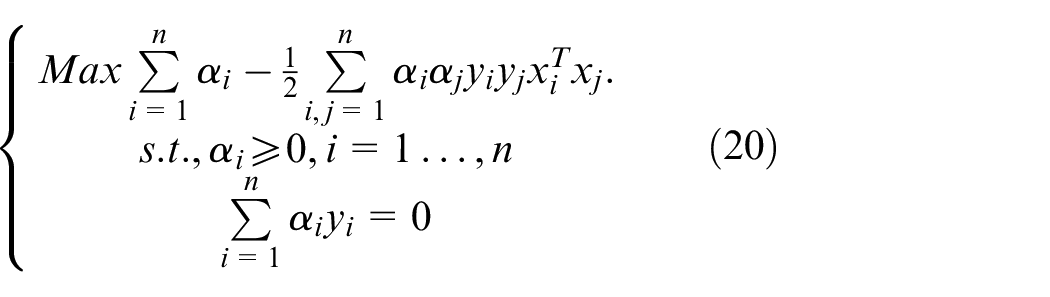
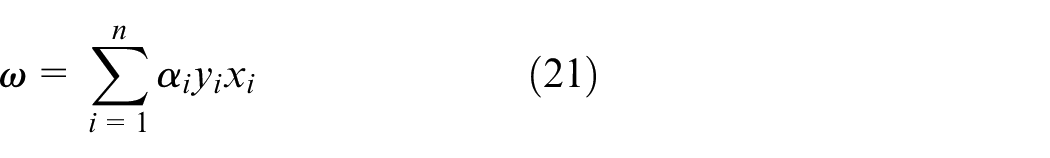
In this subsection, we describe how to create stage label classification in training data. To predict three states of Geohash-grid bike flow pattern, we adopt three label stages in queuing models. Because of self-balance, it is a fuzzy stage. Classification of bike flow pattern is convex quadratic programming. Support vector machine is good at bi-classification problem, as the method can significantly reduce the need for labeled training instances. Intuitively, a good separation is achieved by hyperplane that has the largest distance to the nearest point in any labels classification from training data. The details of the ISVM classification algorithm are illustrated as follow:
Hyperplane of state-label classification
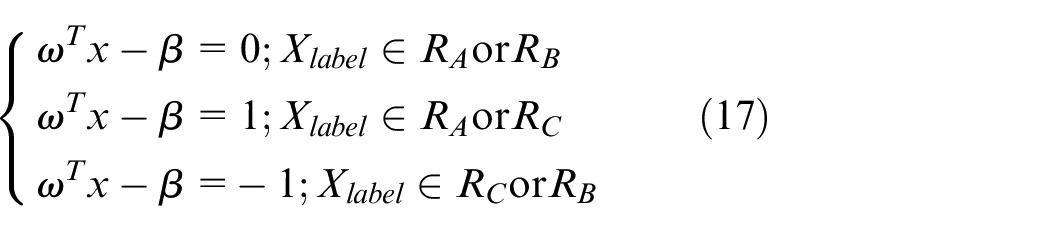
Geometric margin
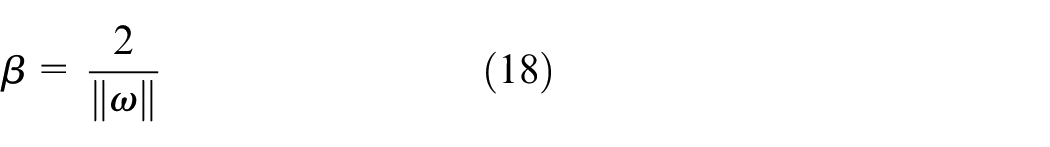
Because of fuzzy stage boundaries and label classification, we improved SVM algorithm. This solution can be distinguished as “over-demand and self-balance” and “over-supply and self-rebalance” stages. The fundamental idea behind SVM is to choose the hyperplane with the maximum margin β, that is, the optimal canonical hyperplane. The geometric margin problem has become a convex minimization problem, as shown in Figure 6. We can obtain an equivalent formulation of minimizing
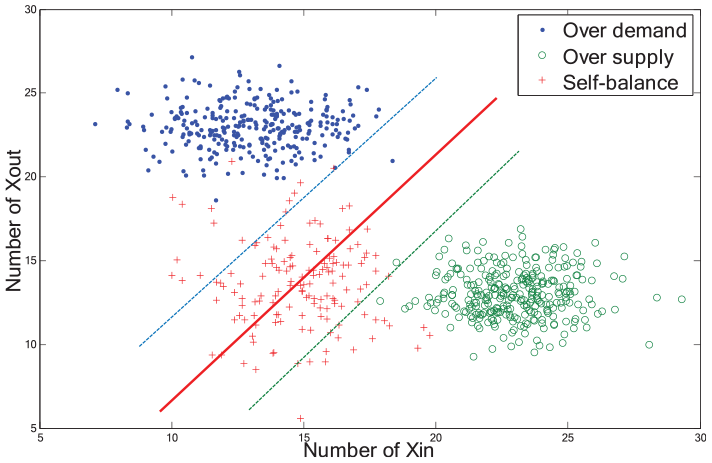
Fuzzy boundaries problem.
To do this, one needs to find the weight vector ω and the bias β that yield the maximum margin among all possible separating hyperplanes, the state is come from the hyperplane that maximizes
Predicted imbalance stage
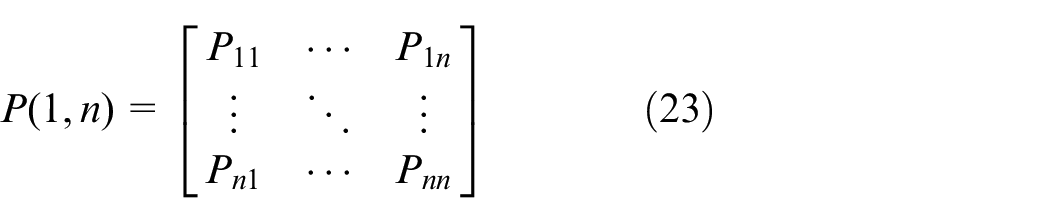
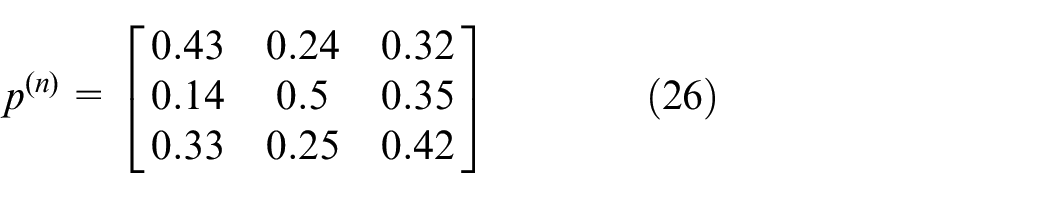
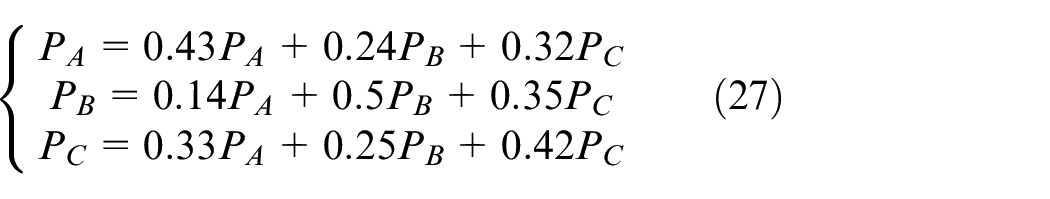
Based on Markov non-aftereffect and Bayes conditional probability formula, Markov transition matrix is a square matrix describing the probabilities of moving from one state to another in a dynamic system. During the whole day, we divide up several time windows Δt, Markov transient evolution is


For simplification and calculation of modeling, we named AGC-MSP. Different lengths of Geohash coding have different bike flow patterns toward AGC. AGC-MSP is a soft clustering method. It was used to predict imbalance stage and deployed bikes in advance. In application, these two scenarios for bike flow pattern prediction can be used complementarily as temporary stage scenarios and permanent state scenarios. We obtain the number of bike that come in and come out from Geohash grid. We process training data set that is recorded in the parking.
Markov state transition rate matrix formula
Temporary stage scenarios
To answer the first question “which Geohash grid is imbalance state,” we first identified bikes’ flow check-out and check-in for each AGC. According to previous studies pointing out state label classification by threshold parameter β, we defined state table of transition matrix, as shown in Table 3.
Bikes and states data set in day 1.
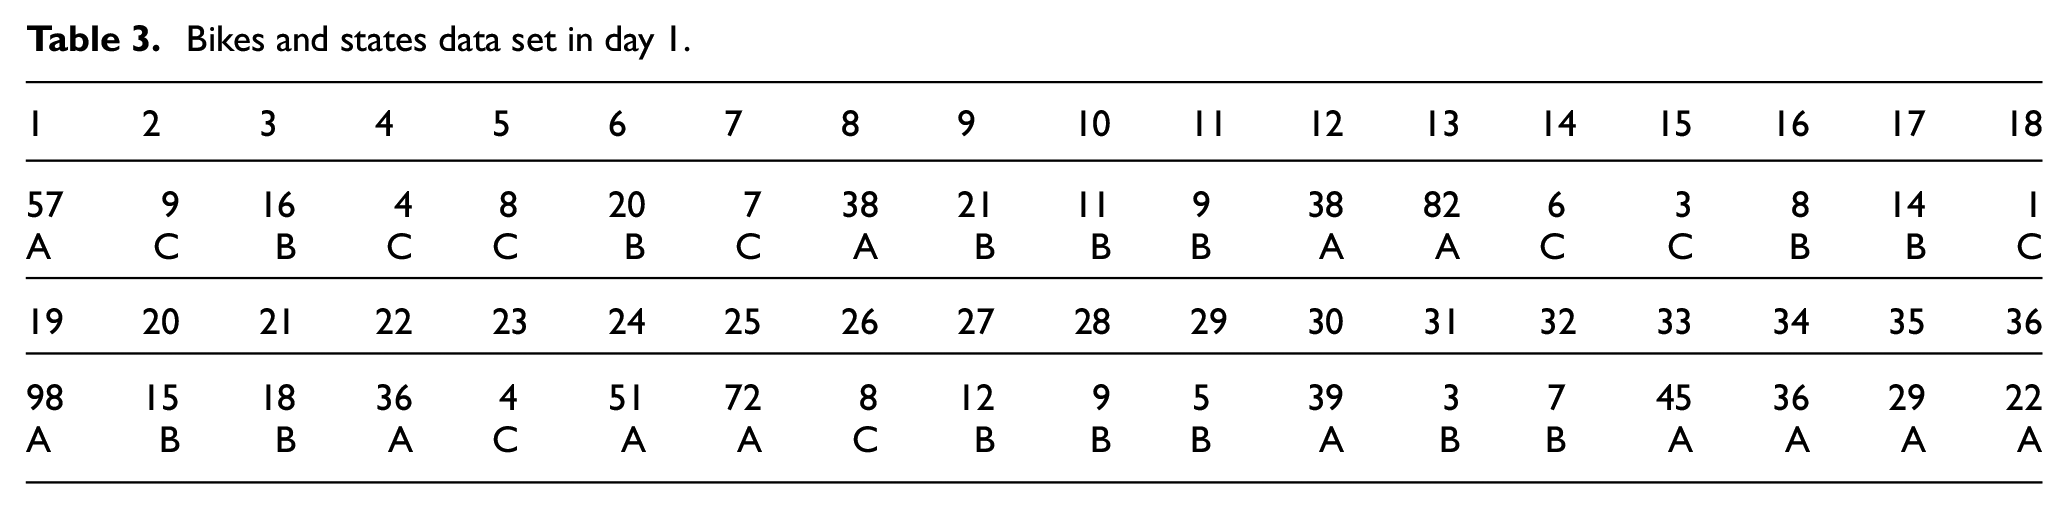
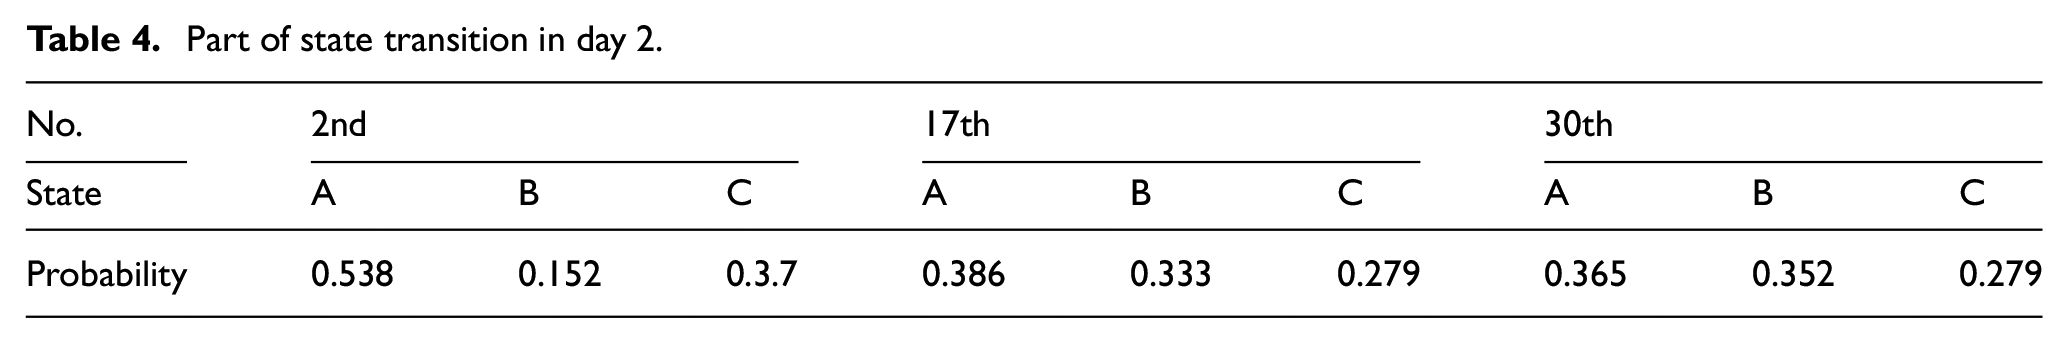
The RA, RB, or RC state had been predicted by the Markov predicted approach. In practice, we get historical data {57, 9, –16, 4, 8, –20, 7, 38, –21, –11, –9, 38, 82, 6, 3, –8, –14, 1, 98, –15, –18, 36, 4, 51, 72, 8, –12, –9, –5, 39, –3, –7, 45, 36, 29, 22} in WX4G8C9V Geohash-gird. State labels are shown in Tables 3 and 4.
Part of state transition in day 2.
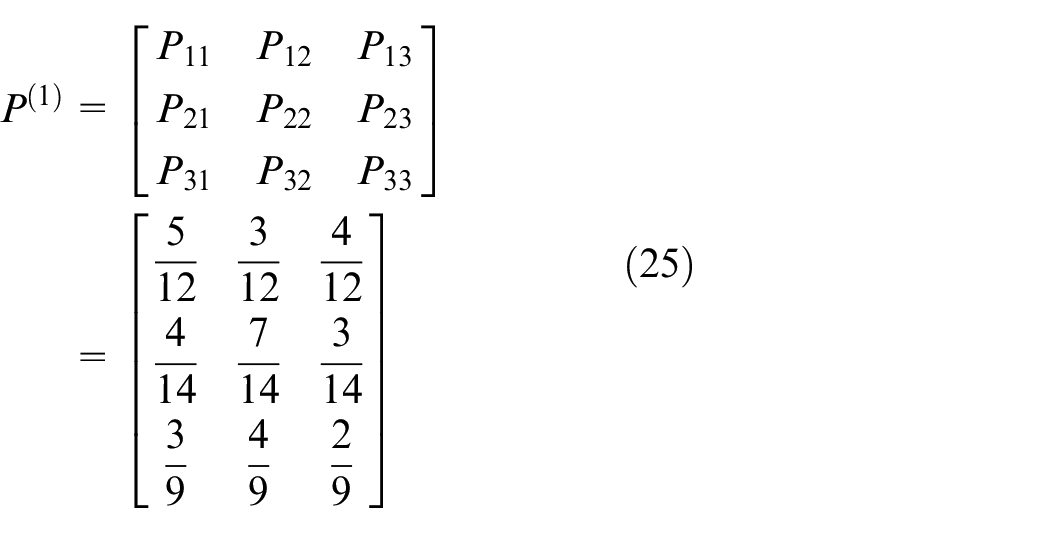
Transient evolution is
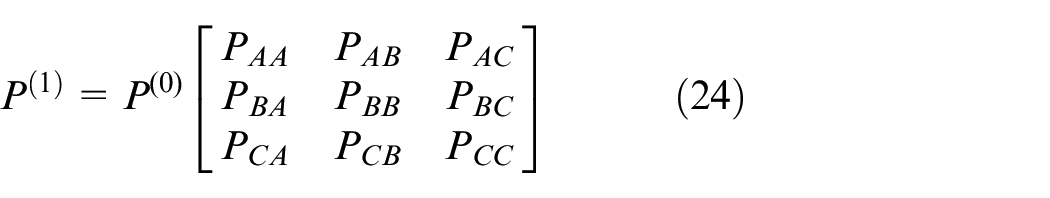
One step probability transfer matrix
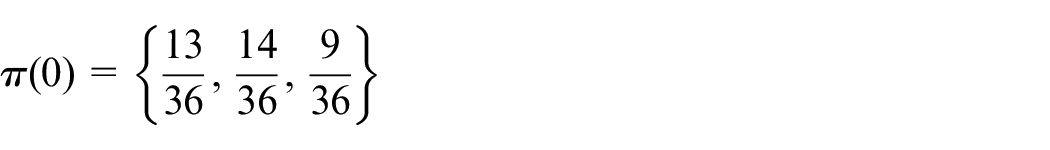
Probability of initial state-space is
Stable state scenarios
So far we have obtained the grid of state in different time periods. According to Markov state transition matrix, the grid of state is transferred to each other in same grid. The stable grid of state is determined after several iterations. For example, the coordinates are 116.402843 and 39.999375, and trans-form to Geohash coding is WX4G8C9V (19 × 19 m2), as shown in Figure 7.
Markov state transition rate matrix is

Grid state prediction.
We propose a prediction method to determine the final gird of state by Markov state transition matrix. Judging from state of Geohash grid, λA and β are the important threshold parameters. λ is the bike flow pattern with regard to data sets Xin and Xout and β is the geometric margin in SVM algorithm.
Rebalance parameter optimization
The bike flow pattern can be predicted by multiple times of Markov chain iteration in Geohash grid. In grid of RA state, the strategy is allocation bike in the morning. In grid of RB state, the strategy was recycled bike at night. Depending on operational experience and statistical summary, the deployed and recycled problems are uncertain.
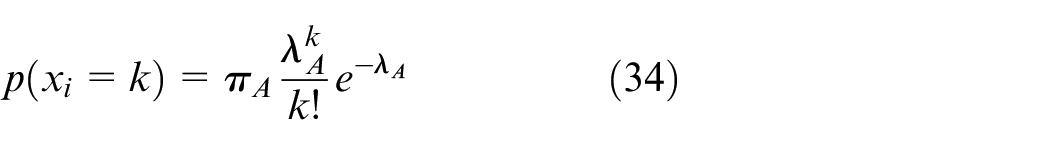
Because of sharing the mobility of bikes, the three states of the grid alternate every day. To answer the second questions “how to cope with rebalance issue,” we proposed PMM-EM model. In different time, the grid state obeys Poisson distribution with different parameters. Therefore, how to optimize resource of deployed and recycled is rebalance issue. From observed parking data set, we can hardly point out the distribution exactly. Throughout the day, we define that the bike usage obeys Poisson mixed distribution. So that, the probability of sample Xi is
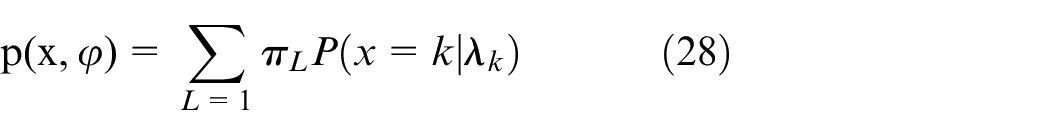
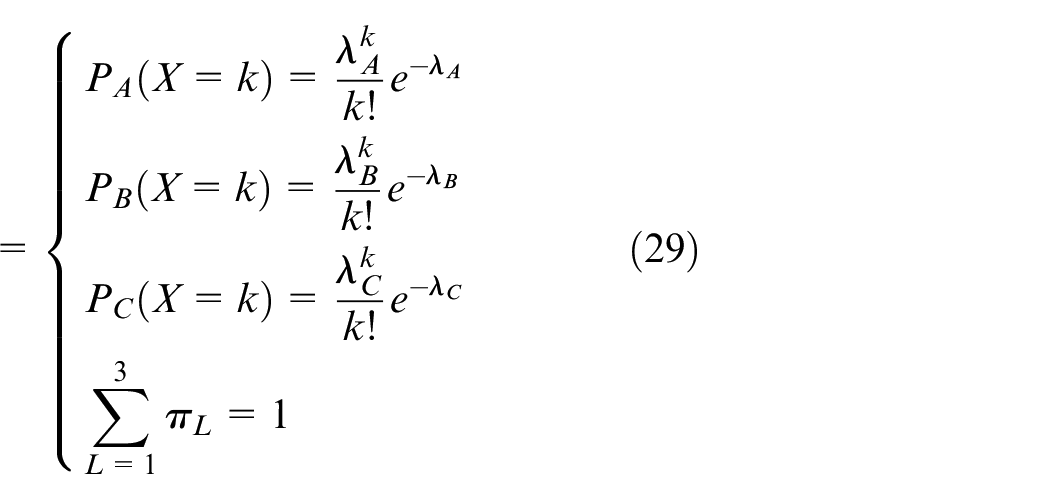

Among them,
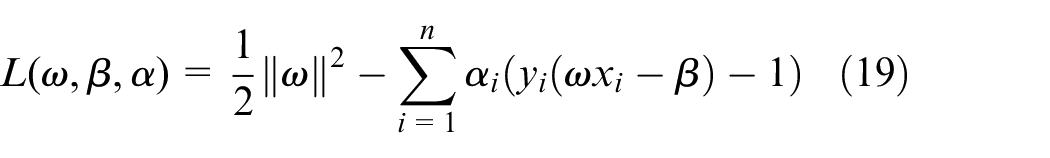
Objectives function
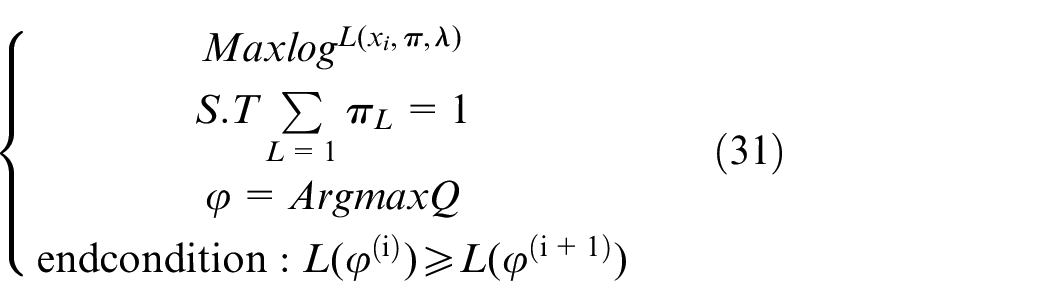
In Poisson mixture distribution, estimated variables π and λ is
When parameter πA and λA in Poisson distribution
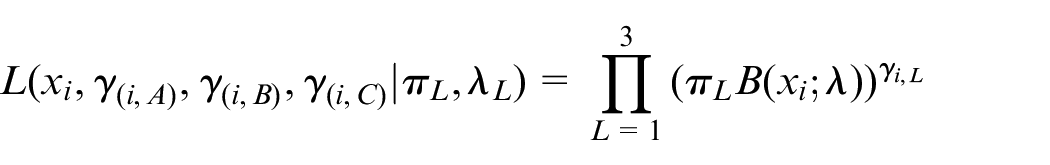
Likelihood function
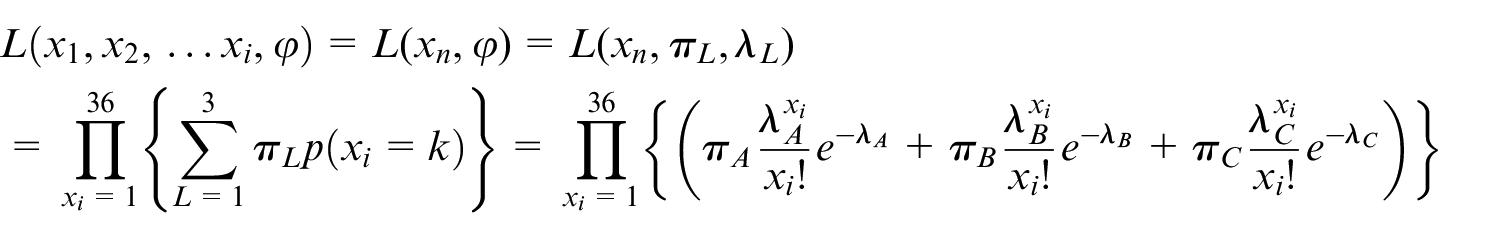
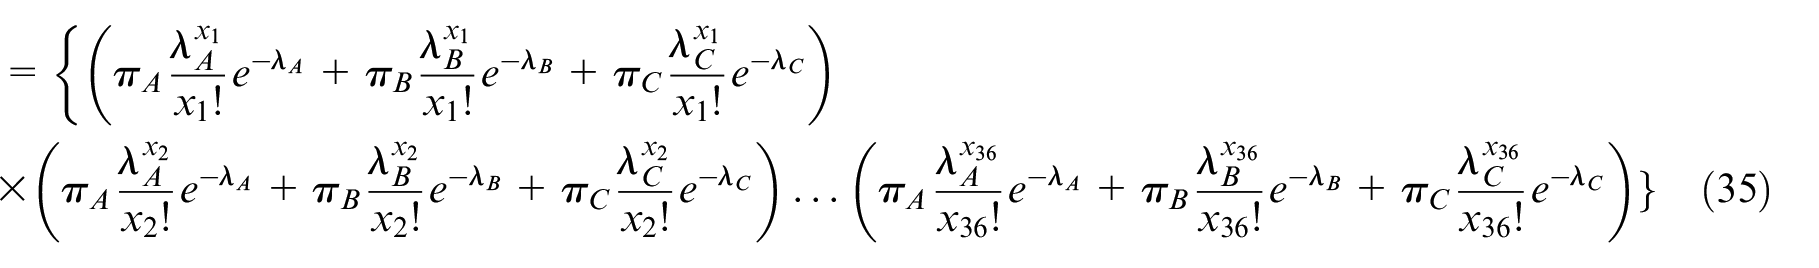
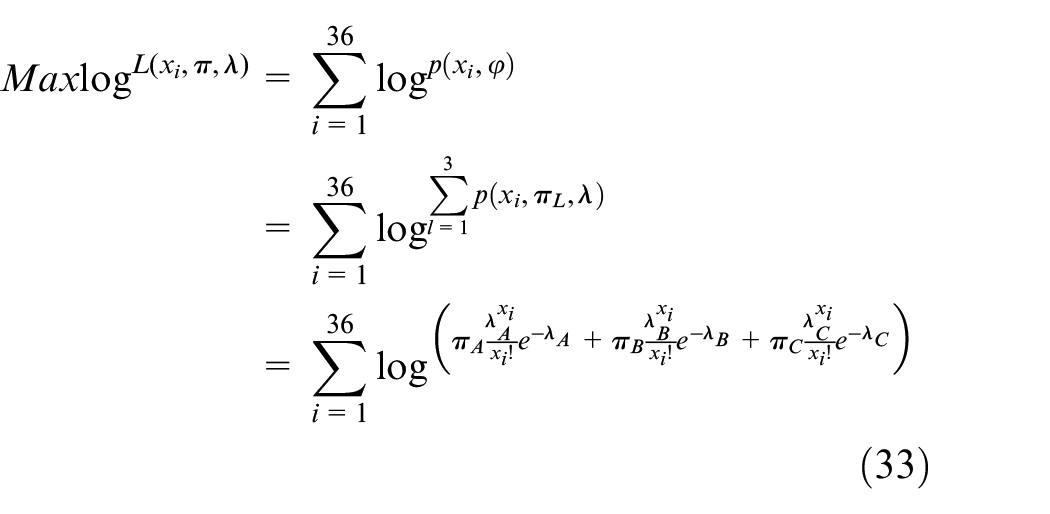
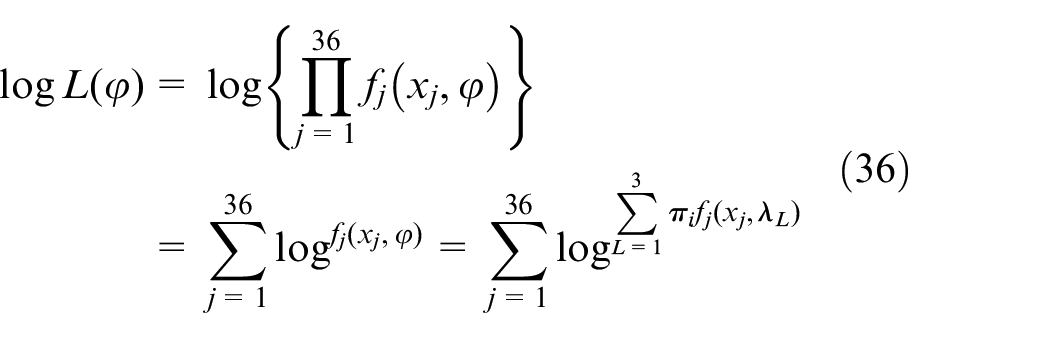
Log-likelihood function:
If bike flow patterns obeys just one λ Poisson distribution in BSS
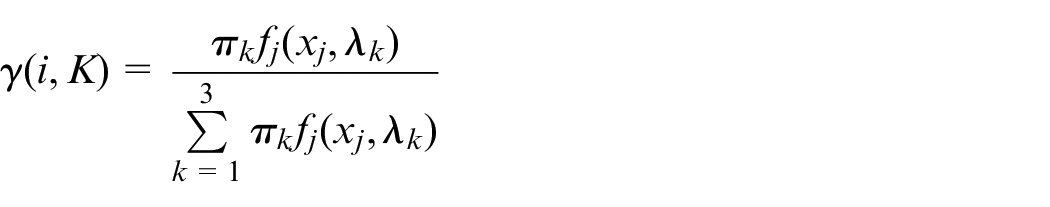
Hidden variable γ
In the log-likelihood function, there is a sum in the logarithm. So add hidden variable γ;
if xt from type of sample A, then γt,A = 1, γt,B = 0…, γt, C = 0 means (yt, 1, 0, …, 0)


we define implicit variable γ as a K-dimensional binary random variable with only a specific value in its K-dimensional value. When K value is 1, the other elements’ value is 0

when
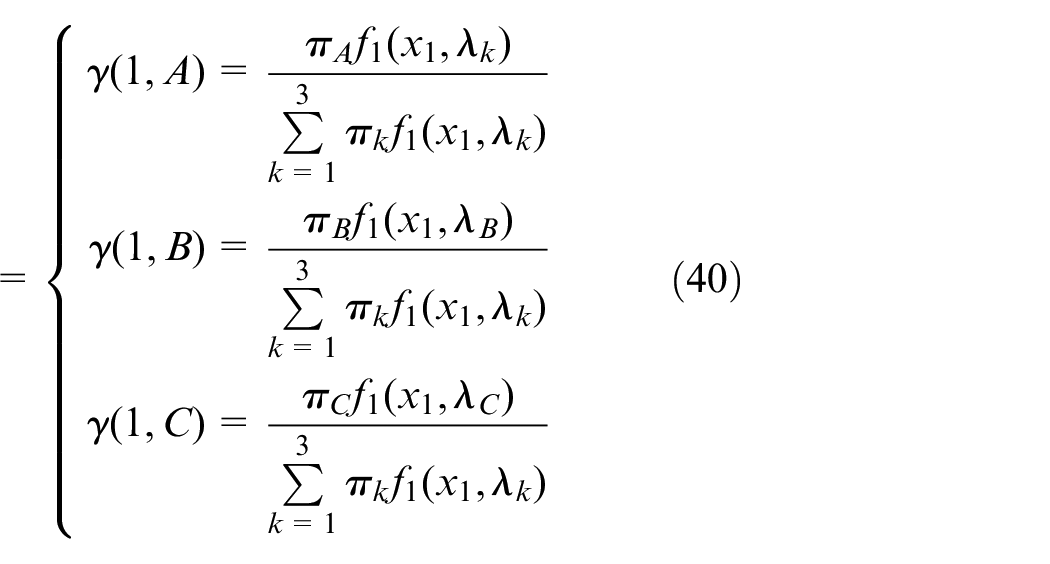
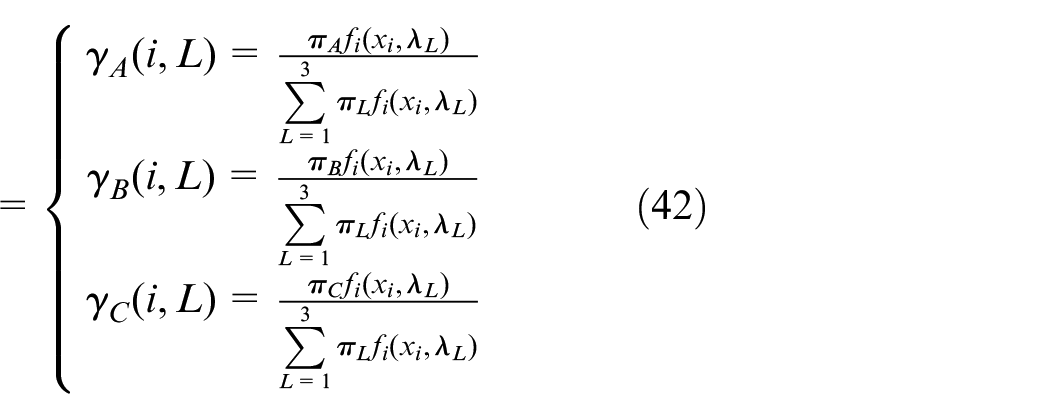
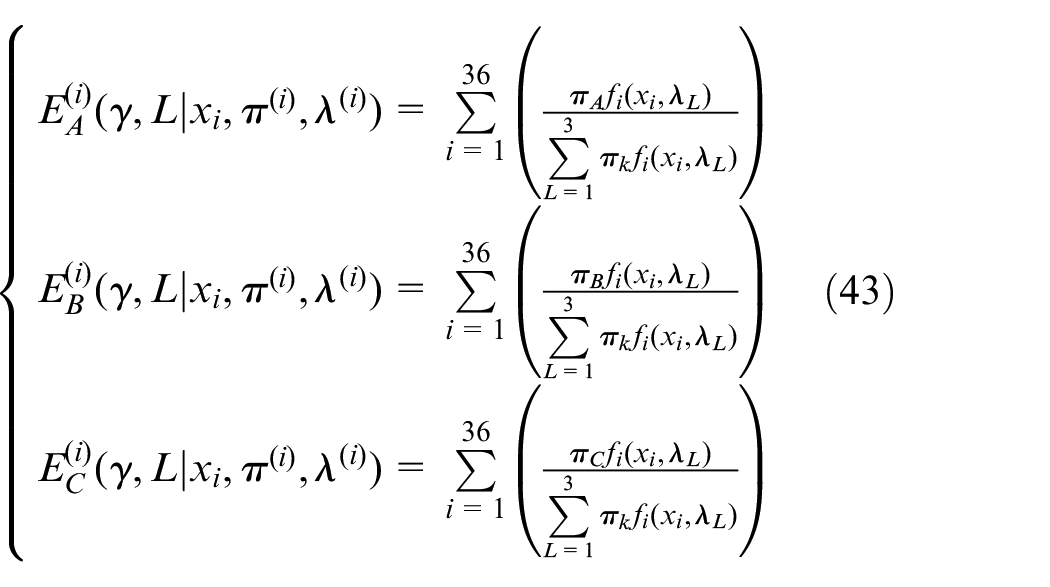
Expectation step
Estimation of from which part of Poisson distribution the data xi come from is as follows
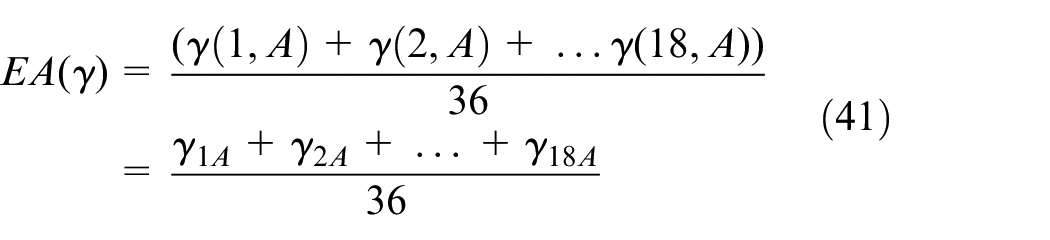
Expectation is
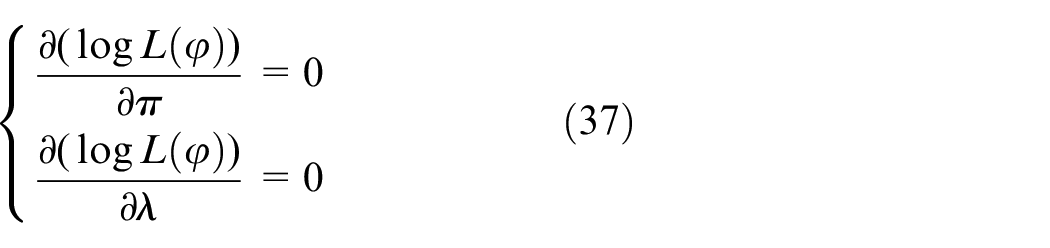
Maximization
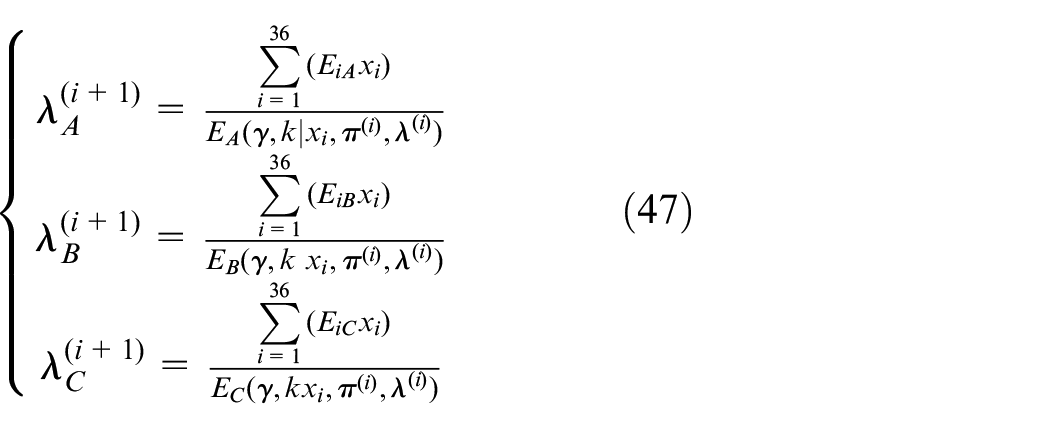
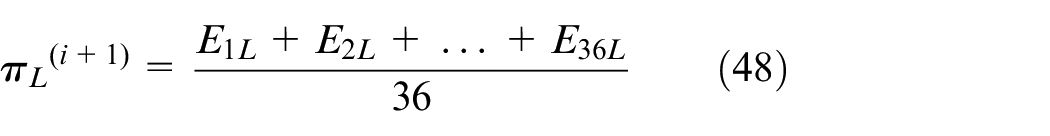
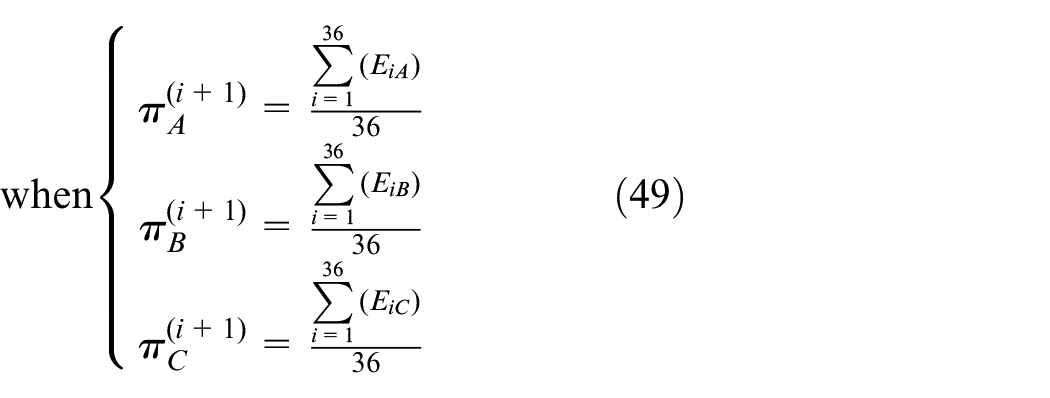
Estimate the parametric proportions of each, as we know various possibilities of γ. In order to find out the proportion of Poisson distribution, we analyze and iterate maximizing Q function, and the most suitable parameter values are obtained to construct the optimization model

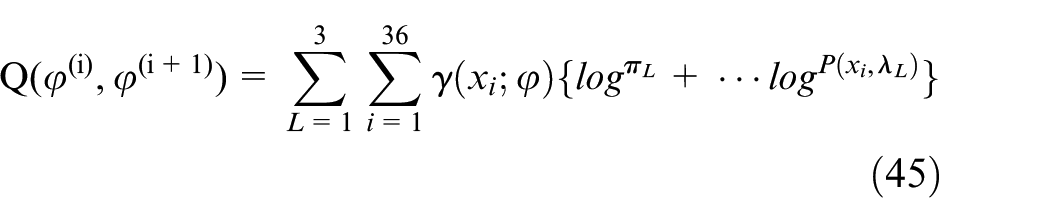
Derivative of Q function and equal to zero.
Bike flow patterns
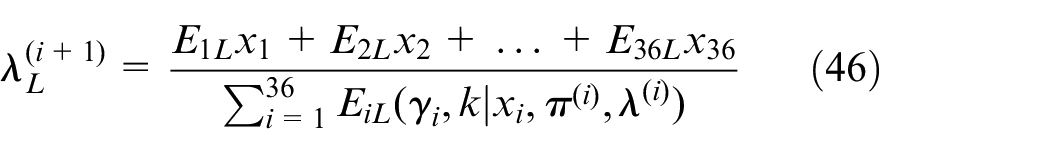
when
The optimal value of parameter is found, as shown in Figure 8.
Set φ(πA, πB, πC, λA, λB, λC) by EM algorithms

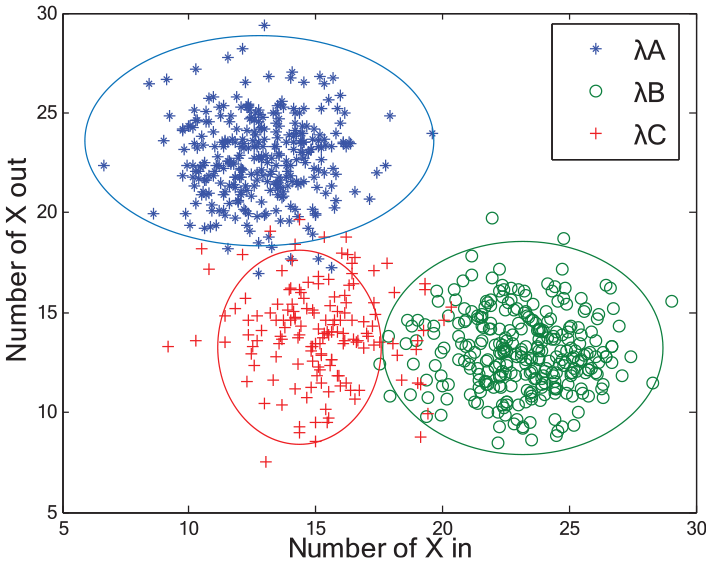
Three stages of clustering.
Experiments
Based on historical parking data, we predicted grid of state and optimized the parameters.
Settings
Our experiment data come from real-world database in Mobike and OFO technology Co., Ltd.
Mobike data: We use the data from Mobike in Beijing city, from 1 March 2017 to 30 October 2017 as the bike data. There are 4,825,118 records in train.csv and test.csv data sets. The format of data is user ID, bike ID, bike type, start time, end time, geo-coordinates start location, and geo-coordinates end location. We define them into a variable set {U i , B i , Ts, Te, Ls, Lsi (lat, lng), Lei (lat, lng)}.
OFO data: We use the data of OFO BSS in Hangzhou city, from 1 May 2018 to 30 June 2018 as the bike data. There are 1,462,273 records. The format of the data is bike ID, start time, end time, and geographical coordinates of starting and ending location. We define them into a variable set {B i , Ts, Te, Ls, Lsi (lat, lng), Lei (lat,lng)}.
The experiments were executed on a computer running Windows 7, MATLAB 2014a, on a Pentium IV, Intel®, 1.84 GHz CPU, 4 GB of RAM. First, we use a statistics Spatiotemporal approach via time series analysis and get XΔt = {Xin, Xout}. Second, we tagged the classification of the BSSs’ training data set. Finally, we predicted the cluster of Geohash grid.
Achievements
In this section, we experimentally evaluate the performance of AGC-MSP and PMM-EM in Geohash grid. AGC-MSP is predicted in Geohash-grid stage in next time slot.
Multi-grid scenarios
At first, we choose six district of Beijing to divide grid of Geohash. Dongcheng district is divided into 320 Geohash grids, Xicheng district is divided into 355 Geohash grids, Fengtai district is divided into 471 Geohash grids, Haidian district is divided into 1035 Geohash grids, Chaoyang district is divided into 1344 Geohash grids, and Changping district is divided into 1833 Geohash grids. We proposed AGC-MSP in stage prediction, as shown in Figure 9.
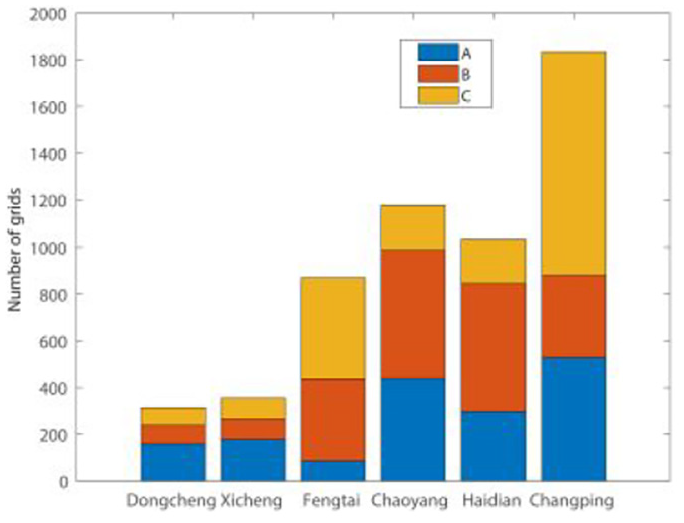
Predicted imbalance stage.
Single-grid scenarios
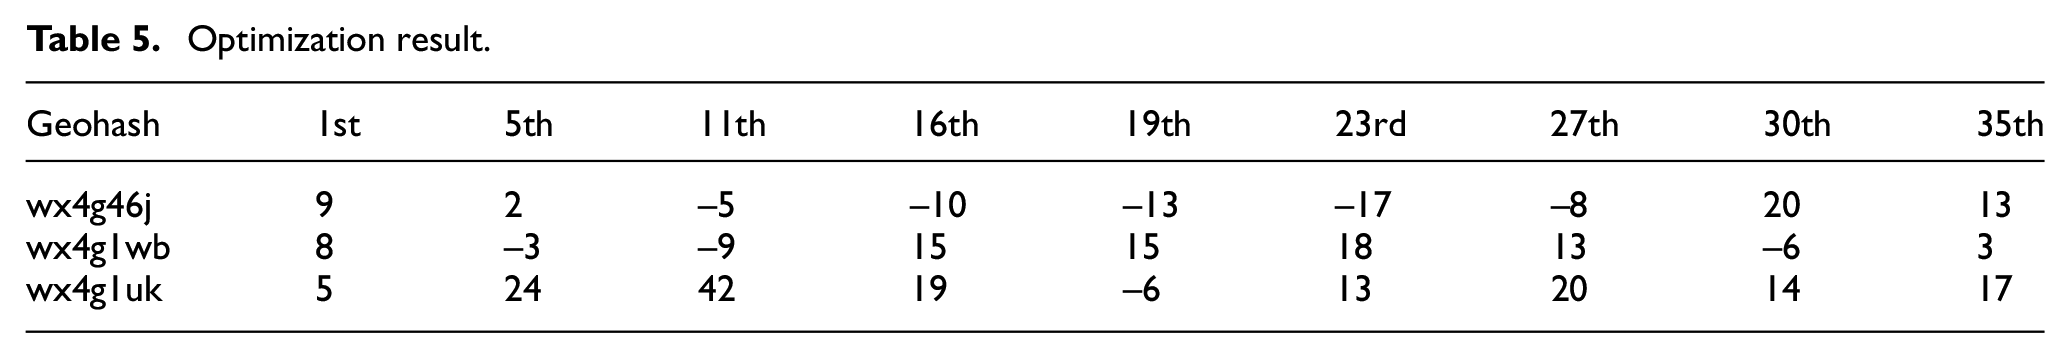
The number of bikes is calculated by the function
Optimization result.
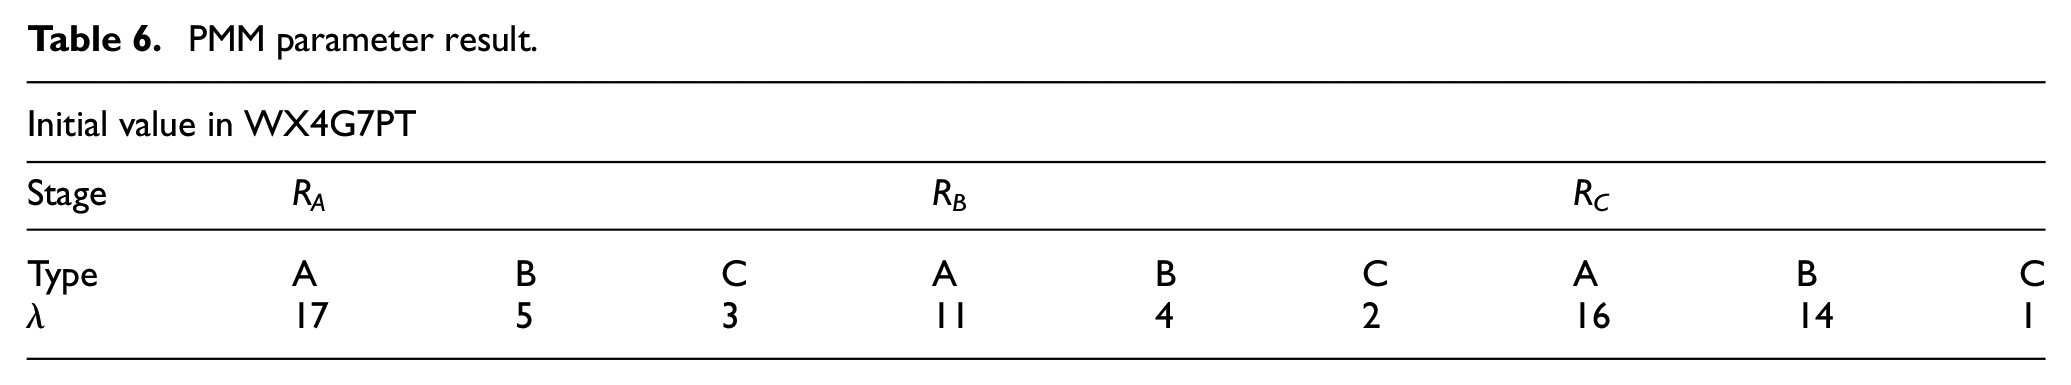
PMM parameter result.
Recommended solution strategies
RA solution
K is the capacity in RA queuing model system. When the capacity of the queues is K = 1, it means that one commuter searches for sharing bikes for traveling. Under over-demand stage, commuters could choose any transport tool in Geohash grid. In this system, the service rate is μ = 30 min/7 bikes = 4.2 min/bike. The bikes arriving rate is λ = 5 bikes/h and the service intensity is ρ = λ/μ = 1.19.
When the capacity of queues is K ≠ 1, for example, users waiting for a bike, the parameters are shown in Table 7.
Different number of commuter waiting for bike in RA.
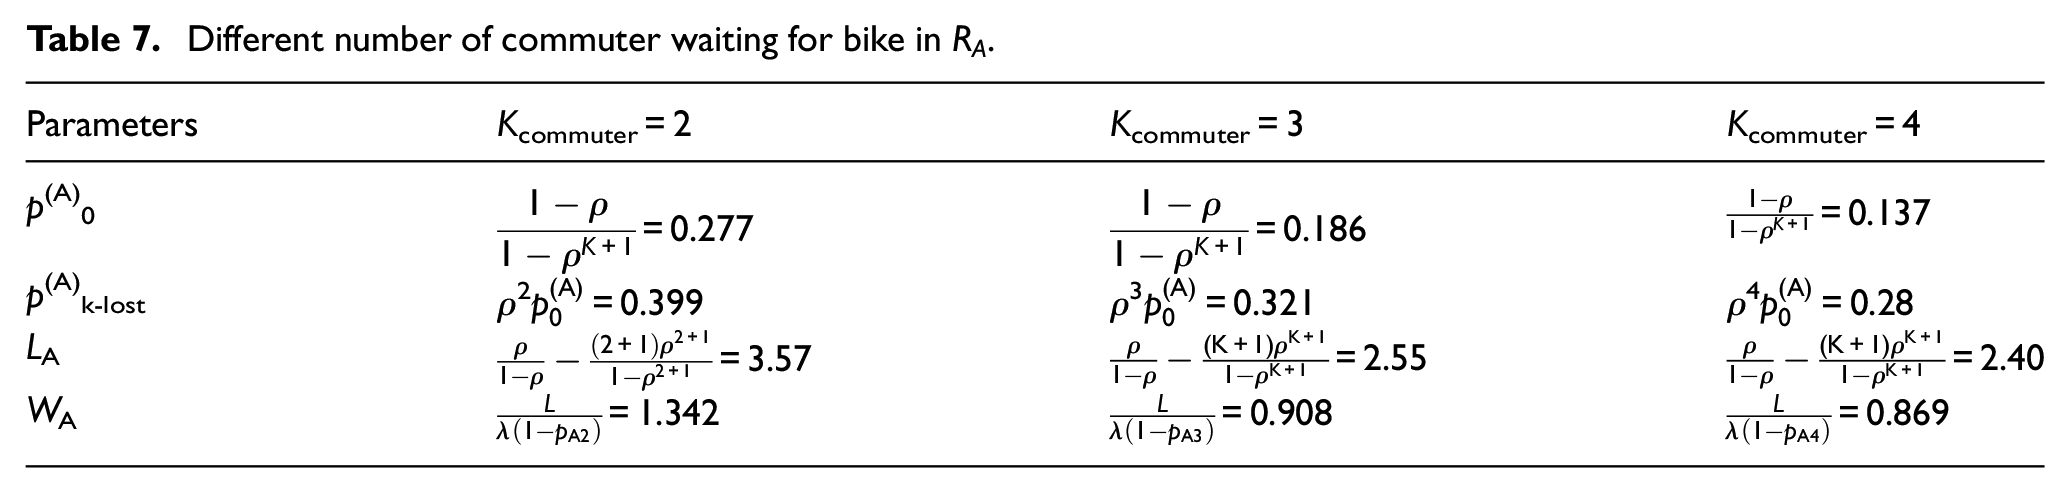
In the over-demand stage, queuing system service intensity is
RB solution
The over-supply state service intensity is 0 <
Thus, commuter should not wait. In RB state, there are several bikes offered to commuters to pick up in grid parking zone. The resources for bike sharing are in imbalance state. Thus, it is phenomenon of “bikes graveyard” by social news report.
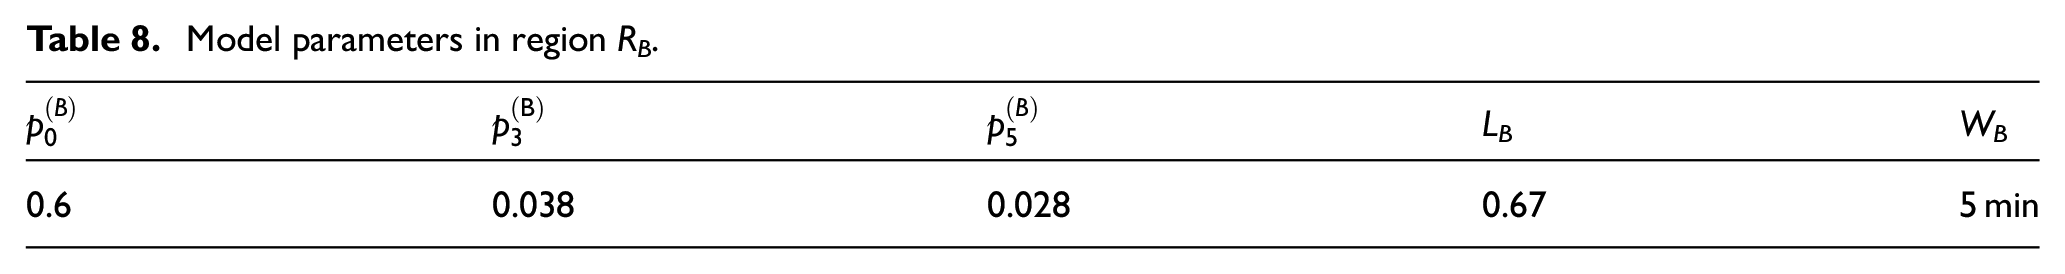
In RB state, the utilization rate of sharing bikes is inefficient. After several iterations, Markov transition matrix becomes steady-state. Based on the arrival rate λ according to a Poisson process, the number of check-in of bikes is μB = 20 bikes/h by the historical data. The remainder bikes are in idle state in RB Geohash grid According to PMM-EM, the optimized parameter is λB = 8 bikes/h. The remainder bikes will be recycled by truck dispatching strategy. 3 The intensity of the queuing model system is ρB = 0.4 < 1. The p(B)0 value is larger than the p(B)3 value. The result shows that the users are not required to wait, as shown in Table 8.
Model parameters in region RB.
RC solution
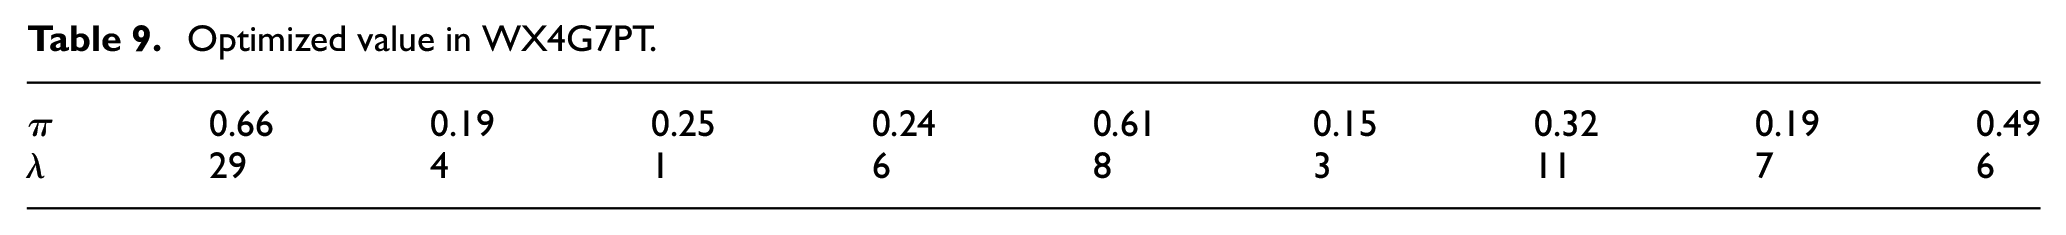
Table 9 shows that the bikes arrive at the parking platform following Poisson distribution.
Optimized value in WX4G7PT.
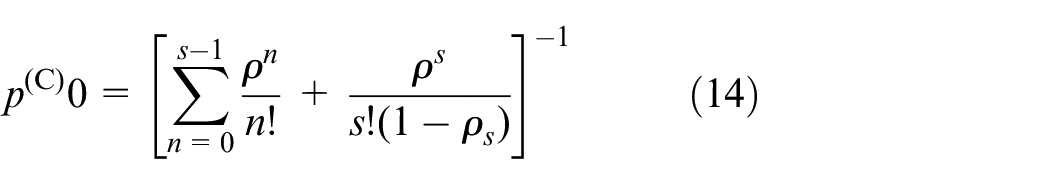
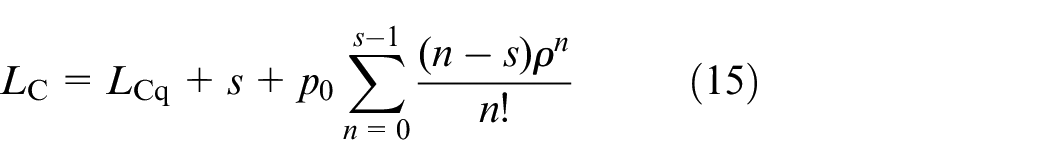
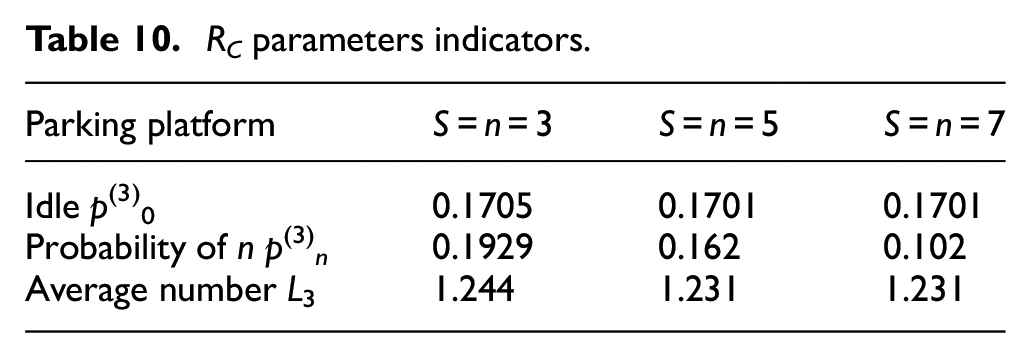
In self-balance Geohash grid, the parameters are described as follows: the idle probability is p(C)0 = 17%, the waiting time for service is 0.09 h, the arrival rate λC = 7 bikes/h, the completed services rate μC ≈ 5.67, the intensity is ρC = 1.23, the number of users waiting in line is LC = 1.24. When the number of counter is Scounter = 3/5/7, the parameter indicators are presented in Table 10.
RC parameters indicators.
The occasional idle situation of sharing bikes in RC causes the behavior of customer selection to become stable. No case of over-demand or over-supply was observed. The number of bikes can maintain stable self-balance.
Systems solution

Bike rebalance strategy in grid RA

When
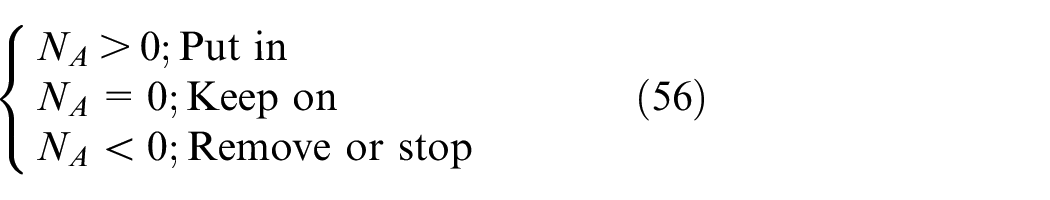
where NA is the optimized number of bike put in RA and
Bikes’ rebalance strategy in grid RB

When
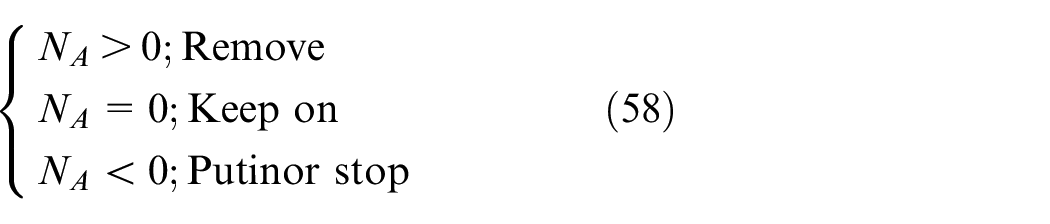
where NB is the optimized recycle bikes from RB,
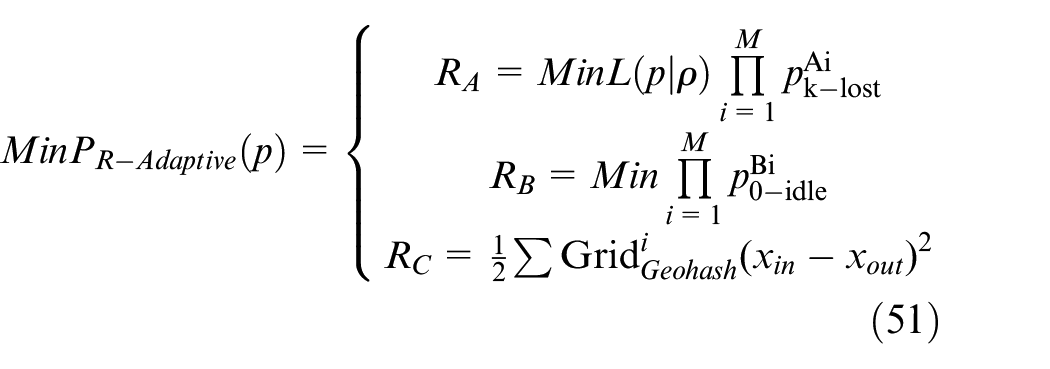
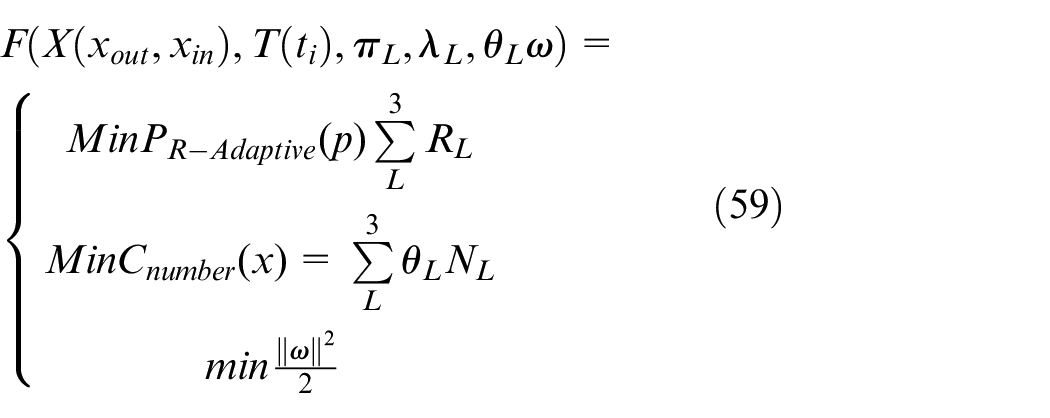
BSS rebalance optimized object function is
Result
In the experiments, two models are designed as the classification and prediction frameworks. For the result on bike check-in/out, we compared famous baseline clustering and classify method perceptron, decision tree, k-NN, and k-means in bike-sharing service region. For the result on imbalance problem, we compared AGC-MSP with baseline method: ARMA and GBRT in predicted demand. For the result on rebalance problem, we compared PMM-EM with Kalman filter and HMM in parameter optimization.
Baselines and evaluation method
The models are proposed in our work to solve imbalance and rebalance problems by bike flow patterns prediction and parameter optimization. The methods are ISVM algorithm to solve multi-classification problem and AGC algorithm, based on AGC-MSP and PMM-EM. In order to confirm our models, there are eight approaches that can be compared with the proposed method as follows:
In order to evaluate the realistic scenario of BSS, the test data set is divided two parts: sequential hour slots and anomalous time slots.
In this paper, we proposed AGC, ISVM, AGC-MSP, and PMM-EM approaches compared with six baselines method. AGC is based on density-based clustering, ISVM is based on classification algorithm, AGC-MSP is based on classification and regression analysis, and PMM-EM is based on machine learn.
where
In machine learning, clustering is unsupervised learning approach. It is difficult to evaluate the result of clustering. What is clusters number n? We usually chose the number of clusters by knowledge and experience. In our experiments, we cluster all parking points separately in Mobike and OFO BSSs.
Result on clustering
For simplicity and rapid modeling, we have been inspired by the most popular method of density-based spatial clustering of applications with noise (DBSCAN) and OPTICS. In the bike flow pattern clustering, we apply the idea of AGC in state label renewal. According to the number of bikes’ check-in/out, we compare k-means (k = 3) and geographically constrained label propagation (GCLP) with the geographical grid. 36
When the demand of imbalance problem in BSS is predicted, we should be able to cluster bikes’ check-out/in regions. k-means is the baseline clustering algorithm by distance of object. But in dockless pattern of bike sharing, the point of parking is changing with Δt. GCLP considers geographic constraint and label propagation based on popular community detection algorithm. Table 11 reveals that the time complexity is better than GCLP. Therefore, we adopted AGC for the next step.
Complex of clustering.
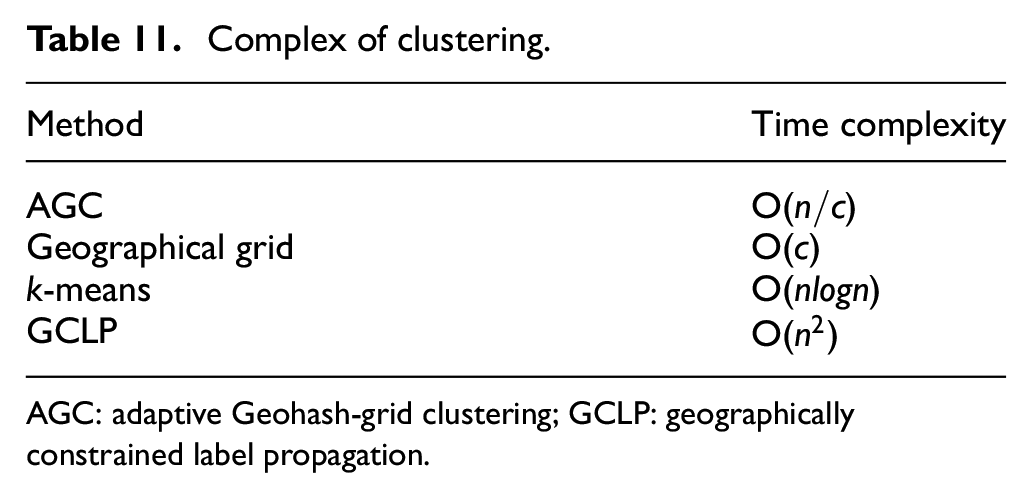
AGC: adaptive Geohash-grid clustering; GCLP: geographically constrained label propagation.
Result on label classification
In order to figure out the stage of bike flow pattern for each region (grid or dock station), the initial parking data will be transformed to {
Label of static classified.
Result on predicted patterns
We proposed AGC-MSP compared with ARMA, ANN, and Kalman filter predicted algorithm.
In other words, the proposed AGC-MSP based on density-based clustering and Markov models can improve the prediction performance. The predicted over-demand state results are shown in Table 12.
True and false positive.
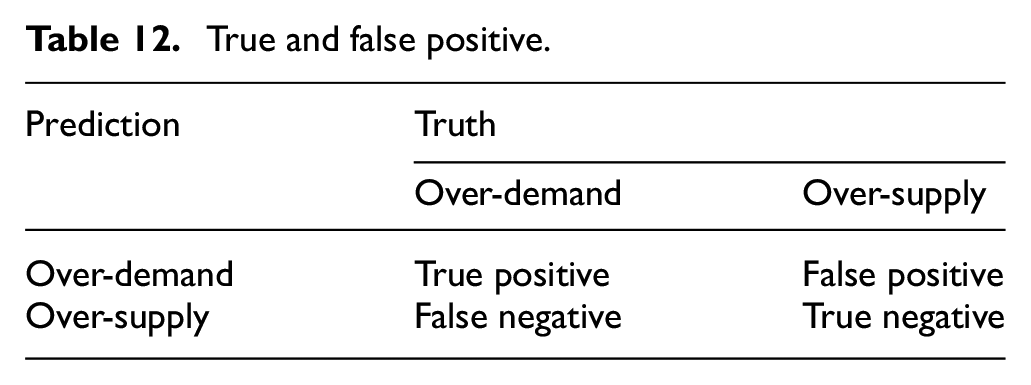
Based on the AGC-MSP results, we predict the check-out/in stage by ARMA and GBRT. We choose two type of stages for AGC in our experiment: one is over-supply stage and the other is over-demand stage. The performances of ARMA are much better than GBRT. In addition, in all the hours, GBRT is less affected by time factor. We proposed that AGC-MSP is more accurate than ARMA and GBRT obviously, as shown in Figures 11–13. Because of sample of time window, the accuracy of AGC-MSP depends on stable Δt and prior knowledge for historical data.
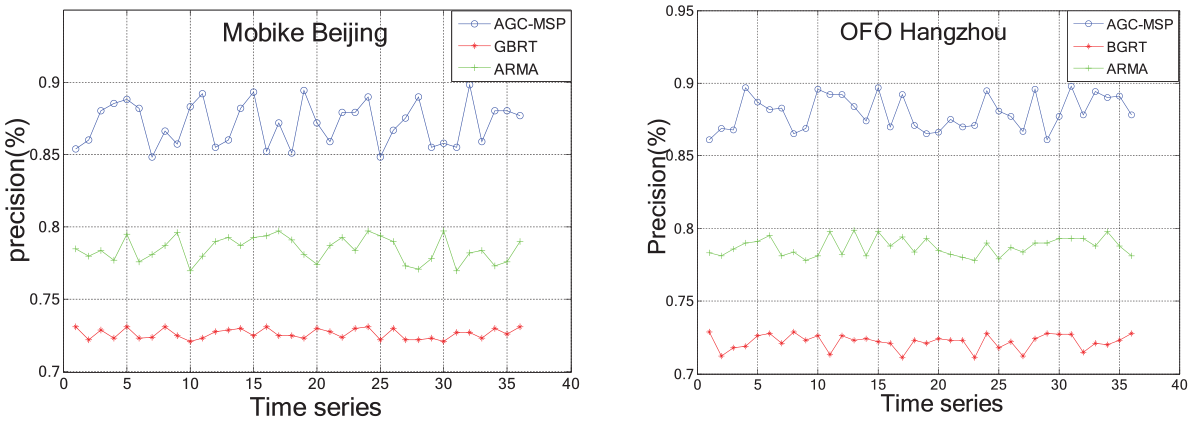
Prediction of precision.
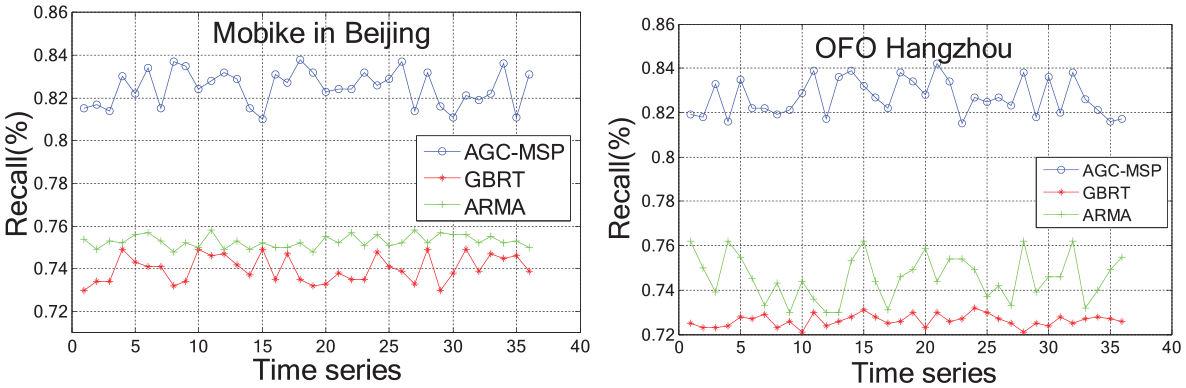
Prediction of recall.
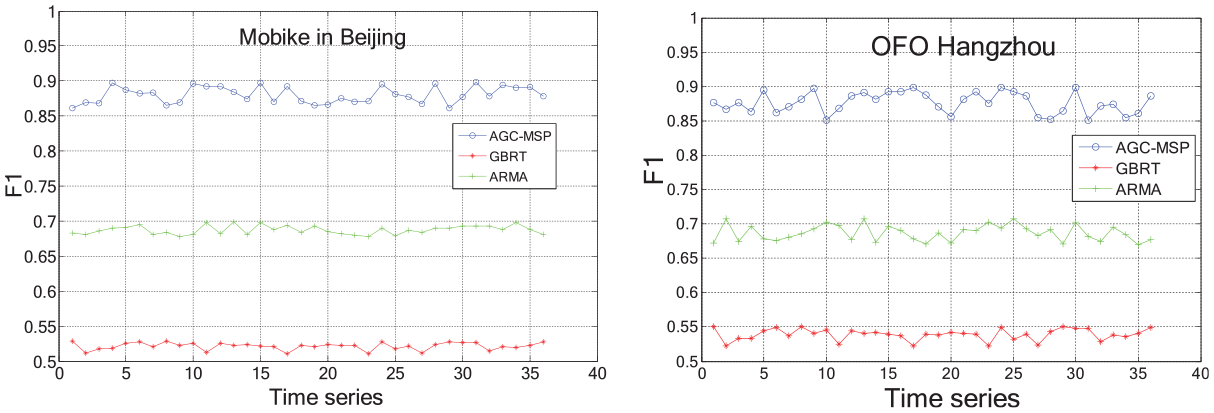
Prediction of F1.
Result on parameter optimization
We proposed PMM-EM’s parameter optimization compared with HMM and Kalman filter. In anomalous time series, PMM-EM performance was calculated using RMSLE and error rate.
In summary, PMM-EM based on the result of AGC, ISVM, and Markov state transition matrix is much better than baseline method. In time complexity, the PMM-EM model need to achieve stable transition by initialized values iterated as
Demand of bikes’ check-out Geohash grid.
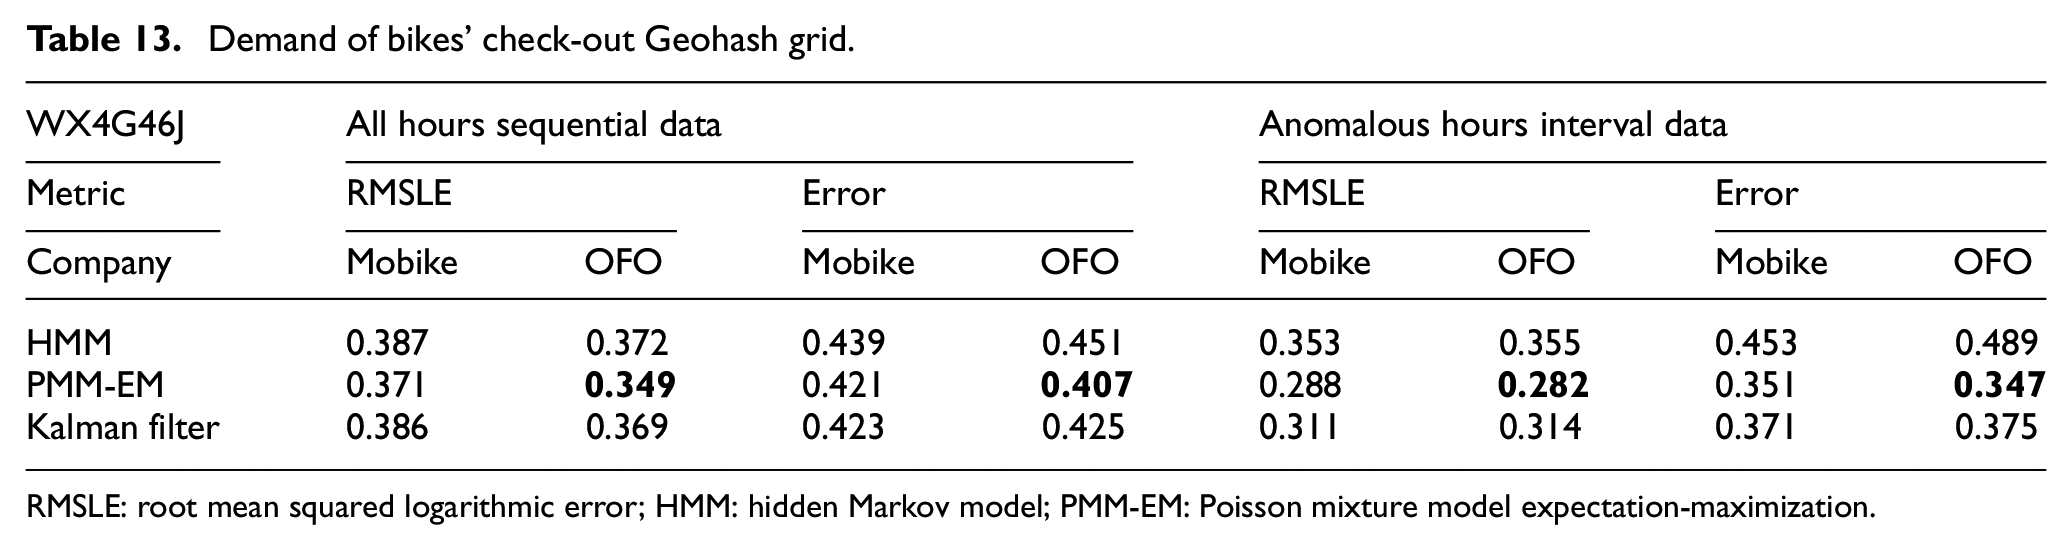
RMSLE: root mean squared logarithmic error; HMM: hidden Markov model; PMM-EM: Poisson mixture model expectation-maximization.
Demand of bikes and check-in into Geohash grid.
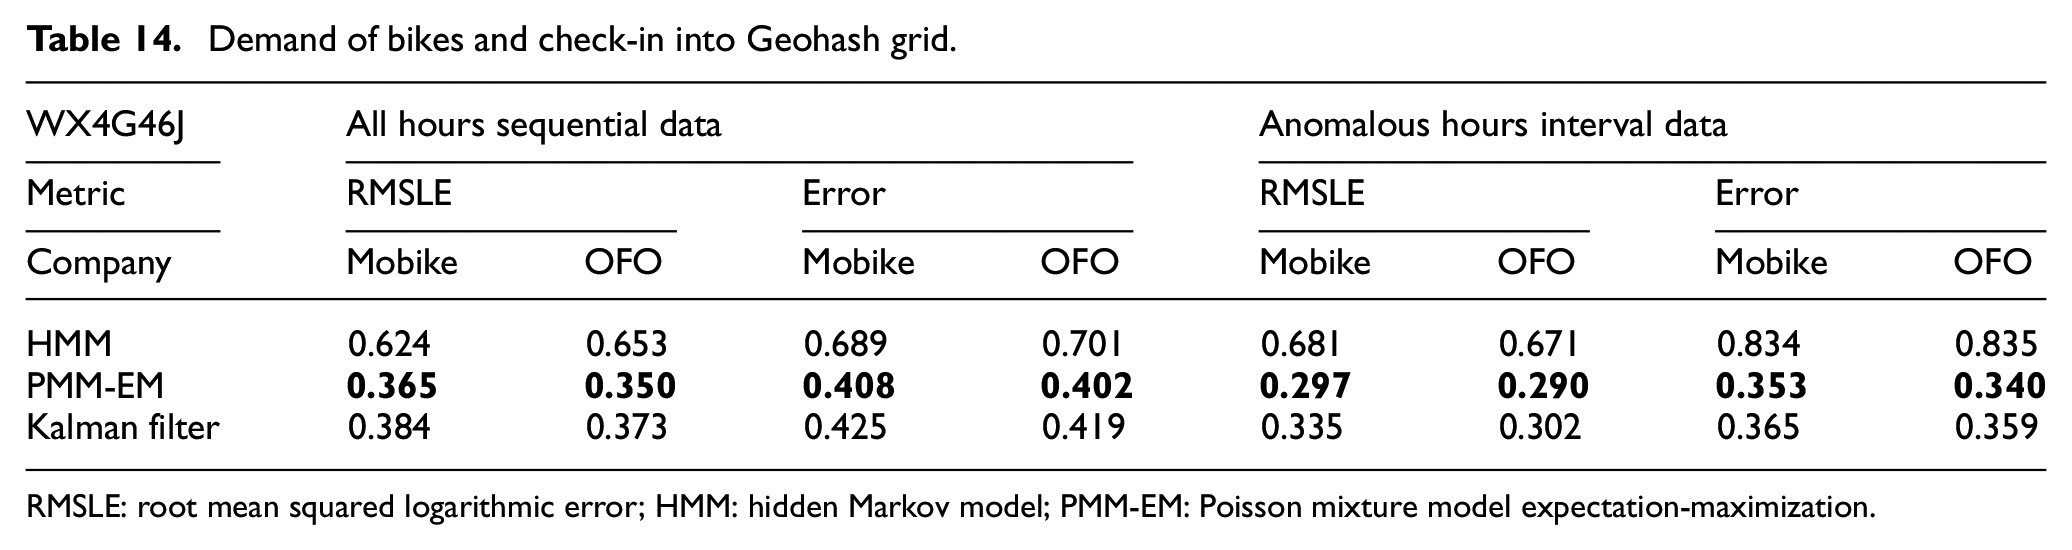
RMSLE: root mean squared logarithmic error; HMM: hidden Markov model; PMM-EM: Poisson mixture model expectation-maximization.
Conclusion and future works
Bike sharing is a means of transportation that provides services to residents through mobile Internet, LBS, e-commerce, and other technologies. With the development of the market and the increasing number of customer groups, a huge amount of data has been generated.
Different researcher have different attitude toward BSSs. With the development of deep learning and ANN, the traffic dispatching that has become hot spot in International conference. However, those algorithms are not suitable for our framework. The main reason is perspective of feature and factor. For instance, genetic algorithm, simulated annealing, and the heuristic algorithm are well performance in nondeterministic polynomial time (NP)-hardness problem, but our approach focus on global features. In future research, we should address the problem of heuristic algorithm, such as particle swarm optimization optimized BSS. Besides the optimization, deep learning differential privacy is a newest research area. Therefore, commuter should be prevented from being tracked and intercepted. Large-scale data sets are shared, and the law of user behavior is examined. The overall arrangement of sharing bikes is continuously optimized. It provides a reference for traffic planning of urban public service and alleviates urban congestion. It provides a business siting scheme which pushes media advertising and recommends commodities.
Footnotes
Declaration of conflicting interests
The author(s) declared no potential conflicts of interest with respect to the research, authorship, and/or publication of this article.
Funding
The author(s) disclosed receipt of the following financial support for the research, authorship, and/or publication of this article: This work was supported by the National Key R&D Program of China under Grant No. 2017YFB1400800 and National Natural Science Foundation of China under Grant No. 61702046.