
Abstract
The aim of this paper is to develop a model which can be used to retrieve sea ice thickness based on global navigation satellite system reflected signals at a shore-based platform. First, the method calculates the intensity ratio of the reflected signal and the direct signal of the global navigation satellite system satellite, which is the ratio of the power of the reflected signal to the power of the direct signal. Then, the information of the sea ice thickness is obtained according to the empirical model of the sea ice thickness. In order to verify the effectiveness of the method, the global navigation satellite system reflected signals were observed in the experiment in the Bayu enclosure of Liaoning Province, China. The results show that the sea ice thickness of the global navigation satellite system reflected signal is 10–20 cm, which is consistent with the synthetic-aperture radar observation.
Keywords
Introduction
Sea ice is an important part of the cryosphere. It has a major impact on maritime transportation, marine fisheries, offshore oil and gas resources development, coastal port operations and global climate change. With the influence of the global greenhouse effect, the research on sea ice has attached great importance to the detection of sea ice by different means. 1
The Satellite Ocean Application Center conducted sea ice analysis by satellite remote sensing as early as the 1980s. Sea ice detection is mainly carried out by remote sensing based on visible light and microwave remote sensing. The sea ice remote sensing based on visible light is mainly detected by medium and low resolution optical sensors, 2 and the relatively intuitive images can be obtained. However, it is often limited by the influence of natural weather such as clouds and fog, and real-time continuous sea ice monitoring cannot be guaranteed. Microwave-based sea ice remote sensing is mainly detected by synthetic-aperture radar (SAR). 3 Although real-time imaging can be guaranteed, the cost required for large-scale sea ice monitoring is high.
Global navigation satellite systems reflectometry (GNSS-R) is a technology based on the global navigation satellite system’s (GNSS) reflected signal. 4 This technology can be used for remote sensing measurement of forest cover, sea surface wind field and other parameters using GNSS signals through land surface, sea surface and target reflection surface. GNSS-R technology has many advantages; it has a stable signal source, it does not need a transmitter and no near-shore blind zone exists. In recent years, it has been widely used in marine, atmospheric and terrestrial remote sensing fields. In 1993, Martin-Neira of the European Space Agency (ESA) first proposed the passive reflectometry and interferometry system (PARIS) concept using Global Positioning System (GPS) signals for detecting sea surface height measurement. 5 Then, it was used to detect multiple geophysical parameters of sea surface height, 6 sea surface wind speed 7 and soil moisture. 8 New applications of reflected GNSS signals are being proposed and verified, such as the determination of dry snow depth, 9 mapping flood inundation 10 and inland water altimetry. 11
Sea ice detection using GNSS-R is a relatively new research direction in this field. In 2000, Komjathy obtained the empirical value of the effective dielectric constant of sea ice surface by calculating the power of GPS reflection signal in literature. 12 In 2007, Rivas obtained the roughness of the sea ice surface by fitting the GPS reflection signal waveform in literature. 13 In 2012, Fabra fitted the trend of the ratio of GPS reflection signal power to GPS direct signal power in the literature 14 and the trend of sea ice density change was obtained. In 2013, Zhang verified the feasibility of sea ice detection based on GPS reflection signals by analyzing the GPS reflection signal data collected by ESA in Greenland. 15 In 2014, Zhang proposed a method for sea ice detection based on the polarization ratio of GPS reflection signals by analyzing the seashore detection test conducted in Tianjin Binhai New Area. 16 In the same year, Yang and Peng discussed the follow-up observation of sea ice.17,18 In addition, for spaceborne GNSS-R, the biggest advantage is the high temporal and spatial resolution. The UK TechDemoSat-1 (TDS-1) satellites have been launched, and the GPS signals acquired by the TDS-1 have been used to retrieve the sea ice thickness.19,20
The study of sea ice thickness parameter inversion models and methods is a key issue in GNSS-R sea ice observation, which depends on the accumulation of long-term observation data, and shore-based observation is a realistic and feasible means. 21 On the contrary, the shore-based GNSS-R has great advantages in offshore detection, and it is a good complement to the spaceborne equipment and shore-based high frequency (HF) ground wave radar in the offshore blind zone.
A method for detecting sea ice thickness using shore-based GNSS reflected signals is proposed in the paper. The receiver is installed at a fixed position, and the reflecting antenna is directed toward the sea of observation. By receiving GPS satellite direct signals and reflected signals, the intensity ratio of the GPS signals can be calculated (the ratio of reflected signals to direct signals). The sea ice can be effectively distinguished according to the difference in intensity ratio of seawater and sea ice. The sea ice thickness value can be calculated based on the empirical model fitted by the intensity ratio. Through the principle analysis and the verification of sea ice test data, the feasibility of using GNSS satellite reflection signal to detect sea ice thickness is proved.
Method of detecting sea ice
The direct signal polarization of GNSS satellites is right-hand circular polarization. When the direct signal of GNSS satellite is incident on the sea surface, it is reflected by the sea surface. The signal polarization reflected at a higher elevation angle is mainly left-hand circular polarization.
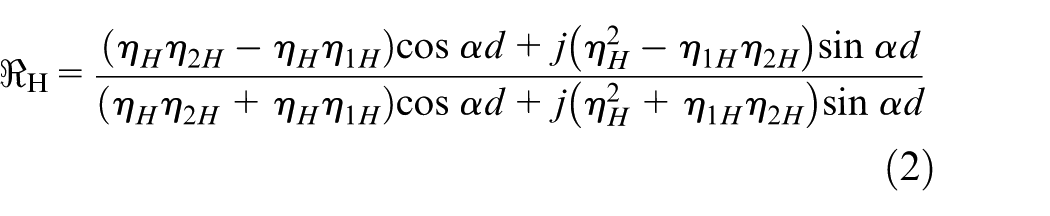
At the interface of air, sea ice and seawater, the energy relation of reflection and incident of electromagnetic waves is determined by the Fresnel reflection coefficient. When the thickness of sea ice is considered, the expression of electromagnetic wave vertical polarization and horizontal polarization Fresnel reflection coefficient is 22
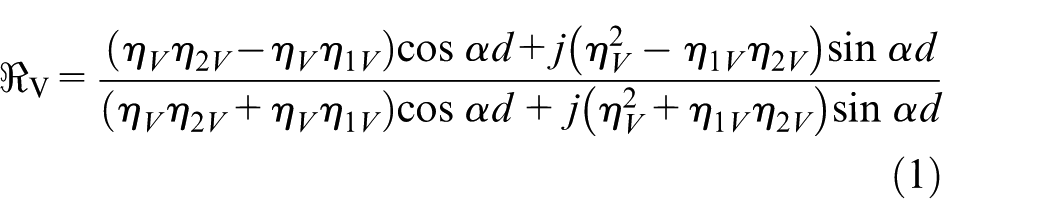
where
According to the Fresnel reflection coefficient of vertical polarization and horizontal polarization, the reflection coefficient of sea ice can be obtained as
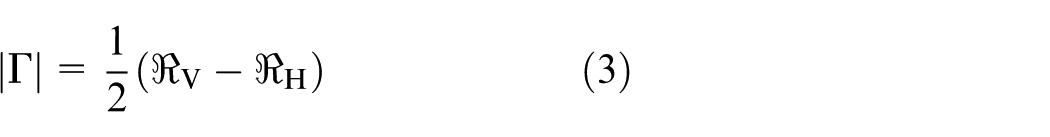
where
The dielectric constant of seawater and sea ice is different,
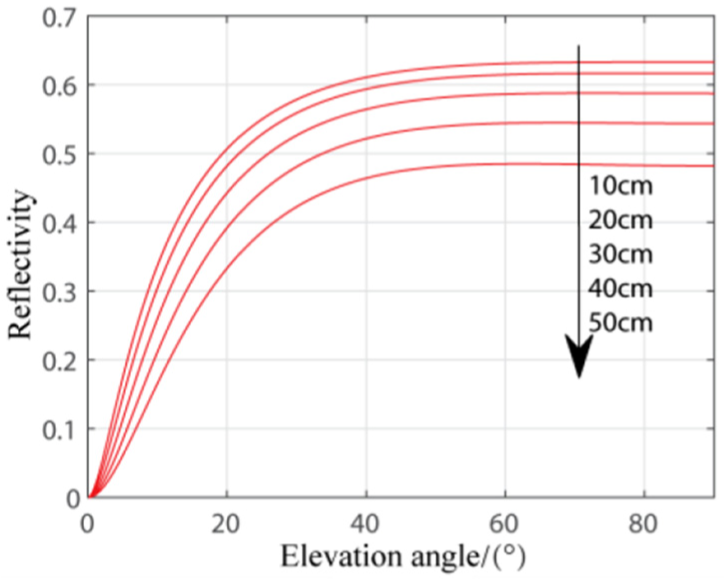
Relationship between sea ice reflectivity and sea ice thickness.
The reflected signal of the GNSS satellite signal after passing through seawater and sea ice is lower than that of the direct signal. Before the subsequent processing, the reflected signal needs to be correlated to obtain a higher gain. At time
where
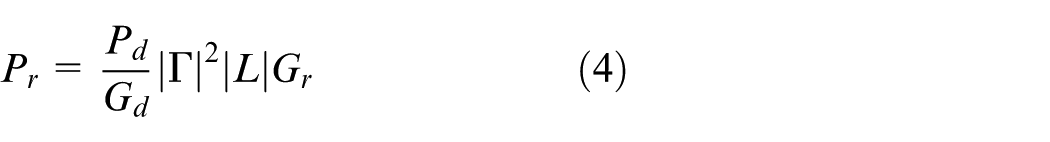
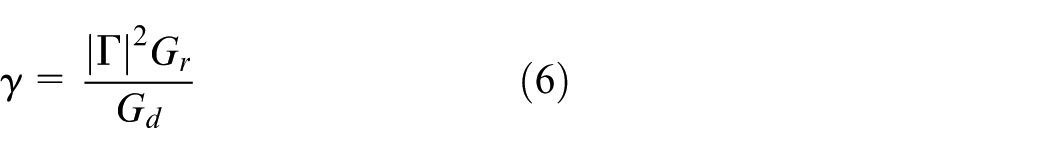
Under the shore-based condition, the blazed zone and the antenna footprint area are much smaller than the size of first delay zone. It is difficult to obtain sea ice information from the reflection signal–related power waveform inversion. However, the correlation value of the reflected signal and that of the direct signal under the shore-based conditions is significantly different between seawater and sea ice, which makes it possible to inverse the physical parameters of sea ice using the ratio of the power of the reflection signal and the direct signal (intensity ratio). The intensity ratio of the reflection signal and the direct signal can be calculated by
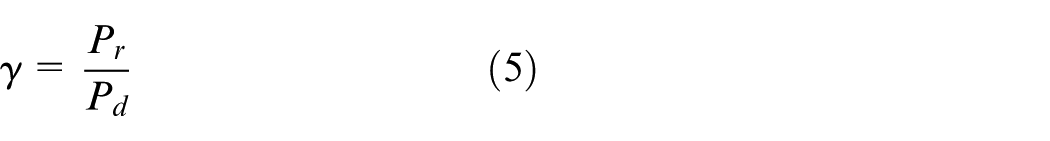
Substituting equation (4), it turns into
Since the sea ice in the near-shore area cannot grow fully, it is necessary to establish a corresponding empirical model for the characteristics of sea ice when detecting the thickness of sea ice. Since the sea ice reflectivity is basically unchanged when the GNSS satellite elevation angle is greater than 40°, the influence of different sea ice thickness on the reflectivity when the satellite elevation angle is 50° is selected. Figure 2 shows the relationship between different sea ice thicknesses and sea ice intensity ratios. In Figure 2, there is a certain relationship between sea ice thickness and sea ice intensity ratio, and the ideal empirical model is obtained by fitting the results as

Fitting results of sea ice intensity ratio and sea ice thickness.
where
Sea ice experiment analysis
Experimental scene
Taking into account the historical sea ice occurrence time and icing conditions and observation conditions in the Liaodong Bay area of Northeast China, the experiment was conducted from 13 January to 15 March 2016 at the Bayu Enclosure Marine Station Observatory in Yingkou City, Liaoning Province (40.283°N, 122.092°E). The observation environment is shown in Figure 3. The height of the observation point is about 20 m with respect to sea level, and the horizontal distance from the coastline is about 10 m. In order to receive the reflected signal of the GPS satellite, the reflect signal antenna points to the southwest direction of the observation point. The observable satellites have an elevation angle range of 25°–55° and azimuth angles ranging from 180° to 270°.
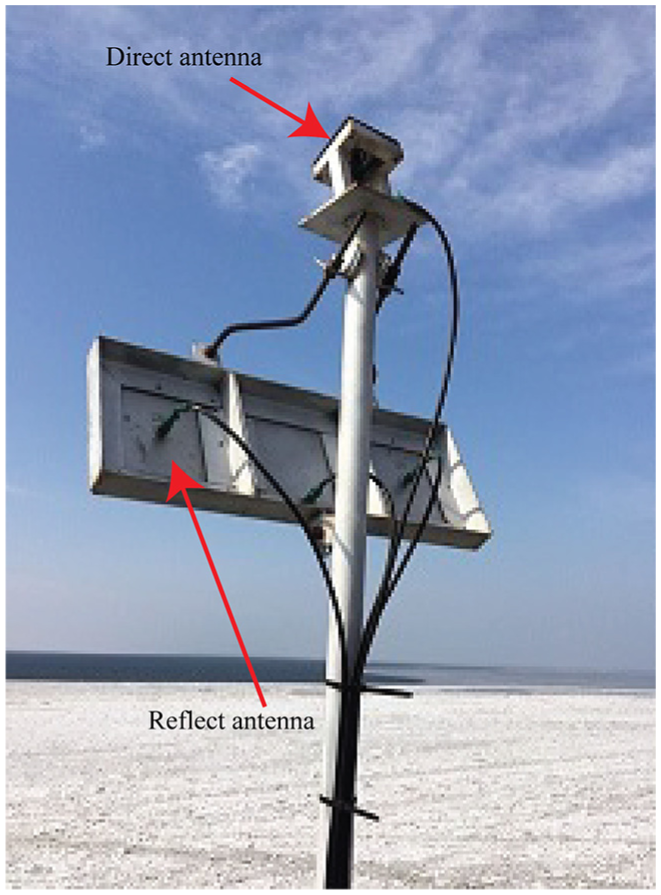
Observation environment of the experiment.
In the experiment, the direct signal is received by right-hand wide beam antenna using compatible BD(Bei Dou)/GPS; In order to improve the intensity of the reflected signal and eliminate the influence of the terrestrial reflection signal on the ocean reflect signal, the reflected signal is received by a high gain (12 dB), narrow beam (38°) left-hand circular polarization antenna. The digital intermediate frequency signal is quantized by 2 bits, and the sampling rate is 16.369 MHz. A detailed introduction about the instrument can be found in Li et al. 23 It is worth mentioning that the same instrument was also used in the other coastal experiments for sea surface wind speed retrieval, for example, in Wang et al. 24 and Li et al. 25 During the experiment, the sea ice thickness observed by the marine station was collected as the year-on-year data while collecting the original satellite data.
Data processing
The data processing software includes two units of digital intermediate frequency signal processing and sea ice thickness inversion. The processing flow is shown in Figure 4.
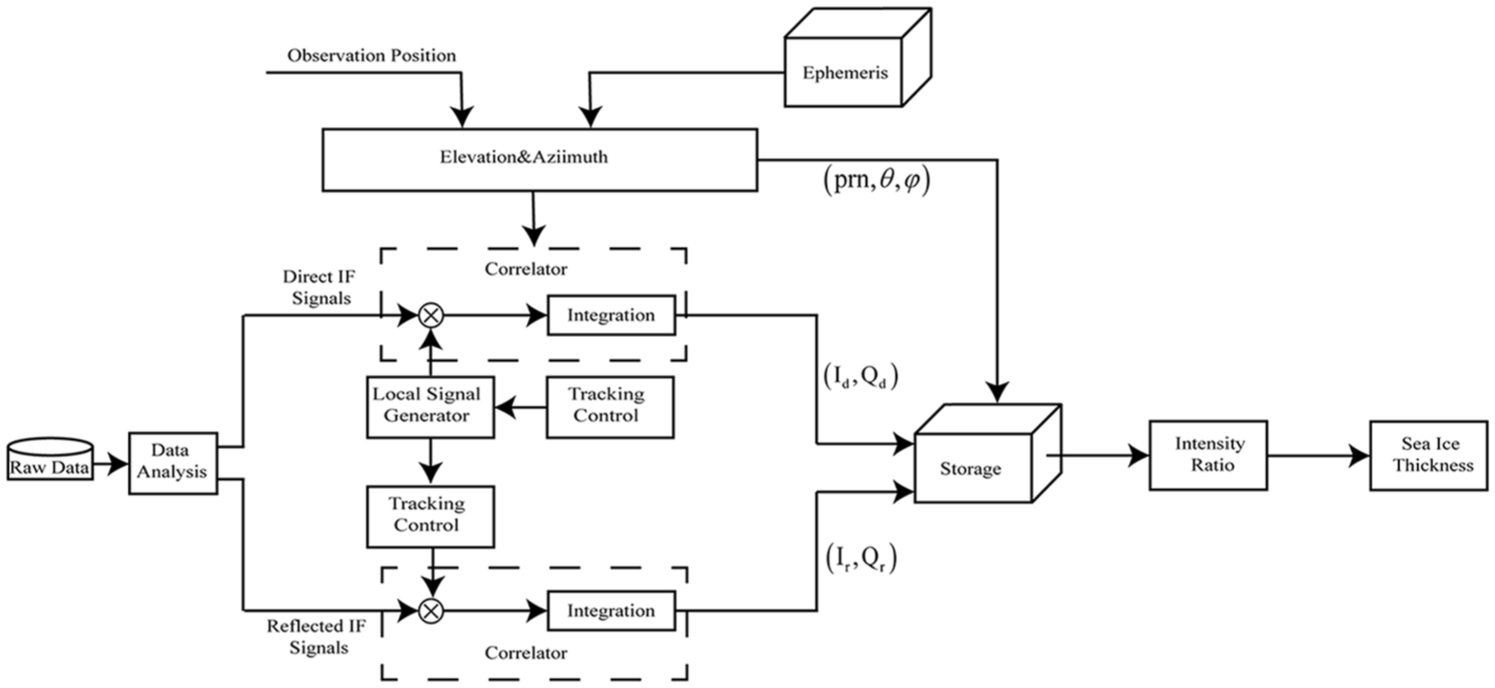
GPS reflection signal processing procedure.
The digital intermediate frequency signal processing unit is designed for the signal structure of the GPS system. First, the digital intermediate frequency file is read and the direct and reflected signals are separated, and the data bits and the reflected signals are obtained at the specular reflection point by the geometric relationship of the synchronization and reflect events of the direct signals. The delay is obtained by finding the complex correlation value of the direct and reflect signals at different time delays under 1-ms coherent integration. In order to verify the correctness of the digital intermediate frequency (IF) signal processing unit, the correlation power waveform of the complex correlation value of the GPS satellite reflect signal after 1-s non-coherent accumulation is shown in Figure 5, and the path delay formula of the peak point of the reflection signal–related power waveform is
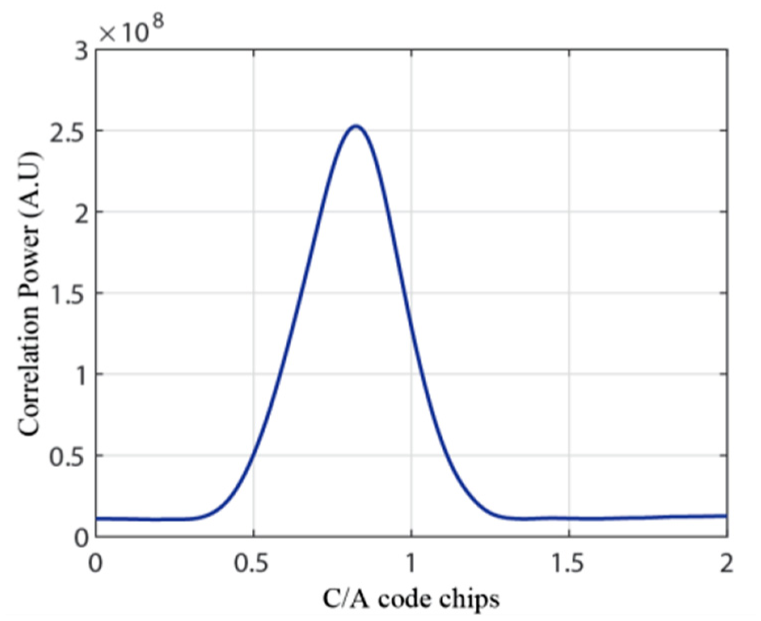
GPS reflected signal power waveform.
The sea ice thickness inversion unit first calculates the intensity ratio of the reflected signal of the GPS satellite, that is, the correlation power of the sequence length of 1 min according to formula (5) and formula (6) for the complex correlation value of the specular reflect point corresponding to the delay (the shore-based condition can be approximated as the relevant power peak point) in the waveform file. The averaging process is performed, and the intensity ratio of the correlation value of the reflect signal is obtained by the formula (7). According to the year-on-year data provided by the observations of the ocean station, the sea ice thickness value is inversed by the fitted empirical model.
Analysis of sea ice data
During the experiment, the formation of sea ice caused a certain impact on the passage of the sea near the observation point. During the effective acquisition time of GPS reflect signals, sea ice undergoes a process from formation to ablation. The experiment continuously collects the signals of the GPS satellites passing through the antenna irradiation area and obtains the correlation power of the direct signals and the reflect signals by processing the data. According to the different powers of the reflected signals of seawater and sea ice, the ratio of the intensity
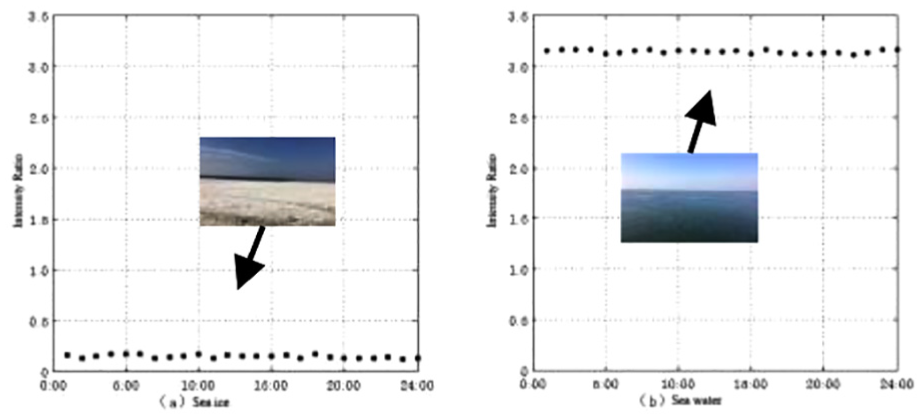
Intensity ratio of sea ice and sea water.
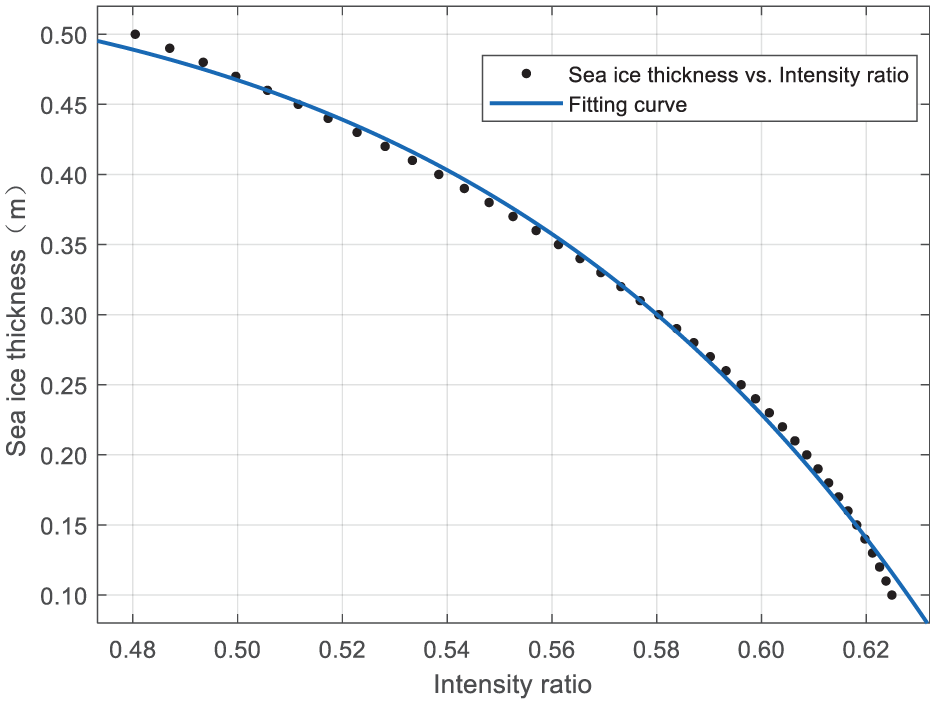
During the experiment, the intensity ratio of seawater and sea ice was calculated by processing the collected data, and the observation sea ice thickness information provided by the Bayu Enclosure Marine Station was compared with the sea ice thickness. Figure 7 shows the relationship between sea ice thickness and intensity ratio. It can be seen from Figure 7 that the intensity ratio of the reflected signal is inversely proportional to the thickness of the sea ice; as the intensity ratio increases, the sea ice thickness gradually decreases.
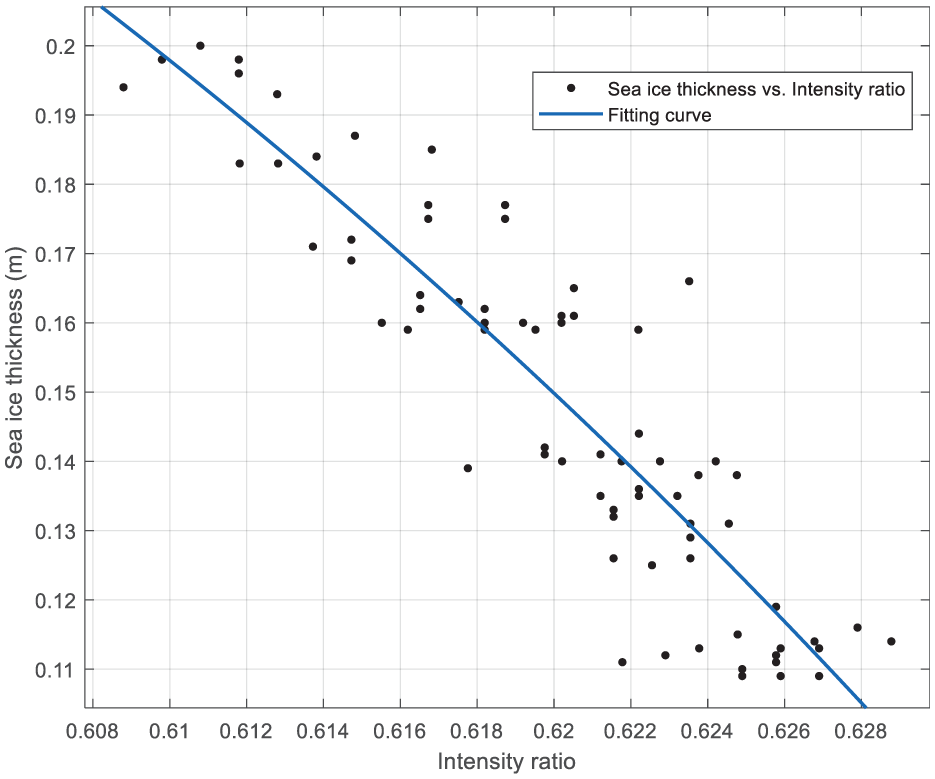
GPS reflected signal intensity ratio and sea ice thickness fitting results.
As shown in Figure 7, an empirical model (7) can be used between the inversion sea ice intensity ratio and the sea ice thickness observation data, and the parameter values obtained by training in the previous observation are
Based on the empirical model and model parameters, the intensity of the GPS reflected signal during sea ice observation is used to inverse the thickness of the sea ice. Figure 8 shows the thickness of sea ice obtained from the sea ice intensity ratio during the experiment, and its thickness is 10–20 cm. The inversion of sea ice thickness and the sea ice data provided by the Bayu Enclosure Marine Station are time-consistent. The sea ice thickness obtained by SAR is about 15 cm. By comparing estimated sea ice thickness for GPS with in-situ data, it shows that the sea ice thickness can be obtained effectively by GNSS-R method.
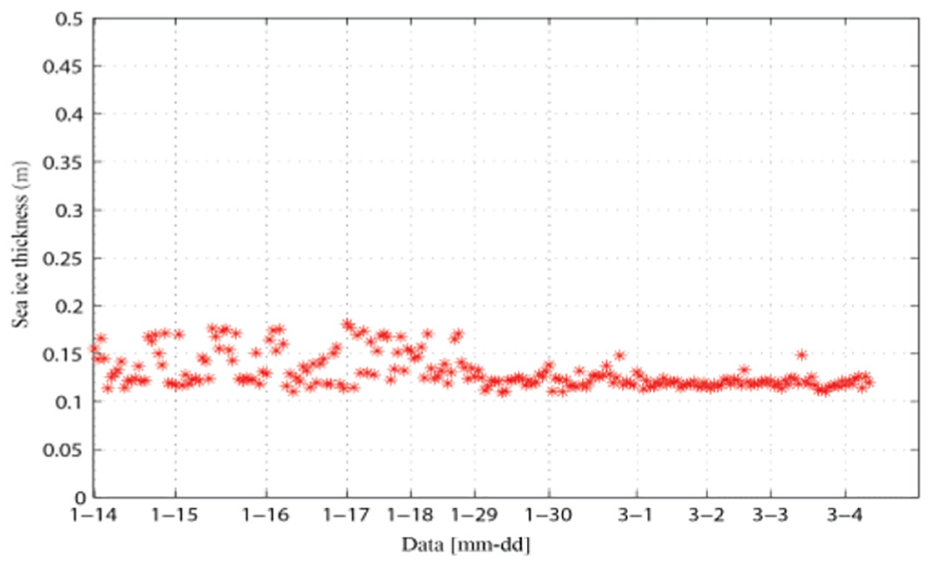
Trend of sea ice thickness change.
Conclusion
With the observation of GPS satellite under the shore-based GNSS-R, the paper proposes a sea ice thickness observation method based on the intensity ratio of GNSS satellite reflect signals. The method was verified by conducting a sea ice experiment in the Bayu enclosure of Yingkou City in 2016 and processing the GPS reflected signal data collected during the experiment. The results of experiment show that the empirical model proposed in this paper can effectively retrieve the sea ice thickness.
The sea ice thickness detection method based on the GNSS satellite reflected signal proposed in this paper can realize long-term continuous observation of the fixed sea area by reasonably erecting the antenna layout. It provides effective and reliable monitoring information for maritime transport and offshore operations. In order to further verify the versatility of the proposed method for sea ice detection based on GNSS satellite reflect signals, multiple experiments will be carried out in subsequent sea ice observations to comprehensively consider the influencing factors of different sea conditions to correct the model. The method can also be used in the field of soil moisture measurement and shore-based target detection, which provides theoretical basis and experimental support for the application of GNSS system in meteorology and oceanography.
Footnotes
Declaration of conflicting interests
The author(s) declared no potential conflicts of interest with respect to the research, authorship and/or publication of this article.
Funding
The author(s) disclosed receipt of the following financial support for the research, authorship and/or publication of this article: The research was supported by the National Natural Science Foundation of China (grant no. 41774028).