
Abstract
Aiming at the problem of continuous model updating for fault recognition in the time-varying process, a novel method called the Procrustes analysis–based Fisher discriminant analysis was proposed. First, each class of the training data was preprocessed by Procrustes analysis. Second, the new test data were aligned with each class of the training data by Procrustes analysis. Then, all the data were reduced to a low-dimensional space using Fisher discriminant analysis. Finally, the Euclidean distance between the test data and the training data after the Procrustes analysis was calculated, and the class recognition was achieved based on the discriminant principle of Fisher discriminant analysis. Two case studies show that the proposed Procrustes analysis–based Fisher discriminant analysis is superior to the traditional method based on Fisher discriminant analysis, and it can be used for fault recognition in a new and efficient way.
Introduction
Timely fault detection and accurate fault diagnosis of chemical processes are critical to guarantee process safety and improve production quality. The data-driven-based multivariate statistical process control (MSPC) techniques show superiority in industrial process monitoring.1–6 The faults may happen when a certain level of deterioration takes place because of equipment failure, sensor degradation, or extreme process disturbances.7,8 Fault detection, fault classification, and location are the critical aspects to monitor the system’s actual behavior. The fault type should be identified instantly once a fault is detected. To predict the fault type, the data-driven-based fault classifications have been the most popular and widely used technologies. In these methods, the data preprocessing and basic algorithm have a direct influence on the reliability of the extracted features and the monitoring performance.9–12
Once the fault detection models were constructed in the training step, their monitoring schemes were determined and were invariant to the process changes. Most existing fault classification methods, such as Fisher discriminant analysis (FDA),8,13–15 support vector machine (SVM),16,17 and fuzzy decision fusion system,18,19 can work well for many industrial processes. However, they always assume that the training set and the test set are in absolutely same experimental conditions and data distribution, whereas this assumption is invalid for most cases due to the characteristics of time varying even under the exactly same industrial process. In the real industrial process, the slow time-varying behaviors are generalized as catalyst deactivation, heat exchanger fouling, equipment and sensor aging, slow drift in process parameters, and so on.12,20 In such cases, the predefined monitoring model cannot match their corresponding online status. Thus, data shifting must be considered, and data adjusting should be previously managed for the actual process. To cope with changes in process characteristics, model maintenance or model updating is critical to maintain high monitoring performance after a period in operation. To interpret the natural changes and perform adaptive monitoring, many online modeling methods were proposed. One was to build the recursive or adaptive models to cope with the change of parameters or monitoring models.12,21–23 The local learning–based model was another widely used strategy, such as the just-in-time learning model, which integrated the traditional multivariate statistical method to treat both slow time-varying and multimode processes.24–26 Jin et al. 27 also proposed another local learning and support vector regression–based prediction model for nonlinear time-variant batch processes. Although these methods can be applied to tackle the online process changes, they have to consider the new collected samples and discount the old ones continuously, which may lead to large amount of calculation as the data matrices have to be updated iteratively. For the data-based fault classification, complex data preprocessing has always been carried out, such as to remove some noise, label samples, and mark outliers. Based on the processed training data, an exact and standard model which may match the process well can finally be built properly. Thus, the stable state of the process can be represented preferably by the data model. However, the model adjusting was implemented based on a small quantity of online process data, which may be doubtful as some unfavorable process disturbances may be collected into the updated models. As a result, the reliability of the adaptive model was not guaranteed.
It is mentioned that, despite the dissimilarity among the new collected samples and the training data, the underlying variable correlations of samples were exactly identical for the same process. Existing solutions focus on model adjusting rather than on giving a data relationship analysis between the modeling data and online data. To avoid updating the existing process model frequently and to utilize the available feature more efficiently, it is desirable to develop a reliable data matching strategy by adjusting the structure of the limited online data. Fortunately, Procrustes analysis (PA) is a method which focuses on such a problem by matching the data variable correlations from one set to another. The procedure of data matching and orienting is explored by PA. By minimizing a measure of shape difference optimally through successive iterations, PA can efficiently eliminate the influence of the data shifting. PA has been successfully used for statistical shape analysis and image alignment.28,29 Based on its competitive advantage, PA was used in this study as a preprocessing method in the data analysis to eliminate the data shifting caused by condition variations.
In this paper, a novel Procrustes analysis–based Fisher discriminant analysis (PFDA) algorithm was proposed to deal with data shifting for the dynamic process in fault classification. To improve the classification performance of FDA, the time-varying characteristic was taken into consideration by adjusting the limited online data, rather than updating the constructed model element continuously, which is difficult and time-consuming. Motivated by PA which identify the data deviations by comparing the shape distribution of the online data and the modeling data, the online data were aligned to the modeling data and the model parameters were updated for observations automatically. PA can be regarded as a pretreatment of the original data in order to obtain a better data change model as the basis for subsequent model learning. By means of this method, the data shifting in the dynamic process was successfully removed. Based on the proposed PFDA model, a fault classification scheme was constructed in this work by adjusting the online process data to make it fit the structure of the modeling data before performing FDA.
This paper is organized as follows: first, PA and FDA algorithms are briefly reviewed in the section “Basic theory”, followed by the algorithm analysis and problem statement in the section “Algorithm analysis and model construction”. The detailed fault classification based on PFDA is described in the section “Case studies”. Two case studies are given in the next section to illustrate the effectiveness of the proposed method. The conclusions are in the last section.
Basic theory
PA
PA is a form preprocessing method that is applied in the field of shape analysis of two or more configurations. The objective of the algorithm is to find a set of transformations to align the data shape to the targeted data by projecting the original data to a new space. The projection for a given set of data points
The centroid of each class is first calculated as the canonical shape, based on which, all the data are normalized and each configuration is shifted to the common origin.
The optimal alignment is computed in PA as the smallest sum of the squared distances among the data and their corresponding alternated configurations. The problem is translated to find the rotating

The translation essentially moves all the shapes to the common center. Finding a minimizer of this cost is what we aim at. Here,
Compute the transformation in turn by solving the least squares estimation of the transformation parameters (
The solution of the above optimization problem is handled iteratively.
30
Define
PA can be considered as the basis for subsequent model learning. By such processing, the local variation of the data set can be obtained well, and the data structure among different classes becomes distinct. In the fault recognition procedure, the alignment by PA is implemented for the training and test data. Different faults are aligned based on different standards; in other words, all the data samples are aligned with their corresponding mean vector obtained in the training process. After the preprocessing by PA, two steps are included for the fault classification. The first step is to build a model between the historical data and their related classes, based on which the fault type for the new collected samples can be predicted online in the next step. The first step relies on offline modeling using the recorded historical data, which include all of the required faults and the corresponding fault label.
FDA
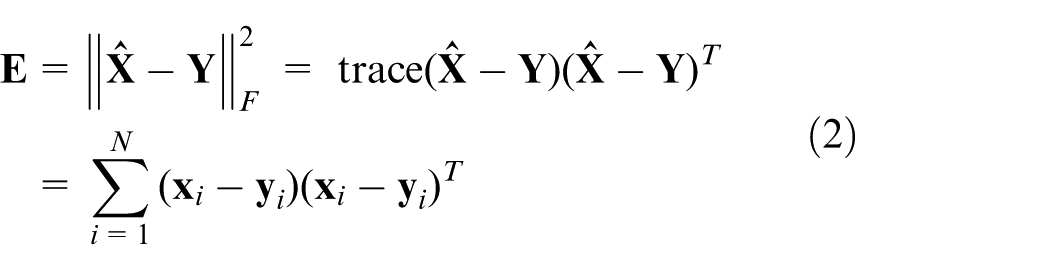
FDA is a popular supervised dimensionality reduction technique for pattern classification, with the objective that the between-class scatter maximized and the within-class scatter minimized simultaneously. Given the historical data,
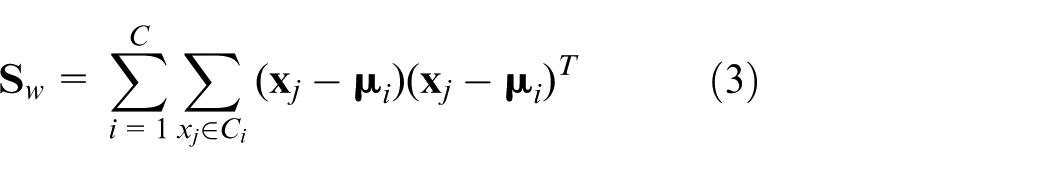
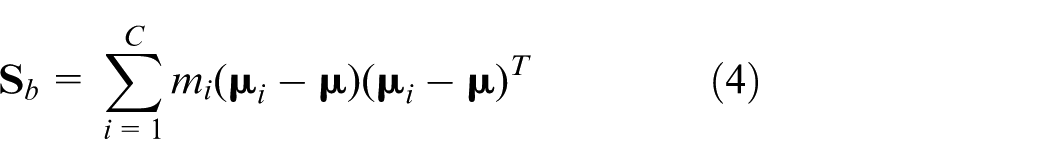
where
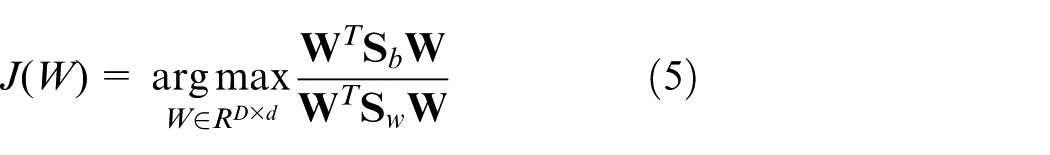
The Lagrange function of equation (5) is constructed as follows

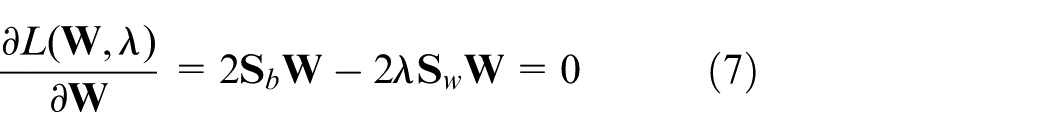
The optimal solution is performed by setting the partial derivative of equation (6) with respect to
Finally, the discriminate matrix

where
Algorithm analysis and model construction
As the changes of process input, abrasion of mechanic components, catalyst activity changes, production of different product quality grades, changes in external environment and so on occur, the process station starts to deteriorate real time scheduling performance, and thus the normal and the fault data are influenced. 31 To retain the classification accuracy at a desired level, fault recognition model was equipped with an adaptation mechanism which will change the process model to accommodate the current state of the process traditionally.
In the newly proposed method, each type of fault for test is aligned to the faults in the modeling procedure. As the process is time-varying, the training data and the test data which are collected in different times for the same fault are changing with different data distribution. Though the process is changing over time, these data waves at the current status were consistent with the modeling data.
In the actual process, the operation environment often exhibits slow variations. As the process characteristics change, the fixed historical model is not appropriate to describe the current process status, and a new model construction is difficult and time-consuming. To use the constructed model effectively and eliminate such influence, model updating or data adjusting that can automatically capture and interpret the real process is needed. The data distribution of the training data varies from the test data; however, the test data can be translated and adjusted to adapt to the distribution of the training data as they were collected under the same machine. As shift adaptation method, PA, which focuses on matching the data variable correlations from one set to another, is an effective method to solve such an issue. By minimizing a measure of shape difference by successive iterations, PA can eliminate the influence of data shifting perfectly as the newly collected samples were transformed and conformed to its corresponding model. For the dynamic process, the data variation at current operation is similar to the one in the historical process. To make use of such dynamic characteristic, the newly collected samples are first aligned with every historical fault sequence. The data with the same fault type are likely to be distributed with the same variation and minimized deviation. The fault type is the one with the minimized variance in such a way to minimize the difference between the online data and the remaining samples.
Case studies
To test the performance of PFDA-based model for fault classification, the adaptive method was tested on two examples. The first one is a simple example which was used for data demonstration and the model evaluation. The second is the Tennessee Eastman (TE) benchmark process, 32 which is based on the real industrial processes. The PFDA was applied to deal with the plant operating data mixed with both normal and various process faults. 33 In the case studies, we first constructed the classification model for the fault data based on the training data and then aligned the test data to the training data to optimally match the fault type. To compare the performance, the conventional FDA method–based process monitoring was also constructed. In this study, the model validation was also carried out by hold-out cross-validation. The training set used above was randomly divided into five separate subsets, and the validation was implemented by choosing one subset as the validation data iteratively until all of the divided data sets were processed. The above model training and validation were conducted for 20 times by forming the training data for different subsets.
Simulation example
A simple example was used to give an insight into the improved algorithm. The system is given by Dong and McAvoy. 34 This simulation system contains three variables which are driven by the same factor
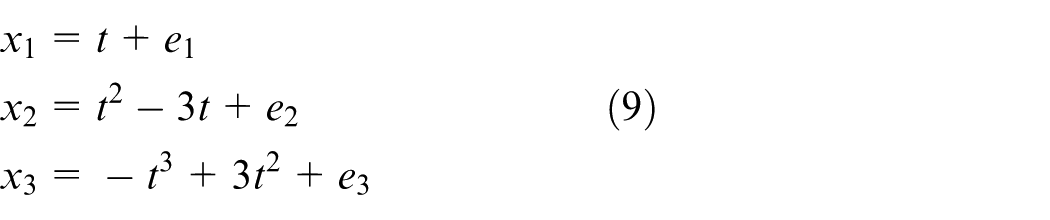
where e1, e2, and e3 are independent noises following the normal distribution: N(0,0.01). The random variable t is the system input which follows uniform distribution, t∈[0.01,1]. A total of 500 samples were generated for each kind of fault according to the following artificial faults:
Fault 1: t is changed to be normal distribution between 0.1 and 1.
Fault 2: A linear increase by 0.005 (k–5) was added to x1, where k is the sample number.
Fault 3: A step change by −0.5 was introduced to t.
We can notice that fault 2 and fault 3 have similar intrinsic geometry structures, as they are generated by linear transformation of the process parameter. The data structure of fault 1 is much different from the other two types of faults as the data distribution of the parameter t in fault 1 is totally altered. Figure 1 gives the data distribution of the three types of faults for the training data. From the figure, it is clear that fault 2 and fault 3 have the similar manifold. Fault 1 has the different manifold from the other two faults.
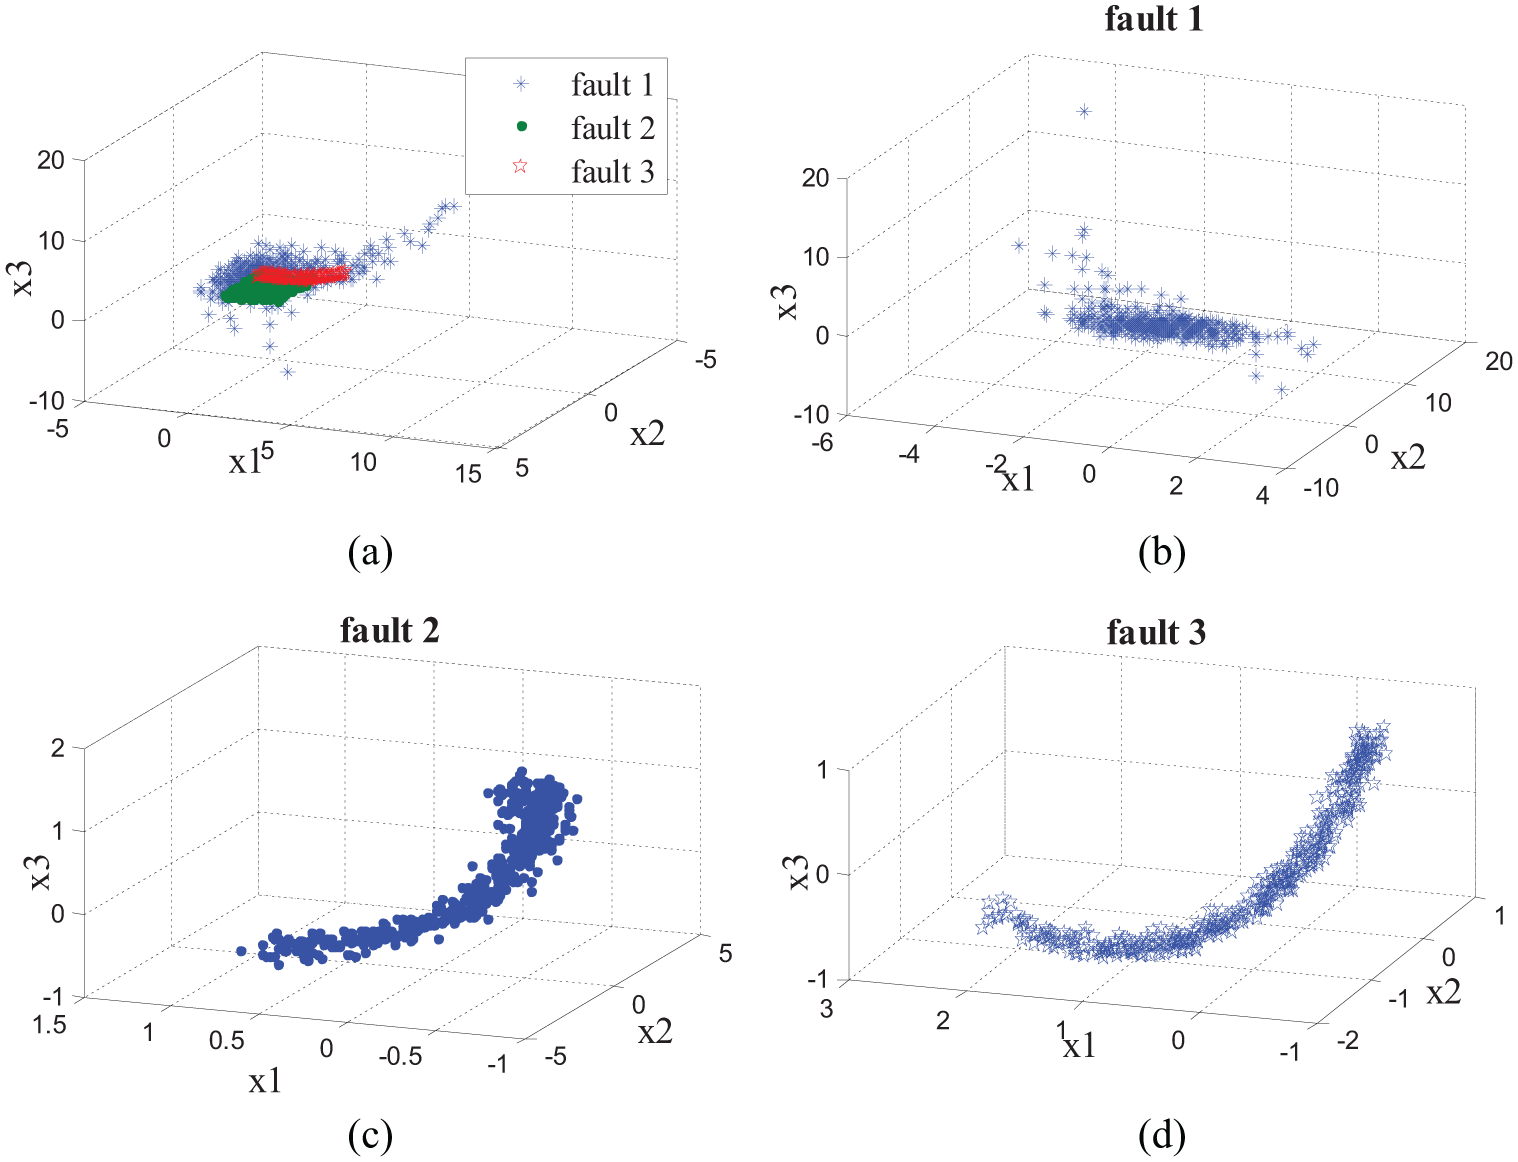
Three-dimensional data characteristic of three types of faults: (a) three types of faults, (b) fault 1, (c) fault 2, and (d) fault 3.
A total of 500 process data generated for each type of the process faults were taken as the training data. In order to simulate time-varying behaviors, a linear increment of 0.0005 was added to t after the operating mode had been carried out. Such types of fault data were stored as the test set. The data distribution of the fault data, including the train data and the test data, are given in Figure 2. It was noticed that the test data for all types of faults were distributed similarly with the distribution of the training data.
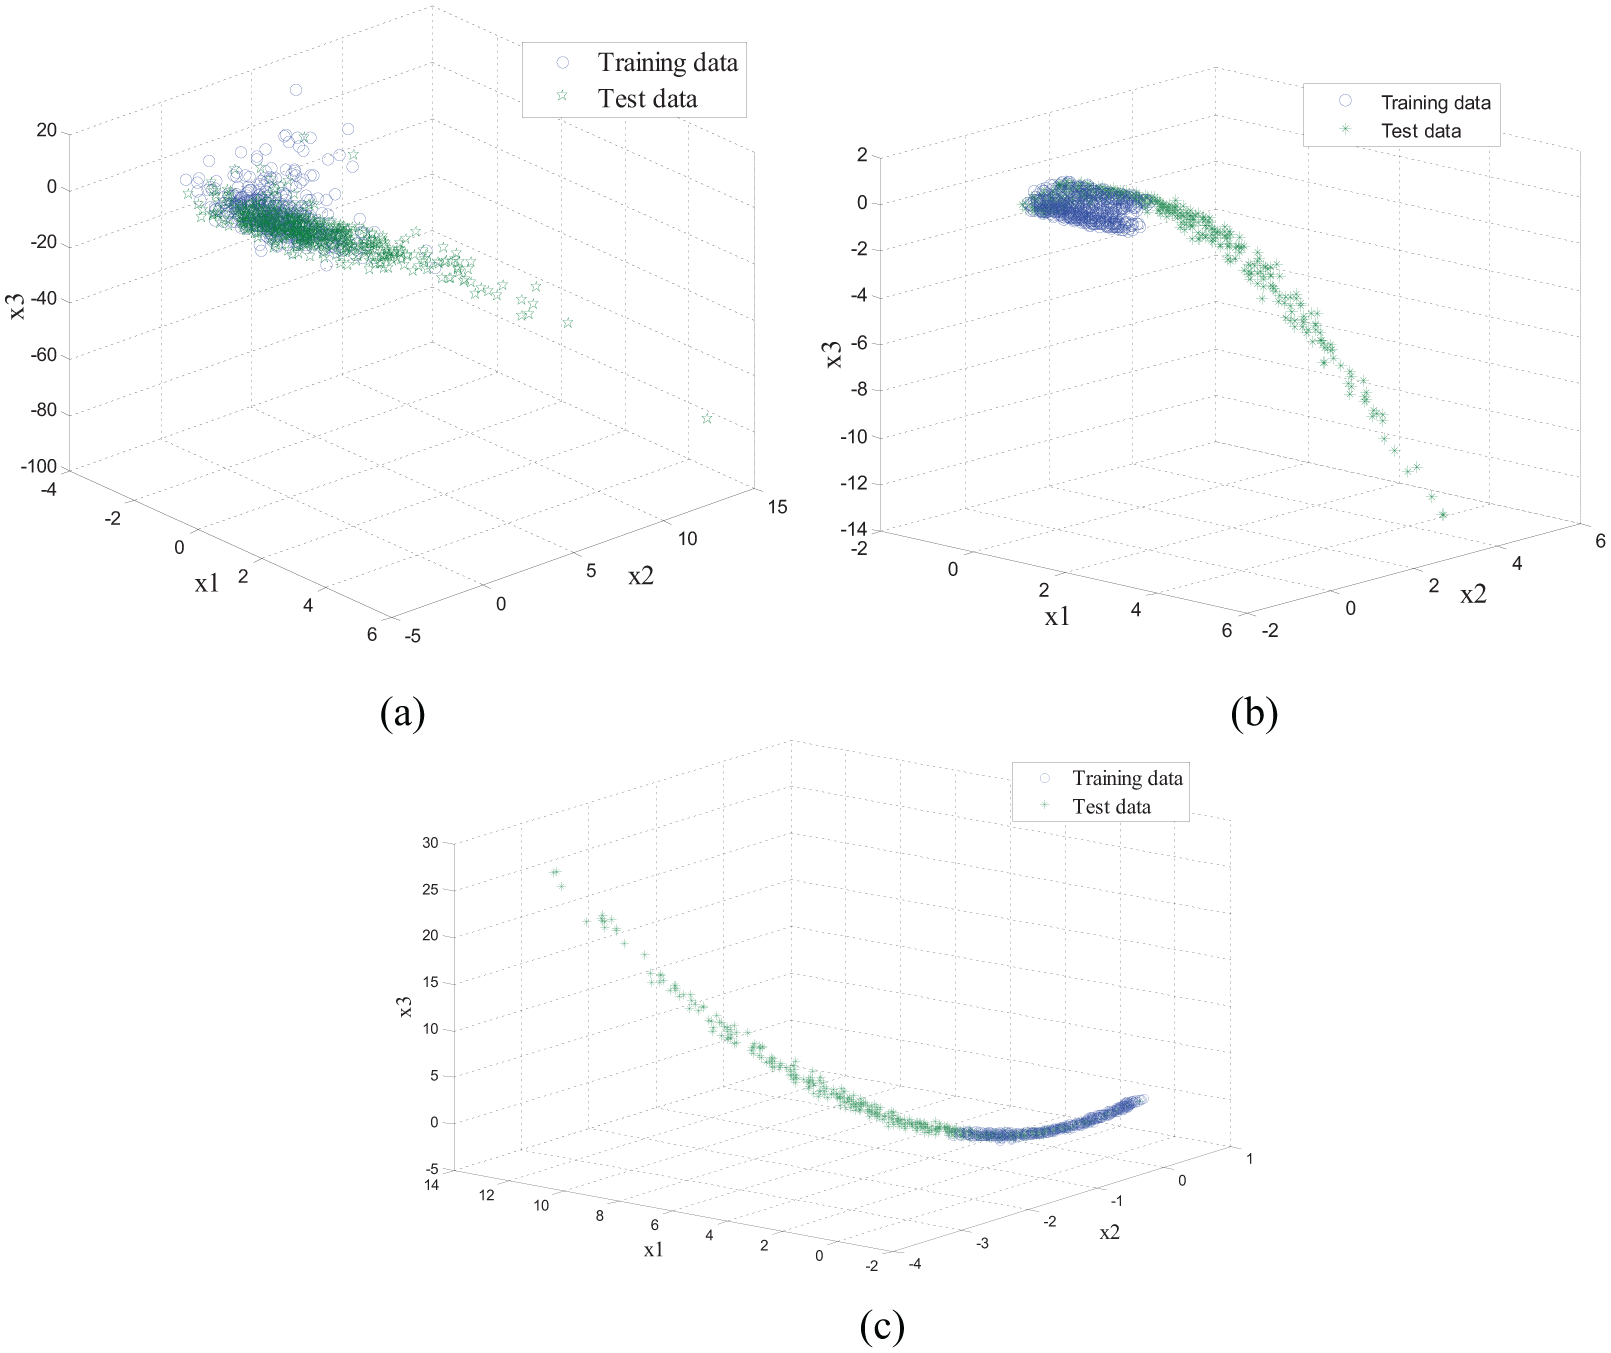
Three-dimensional data characteristic of three types of faults: (a) fault 1, (b) fault 2, and (c) fault 3.
For comparison, PFDA and FDA models based on all the faults process were constructed. The fault classification results for the test set are given in Table 1. It can be seen that the proposed method can improve the performance of classification efficiency for fault 1. After eliminating the influence of data shifting by the PA algorithm, the fault feature was clearly extracted, and the faults were discriminated easily. However, it cannot work well for fault 2 and fault 3. The PFDA gave the same or even worse performance than the FDA. As illustrated before, fault 2 and fault 3 were generated from the same manifold. The data sampled from the two faults may be aligned to another type of fault easily by rotating, compressing, or staining scale and translation vector in PA. Thus, fault 2 and fault 3 may be recognized as the same type of fault, as they were changed to the same standard feature after the PA procedure. It can be concluded that the improved method cannot discriminate the data with the same manifold.
The comparison result of fault classification.
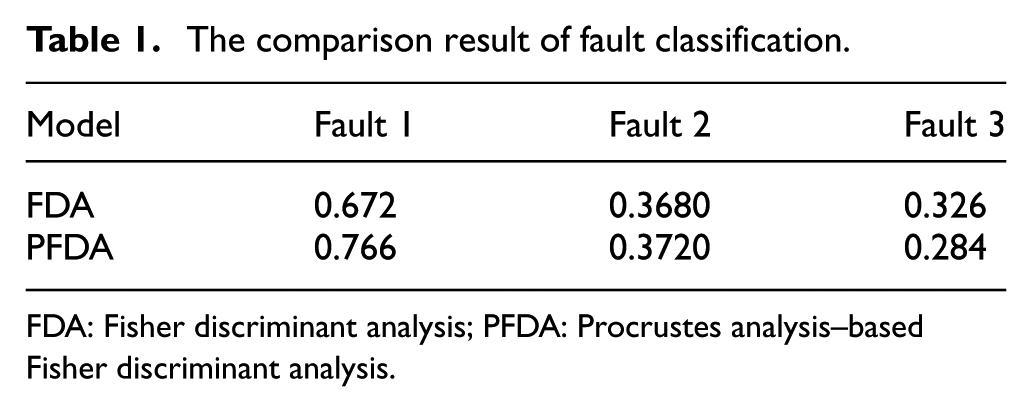
FDA: Fisher discriminant analysis; PFDA: Procrustes analysis–based Fisher discriminant analysis.
TE benchmark process
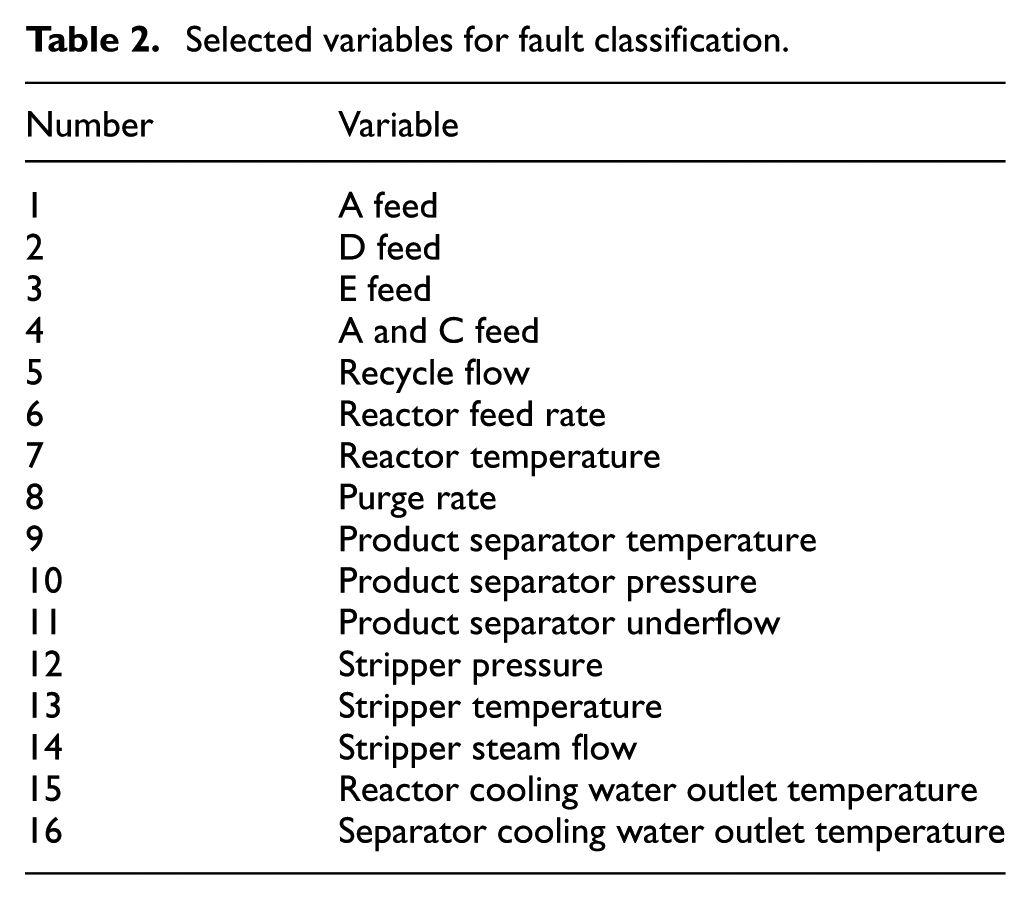
To further demonstrate the capability of the proposed classification method, the experimental data obtained from the TE process are applied in this section. TE process was proposed by Downs and Vogel 32 based on a realistic standard model of an industrial plant-wide chemical operation, which has been extensively applied to test and compare the performance of various monitoring approaches and control schemes. 35 The TE process is composed of a total of five major unit operations: a reactor, a condenser, a flash separator, a stripper, and a recycle compressor. There are four reactants: A, C, D, and E; two products: G and H; and one by-product F. The process flowchart with its implemented control structure is shown in Figure 3. In the process, 41 measured variables (19 composition measurements and 22 continuous process measurements), together with 12 manipulated variables, can simulate a wide variety of normal operating conditions and 21 types of programmed faulty conditions. In this work, a total of 16 continuous measurement variables which are closely related to the operation of the process are selected for modeling. 36 The variables are listed in Table 2.
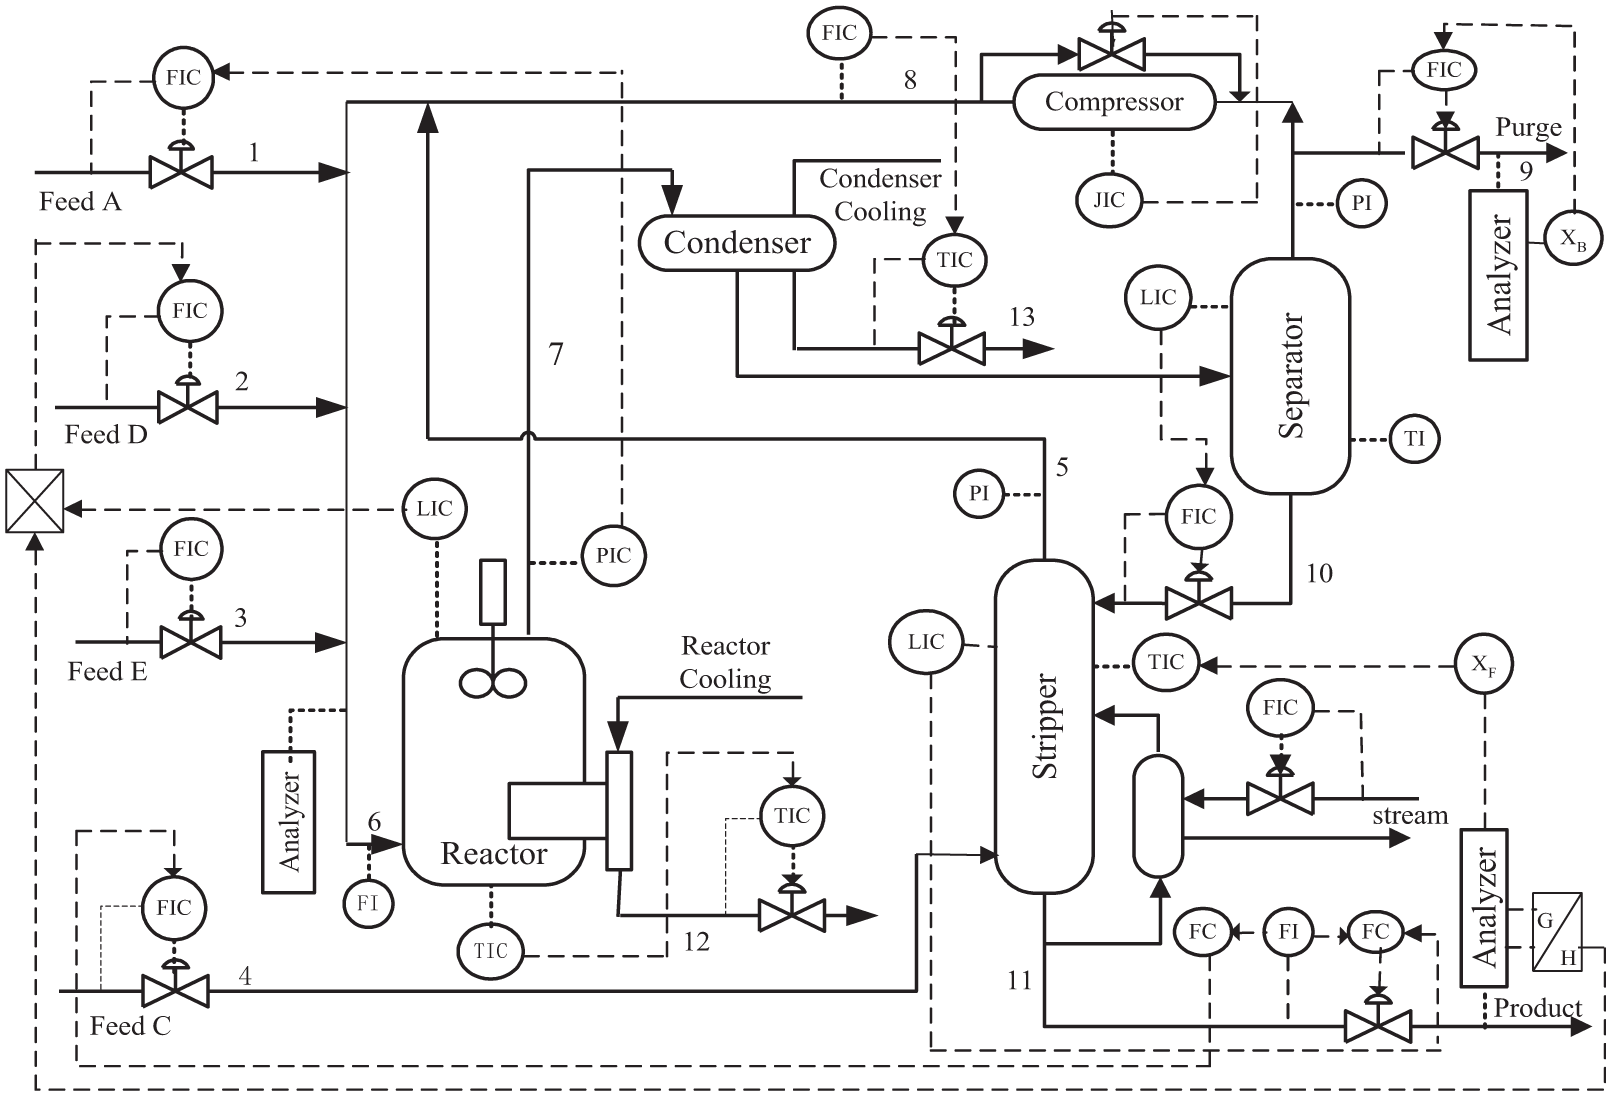
A diagram of the Tennessee Eastman process.
Selected variables for fault classification.
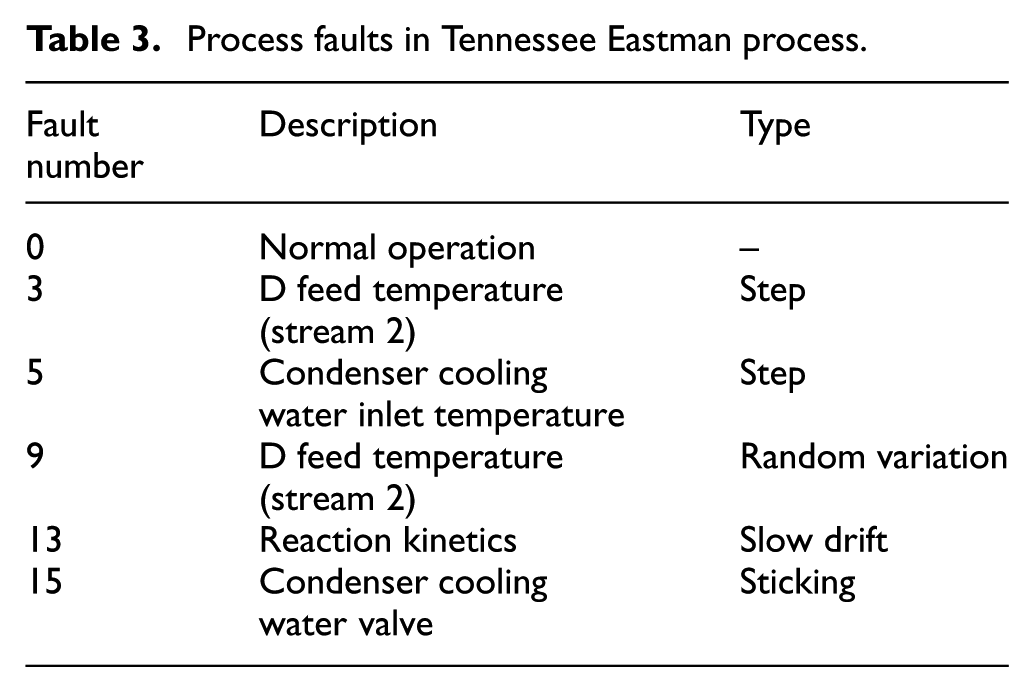
The historical data collected as training set are composed of normal samples along with multiple types of faulty data. In the modeling phase, five types of predefined process data are considered as the training data. Such five different types of fault data and the normal data are listed in Table 3. To compare the fault recognition performance equally, the same mapping dimensions are determined as 4 for all the methods. For PFDA, the value of k is selected as 40.
Process faults in Tennessee Eastman process.
To clearly illustrate the performance of PFDA for the process data with different data relations, the classification performance for the data within the same manifold is tested. The fault data which is collected under the same situation always are considered first. The data that were studied exhibit similar data distribution for the faults with the same type. A total of 500 data points for each type of fault are collected for the PFDA and FDA modeling. The classification result is given in Figure 4. From the figure, we can notice that PFDA and FDA give the similar classification result, and the monitoring performance is not improved by PFDA for the data with the similar manifold. That is because the data are collected under the same condition, in other words, the data have the similar distributions and are not changed as the time goes by. Hence, the basic assumption of the PFDA model is violated as PFDA just takes superiority for the updating data.
The classification result for the fault data with adjacent sample.
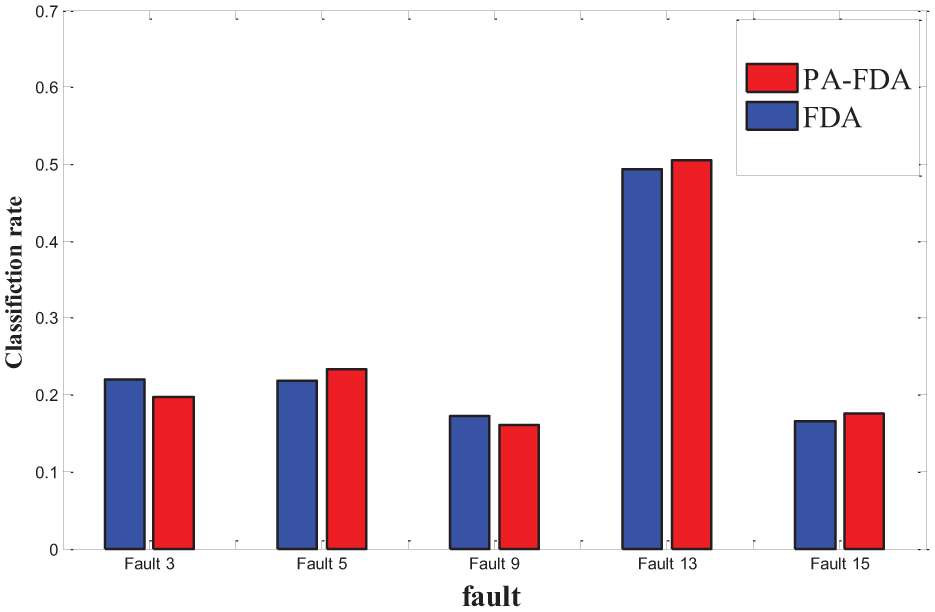
As the industrial process often exhibits some kind of time-varying behavior, the process data are changing frequency during its online operation. Thus, model adjusting needs to be implemented in order to track these changes. The monitoring performance of PFDA for the time-varying data is considered and tested in the case study. Five different types of faults which are updating during online operation were simulated. The training data consist of 500 samples for each type of fault acquired for model construction, which is collected from traditional process. The test data are updated as the process exhibits constant drift or changes which are not present in the training data set. The fault classification rate of PFDA and FDA are given in Table 4. Based on the presented results, it can be concluded that the PFDA model outperforms the FDA-based classification for most type of faults, especially for fault 13 and fault 15, and a large amount of improvement is obtained. This is due to the fact that PFDA carries out the data alignment for the time-varying process, in which, the fault data are gradually updated. In PFDA, the current process data will be adjusted to accommodate the historical faults. In contrast to PFDA, FDA is a linear and static process model; in other words, it just considers the similarity between the current data and the traditional data, without considering the process changing and data updating. Thus, compared with FDA, PFDA can easily and efficiently accommodate with the adaptive fault model and a high classification rate is obtained.
Classification result for the process faults in Tennessee Eastman process.
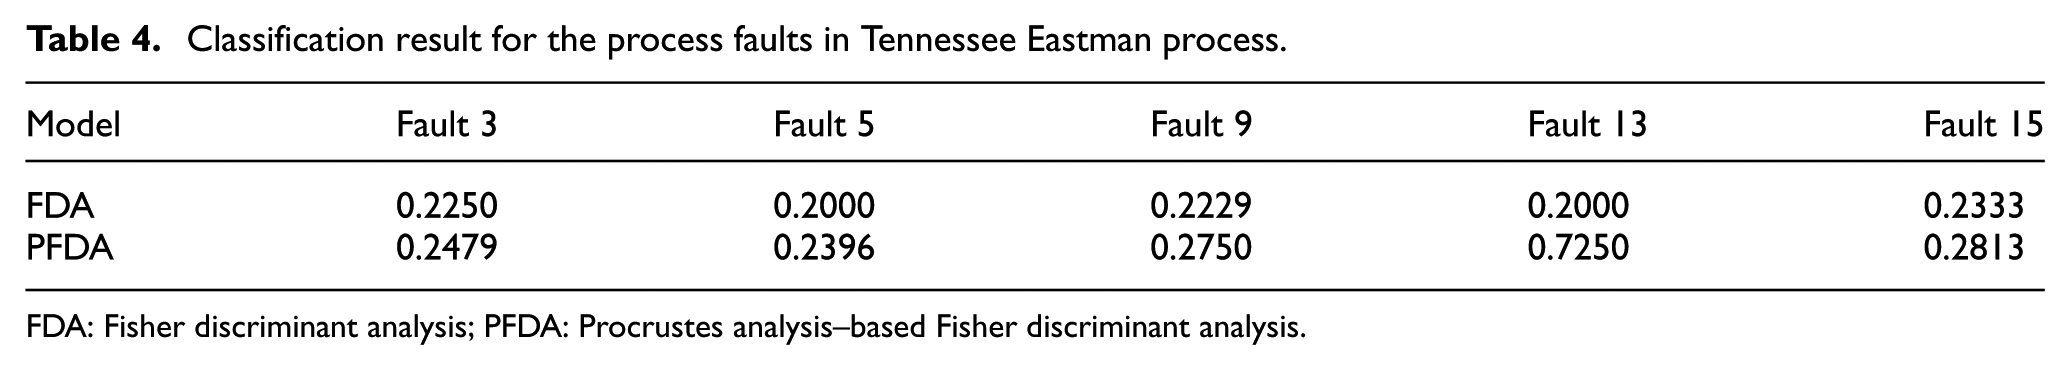
FDA: Fisher discriminant analysis; PFDA: Procrustes analysis–based Fisher discriminant analysis.
The accuracy obtained by 20 times hold-out cross-validation was 0.84 ± 0.03, indicating that the classifier trained using the improved method was robust for the fault classification, and furthermore, it also indicated that the prediction result using the test data set would be reliable.
Conclusion
An adaptive updating fault classification model based on PA and FDA models was proposed for time-varying process. The main conclusions were as follows: the accuracy of the PA-based FDA model was higher than that of the FDA model without PA preprocessing, and the classification accuracy was greatly improved, which was much more satisfactory than the results of the original FDA models. The accuracy of the FDA models was improved by PA preprocessing for the fault classification of the TE process, and the best classification result, with an accuracy of 72.5%, was obtained. The above conclusions showed that the FDA technology could be improved using the PA preprocessing, which can be readily applied to the fault classification of the actual process. Further studies are expected to conduct more research on how to improve the robustness and universality of these discrimination models using more varieties or samples, comparing the impacts of different feature extraction method, constructing some standard discrimination models, and so on.
Footnotes
Declaration of conflicting interests
The author(s) declared no potential conflicts of interest with respect to the research, authorship, and/or publication of this article.
Funding
The author(s) disclosed receipt of the following financial support for the research, authorship, and/or publication of this article: The research was funded by the National Nature Science Foundation of China (NSFC; grant no. 61763049); the Postdoctoral Science Foundation (grant no. 2018M643358); the Science and Technology Plan of Applied Basic Research Programs Foundation of Yunnan Province (grant no. 2017FB096); the Project of Guangdong Province Support Plans for Top-Notch Youth Talents, China (grant no. 2016TQ03N704); the Pearl River S & T Nova Program of Guangzhou, China (grant no. 201610010157); the Planned Science and Technology Project of Guangdong Province, China (grant nos. 2016B020202008 and 2017B010117012); the Planned Science and Technology Project of Guangzhou, China (grant no. 201704020076); the Key Laboratory of Spectroscopy Sensing, Ministry of Agriculture and Rural Affairs, P.R. China (grant no. 2018ZJUGP001); the Natural Science Foundation of Guangdong Province, China (grant no. 2016A030310235); and the Innovative Project for University of Guangdong Province (grant no. 2017KTSCX099).
Availability of data
A.M. and other co-authors allow readers to use any of the data in the manuscript.