
Abstract
In this paper, an automated inspection system is proposed for detecting the location and measuring the size of existing dipping or buckling on the sandwich panel surface using an RGB camera and an inexpensive linear laser. The proposed method, by observing the radiated laser beams on the sandwich panel surface, can localize and calculate the level of dipping and buckling with acceptable accuracy while being robust to vibrations of moving sandwich panel on the production line conveyor. After a complete processing of the panel by the system, a three-dimensional (surface plot) or two-dimensional (heat map) output is produced to assist the production line supervisor to easily inspect the surface quality of the sandwich panels. Our experimental results show that the proposed system can detect and measure the surface defects including dipping and buckling with a high accuracy and performance.
Introduction
The sandwich panel manufacturing industry is of crucial importance around the world. The sandwich panels are used in production of the fixed and portable Conex boxes, sustainable prefabricated buildings and prefabricated sanitary units in the world. Compared to other industries, designing an automated inspection system for this industry has many unique challenges. Considering the production of the sandwich panels in custom dimensions and characteristics, the parameters and setting of the line production are changing continuously. Hence, the definition of a fixed set of instructions and constant settings that the production line can work optimally and with a desirable quality are not practically possible.
Also, unlike most of the automated visual inspection systems that control the quality of discrete productions (such as auto production line and food industry), the production line of sandwich panel is continuous, and the products with variable dimensions and specifications (depending on the customer order type) are manufactured continuously involving various operations at separate stations (such as forming and injection). Some instances of inspection and quality control of the sandwich panel production process are the quality inspection of painting and thickness, metal sheet bezel and fracturing inspection before manufacturing, cellophane cover on sheet as ordered, correct shaping of sheets in forming station, adapting the molds width with the specified width in the customer order, double belt alignment with forming and coil holders, and lack of dipping and buckling on the sandwich panel surface. Also, the examination of the thickness, width, angle, and density of the produced foam to meet customers’ demands is of crucial importance. These items are performed in five stations of forming, injection, double belt, cutting, and packaging.
Diagnosing the physical problems of foam plates (Figure 1), such as bending, buckling or dipping, is of crucial economical importance in the initial stages of production. The precision tool systems are traditionally costly and using them involves modifying the production line. In this work, we try to solve these challenges by inexpensive hardware and employing techniques of image processing, computer vision, and machine learning. Therefore, in this paper, our main goal is to design a system that has acceptable precision as well as affordability. Furthermore, we aim to provide the possibility of checking the sandwich panel’s quality with no or little modifications in the production line.
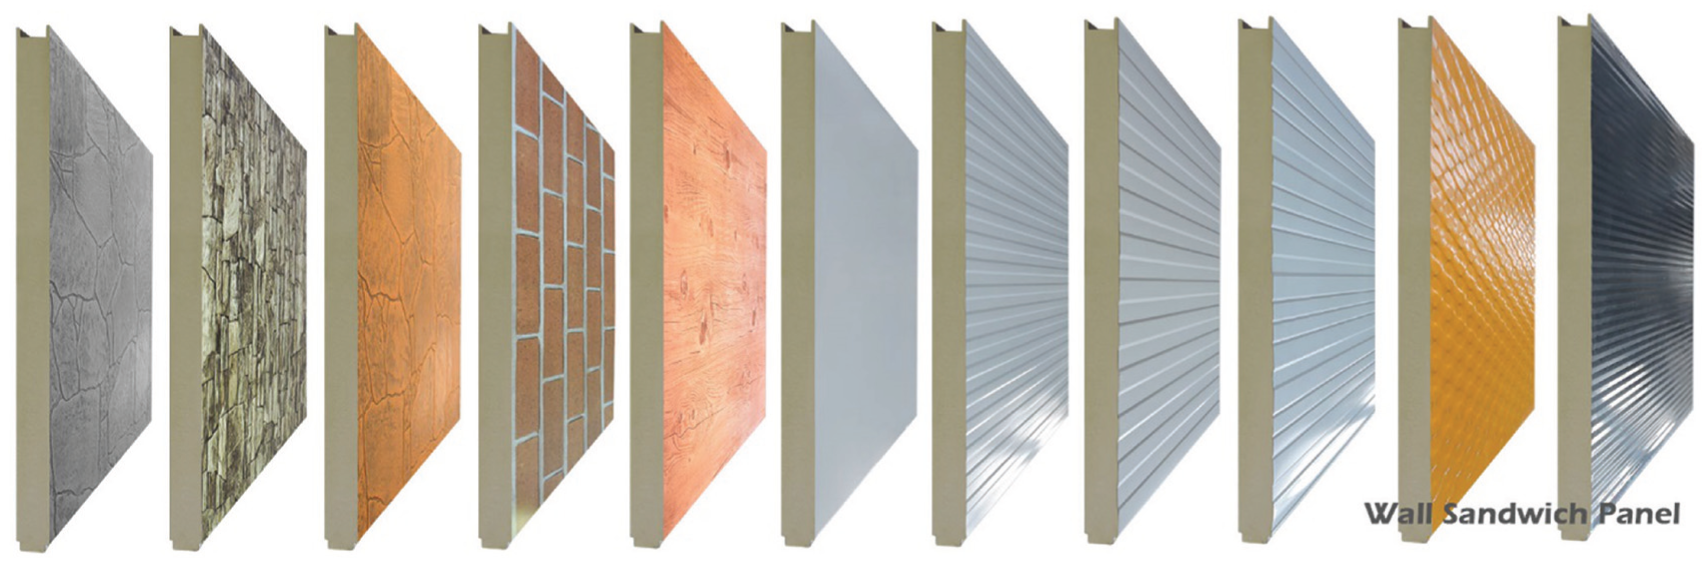
Samples of sandwich panels.
Since an extensive set of variables affects the production of sandwich panels and, to the best of our knowledge, there is no comprehensive study about the usability of computer vision and artificial intelligence methods for quality control of the sandwich panels, this paper only focuses on detection of the dipping and buckling on the surface of sandwich panels as an initial phase of designing and implementing a comprehensive automated visual inspection system.
Literature review
In recent years, some methods, which employ computer vision and image processing techniques, have been proposed for detection of surface defects of products in industrial and commercial applications. A group of the proposed methods is based on statistical characteristics. For example, properties of statistical histogram are used to diagnose the surface defects of steel strips. 1
Among other statistical methods, gray level co-occurrence matrix2,3 and morphological operations4–7 have been used for quality inspection of surfaces. Recently, a method based on multivariate image analysis, which is based on multivariate statistical analysis, has been proposed for detecting the metal surface defects. 8 In statistical methods, usually the existence or absence of a defect is determined and no further information is given about the location and status of the defect.
On the other hand, there is another category of methods which are based on frequency domain analysis such as Fourier analysis9,10 and Gabor transform.11–13 There is also a subset of frequency-based methods, which uses the wavelet analysis to identify the defects and cracks on the surface.14–17 The main drawback of the methods in this category is that they often need to perform complex transformations to frequency domain and therefore may have low performance.
Another category of the existing methods is model-based which in particular uses fractal geometry.18–21 In these methods, due to the lack of a standard modeling process, model design and construction are rather difficult.
There is also another kind of the proposed methods which attempts to solve this problem by employing machine learning and artificial intelligence techniques alone, or sometimes by combining them with previous methods. 22 Jiuliang et al. 23 proposed a fuzzy expert system to assess the steel strips surface quality which consists of six components. A monitoring system was proposed by Zheng et al. 24 for detecting the metal surface defections, which in particular could detect the cracks and existing gaps on aluminum surfaces. The accuracy of their solution, which is based on morphological operations and genetic algorithms, is reported to be near 91%. Jia et al. 25 proposed another solution for detecting the defects on steel sheet surface. Their real-time solution employs support vector machines and is capable of detecting the defects with an accuracy of 94.4%. In another approach, Lee et al., 26 by employing a neural network and the energy and entropy characteristics calculated using adaptive wavelet packet expansion, designed a system for detection and classification of various defects on steel sheet strips. Their solution performs with a reported classification accuracy of 99% and is capable of detecting several different defects such as scratches.
Surface defect detection is also used in other industries such as textile and is not limited to metal industry. 27 For example, Kumar and Shen 28 proposed a system that can detect and classify fabric defections using support vector machines and principal component analysis. They claimed that their solution can also be used in ceramic industry. Another proposed solution by Elbehiery et al. 29 employed simple image processing techniques such as edge detection and morphological operations to detect the existence of defects on ceramic tile surfaces.
Method
Detection of abnormal dipping and buckling on the sandwich panel surface
Since the aim is to scan the surface of the panel and extract the three-dimensional information for detecting the dipping and buckling, using the portable laser scanners and RGBD cameras such as Microsoft Kinect are proposed as a first option to solve this problem. However, due to the fact that sandwich panel on the production line conveyor is moving during inspection, our proposed system employs a simpler and more affordable technology that checks only one horizontal band of the panel at any moment and gives the result of inspection as a surface image to the production line supervisor after the full scan of sandwich panel. In this system, a combination of a simple RGB camera (with a 4-mm focal length) and a linear laser (MW Red5) is used (Figure 2, bottom). The advantage of using RGB camera as opposed to gray-scale camera in the proposed setup is that locating laser beams, as described in the following sections, can be facilitated by incorporating color information. The linear beam of laser is vertically radiated on the surface of sandwich panel from above, and the image of the laser beam which is in the field of view of the camera is analyzed for any curvature and irregularity. Finally, by using a calibration method, the curvature of the laser beam is mapped to the size of the dipping or buckling in millimeters in order to give a better understanding of the inspection result to the human supervisor. As can be seen in Figure 2, the physical structure of our proposed system could be installed on the existing production line so there is no need to apply any modifications in the production line.
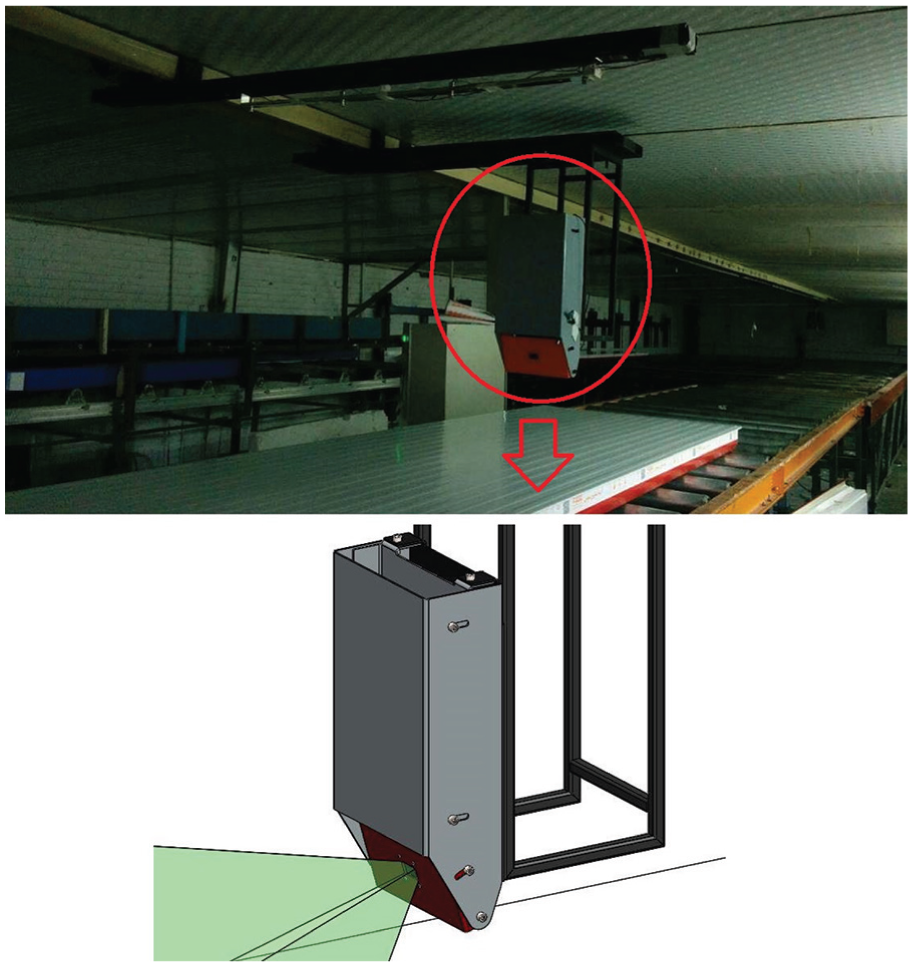
Top: The complete designed system, which consist of the camera and the laser, after installing it on the ceiling at the production line. Bottom: The design of camera station with two degrees of freedom of movement eliminates the installation error using oval bolt.
The proposed method consists of four main components as follows: (1) camera calibration for eliminating the distortion in the images taken by camera, (2) locating the laser beam in the image, (3) localization of the curvatures of laser beam on the surface of sandwich panel, and (4) perform a mapping from the curvatures to the size of dipping or buckling in millimeters. In the following subsections, first the physical structure of the proposed system is described, and then each component of the proposed method is briefly explained.
Mechanical structure of proposed system
To prevent the vibrations of the production line disturbing the vision component of our system, and also for the purpose of easy installation and reduction of occupied space, the camera and laser are installed on the ceiling. The distance between the camera and the laser is determined based on several factors including the desirable accuracy of defect detection, the distance of the production line to the ceiling, the initial angle of the camera, the field of view and resolution of the camera, and the thickness of the panels. Small angle of view in the camera results in a more accurate detection of the surface defects.
The designed structure has six degrees of freedom for free adjustments. This feature helps to adjust the camera alignment with the production line with a high precision. Figure 3 shows the degrees of freedom of the camera structure. In addition, creating perpendicular gaps, instead of holes, in adjacent surfaces of the structure results in the ability of structure adjustment.
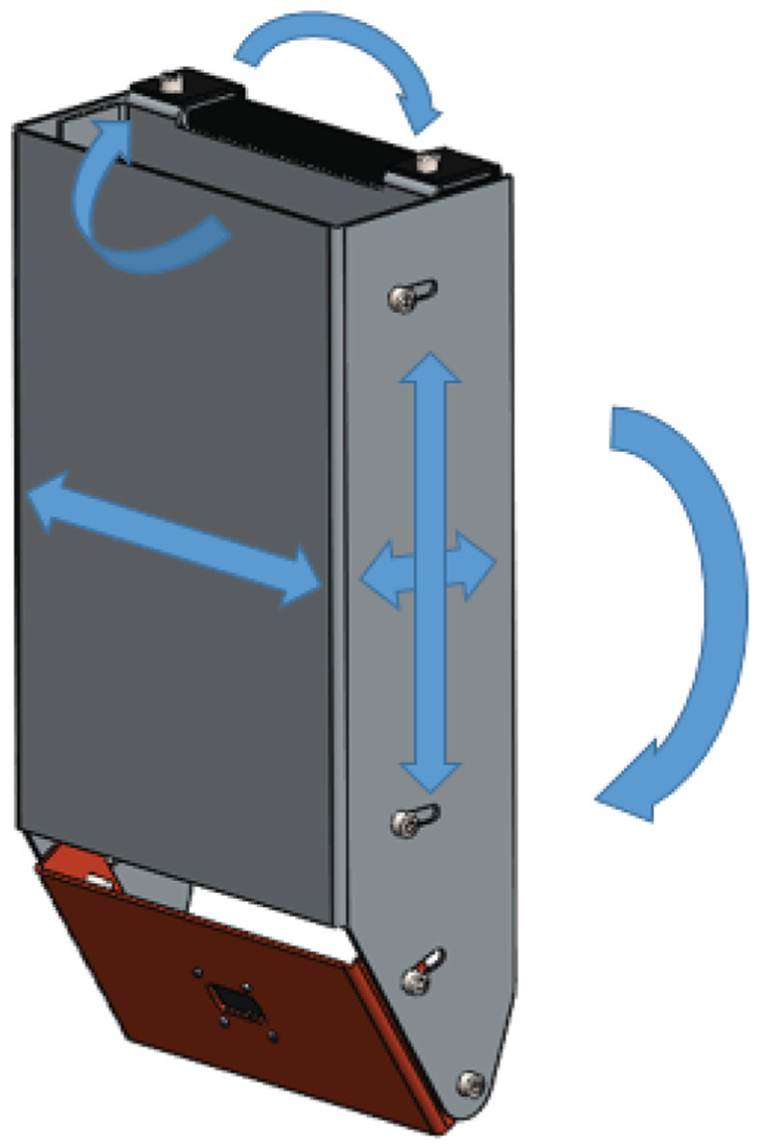
The degrees of freedom of the camera structure.
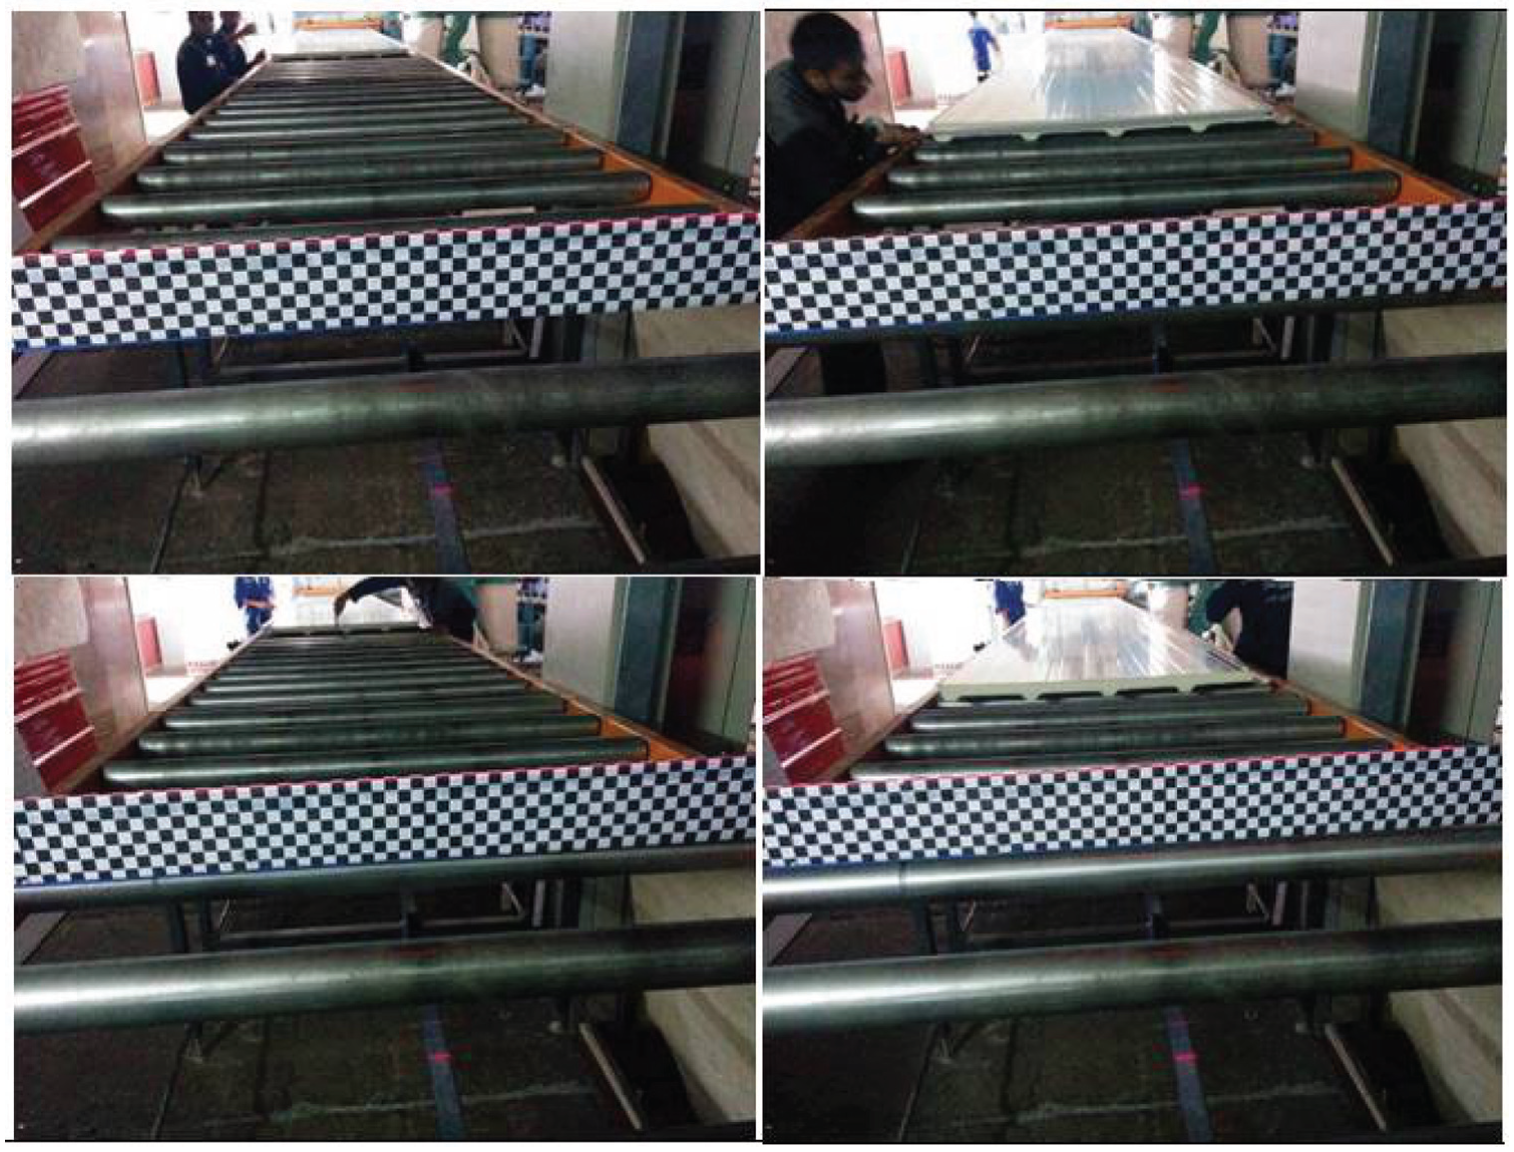
In addition, the adjustability of the camera’s angle of view helps to provide the possibility of positioning a laser beam in the middle of the camera’s field of view according to the thickness of the manufactured sandwich panels (Figure 4).
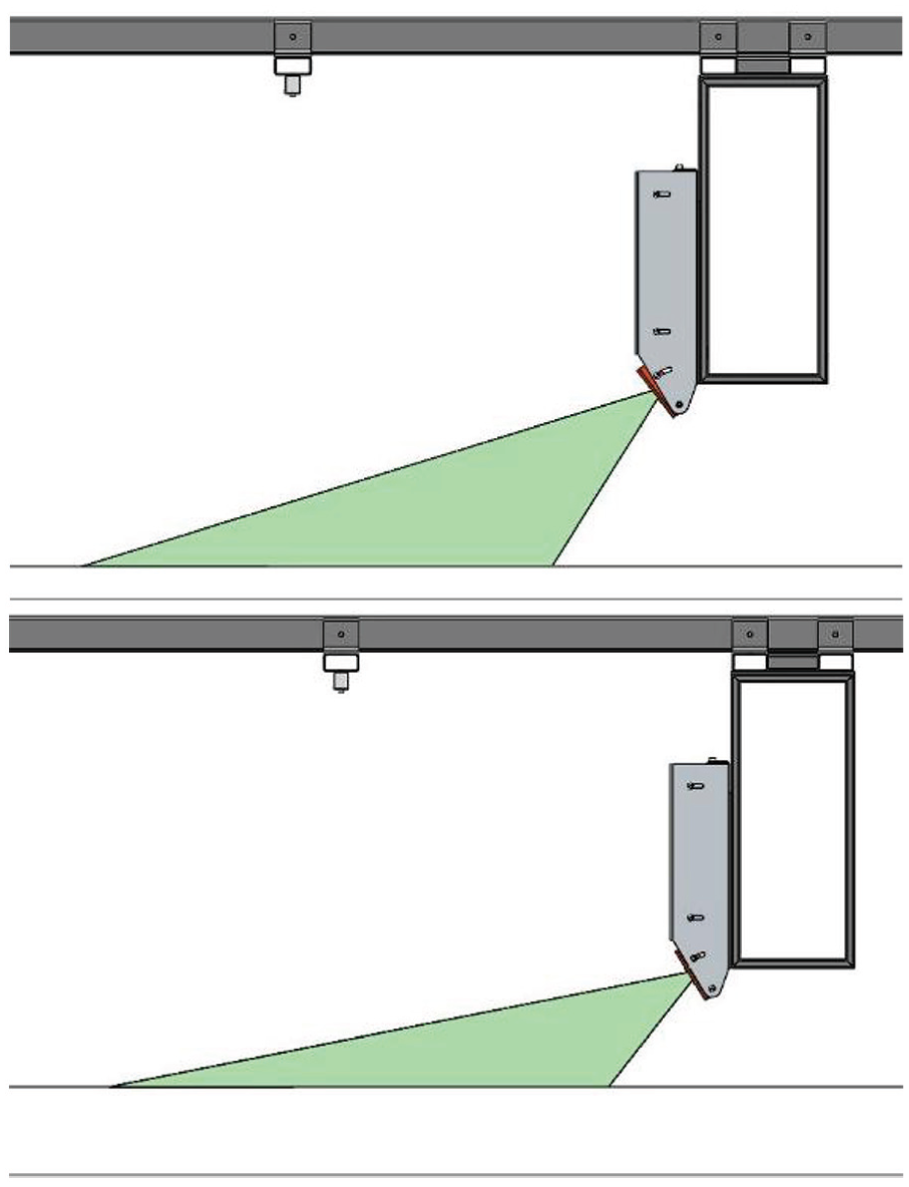
Top: The angle of 52° between the camera direction and the laser line for the panel of 7 cm thickness. Bottom: The angle of 59° between the camera direction and the laser line for the panel of 20 cm thickness.
Camera calibration
Due to distortion of the lenses used in the cameras, the images produced by most of the existing cameras have abnormal curvatures and distortions. This means that a straight line in the real world is seen as a curved line at the camera’s viewpoint. Since our proposed method works based on the curvature measurement of the laser beams radiated on the surface of sandwich panel, this problem should be solved before any further processing of the images. To solve the problem, first the employed camera is calibrated to determine the camera’s intrinsic parameters. For this purpose, various images from different angles are taken from a standard object with a chessboard pattern, and then the camera parameters are determined using calibration methods30,31 (Figure 5). Using the specified parameters, which include two parameters (k1, k2) of the distortion model of camera, the distortion of the images produced by the camera is corrected according to the following equations


where

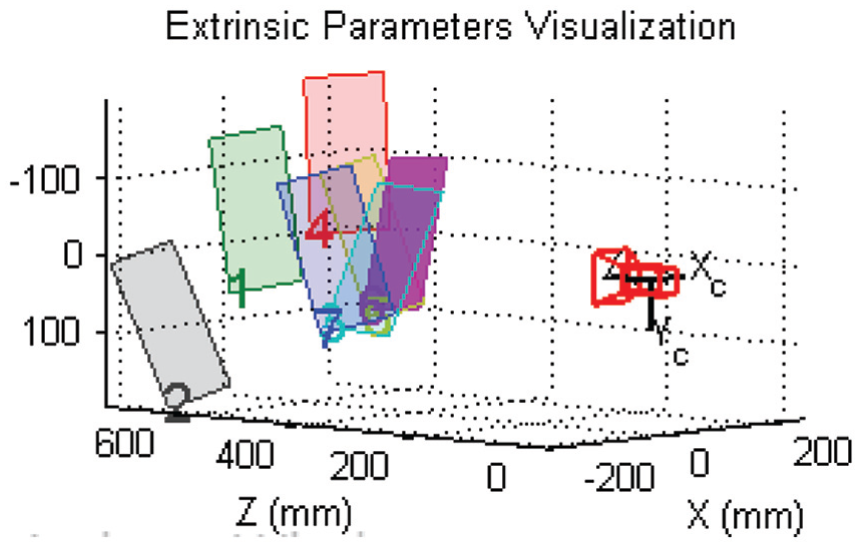
All extrinsic and intrinsic parameters of the camera are determined in the process of camera calibration based on the images of a standard object.
Locating the laser beam in the image
After the initial calibration of the camera, the system should be able to detect the laser beam in the images captured by the camera. The beam of the laser is very bright, and therefore, in the normal working mode of the camera it causes the full saturation of the light-sensitive sensor of the camera. By setting the light exposure time of the optical sensor of the camera, we make the image so dim such that the sensor is no longer saturated. As shown in Figure 6, increasing exposure value (according to equation (4)) and consequently decreasing exposure time, the extra amount of light in the environment and noise are significantly reduced while laser beam becomes brighter than the image
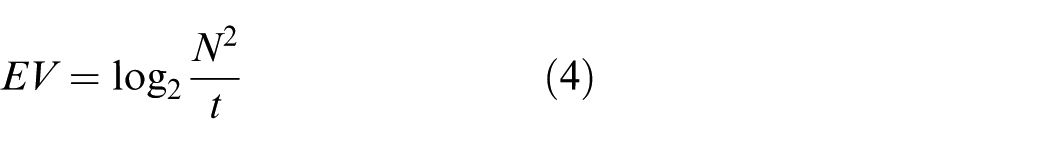
where
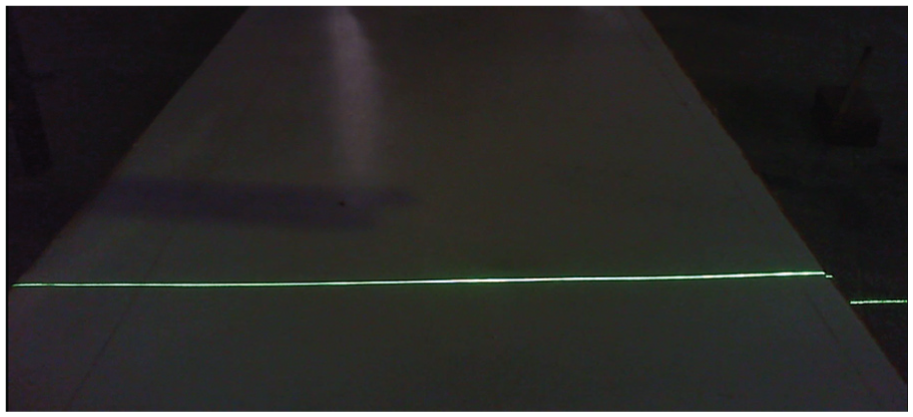
A sample image taken by camera with low exposure time.
It is worth mentioning that in an environment where the ambient light is high, considering the fact that the camera functions in the visible light spectrum, physical cautions should be exercised to control the ambient light since the reflection of the ambient light from the surface of the sandwich panel that is being analyzed could create significant challenges for the system (Figure 7).
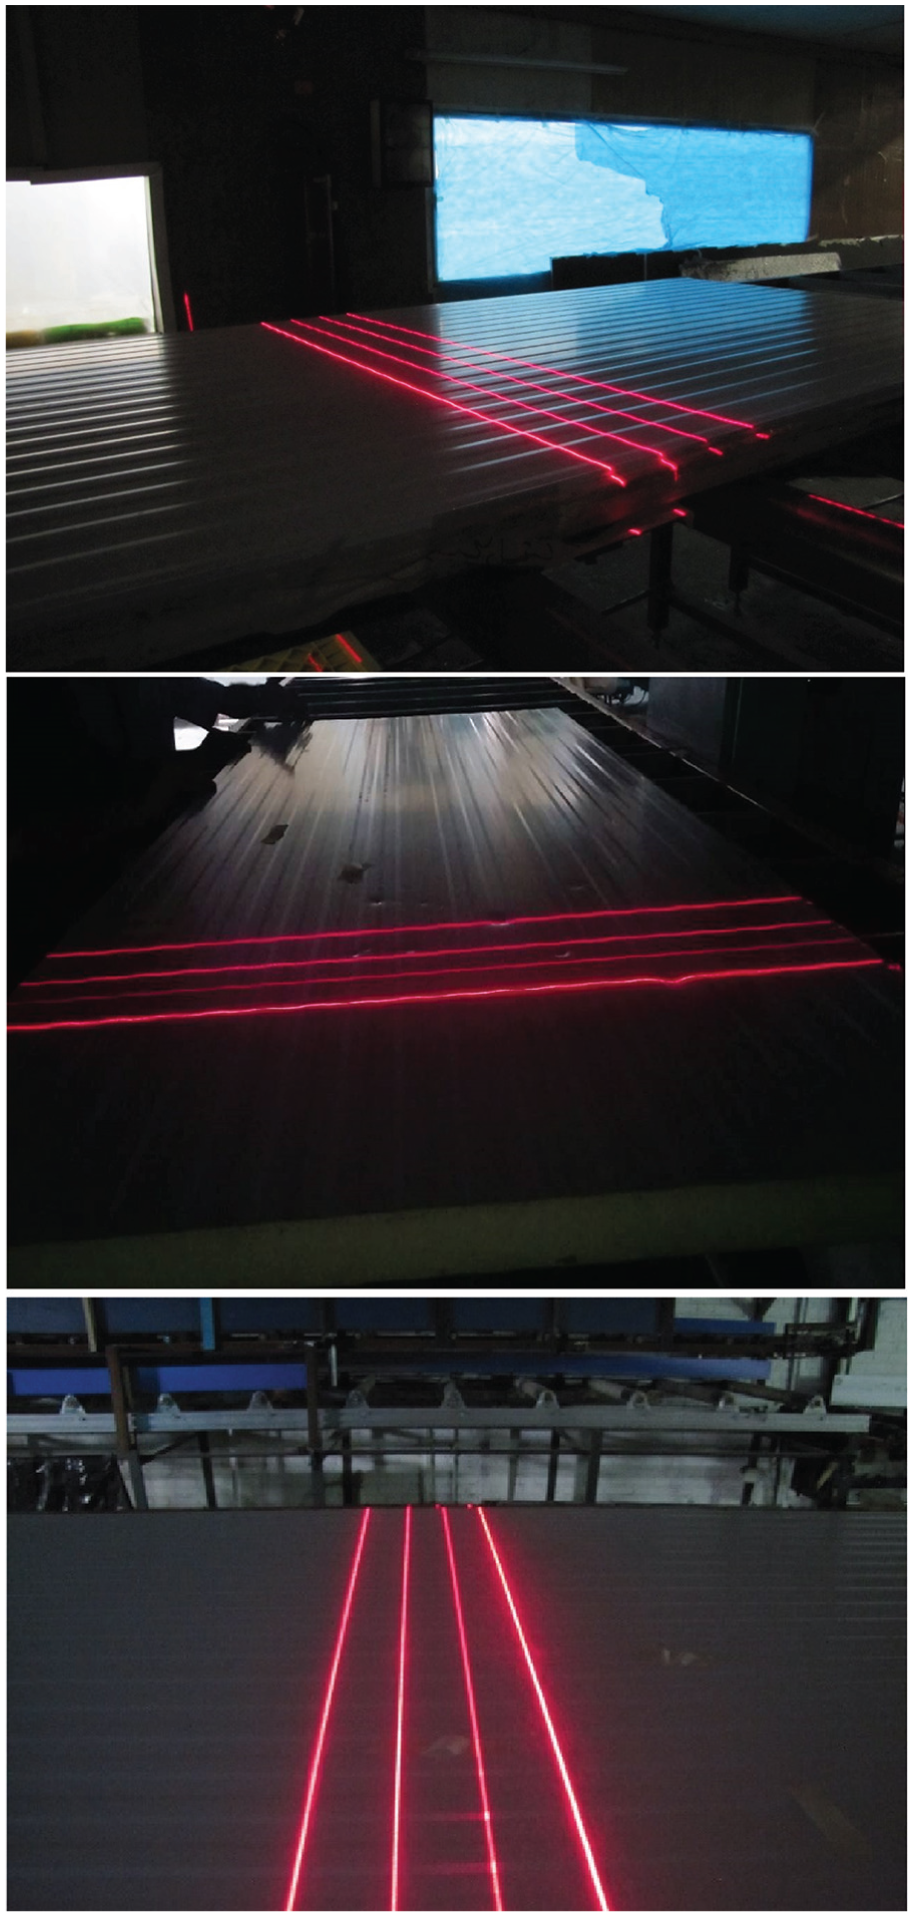
The laser beams from various viewpoints under various lightening conditions.
Considering the various sandwich panels of different thicknesses, since the laser beams in the image are located in a bounded area in the image, it is not necessary to process the whole image for finding the location of the laser beams and therefore only a pre-specified portion of the image which includes the laser beams can be analyzed. Applying a threshold
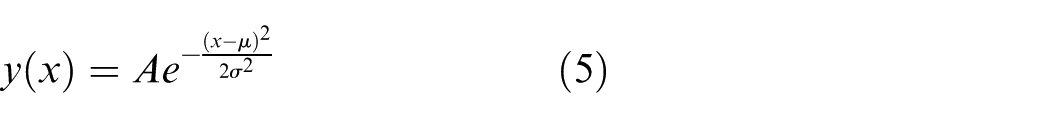
We intend to design a very high precision method that can detect the slightest curvatures of the laser beams to detect the dipping and buckling on the surface of sandwich panel. Therefore, the method used in our proposed system goes beyond the simple solution above and tries to find the location of laser beam with a sub-pixel precision in the image. Since, the thickness of the laser beam in the image is larger than one pixel and the vertical slices of the laser beams usually have local maximum, the proposed method attempts to obtain a continuous and sub-pixel precision for localizing the laser beams by analyzing the intensity of the laser beam’s neighborhood pixels. For this purpose, for each pixel in the laser beam image (obtained from applying the threshold
In the optimal fitting of Gaussian function, since gradient descent (or ascent) method is susceptible to be stuck in the local maxima, selecting a proper initial guess for the parameters of Gaussian function could significantly result in better fitting accuracy and speed.
In our proposed system, the initial value of Gaussian center
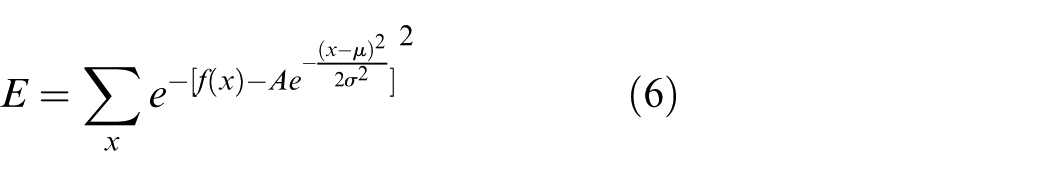
In our method, instead of directly using the difference between the Gaussian function (equation (5)) and the laser data as our loss function, we use the exponential function with a negative sign (equation (6)). This negative sign is responsible for reducing the effect of high values of the difference in finding the optimal values of parameters
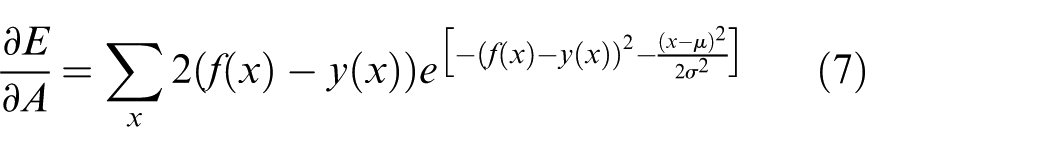
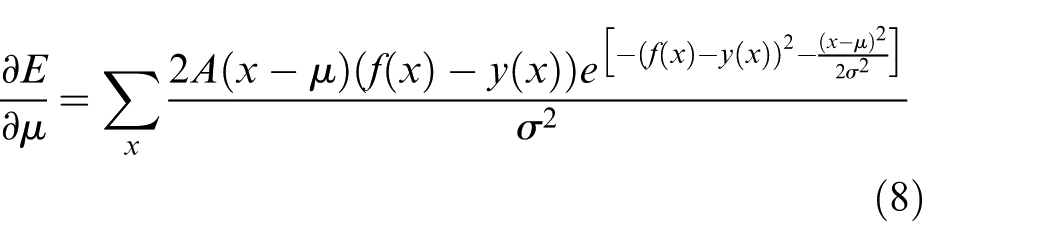
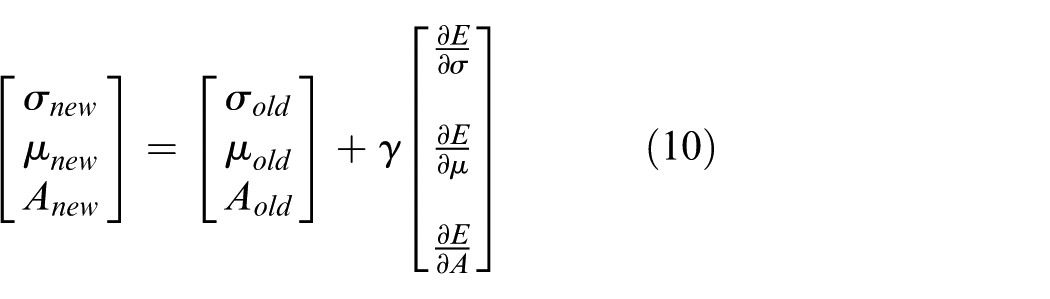
By differentiating the objective function E with respect to unknown variables (
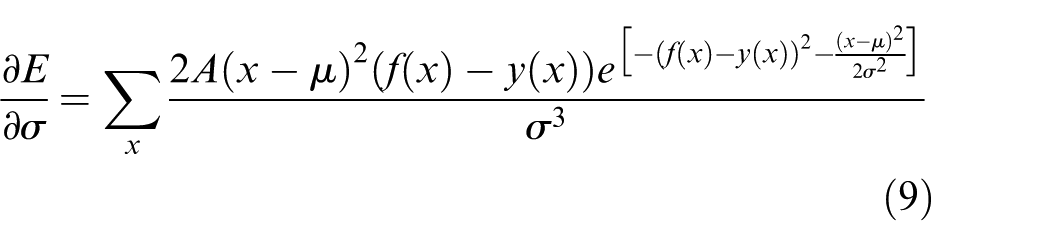
Choosing a constant value for the learning rate of the gradient ascent extends the fitting time. This problem occurs, especially, when the data have long tails. This situation relatively increases the total value of objective function, which decreases the contribution of other parts of data, and therefore causes a relatively slow progression to an often low quality solution. In order to solve the problem, the learning rate of the gradient ascent is increased and consequently the progression will be accelerated toward the goal initially. However, it bounces several times over the local maximum, when reaching near it (the overshoot phenomenon). A proper learning rate coefficient should have a high initial value, and overtime approaches to zero, while the optimization approaches a solution. Hence, every n iterations, the value of the learning rate coefficient of the gradient descent, denoted by
At the end, the value of
Detecting the laser beam curvatures
We can determine, with a high precision, the location of the existing dipping and buckling on the surface of the panel by analyzing the laser strip, given its precise location found on the image in the previous step. For doing so, it is sufficient to first extract several line segments with short lengths (the values from 10 to 100 pixels are appropriate) from the laser strip using the sliding window method where each window has a pre-specified overlap with the previous window (Figure 8). In the second step, by using linear regression, a straight line is fitted on each extracted line segment independently. It is expected that the gradients of the extracted line segments from laser strip follow a regular pattern on the surface of a sandwich panel with no defects (i.e. any anomaly in the values of gradients is probably an indicator of a defect). Therefore, in the third and final step, for each laser strip being analyzed independently, we can precisely specify the defect locations of the panel by comparing the gradients of the segments with the average of the gradients of all line segments extracted from that laser strip. Those line segments whose gradients differ from the average gradients above a certain threshold
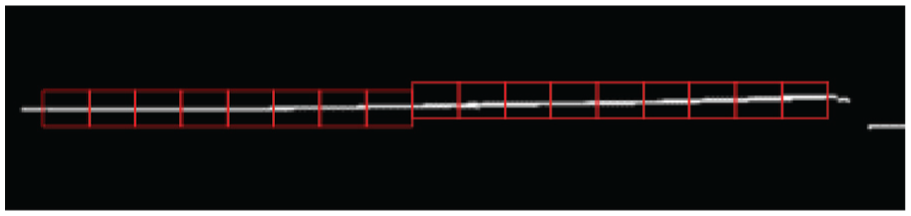
An example of the line segments extracted from a processed strip of one of the lasers beams. Every line segment is shown surrounded by a red rectangular bounding box. In this image, for clarity, the overlapped rectangles (i.e. line segments) have not been displayed.
In addition, our method could be extended to be applicable on the sandwich panels without a flat surface as well. It should be noted that if the surface of the sandwich panels examined is not flat and have regular patterns (for decorative purposes), for example, regular up and down patterns of surface, the line segments extracted may have very different gradients values. In this case, first the values of gradients are clustered in two or more clusters using a simple clustering algorithm. Then, using the previous method for sandwich panels with flat surfaces, in each cluster the segment lines whose gradients are considered anomaly are detected and therefore the corresponding location of those line segments on the sandwich panel is considered as a defective location.
Measuring the size of dipping and buckling
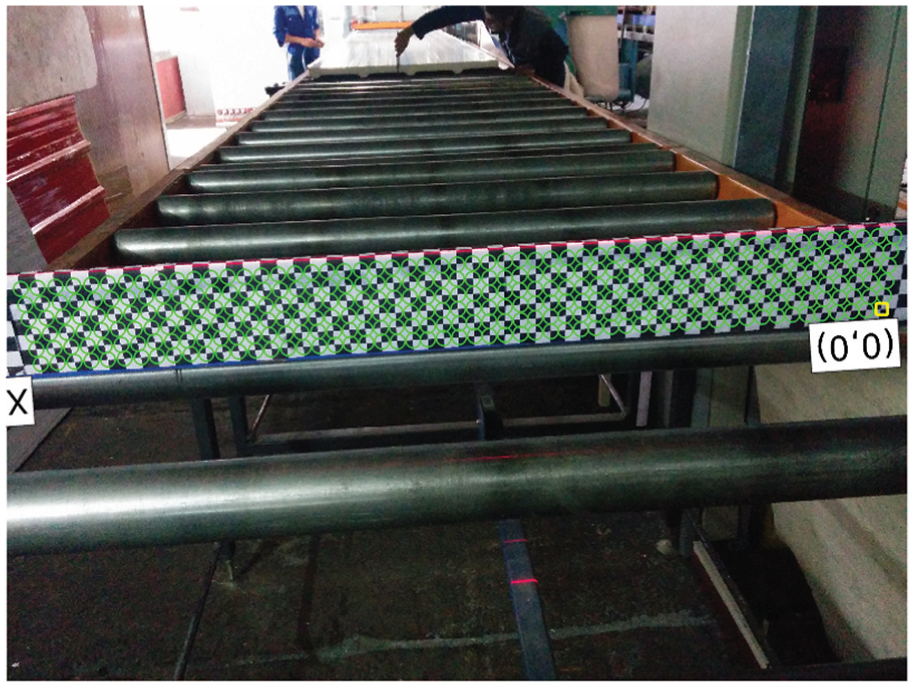
So far, our purposed system is able to locate the surface defects with a high accuracy, but it could be extended to measure the size (i.e. the height or depth) of dipping and buckling points with a standard unit (in accordance with the International System of Units). To resolve this problem, a standard panel for calibration of the measurement unit of system, similar to Figure 9, is designed which covers the whole laser beam in the image and has a checkered pattern with precise and pre-specified sizes (in millimeters) in vertical direction. As shown in Figure 10, the checkered pattern points are detected which determine the height of each image pixel located in the area of the laser beam in millimeters. Using these data, we train a feedforward artificial neural network, which has two neurons (which represents pixel coordinates in the image) in the input layer and one neuron (height in millimeters) in the output layer (Figure 11). Since, the feedforward artificial neural networks with a hidden layer are used as a global estimator,
32
a hidden layer with four neurons has also been considered in the architecture of our neural network which uses the sigmoid function as the activation function. In deployment of our system, after locating the defective points on the surface, the coordinates of those points are given as input to the neural network and this network predicts the height of laser beam at those points. This feature further enables the human supervisor and the quality control specialist to assess and ensure the quality of productions and take any discretionary actions (i.e. stopping the production line to inspect the machinery if the size of defects exceeds a specified threshold
The standard panel for calibration of the measuring unit of the system which is located at the location of each of the lasers beams.
Detected points of checkered pattern that are used as training data to learn neural network parameters.
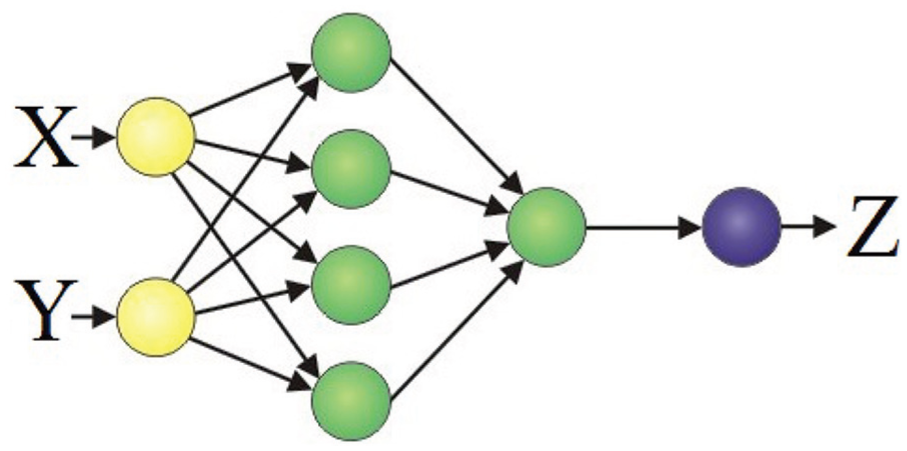
The architecture of the neural network for estimation of the height of each point of the laser beams.
Experiments and results
Due to the discrete manufacturing of the sandwich panels (e.g. 10 or 20 m in length), to continuously and automatically utilize the proposed system in the production line, a module is required to detect the beginning and ending of a sandwich panel to provide the processing result of each panel separately to the supervisor. For this purpose, the thickness of the line is estimated using the average of the standard deviations of the vertical lines. Since, when a panel enters and leaves the camera field of view, the thickness of the line would increase, the value of the standard deviation would also become larger. Using this assumption, by passing the average value of the standard deviations of the vertical lines through a certain threshold
Experiments were carried out on 35 sandwich panels with lengths 10 and 20 m and thicknesses 7 and 20 cm to assess the accuracy and efficiency of the proposed system. A number of dippings and bucklings of various sizes and depths were manually added to the surface of each sandwich panel. Unfortunately, the unavailability of a public benchmark dataset for this specific problem prevents us from being able to compare our results with the existing solutions. However, to demonstrate the effectiveness of our proposed method, we compare it with a baseline method. The baseline method is very similar to our proposed method and it only differs in that it attempts to find the surface defects by fitting a straight line to the whole laser strip, instead of laser line segments like performed in our proposed method. The baseline method considers those points on the laser strip which deviates from the fitted straight line, that is, their distance to the fitted straight line is above a certain threshold
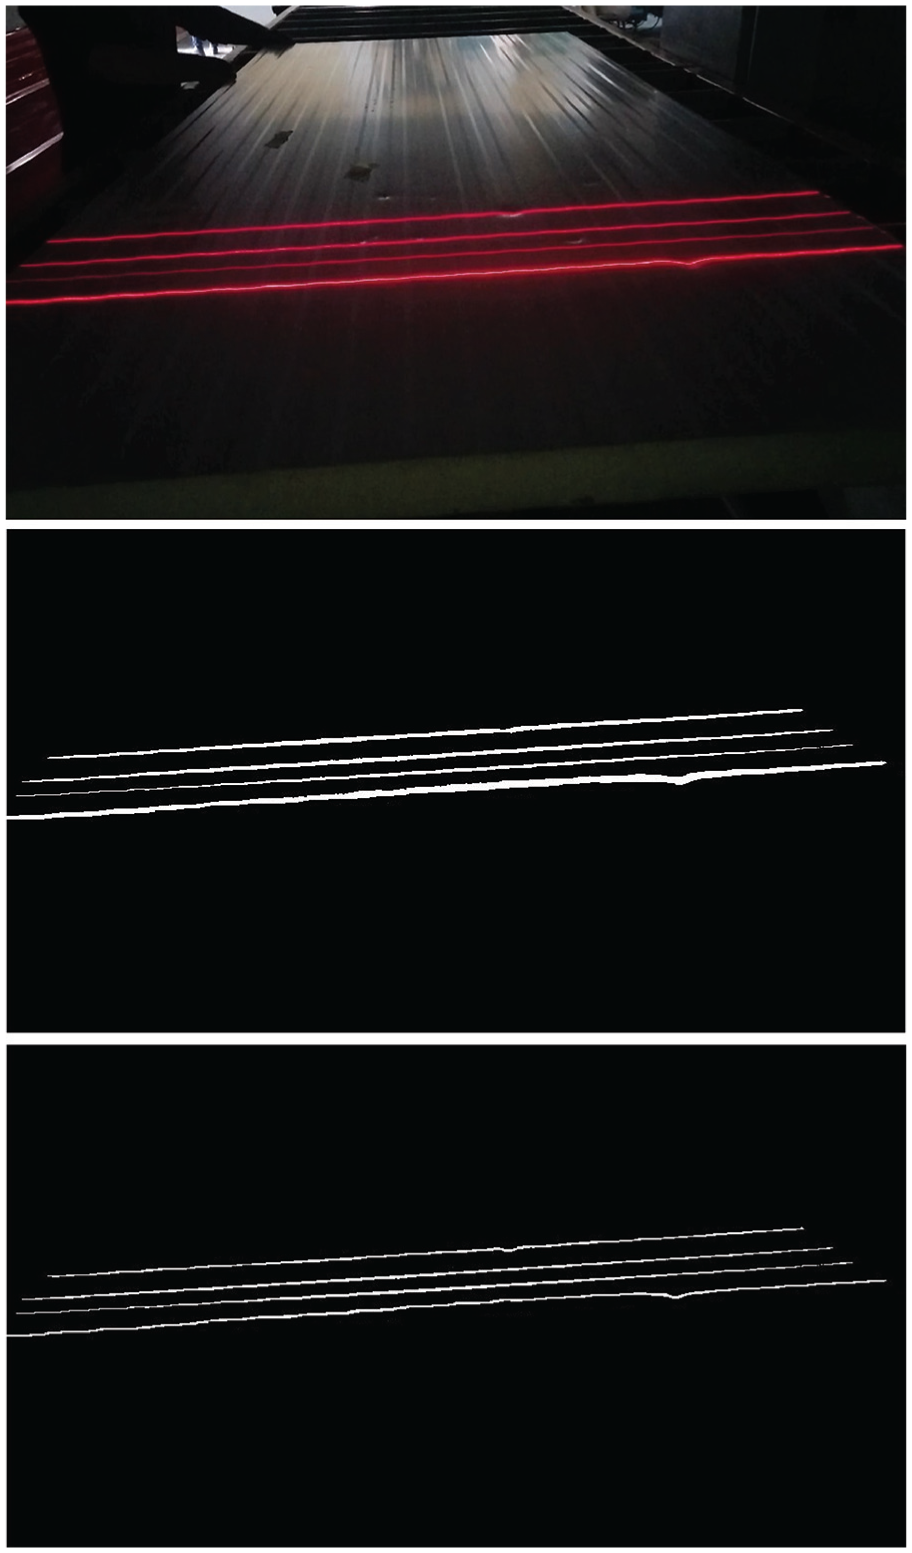
The effect of the thinning process that takes advantage of the Gaussian assumption of the laser beams. Top: A sample panel surface with multiple defects. Middle: Corresponding obtained binary image of laser beam’s location before applying the thinning process. Bottom: After applying the thinning process.
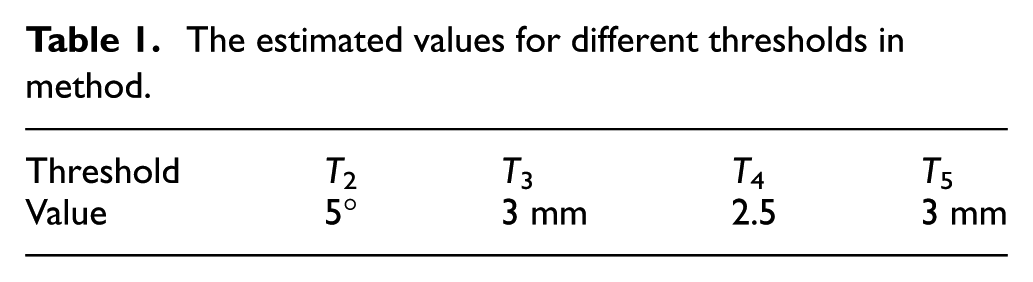
As previously mentioned, this research entails five different thresholds,
The estimated values for different thresholds in method.
The results obtained from our experiments show that our proposed system achieves an accuracy of 93% in detection of the dipping and buckling of sandwich panels, whereas the base line method has an accuracy of 76%. The experiments also show that only 1% of positive detections in our method were errors (i.e. 1% false positive), whereas the baseline method has 9% errors. Figure 13 shows the system output in one of the experiments (note that several dipping and buckling have been created manually on the sandwich panel). As can be seen, the location of most of the surface defects has been correctly detected.
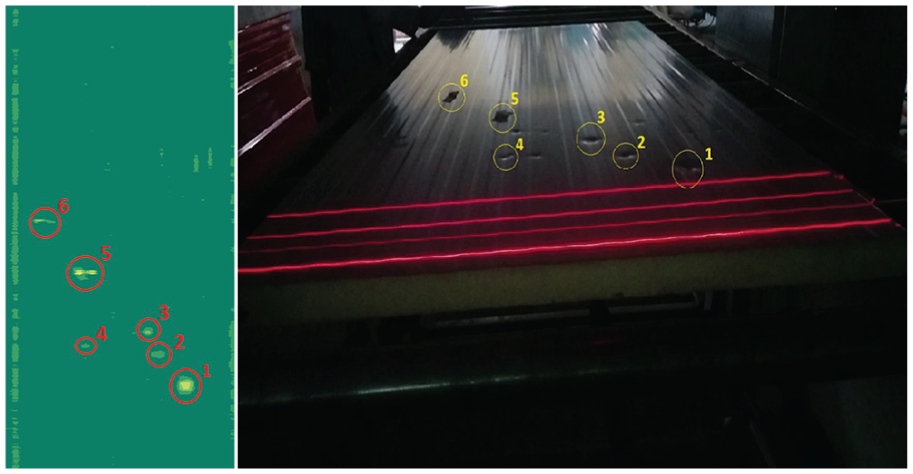
An example of how the system works. The image on the right have been taken with the camera and analyzed, according to our proposed method, to detect the surface defects. In this image, some of the dipping and buckling points have been annotated with numbers. The image on the left is the output of our system as a heat map which represents the surface of the analyzed sandwich panel. This image shows the corresponding points with dipping and buckling (with heights/depths above 3 mm) which have been accurately detected.
Furthermore, our experiments show that our proposed method achieves an average error of 2.7 mm in measuring the amount of each detected dipping and buckling, which further proves the effectiveness of our proposed method. In terms of throughput, in average the system can perform 50 cm/s which, in our field experimental setup, was well above the speed of the conveyor.
Conclusion
In this paper, we designed and presented the implementation of an inspection system for the surface of sandwich panels to detect abnormal dipping and buckling. It was shown that by using inexpensive equipments and without human intervention, the proposed method can precisely detect most of the dipping and buckling on the surface of sandwich panels. Considering the relatively high cost of the sandwich panel manufacturing, the proposed system helps detecting the potential defects in the surface of sandwich panels in real-time. Future research in this field could focus on discovering other production defects, including the misalignment of the top and bottom sheets of sandwich panels, toward designing a comprehensive automated visual inspection system for sandwich panel production lines.
Footnotes
Declaration of conflicting interests
The author(s) declared no potential conflicts of interest with respect to the research, authorship, and/or publication of this article.
Funding
The author(s) received no financial support for the research, authorship, and/or publication of this article.