
Abstract
In this research, the characterization test on nonlinear vibration of a fibre-reinforced composite thin plate is studied. First, in order to improve the efficiency and precision of the test, a laser scanning vibration system is designed and developed. Then, test methods and procedures of the harmonic distortion and nonlinear time-varying damping of such thin plates are proposed from the time-domain perspective. Corresponding test methods and procedures of nonlinear vibration properties such as the hard/soft stiffness and amplitude-dependent damping are also presented from the frequency-domain perspective. Finally, the TC500 carbon fibre/resin composite plate is selected as an example for the research to carry out a case study. Potential nonlinear vibration phenomena of such plates are characterized by the proposed test methods. It has been proved that the related test system and techniques adopted in this paper can provide an important reference for the establishment of the nonlinear vibration test methodology of fibre-reinforced composite structures.
Keywords
Introduction
The fibre-reinforced composite is a kind of material with high strength, high specific modulus, good thermal stability and high damping capacity, allowing its wide use in aeronautics, astronautics, automobiles and other engineering fields. 1 Nowadays, there are many such typical composite thin plate structures in engineering practice, including solar batteries, turbofan blades, large wind turbine blades and so forth. However, the fibre-reinforced composites are different from the conventional materials in manifesting obvious anisotropic and nonlinear vibration characteristics with changeable stiffness and damping.2,3 For example, the natural frequency will decrease with the increase in external excitation amplitude, showing soft nonlinear stiffness properties, and damping parameters are affected by the external vibration amplitude and frequency.4,5 Since traditional vibration measurement and analysis methods are mainly derived from the linear equivalence principle, it could be perplexing and challenging to study the above-mentioned nonlinear behaviours.
At present, many researches have been done on the linear and nonlinear vibration of fibre-reinforced composite plates and beams. For example, Schultz and Tsai 6 tested the dynamic elastic modulus and nonlinear damping of glass fibre/resin composite beam first. In the range of 5–10 kHz, the composite beams were found to have different damping values in different exciting amplitudes and frequencies. Crane and Gillespie 7 measured the loss factor of composite beams and found the nonlinear dependence between damping and excitation frequency of glass fibre/epoxy resin as well as graphite fibre/polyester resin composite beams. Oh and Nayfeh 8 tested the vibration response of a graphite fibre/resin composite thin plate at different vibration amplitudes and frequencies and found that the vibration excitation with high frequency and low amplitude could cause the vibration response with low frequency and high amplitude in such a composite system. Turvey et al. 9 studied the vibration of fibre-reinforced composite plates with holes under different boundary conditions. The natural frequencies were obtained by the frequency-sweeping method, and the modal shapes were obtained by the sand-throwing technique. Harras et al. 10 measured the Glare 3 composite thin plate structure and found that its modal shape was determined by certain vibration amplitude. Moreover, the nonlinear frequency related to the first modal shape of the composite plate was ∼32% higher than that of the linear one. Kostopoulos and Korontzis 11 measured the nonlinear stiffness and damping parameters of the carbon fibre/resin composite cantilever beam. The first four natural frequencies and damping parameters were obtained by the free vibration attenuation method, and the nonlinear relationship between the damping and the excitation frequency was discovered. Berthelot and Sefrani 12 designed the vibration test platform of the cantilever composite beam. The modal shape, natural frequency and other parameters were identified based on the measured frequency response function. Matter et al. 13 used a megaphone to excite the composite thin plate and obtained its natural frequency, damping ratio and modal shape. Iriondo et al. 14 used the electrodynamic vibration table to characterize the damping parameters of the fibre-reinforced composite plate. It was found that the damping results were closely related to the excitation frequency, which would generally increase when the frequency increases. Li et al. 15 tested the dynamic stiffness and damping of the composite beams with different fibre directions within the frequency range of 1 kHz. Qi et al. 16 carried out experimental study on the T300/BMP composite thin plate with local open-hole damage and analysed the influence of the damage parameters such as location and size of the holes on their inherent characteristics. Yang et al. 17 used the transient excitation technique to obtain the dynamic characteristic data of composite beam with different fibre layer angles and different resin matrices. Modal frequency and loss factor results were also extracted. Chen et al. 18 used electromagnetic vibration table to conduct a series of measurement on carbon fibre composite plates under the simply supported boundary conditions. By comparing the response spectrums obtained in different sweeping directions and the frequency jumping phenomenon, they had confirmed it to be a feasible nonlinear vibration characterization test method, which can be used to judge the hard or soft stiffness nonlinearity of the composite thin plate. Daoud et al. 19 adopted the half-power bandwidth method to identify the natural frequencies and damping parameters of flax fibre-reinforced composites. The relationship between its damping behaviour and frequency was also discovered. El-Hafidi et al. 20 proposed a new method to identify the dynamic parameters of flax fibre-reinforced composites. The method enables researchers to measure the damping parameters and Young’s modulus in a wide range of frequencies. Missoum et al. 21 used fidelity maps to characterize dynamic properties of materials with uncertain geometric parameters. Experiments on sandwich plates with foam cores proved the effectiveness and accuracy of this method.
Although the fibre-reinforced composite thin plate structures have been investigated in depth, most of them only considered linear vibration properties, and there is still a lack of experimental studies on nonlinear vibration of such composite structure, especially on the aspect where a standard, objective characterization test method and procedure can be confirmed. Therefore, it is necessary to continue to study the nonlinear problem in the characterization test, especially to put much efforts on the improvement of test accuracy and efficiency.
In this research, characterization test study on nonlinear vibration of a fibre-reinforced composite thin plate is conducted. First, a laser scanning vibration system of such composite plate is designed and developed to improve the test efficiency and accuracy. Then, from the perspective of time domain, the harmonic distortion test method and nonlinear time-varying damping test method are proposed, whereas from the perspective of frequency domain, the following nonlinear test methods and procedures are also presented, such as the hard/soft stiffness, amplitude-dependent nonlinearity damping, superharmonic and subharmonic resonance, internal resonance and nonlinear jump. Finally, the TC500 carbon fibre/resin composite plate is selected for research, and its potential nonlinear vibration phenomena are characterized by the above-mentioned test methods. It has been proved that the related test system and techniques adopted in this paper can provide an important reference for the establishment of the nonlinear vibration test methodology of fibre composite structures.
Vibration test system of the composite thin plate based on the laser scanning technique
Due to the thin thickness and lightweight of the fibre-reinforced composite thin plate, the additional mass of the traditional acceleration sensor has a greater impact on the test accuracy of the natural frequencies and damping. Moreover, the adjustment of the acceleration sensor will also lead to the low test efficiency when it is needed to acquire response signals in different measuring points. Thus, in order to obtain the nonlinear vibration parameters of the composite thin plate with high efficiency and accuracy, the researchers developed a vibration test system of the composite thin plate based on the laser scanning technique for the first time.
Laser scanning vibration test system
The laser scanning system is composed of Polytec PDV-100 laser Doppler vibrometer, 45° mirror, 86HS45 stepping motor, motor driver, R-10 movement controller, X–Y sliding table and so on. In this system, it is the laser vibrometer’s task to gauge the vibration frequency and amplitude of the composite plate with accuracy in the noncontact manner, while 45° mirror is responsible for making the laser path perpendicular to the specimen. In addition, X–Y slideway enables the laser point to slide alongside it within the range of 300 mm × 400 mm. To achieve the scanning function with the rate of 0–20 mm/s, two stepping motors are installed on the slideway to drive the slider back and forth. Finally, the stepping motors are linked to the laptop via the motion controller and serial communication centre. After the control programme of the laser scanning system was written using LabVIEW, the function of one-point continuous scanning measurement can be realized in the x, y and intersection directions of the composite plate.
Software program design
LabVIEW software is employed in this paper to develop the control system. Figure 1 gives the control software and its interface designed by the author. Firstly, the geometric parameters should be typed in while the scanning modes are to be selected by clicking the corresponding buttons. Then, after scanning parameters are set, the system can accomplish the measuring automatically, improving the efficiency substantially. In addition, other buttons are equipped for the operator to control the scanning manually. When the laser spot arrives at the specific point, the natural frequency, damping and modal shape can be obtained by various excitation techniques.
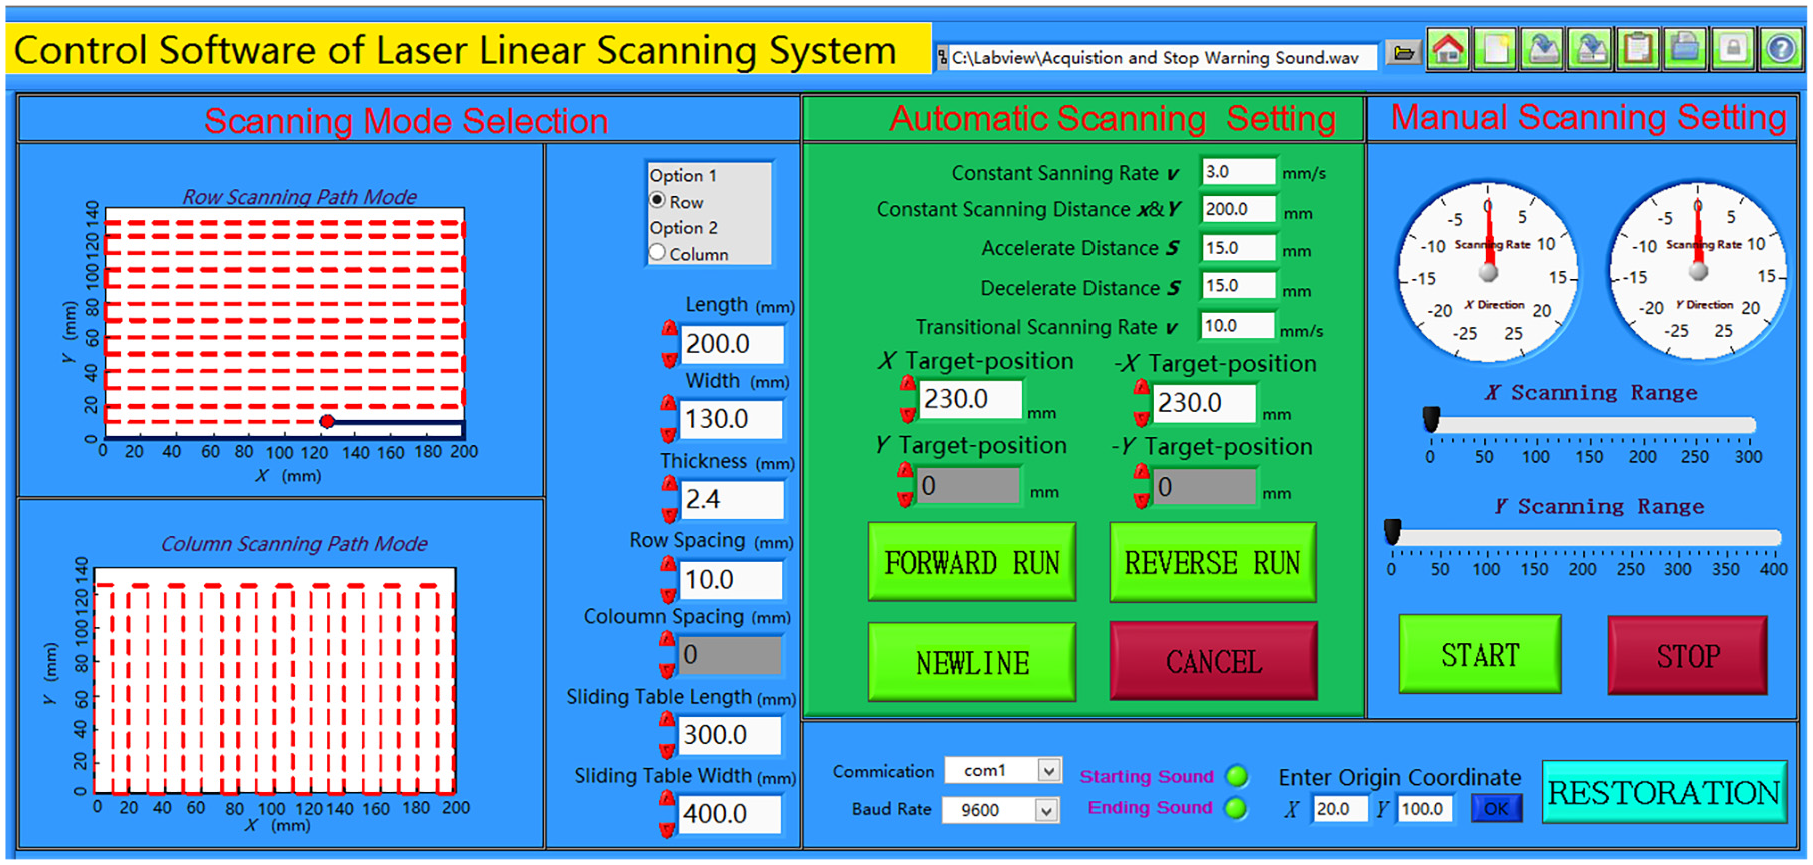
The operation interface of laser scanning control software based on LabVIEW.
Design and assembly of the vibration test system of the fibre-reinforced composite thin plate
The vibration test system of the composite thin plate can be assembled by the combination of the laptop workstation, electromagnetic exciter, power amplifier, vibration excitation platform, vibration conversion base, cabinet and other components based on the self-designed laser scanning system. The connection diagram is shown in Figure 2. The data acquisition analyser can send out the excitation signal which can be amplified by the power amplifier, and then the electromagnetic exciter is further controlled to release the vibration excitation to the plate specimen. In the system, the vibration energy of the exciter will act on the vibration-switch base and then will be transmitted to the composite plate specimen in the base excitation form. Finally, the vibration response at any position of the plate can be measured by the laser scanning vibration test system. Figure 3 gives the physical map of the final assembled vibration test system of composite thin plate specimen.
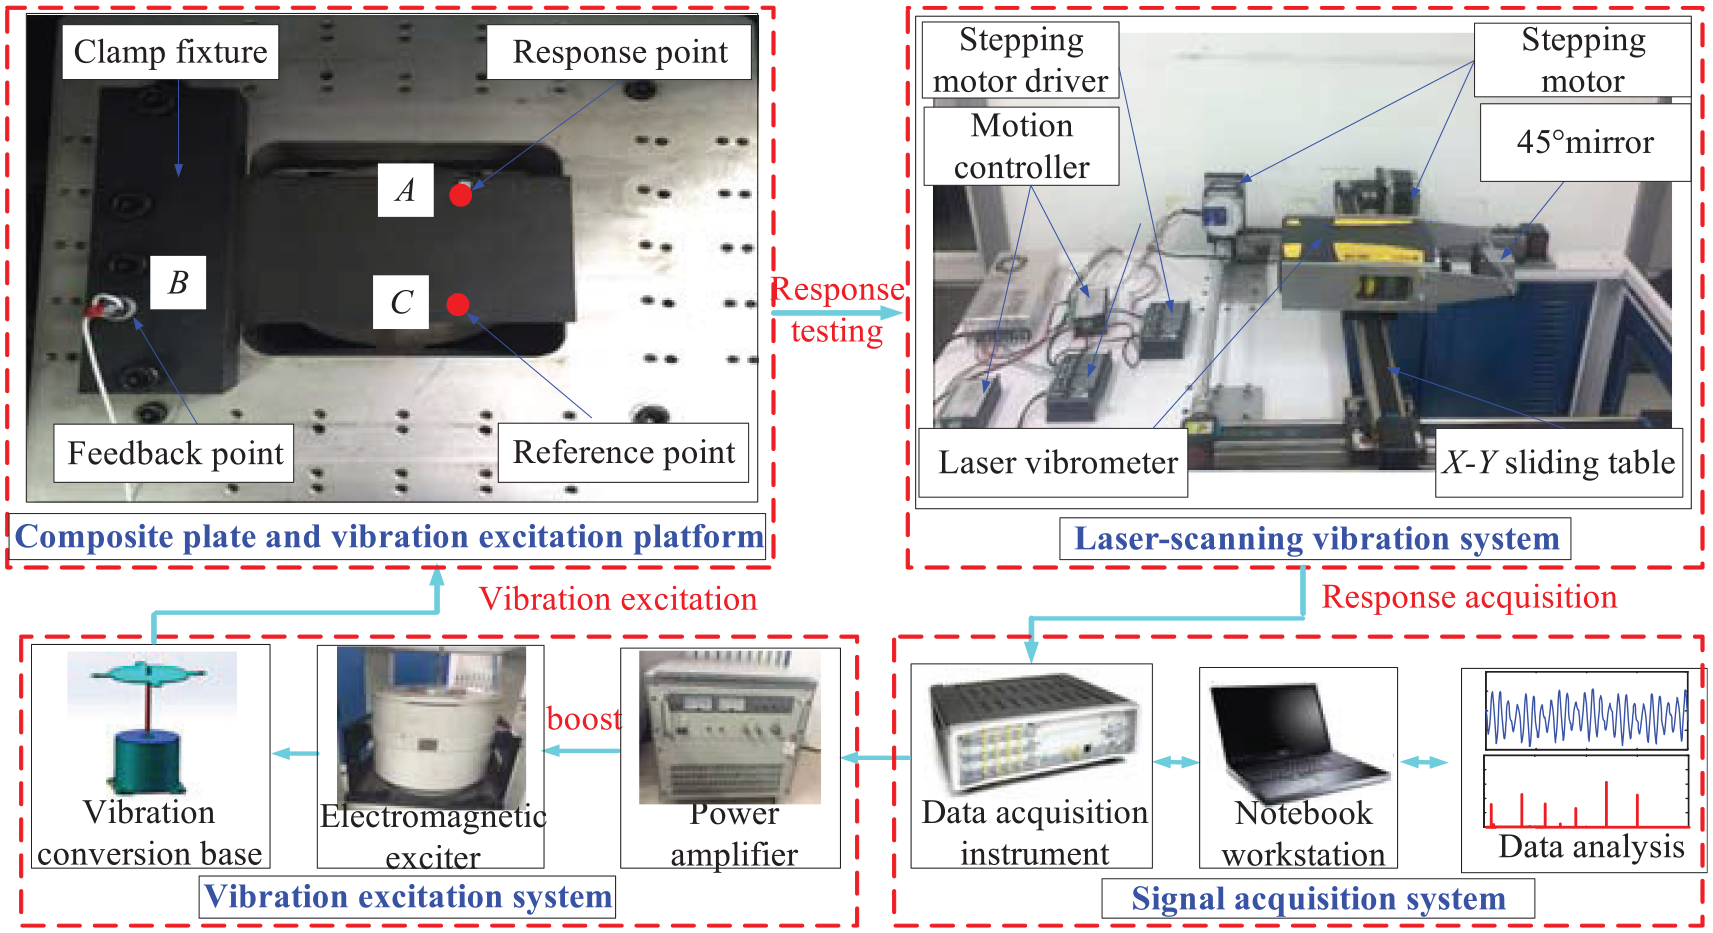
Connection schematic of the vibration test system of the composite thin plate.
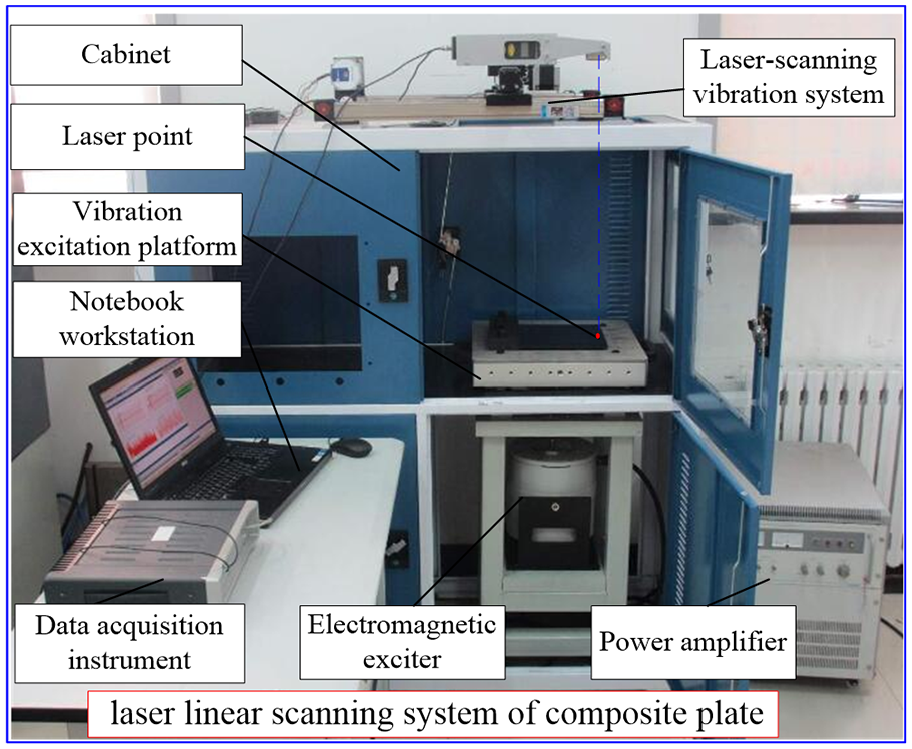
Physical map of the vibration test system of the composite thin plate.
Nonlinearity characterization test methods and procedures
In order to measure various nonlinear vibration phenomena of the composite thin plate with high efficiency and accuracy, the nonlinearity characterization test methods and procedures are summarized, which mainly contain the following nine key steps.
1. Accurately measure each natural frequency
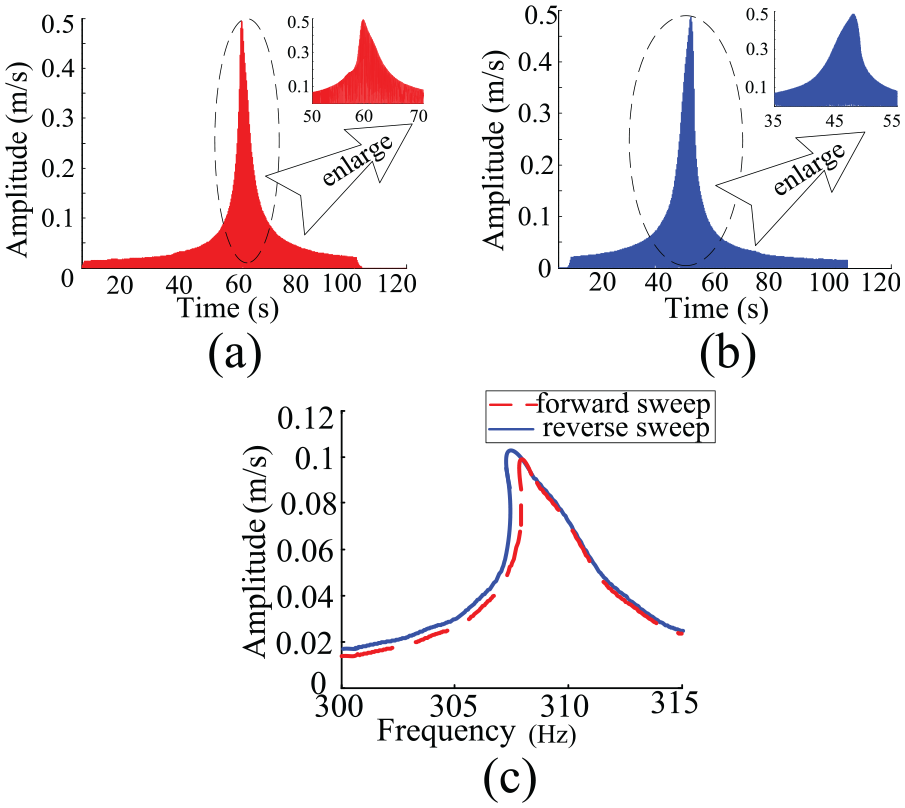
First, natural frequencies of the composite plate can be measured with the hammer excitation technique to get an approximate result. Then, constant amplitude sweeping measurement is carried out with base load excitation based on the established vibration test system of the fibre-reinforced composite thin plate in section ‘Vibration test system of the composite thin plate based on the laser scanning technique’. In order to get precise frequency results, the small-segment fast Fourier transform (FFT) processing technique is employed to deal with the measured sweep signal. The time-domain signal involving the third natural frequency of the tested plate is shown in Figure 4(a). The frequency spectrum of the sweep signal can be obtained by directly applying the FFT processing technique. The frequency of the response peak is 309.7 Hz (Figure 4(b)). However, if the whole time of sweep signal can be divided into small segments with FFT conducted on each of them (in this example, it is 1 s with respect to the whole time of 100 s), the resulting frequency spectra, as shown in Figure 4(c), are plotted through the combination of the response peak of each segment (also treated with interpolation and smoothing). The frequency value related to the peak is 310.8 Hz, which is truly accurate result of the third natural frequency. Therefore, for the time-dependent sweep signal of composite thin plate, it is necessary to use the small-segment FFT processing technique to accurately get frequency results.
2. Measure each modal shape with high efficiency
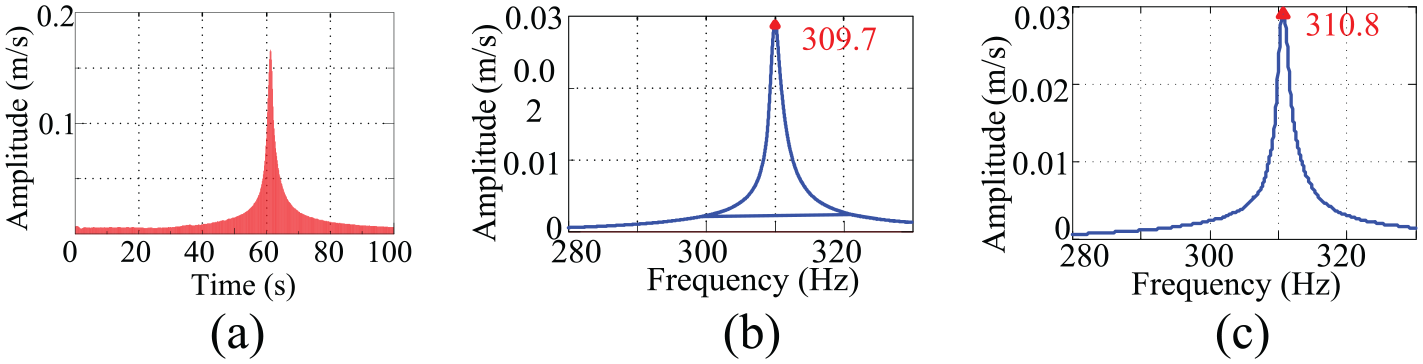
The third natural frequency of the composite plate obtained by different FFT processing techniques: (a) the raw sweep signal, (b) the spectrum by direct FFT and (c) the spectrum by small-segment FFT.
After the natural frequencies of the composite specimen are attained, the laser scanning vibration test system is used to measure each modal shape. First, an excitation at one of the natural frequencies is employed to drive the tested plate at the resonance state. Then, the scanning measurement is performed at a constant scanning velocity, which can be set in the laser scanning control software based on LabVIEW. In order to input the scanning signal, a wireframe model of the composite plate is developed. The reference signal can be obtained by the laser vibrometer and the lightweight accelerometer. Finally, the transfer functions of these two signals are acquired, and the information of amplitudes and phases can be extracted. Based on these information, the researchers can draft the mode shape related to a certain mode of the plate. By repeating the first two steps, each modal shape can be obtained with high efficiency and accuracy.
3. Harmonic distortion characterization test
Harmonic distortion is one of the effective approaches in the time domain to acquire nonlinear vibration phenomenon of the composite structure. First, the composite plate is excited at resonance frequency of the certain mode or nonresonance frequency, and the excitation signal as well as the vibration response signal can be measured by the vibration test system. Then, the frequency components of the response signals can be identified from the frequency spectrum, and also it is required to observe the shape of waveform in the time domain to identify whether or not the harmonic distortion exists in the composite structural system.
4. Nonlinear time-varying damping characterization test
First, it is necessary to set one of the natural frequencies and select one of the larger excitation levels to excite the composite thin plate to the resonance state. After the composite structural system reaches the steady state, the excitation should be ceased and vibration attenuating response signals can be recorded by the established vibration test system in section ‘Vibration test system of the composite thin plate based on the laser scanning technique’. Next, Hilbert transform is applied to the attenuating signal to extract the envelope, and the nonlinear time-varying damping parameter can also be acquired according to the related formula in reference. 22 Upon repeating these steps, the nonlinear time-varying damping in each mode can be acquired.
5. The hard/soft stiffness characterization test
The study of nonlinear vibration characteristics from the frequency domain can be carried out after accomplishing the time-domain nonlinear characterization measurement of the composite plate. So in step 5, the researchers first choose to carry out the hard/soft stiffness characterization test, whose test principle is simple and easy to be observed in the sine sweeping experiment. Here, 75%–125% of the certain natural frequency is selected as the sweeping frequency range, and 1g, 2g, 4g, 8g and other excitation amplitudes with the relatively slower sweeping rate (to avoid the effect of transient vibration) are employed to obtain the different frequency response curves. Next, the natural frequencies corresponding to the different excitation amplitudes can be identified in the frequency response curves by the peak selection technique. If the natural frequencies of the composite plate show a decreasing trend with the increase in excitation amplitudes, then it can be confirmed that soft stiffness nonlinearity occurred for such fibre composite structure, otherwise it will show the hard stiffness nonlinear characteristics.
6. Amplitude-dependent damping characterization test
Similar to step 5, still the same sweeping frequency range and sweeping rate are chosen to obtain frequency response curves at different excitation amplitudes. Then, according to the classical half-power bandwidth method, the amplitude-dependent damping parameters can be identified, which is very helpful to study the nonlinear relationship between the damping and the external excitation level.
7. Nonlinear jump characterization test
Similar to step 5, the same sweeping frequency range is chosen to obtain frequency response curves, yet the sweeping direction is divided into positive sweep and inverse sweep excitation modes, and sweeping rate is also set to multiple values, for example, 1, 0.5, 0.25 and 0.1 Hz/s. Then, whether the nonlinear jump occurs can be judged by observing the steepness of the curves around the response peak in the frequency domain. Besides, the corresponding variation in time waveform can be checked to observe whether the increased or declined amplitude jump occurs. Combined with the observed conclusion in frequency domain, nonlinear jump phenomenon can also be confirmed.
8. Superharmonic and subharmonic resonance characterization test
First, after each natural frequency is accurately obtained, a fixed frequency value is employed, which would be 1/n or n times (n being an integer) of each natural frequency, to force the composite plate to vibrate at the steady state. Then, each frequency component of the response signal in the frequency domain should be observed combined with the time-domain waveform. If there is one frequency component whose amplitude is relatively large and its frequency value equals to natural frequency of the composite structural system, then it can be confirmed that superharmonic and subharmonic resonance phenomena have occurred.
9. Internal resonance characterization test
In this step, first it is required to determine whether or not the natural frequencies would have integer proportions. For example, it should be determined if the first and second natural frequency values show the multiple relation, for example, 1:2 and 1:3. If so, an internal resonance characterization test needs to be carried out. Next, such natural frequency is chosen to excite the composite thin plate to the resonance state, and the time waveform, frequency spectrum along with the phase trajectory of the response signal can be obtained at the same time. If the two natural frequency components can exist together obviously in the frequency spectrum, and the motion shape of the phase shows the multiple periodic trajectory, then it can be confirmed that internal resonance phenomenon has occurred, and the transmission and transformation of vibrational energy do exist between the two modes of such composite structure.
A study case
The studied TC300 carbon/epoxy composite plate was symmetrically laid, as shown in Figure 2, which had 21 layers with the laminate configuration of [(0/90) s/0/(90/0) s]. Every layer has the same geometric and physical parameters with Young’s modulus
The laser response point A was 150 mm to the fixed end, and the vertical distance between this point and the upper free edge is 20 mm (Figure 2). To avoid overload phenomenon, the measurement range of the laser vibrometer is set to be 500 mm/s (the corresponding sensitivity is 8000 mv/(m/s)). Besides, point B on the fixture was selected as the feedback measuring point and point C was used as the reference point, where a lightweight accelerometer was placed when measuring modal shape by the laser scanning technique. In practice, the first three natural frequencies should be measured at different tightening torques measured by a torque wrench to ensure that the plate specimen is fixed firmly. Through comparing with each other, the best repeatability of frequency values can be acquired when the tightening torque is 50 N m, and so this torque value was used in the formal test.
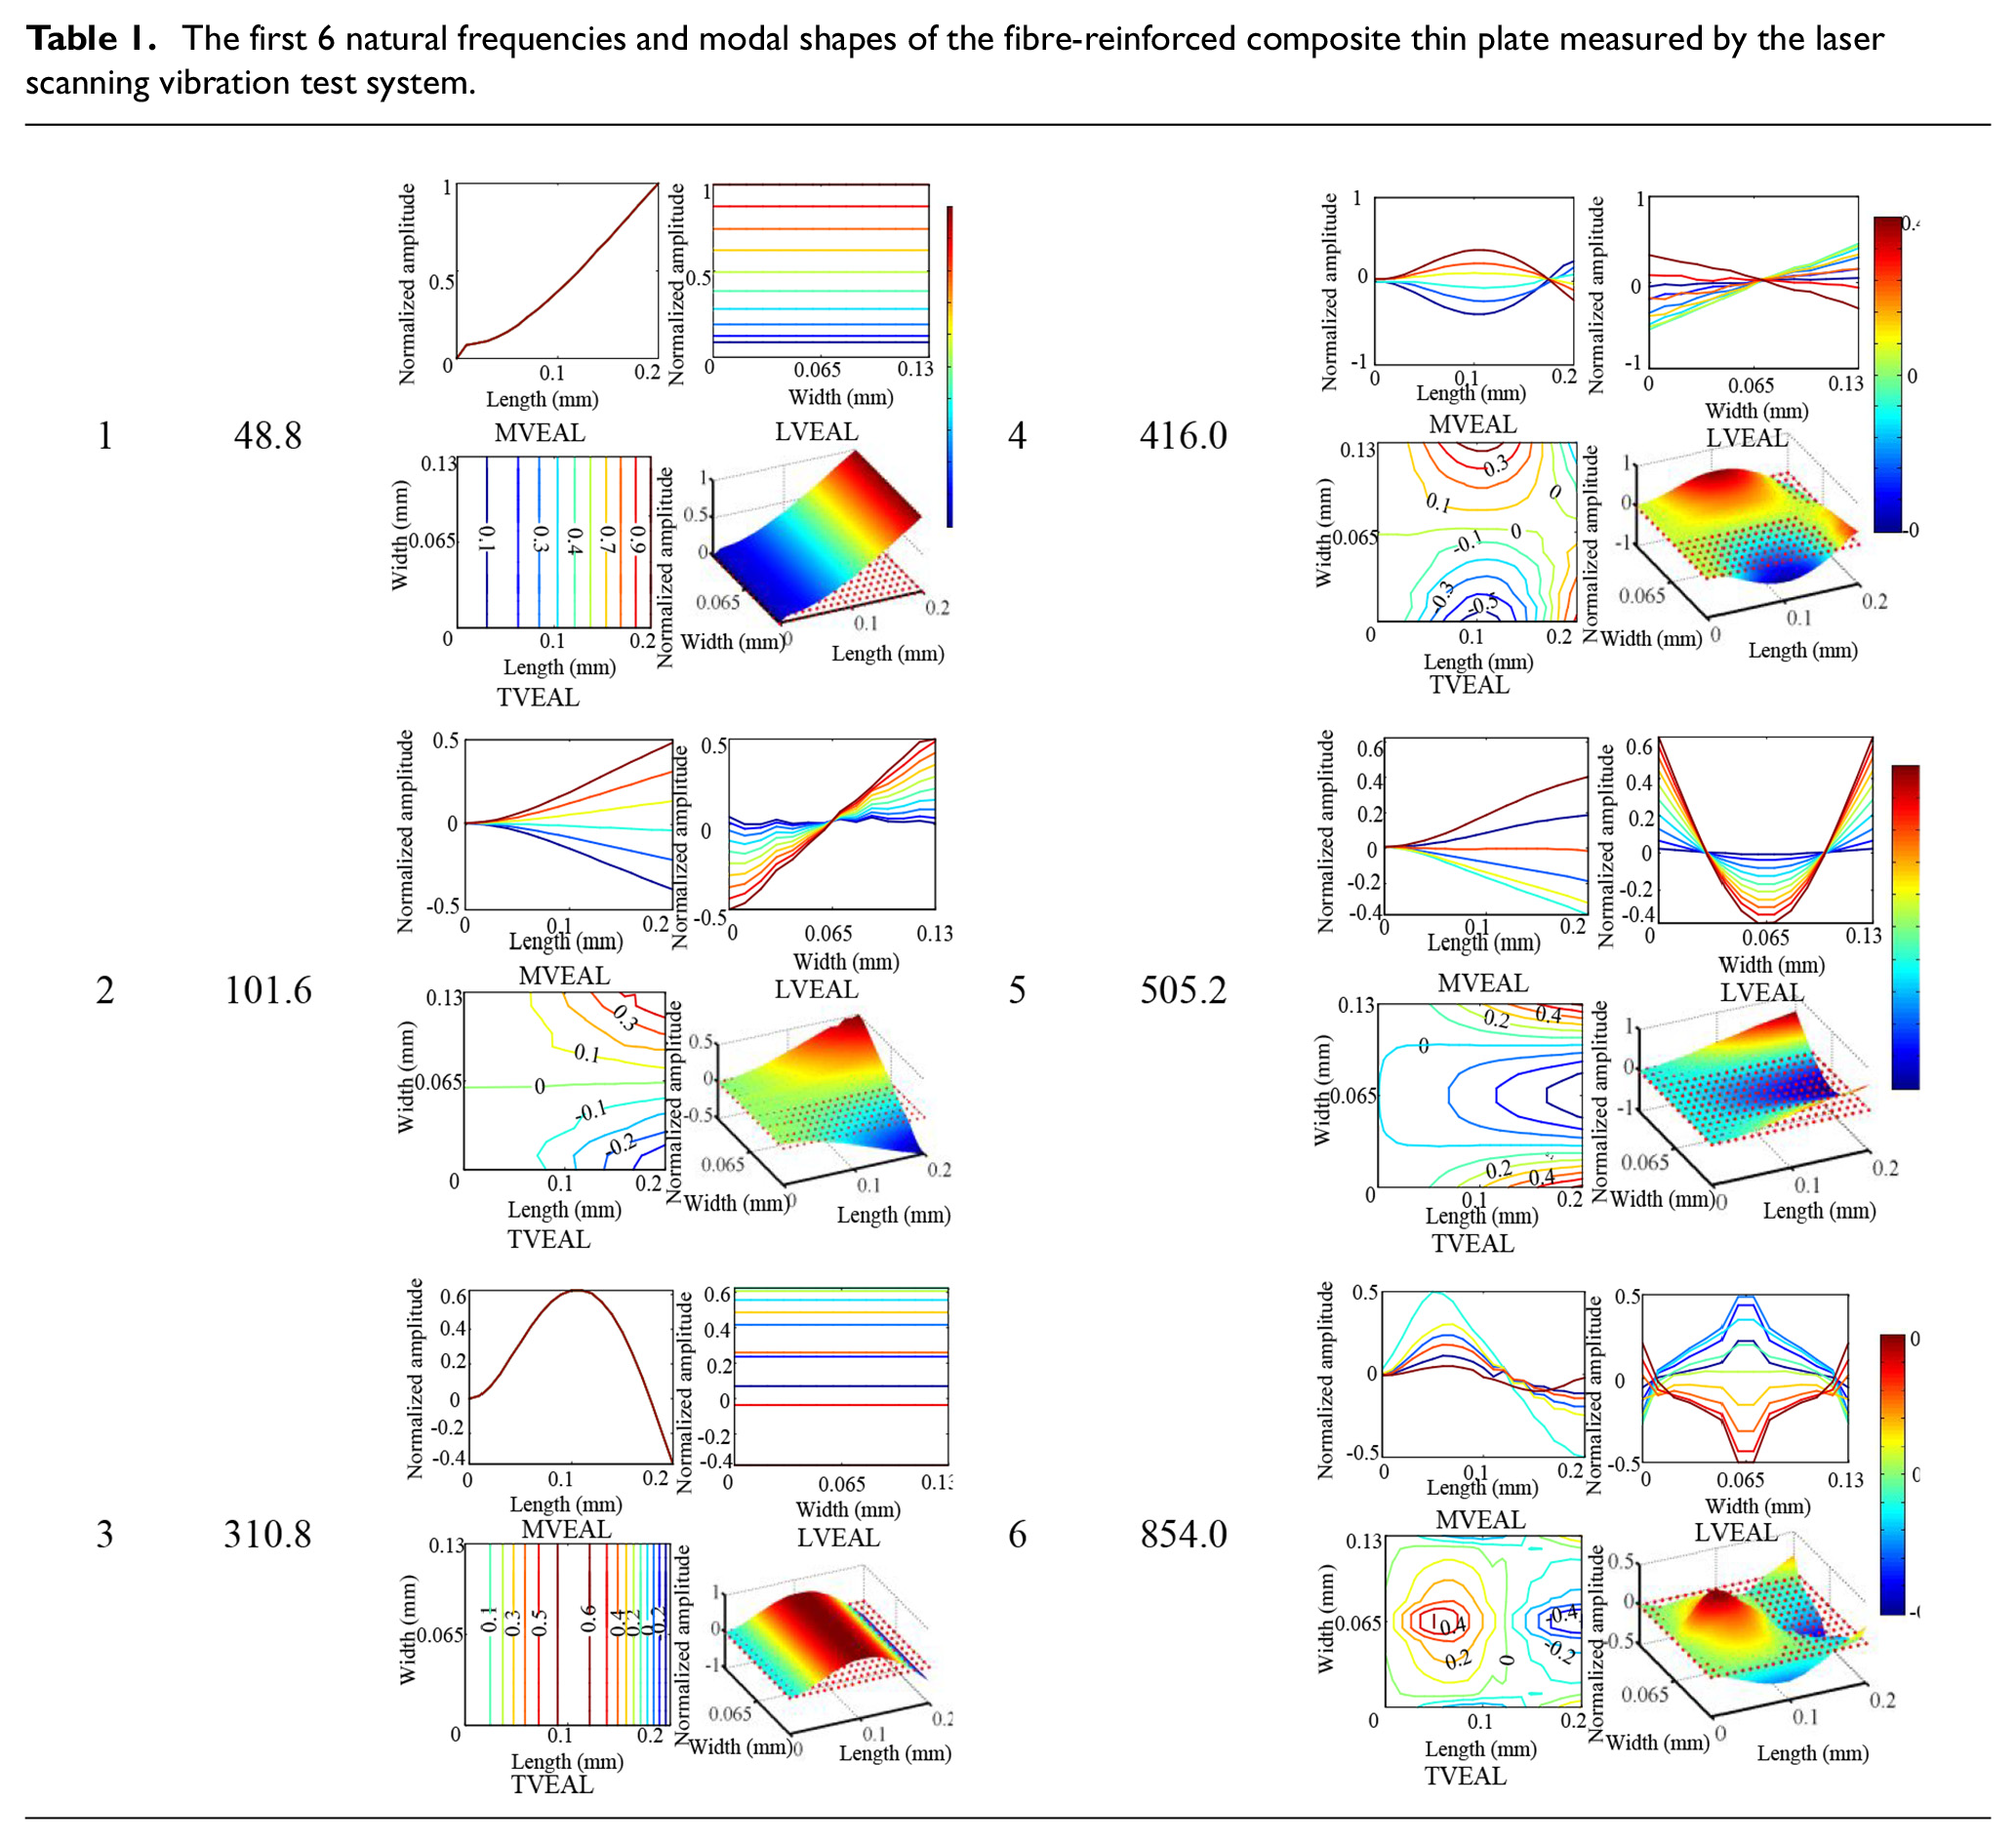
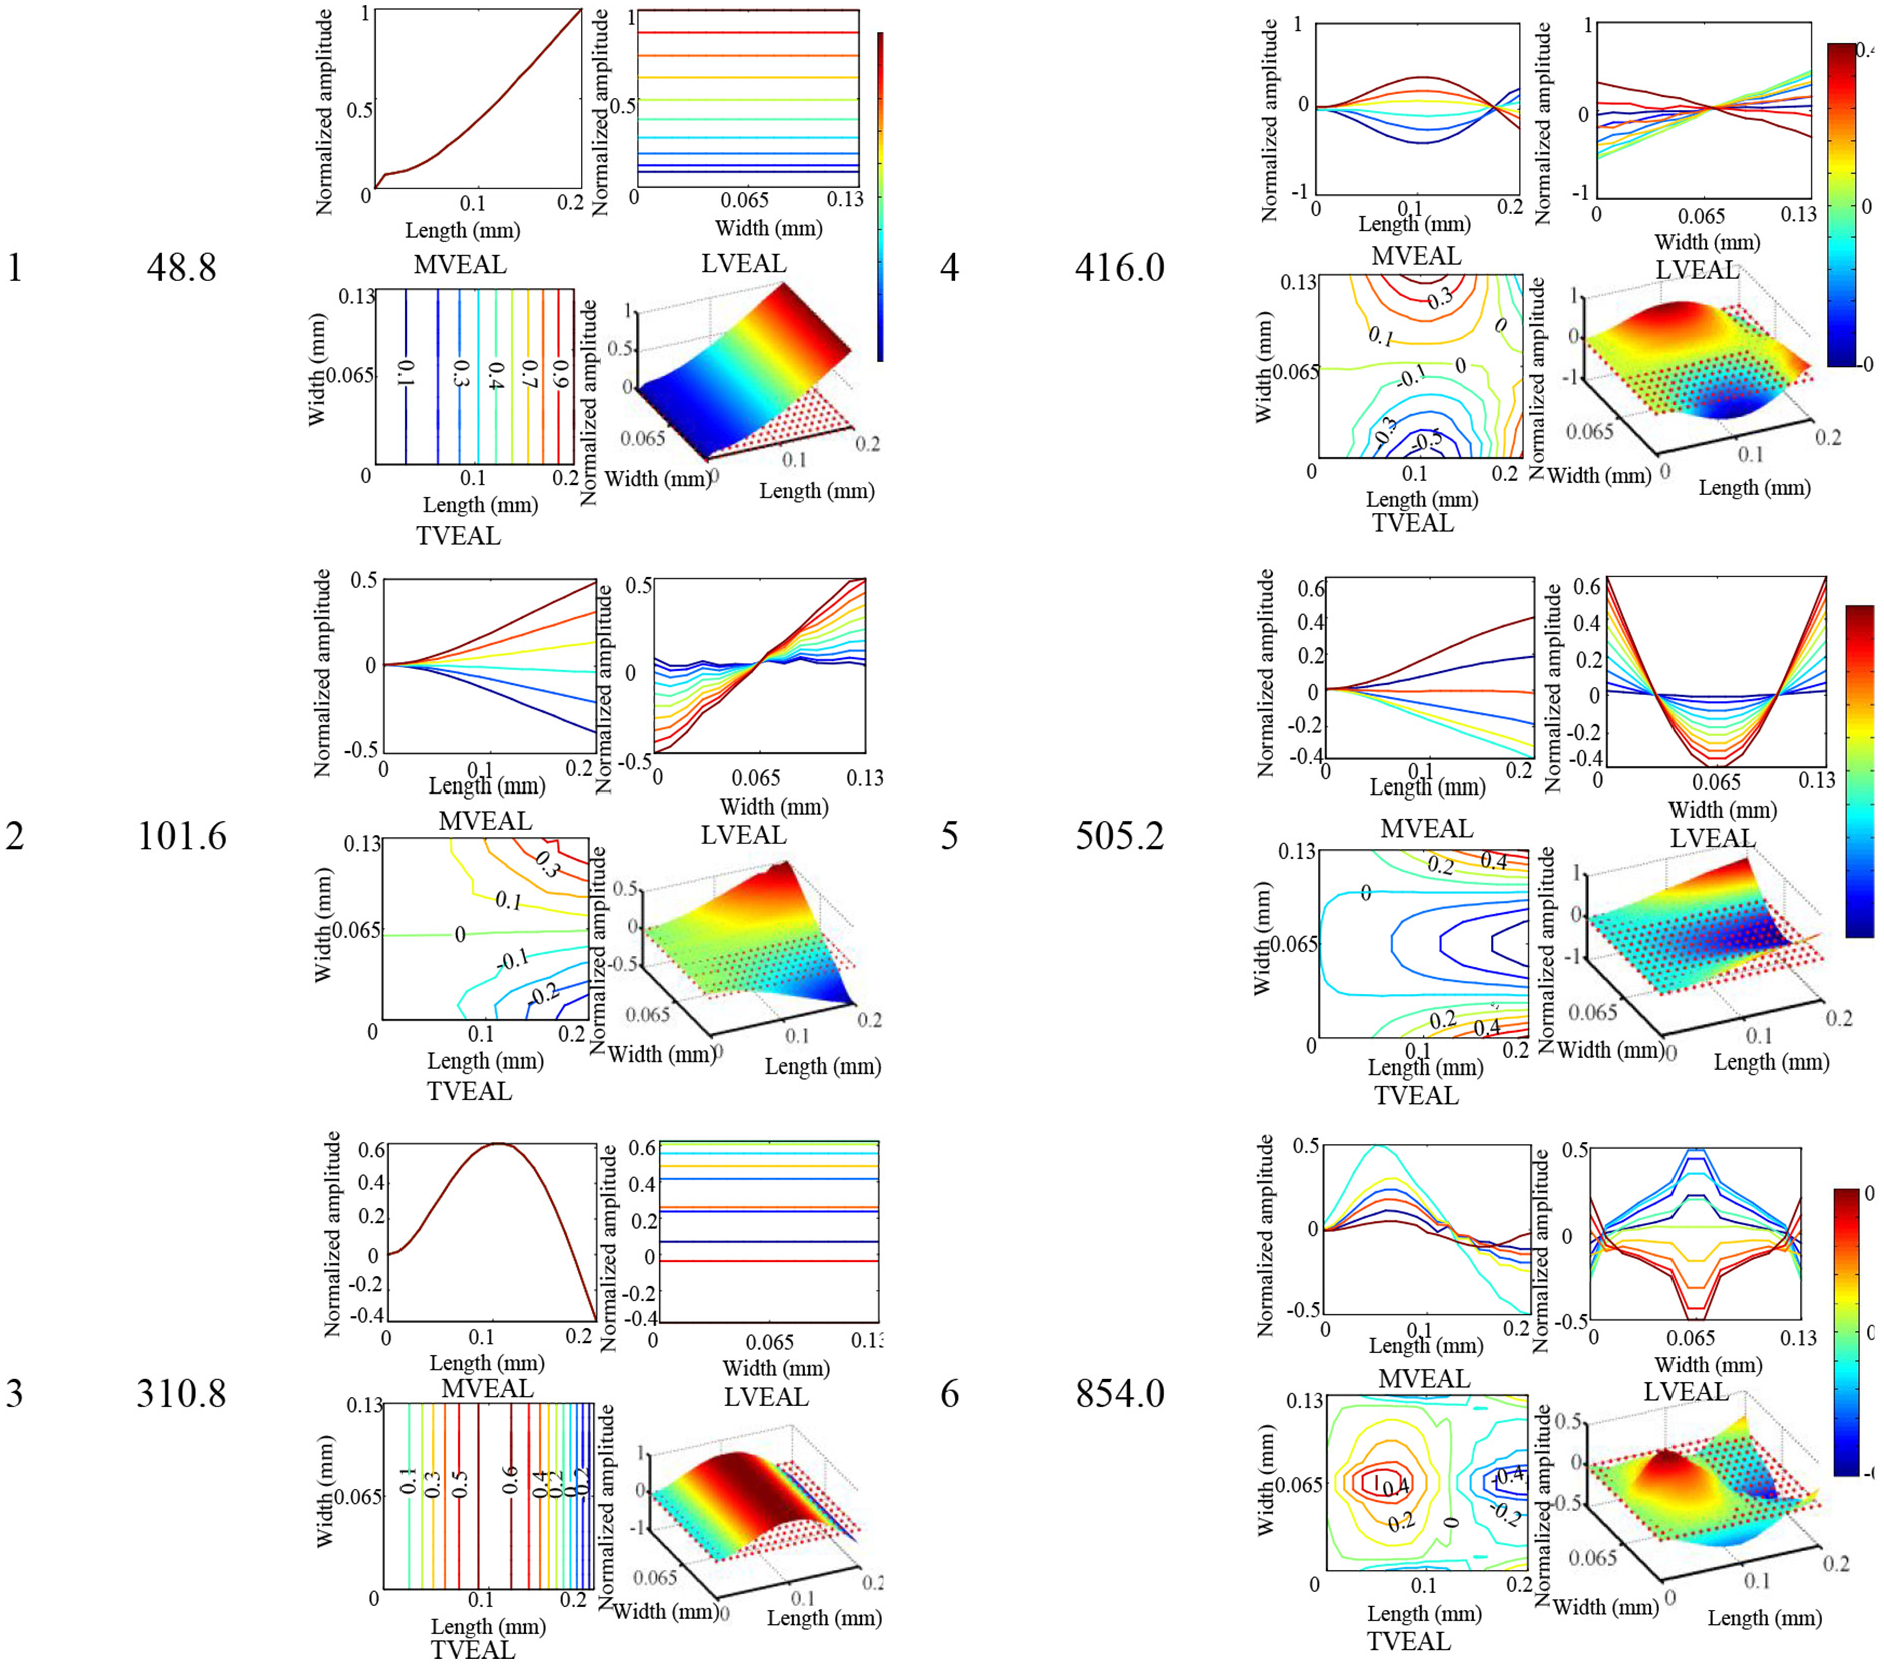
On one hand, in order to carry out nonlinear vibration characterization measurement of the fibre-reinforced composite plate, it was necessary to measure each natural frequency and modal shape with high accuracy and efficiency. First, each natural frequency of the composite plate can be roughly measured by the hammer excitation technique in the frequency range of 0–1024 Hz. Then, in order to accurately determine each natural frequency, the sine sweep test was conducted on the plate, wherein the frequency range was 75%∼125% of the natural frequency, the frequency resolution was 0.1Hz, the basic excitation amplitude was 1g, and the scanning rate was 1Hz/s. Next, one of the natural frequencies was employed to drive the tested plate at the resonance state, and the laser scanning vibration test system was utilized to get the laser scanning signal and the reference signal with the scanning velocity of 3 mm/s and the adjacent row scanning spacing of 10 mm, so that the modal shape corresponding to the certain mode of the composite plate can be drew based on the information of amplitudes and phases of these two signals. The first six natural frequencies and modal shapes of the composite thin plate measured by the laser scanning vibration test system are listed in Table 1. MVEAL refers to the main view of the equal amplitude line while LVEAL the left view and TVEAL the top view. The total amount of the data and the scanning spots in each mode shape are 2,984,716 and 294, respectively. The total time taken to accomplish the drawing of the first six mode shapes is 90 min. In contrast, it will take twice as much of the time to finish the same test using traditional methods. Therefore, considering the time and effort cost, the self-designed laser scanning vibration test system is more efficient.
The first 6 natural frequencies and modal shapes of the fibre-reinforced composite thin plate measured by the laser scanning vibration test system.
On the other hand, nonlinear vibration characterization measurement was conducted according to the proposed test methods and procedures described in section ‘Nonlinearity characterization test methods and procedures’, and nonlinearity characterization test results are as follows.
1. Harmonic distortion characterization test results
Harmonic distortion characterization test was first conducted at different excitation frequencies after the natural frequencies and modal modes of the composite thin plate were acquired. Figure 5 shows the time waveform and frequency spectrum of the excitation signal obtained in the measuring point B at 300 Hz with the excitation amplitude of 3g, while Figure 6 shows the corresponding time waveform and frequency spectrum of the response signal obtained in the measuring point A. Upon comparing the frequency components of the excitation signal with those of the response signal in Figures 5 and 6, it can be found that the frequency spectrum of the response signal contains some frequency doubling components and the shape of time waveform is not sinusoidal, and so it can be confirmed that the harmonic distortion phenomenon exists in such composite structural system.
2. Nonlinear time-varying damping characterization test results
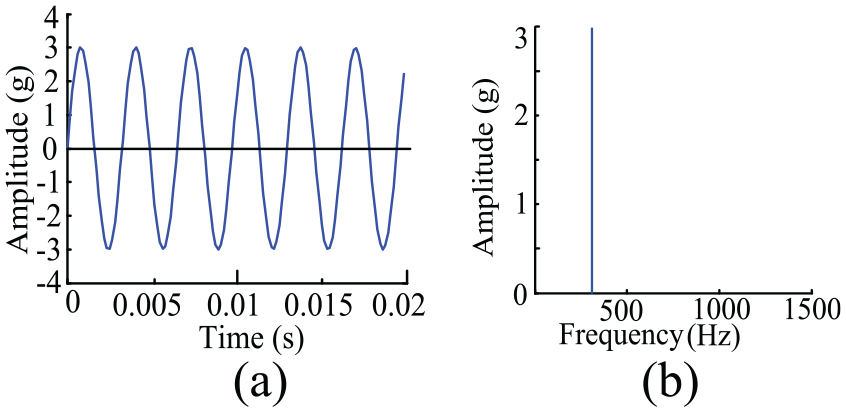
The (a) time waveform and (b) frequency spectrum of the excitation signal.
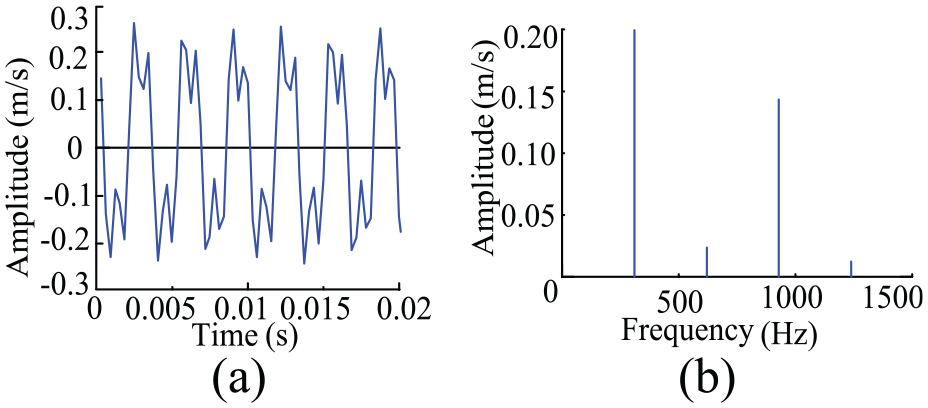
The (a) time waveform and (b) frequency spectrum of the response signal.
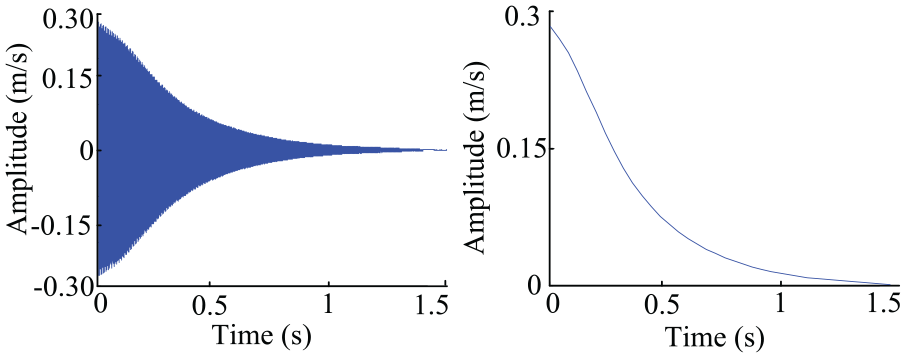
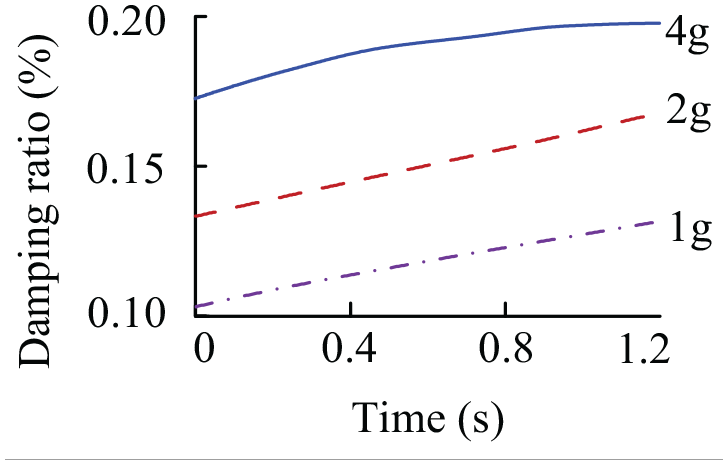
The nonlinear time-varying damping of the composite thin plate is measured at different excitation amplitudes. When conducting the experiments, the excitation amplitudes are set as 1g, 2g and 4g, respectively. Figure 7 gives the sixth resonance attenuation signal and its envelope curve transmitted by Hilbert transform at the excitation amplitude of 1g, and according to the related formula in the study by Li et al., 22 it is practicable to identify the nonlinear time-varying damping parameters at the excitation amplitudes of 1g, 2g and 3g (Figure 8). It can be found that the sixth damping of the composite plate will increase with the increase in the excitation amplitude, and this may be caused by the increase in the friction effect of the interaction between the fibre and the matrix material. Moreover, as the decay time continues, the damping of such composite plate shows an increasing tendency. The nonlinear damping model should be established considering such nonlinear phenomenon, so as to further explain the reason of nonlinear energy consumption.
3. The hard/soft stiffness characterization test results
The sixth resonance attenuation signal and its envelope curve of the composite thin plate.
The sixth nonlinear time-varying damping measured at different excitation amplitudes.
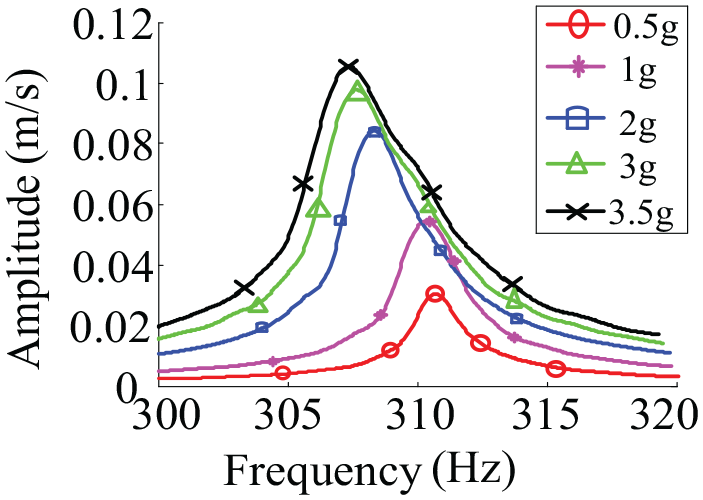
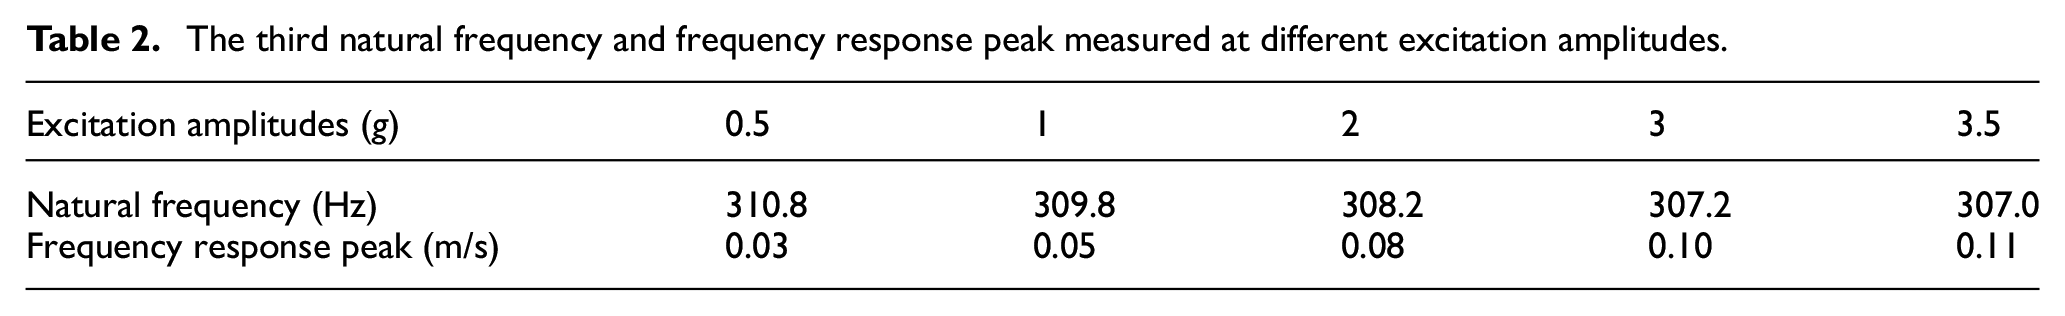
First, a series of excitation amplitudes should be set, including 0.5g, 1g, 2g, 3g and 3.5g. The frequency response curve of the fibre-reinforced composite plate can be obtained at the same sweeping rate of 0.5 Hz/s. Then, the natural frequencies at different excitation amplitudes are identified, and their nonlinear stiffness characteristics can be determined. Figure 9 gives the third frequency response curve within the frequency range of 300–320 Hz, and Table 2 gives the identified natural frequency and the frequency response peak at different excitation amplitudes. It can be found out that the third natural frequency falls with the increase in the excitation amplitude, so that the tested composite plate in the third mode exhibits the obvious soft stiffness characteristics.
4. Amplitude-dependent damping characterization test results
The third frequency response curves of the fibre-reinforced composite plate at different excitation amplitudes.
The third natural frequency and frequency response peak measured at different excitation amplitudes.
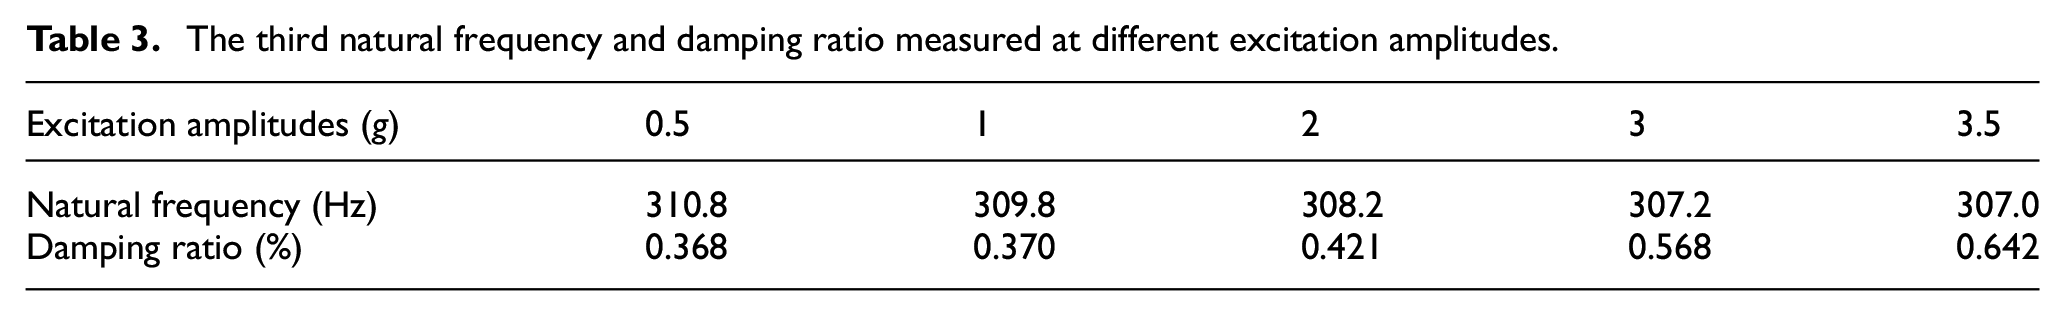
Similar to the hard/soft stiffness characterization test, the same sweeping frequency range and sweeping rate are chosen to obtain frequency response curves at the excitation amplitudes of 0.5g, 1g, 2g, 3g and 3.5g. Since the third frequency response curves of the fibre-reinforced composite plate at different excitation amplitudes are already shown in Figure 9, here it is only required to identify the amplitude-dependent damping parameters according to the classical half-power bandwidth method, as listed in Table 3. The results show that the external excitation amplitudes have a great impact on the damping of the composite plate. For example, the damping ratio in the third mode shows a tendency to increase as the excitation amplitude increases.
5. Nonlinear jump characterization test results
The third natural frequency and damping ratio measured at different excitation amplitudes.
When conducting the nonlinear jump characterization test, the sweeping direction is divided into positive sweep and inverse sweep excitation modes. Here, the nonlinear jumps in the third mode are mainly investigated (Figure 10). By setting the excitation amplitude as 3g and the sweeping velocity as 0.25 Hz/s, the original time waveforms and the related frequency response curves in the positive sweep and inverse sweep directions can be obtained. The nonlinear jump can be easily observed in both the sweep excitation directions, because the steepness and verticality of the curves around the response peak in the frequency domain are obvious. For example, as the forward sweeping frequency slowly increases and reaches the maximum value, the third frequency response will take the jumping action with the increasing amplitude, after which the vibration amplitude will gradually decrease. Similarly, as the reverse sweeping frequency gradually decreases, the vibration amplitude will gradually increase, and there will be a falling jump when reaching a certain point, after which the vibration amplitude gradually decreases.
6. Superharmonic and subharmonic resonance characterization test results
Time waveform and frequency response curves of the fibre-reinforced composite plate in the third mode measured in the positive sweeping and inverse sweeping directions: (a) time waveform in the positive sweeping direction, (b) time waveform in the reverse sweeping direction and (c) frequency response curves in both sweeping directions.
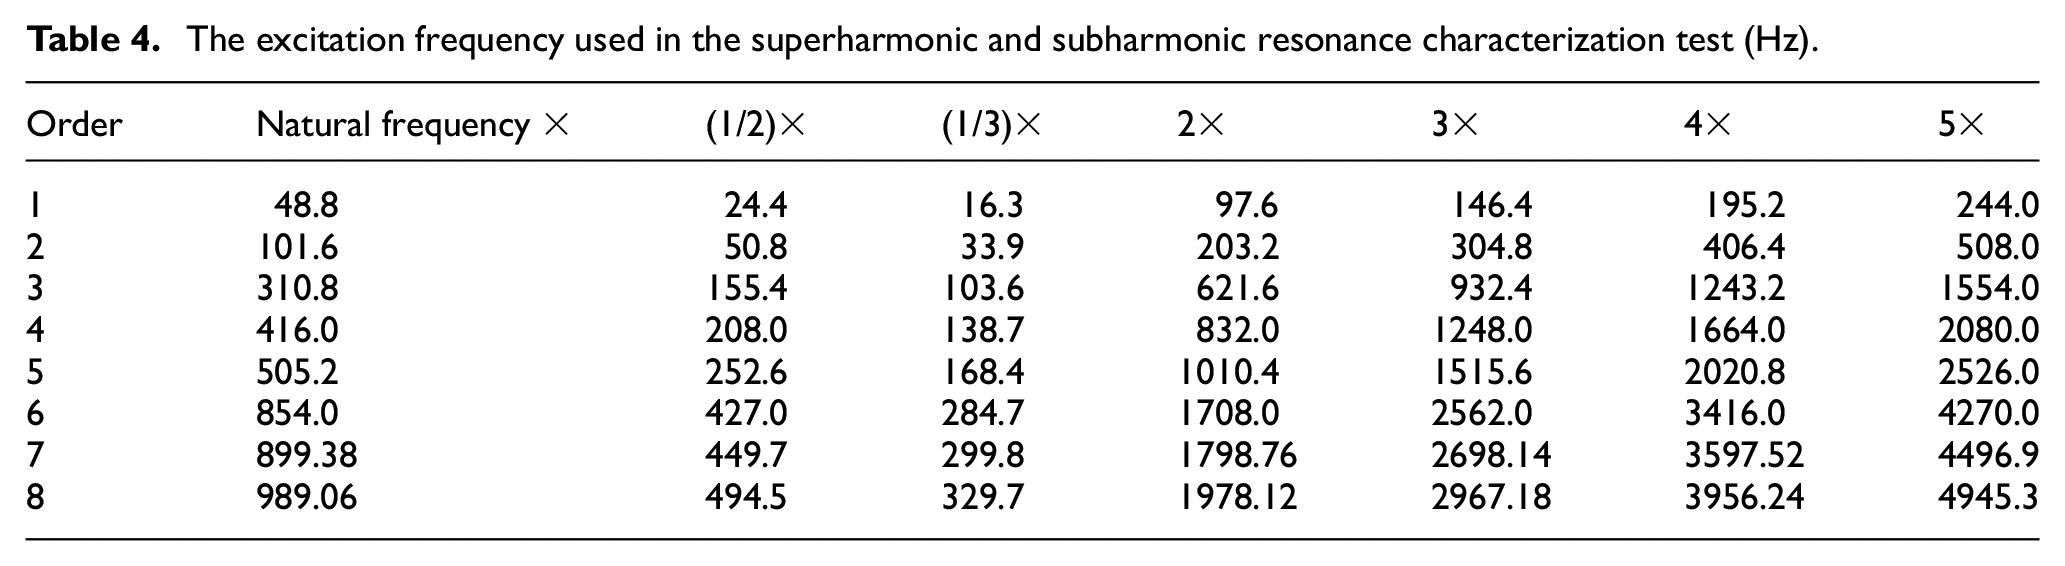
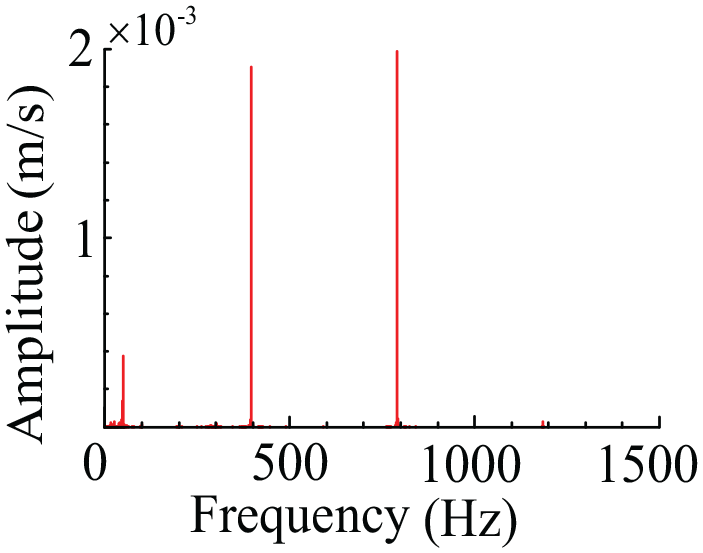
First, to conduct the subharmonic resonance characterization test, the subharmonic resonance excitation frequencies should be set (Table 4). The tested plate was excited by two, three, four and five times of each order of natural frequency. However, such a nonlinear vibration phenomenon was not found by observing the frequency components in the measuring point A. Then, the superharmonic resonance excitation frequency was set before conducting the superharmonic resonance characterization (Table 4). Figure 11 gives the measured frequency spectrum of the response signal with the excitation amplitude of 1g when the excitation frequency is 16.27 Hz, which is 1/3 time of the first natural frequency, and Figure 12 gives the measured frequency spectrum of the response signal with the excitation amplitude of 5g when the excitation frequency is 427.0 Hz, which is 1/2 time of the sixth natural frequency. From which it can be seen that besides the excitation frequency component, the first and sixth natural frequency can also exist in the measured frequency spectrum of the response signal, and so it can be confirmed that superharmonic resonance phenomenon has occurred.
7. Internal resonance characterization test results
The excitation frequency used in the superharmonic and subharmonic resonance characterization test (Hz).

The measured frequency spectrum of the response signal when the excitation frequency is 1/3 time of the first natural frequency.
The measured frequency spectrum of the response signal when the excitation frequency is 1/2 time of the sixth natural frequency.
Considering that the first natural frequency
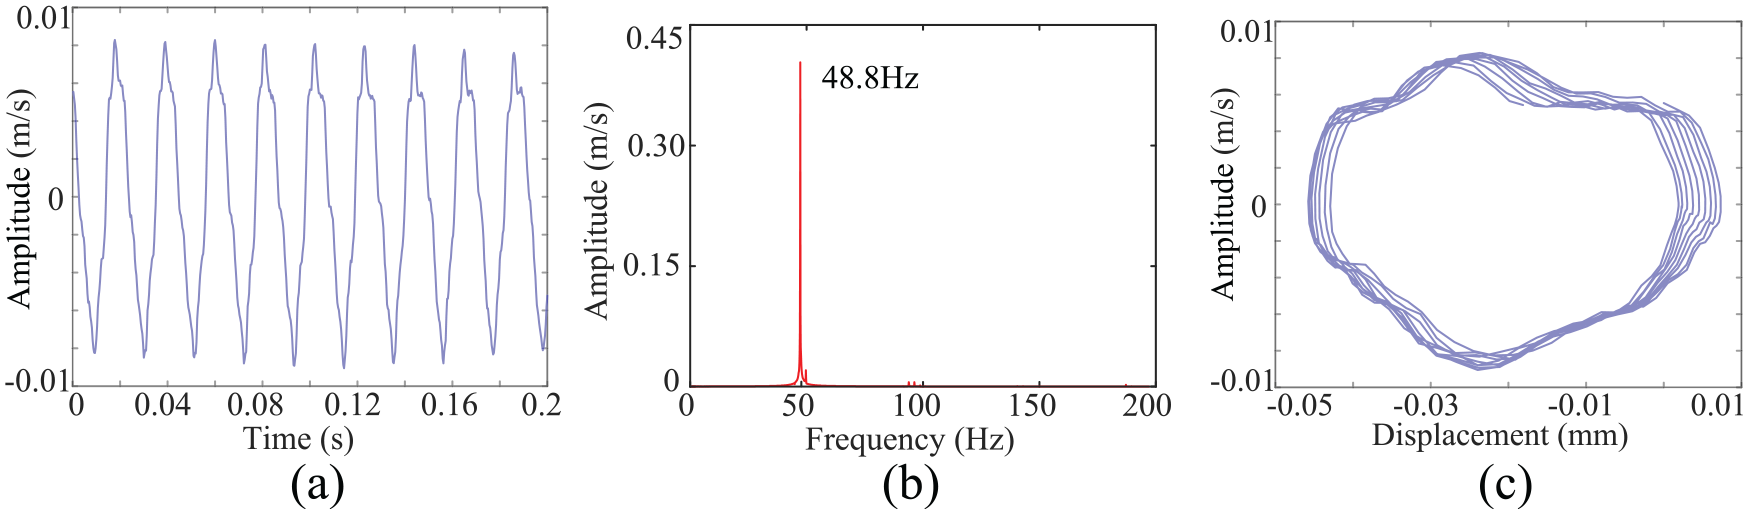
The (a) time waveform, (b) frequency spectrum and (c) phase portrait of the response signal measured at the excitation amplitude of 0.3g and frequency of 48.8 Hz.
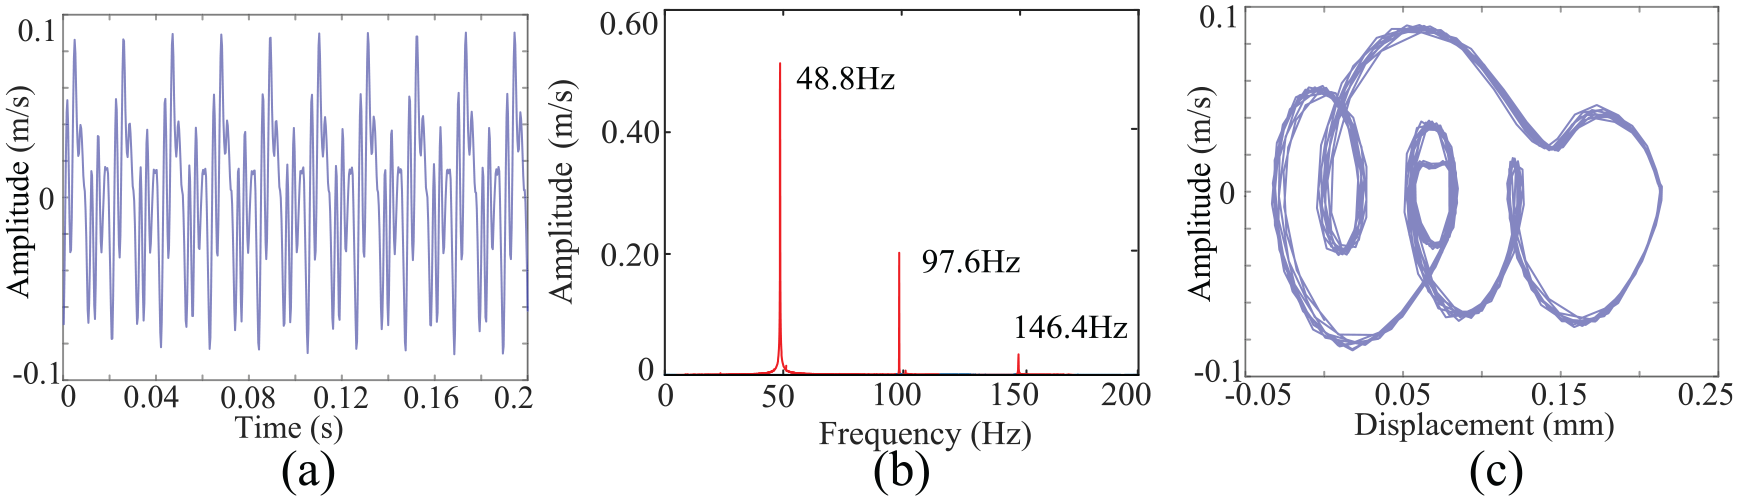
The (a) time waveform, (b) frequency spectrum and (c) phase portrait of the response signal measured at the excitation amplitude of 0.6g and frequency of 48.8 Hz.
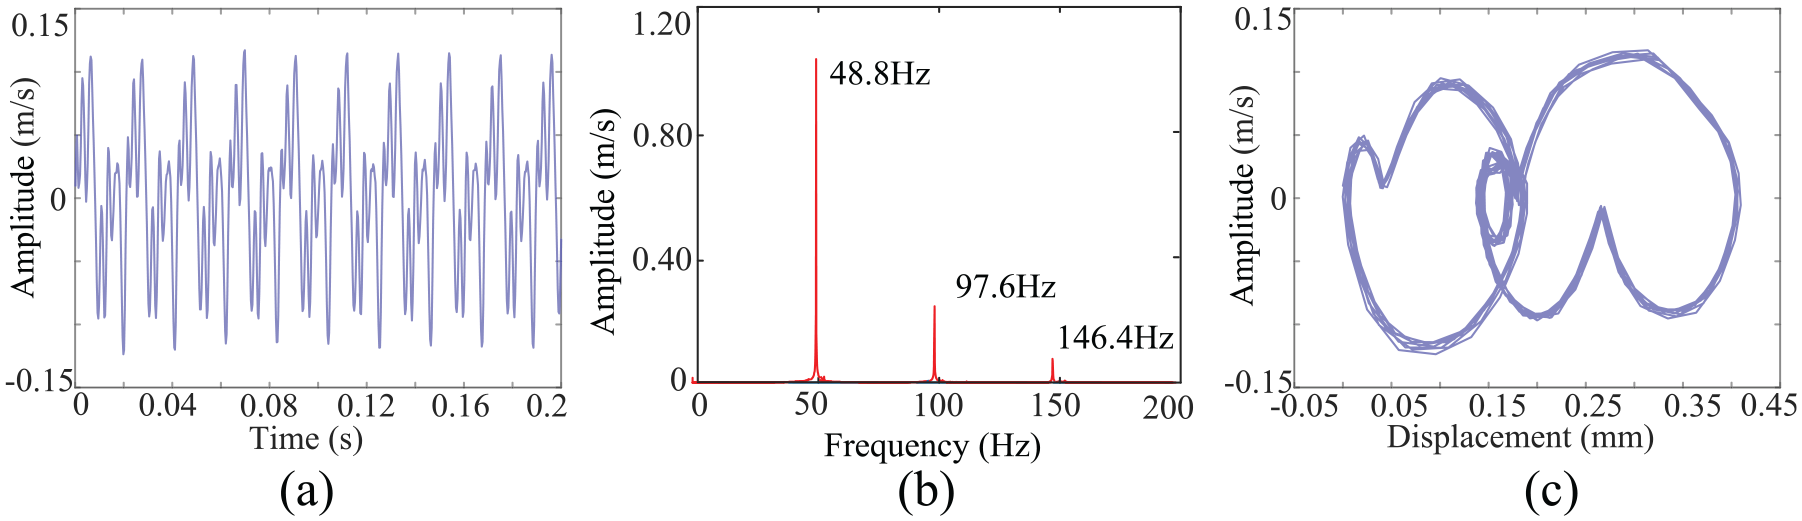
The (a) time waveform, (b) frequency spectrum and (c) phase portrait of the response signal measured at the excitation amplitude of 1.2g and frequency of 48.8 Hz.
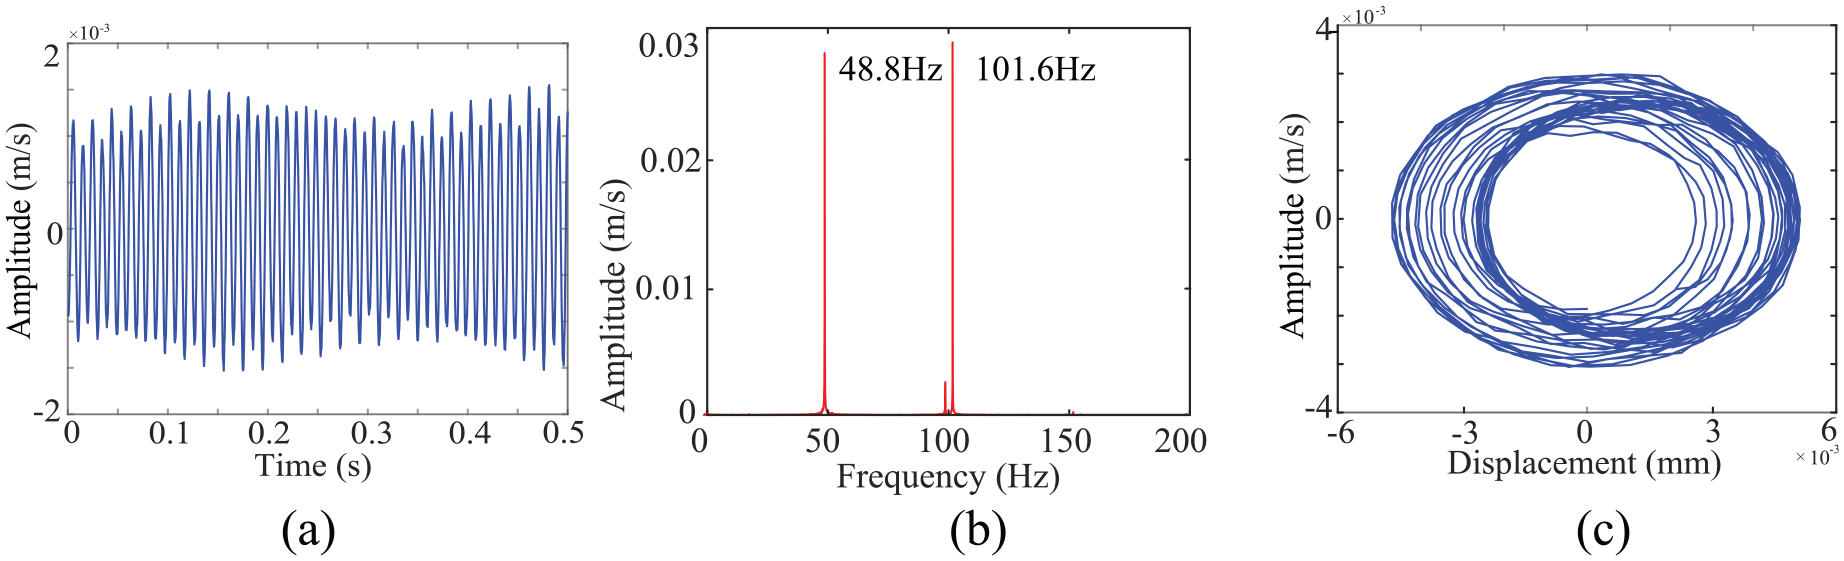
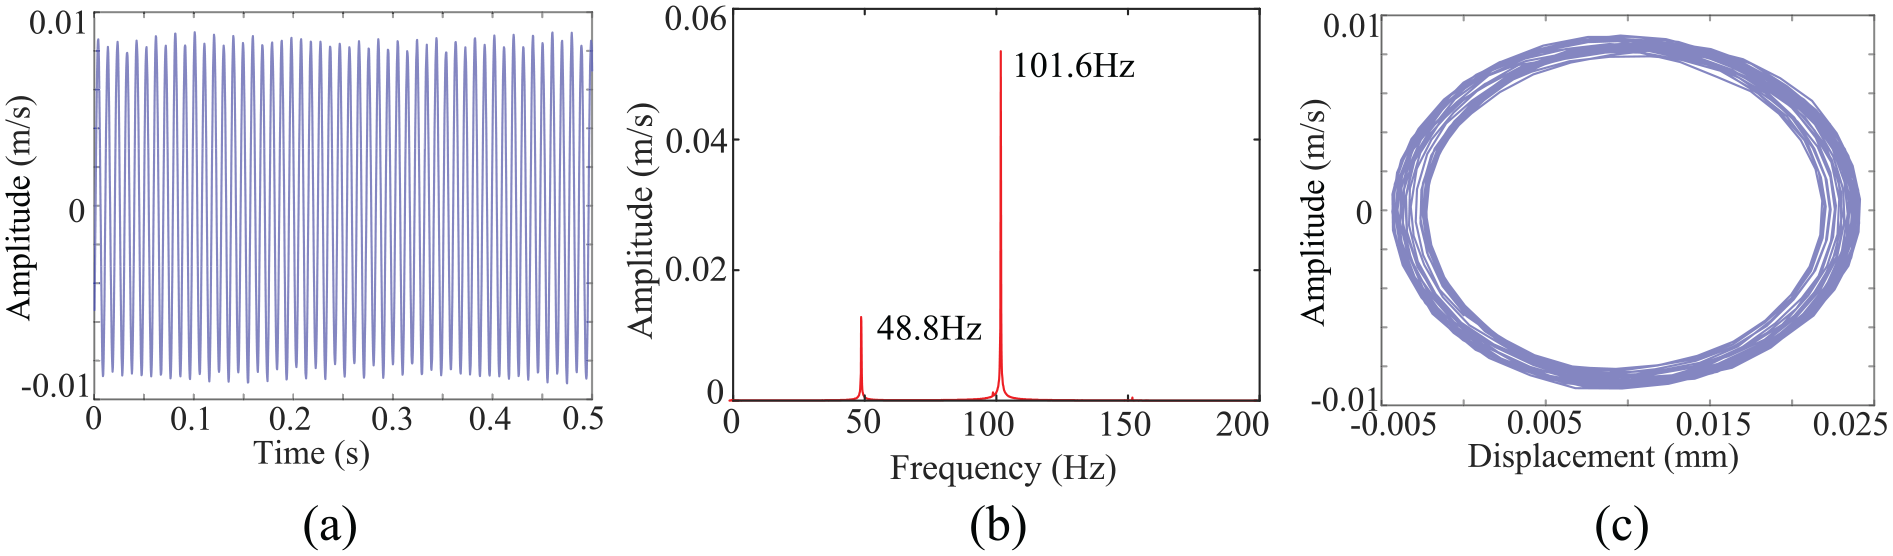
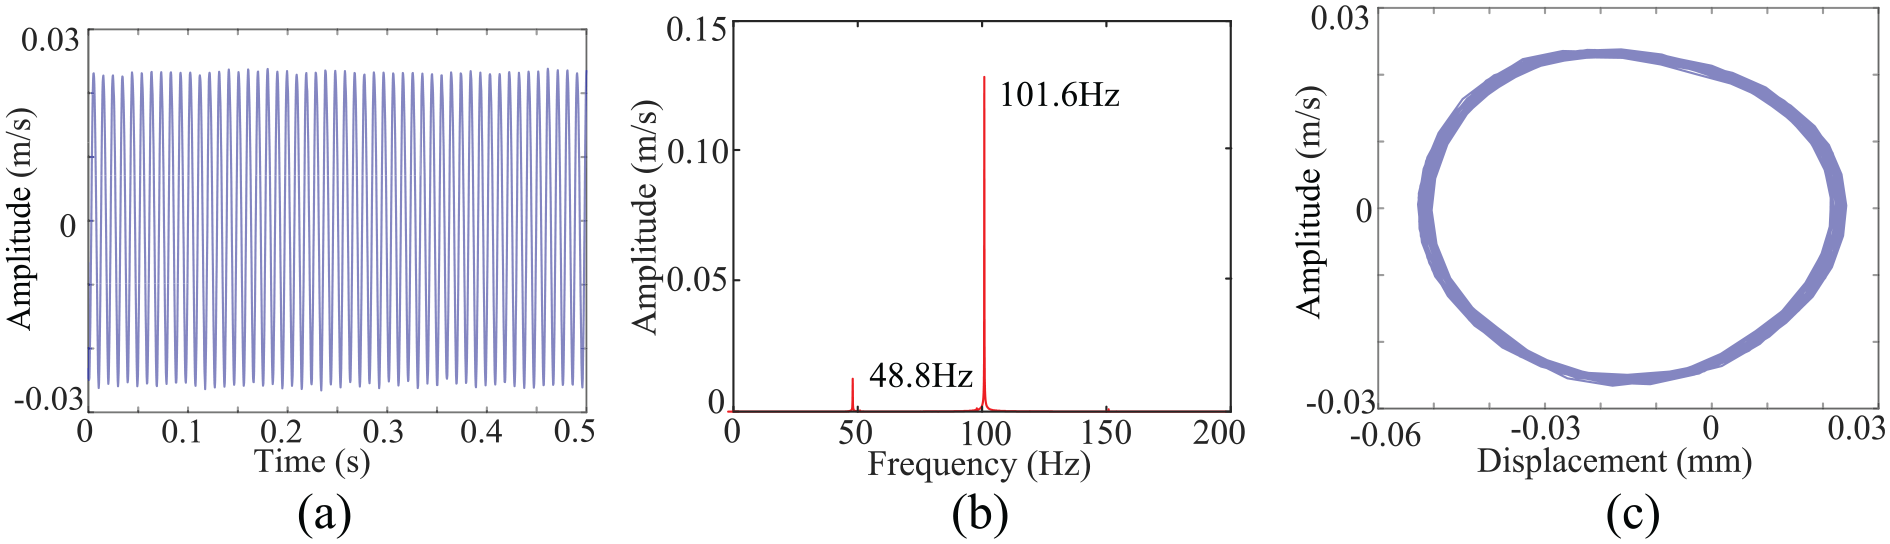
Then, the internal resonance characterization test is conducted by utilizing second natural frequency to excite the composite plate, and the excitation amplitudes are set as 0.3g, 0.6g, 2g and 6g, respectively. Figures 16–19, respectively, give the time waveform, frequency spectrum and phase-plane portrait of the response signal of the composite plate at 101.6 Hz at the excitation amplitudes of 0.3g, 0.6g, 2g and 6g in the measuring point A.
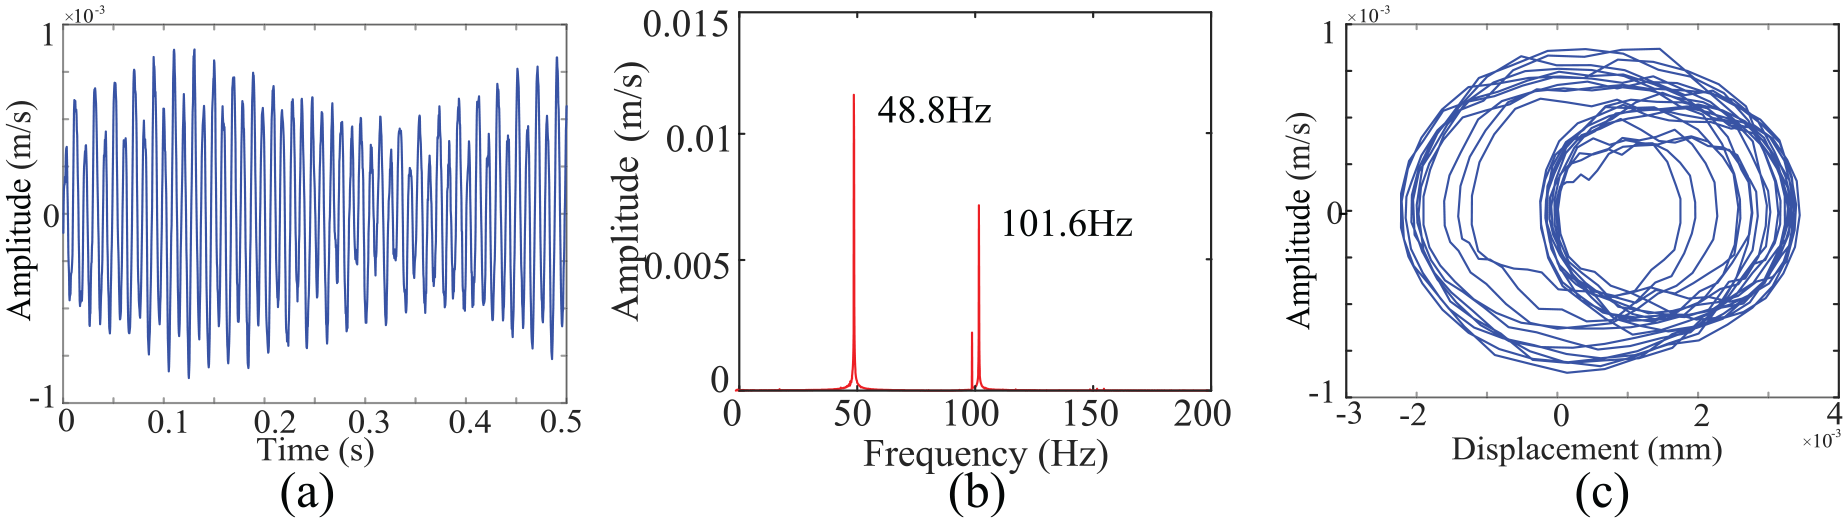
The time- and frequency-domain response and phase-plane diagram measured at the excitation amplitude of 0.3g and frequency of 101.6 Hz: (a) time waveform, (b) frequency spectrum and (c) phase-plane portrait.
The time- and frequency-domain response and phase-plane diagram measured at the excitation amplitude of 0.6g and frequency of 101.6 Hz: (a) time waveform, (b) frequency spectrum and (c) phase-plane portrait.
The time- and frequency-domain response and phase-plane diagram measured at the excitation amplitude of 2g and frequency of 101.6 Hz: (a) time waveform, (b) frequency spectrum and (c) phase-plane portrait.
The time- and frequency-domain response and phase-plane diagram measured at the excitation amplitude of 6g and frequency of 101.6 Hz: (a) time waveform, (b) frequency spectrum and (c) phase-plane portrait.
It is shown that when the excitation frequency is 48.8 Hz (the first natural frequency) and the excitation amplitude is 0.3g, the second natural frequency (101.6 Hz) cannot be excited in the frequency spectrum of Figure 13(b), and it can also be proved by the phase-plane portrait in Figure 13(c) because the corresponding morphology is characterized by the one-period motion. Then, when the excitation amplitude is set to 0.6g and 1.2g, it can be found that the superharmonic vibration has appeared in the composite plate since there are multiple frequency components in the frequency spectrum of Figures 14(b) and 15(b), which can also be proved by the phase-plane portrait of Figures 14(c) and 15(c), because the corresponding morphologies are characterized by the multiperiod motion. Therefore, it can be confirmed that there is no transmission of vibrational energy between the two modes, that is, the 1:2 internal resonance phenomenon has not occurred.
While the excitation frequency is 101.6 Hz (the second natural frequency) and the excitation amplitude is 0.3g, the first natural frequency can be excited in the frequency spectrum of Figure 16(b), and the first resonance amplitude is higher than the second resonance amplitude. Besides, from the phase-plane portrait of Figure 16(c), it is noticeable that the morphology is characterized by the two-period motion, and the phase-plane portrait is chaotic, and so it can be verified that the 1:2 internal resonances have occurred and vibration energy transformations do exist between the two modes. Then, when the excitation amplitude is adjusted to 0.6g, 2g and 6g, from the frequency spectrum of Figures 17(b), 18(b) and 19(b), the first natural frequency can also be excited at the excitation amplitudes of 0.6g, 2g and 6g, and the resonance amplitude at the lower natural frequency of the composite plate will decrease compared with the one at the higher natural frequency, which shows that the 1:2 internal resonance phenomenon is gradually weakening. Meanwhile, from the phase-plane portrait of Figures 17(c), 18(c) and 19(c), the same conclusion can be drawn since the corresponding morphology is changed from the two-period motion to the one-period motion.
Conclusion
This research proposes a feasible nonlinear vibration characterization test method and procedure of a fibre-reinforced composite thin plate. A vibration test system of the composite plate specimen based on the laser scanning technique is designed and developed, which is very helpful to master the linear vibration characteristics, including natural frequencies, modal shapes and so on, with the higher testing efficiency and accuracy. Also, it has been proved that a total of seven kinds of nonlinear vibration phenomena can be investigated by utilizing the proposed characterization test methods. However, in the future studies, more composite plate specimens should be tested, so as to well describe these nonlinear vibration characteristics. Besides, it is also necessary to establish the corresponding dynamic models to analyse the nonlinear mechanisms of the above-mentioned phenomena.
Footnotes
Declaration of conflicting interests
The author(s) declared no potential conflicts of interest with respect to the research, authorship and/or publication of this article.
Funding
This study was supported by the National Natural Science Foundation of China (grant nos 51505070 and U1708257), the Fundamental Research Funds for the Central Universities of China (grant No. N160312001, N170302001 and N180313006) the Scholarship Fund of China Scholarship Council (CSC) granted No. 201806085032 and the Key Laboratory of Vibration and Control of Aero-Propulsion System Ministry of Education, Northeastern University (grant no. VCAME201603).