
Abstract
The laser linear scanning method is proposed to measure the modal shape of fiber-reinforced composite thin plate with high efficiency and precision. First, by establishing the laser scanning frame model of the composite plate, the corresponding extraction principle of modal shape data and laser scanning rate selection criterion are explained in detail to clarify the theoretical principle of laser linear scanning method. The corresponding test procedure of modal shape, drawing method from the shape scanning data, and control method of the constant laser scanning rate are also proposed based on the developed laser linear scanning system. Then, a TC300 carbon fiber/resin composite thin plate is taken as a research object to verify the effectiveness and reliability of such a method, through comparing the results obtained by the traditional experimental modal method and finite element method. Moreover, the influences of constraint boundary condition, excitation level, laser scanning rate, scanning spacing, scanning path mode, the fiber angles, and fiber material damage on modal shape results are also discussed. It has been found that laser linear scanning method can improve test efficiency of modal shape of the composite plate with high preciseness. Except for scanning path mode, the other parameters have a major impact on each shape morphology, and their effects can be quantitatively analyzed by identifying the positions and clarity of nodal lines of each modal shape. Especially, the high-density modal shape results and their equal amplitude lines in different projection views can be used to determine whether or not the composite plate is damaged as well as its damaged degrees.
Keywords
Introduction
The fiber-reinforced thin plate structures have been gradually used in aeronautics, astronautics, automobile, ships, weapons, and other industrial fields1,2 due to the high specific strength and modulus, good thermal stability, high bearing capacity, and lightweight. Modal shape is the basis of studying on the linear and nonlinear vibration characteristics of such composite plates, which can be used to reflect the morphological characteristics in the certain mode and also be critical for the theoretical modeling, response prediction, damage detection, and so on.3,4
For a long time, the experimental modal analysis theory has been mainly employed to measure the modal shapes of fiber-reinforced composite structures, which is realized by combining the frequency response function measurement method with modal parameter identification method. For example, Oh and Nayfeh5,6 tested modal shapes of a fiber-reinforced composite thin plate by using hammer and laser vibrometer, and found that the most of the modal shapes can be obtained by this technique. Yet, it was hard to identify some shape results due to the interference of some nonlinear phenomena. Tita et al. 7 measured the modes of a fiber-reinforced composite plate in different fiber direction by pulse excitation and also obtained the majority of the modal shape results. However, due to the light mass of the plate, some experimental errors were inevitably contained in the contact measurement by accelerometers. Chaudhuri et al. 8 used the exciter to vibrate the composite thin plate. The natural frequencies and vibration modes were obtained by moving the accelerometers manually in the length and width directions. Because of the influence of additive mass and stiffness resulting from the contact excitation, the test accuracy was still a problem. Besides, there are large amounts of measuring points which needed to be tested by mounting accelerometers to the surface of the plate, so the time expenditure was significant. Mota et al. 9 investigated the vibration test technique of an anisotropic composite thin plate. The electromagnetic exciter and laser Doppler vibrometer were employed to obtain the frequency response function and the corresponding mode results. It was also proved that the more accurate vibration information of the composite plate can be acquired by the noncontact laser measurement technique. Kong et al. 10 also used hammer excitation technique to obtain the modal shapes of the composite plate with the four edges clamped by some fixture tools. He found that the nodal lines of vibration shape were critical to the measurement. If the measured points were near or on the top of nodal lines, it was difficult to get accurate modal shape results due to the poor response signal. Zhingming 11 established a modal measurement system to get the first five natural frequencies and modal shapes of a two-dimensional woven fiber composite plate, and the results showed that the modal parameters were greatly affected by the fiber fabricating techniques as well as the additional masses of the sensors. Zhao et al. 12 obtained the first three natural frequencies and modal shapes of a fiber-reinforced composite thin plate by the multiple-point excitation techniques, but there were still some differences between the measured and calculated modal shape results due to the effects of inadequate knocking points. Qi et al. 13 conducted the modal test on the undamaged and damaged fiber-reinforced composite plate with an opening hole; it was found that the shape results were basically the same despite the varied hole positions by only investigating the first three modal shapes.
Since the 1960s, the laser measurement technology has been gradually developed, which gives a new chance for people to get the modal shape results of the various structures. Lading 14 studied the signal-to-noise ratio of the laser Doppler vibrometer. Stanbridge and his colleagues15,16 discussed the theoretical foundation on the basis of conical scanning, small-scale circular scanning, and linear scanning of the single-point laser vibrometer (SPLV). The modal shapes data of the metal plate or shell structures were also obtained. Pérez-López et al. 17 combined the laser vibrometer measurements with proper orthogonal decomposition (POD) method to decompose the vertical displacement velocity, so as to plot the POD modal shapes related to the resonant modes of an aluminum square plate. The experimental data were used to calculate the eigenfunctions and the eigenvalues of the plate. Martarelli et al. 18 measured the modal shapes and operational deflection shapes of a two-bladed rotor by applying different methods based on the laser Doppler vibrometer. Ji et al. 19 studied the measurement technique of sine vibration in an unknown direction with an SPLV, and applied it into the in-plane vibration test of the ultrasonic motor. Wang et al. 20 applied the laser Doppler vibrometer to measure the traveling wave mode of the ultrasonic motor and also proposed a test method to obtain modal shapes of the stator. However, due to the lack of corresponding data demodulation technique and software, these applications of laser scanning technology are only in the primary stage. Longo et al. 21 proposed an experimental method for crack detection of the steel beam, which was based on the surface acoustic waves (SAWs) and the laser Doppler vibrometer. They also proved that these optical measurement data can be used to build a linear model to estimate the crack depth of the beam-like structures.
In recent years, the continuous scanning laser vibrometer (CSLV) technology is also developing rapidly, and several foreign company (e.g. POLYTEC and ONOSOKKI) and researchers have made a great progress in this field. Brehmer 22 and Sinapius 23 measured modal shapes of an aluminum plate by the scanning laser vibrometer, and proposed the algorithm to optimize laser scanning path on the basis of the relations between the scanning frequency, scanning direction, motion track of the mirror, and so on. Ghoshal et al. 24 used the scanning laser Doppler and piezoelectric actuator to obtain vibration deflection shapes of the fiber composite structures embedded delaminations, and a series of experiments were performed on these plate beams with various sizes, ply-level locations, and placement of delaminations to evaluate the performance of the laser technique. Castellini et al. 25 used the theoretical knowledge of modal shapes in the specific structure as a way of filtering the time domain data obtained by continuous scanning laser Doppler vibrometer. Yang and Allen 26 combined the continuous scanning laser approach with the conventional point-by-point approach base on the harmonic transfer function method, and acquired the three-dimensional velocities under various types of excitation conditions.
However, due to the high price and many application problems of the CSLV, including the difficulty of laser receiver in the curved surface, the limitation in large scanning angle and distance, and so on. It is still necessary to study a variety of applications of the SPLV, especially applying it on the measurement of the composite structure. On one hand, it is suitable to measure nonlinear natural frequencies and modal shapes of the lightweight and thin-walled composite plate, whose vibration characteristics are closely related with the excitation amplitude and frequency. On the other hand, there are still lots of problems need to be worked on and provide better solutions. For example, what kind of scanning mode is better? How to set a proper scanning rate to finish laser scanning test? How to consider the influences of fiber orientation and extract shape data? Can the laser scanning method be applied in identifying the differences between the normal and fiber breakage composite plate? Therefore, the deeper researches are needed, especially in the improvements on test efficiency, software development, the special test system design for composite structure, and so on.
In the paper, the laser linear scanning method is proposed to efficiently measure modal shapes of fiber-reinforced composite thin plate. First, the laser scanning frame model of the composite plate is established, and the extraction principle of modal shape data, laser scanning rate selection criterion is explained in detail to clarify the theoretical principle of laser linear scanning method in the “The theoretical principle of laser linear scanning method” section. Then laser linear scanning system is developed. The function of hardware components, the operation interface of control software based on LabVIEW, and control method of the constant laser scanning rate are introduced in the “Design and development of laser linear scanning system” section. Next in the “Test procedure of modal shape” and “Drawing method of modal shape” sections, test procedure of modal shape and the corresponding drawing method from the shape scanning data are proposed, and a TC300 carbon/resin composite plate is taken as a research object to verify the effectiveness and reliability of such a laser scanning method in “A case study” section. Finally, in the “Influence analysis on test accuracy of modal shape” section, the influences of constraint boundary condition, excitation level, laser scanning rate, scanning spacing, scanning path mode, the fiber angles, and fiber material damage on modal shape results are also discussed.
The theoretical principle of laser linear scanning method
According to the vibration theory, each modal shape of a linear structural system can show certain vibrating morphological characteristics, and the influences of modal coupling can be suppressed as much as possible when the system is under the resonance in the certain mode (no matter it is composite structure or single-material structure). Therefore, it can be regarded as a single-freedom vibration system. Consequently, the modal shape corresponding to the certain mode can be described by using these information if the vibration response amplitude and phase of the measuring points can be obtained by some experimental techniques.
Due to the thin thickness, lightweight, rich local modal shape, and nodal lines of the fiber-reinforced composite plate, in this section, the laser scanning frame model is first established before the formal test of the modal shape results, which can help to set the scanning route and determine the scanning parameters.
Establishment of laser linear scanning frame model and the test principle
A laser scanning framework model of the fiber-reinforced composite thin plate is illustrated in Figure 1. A fixed coordinate system of
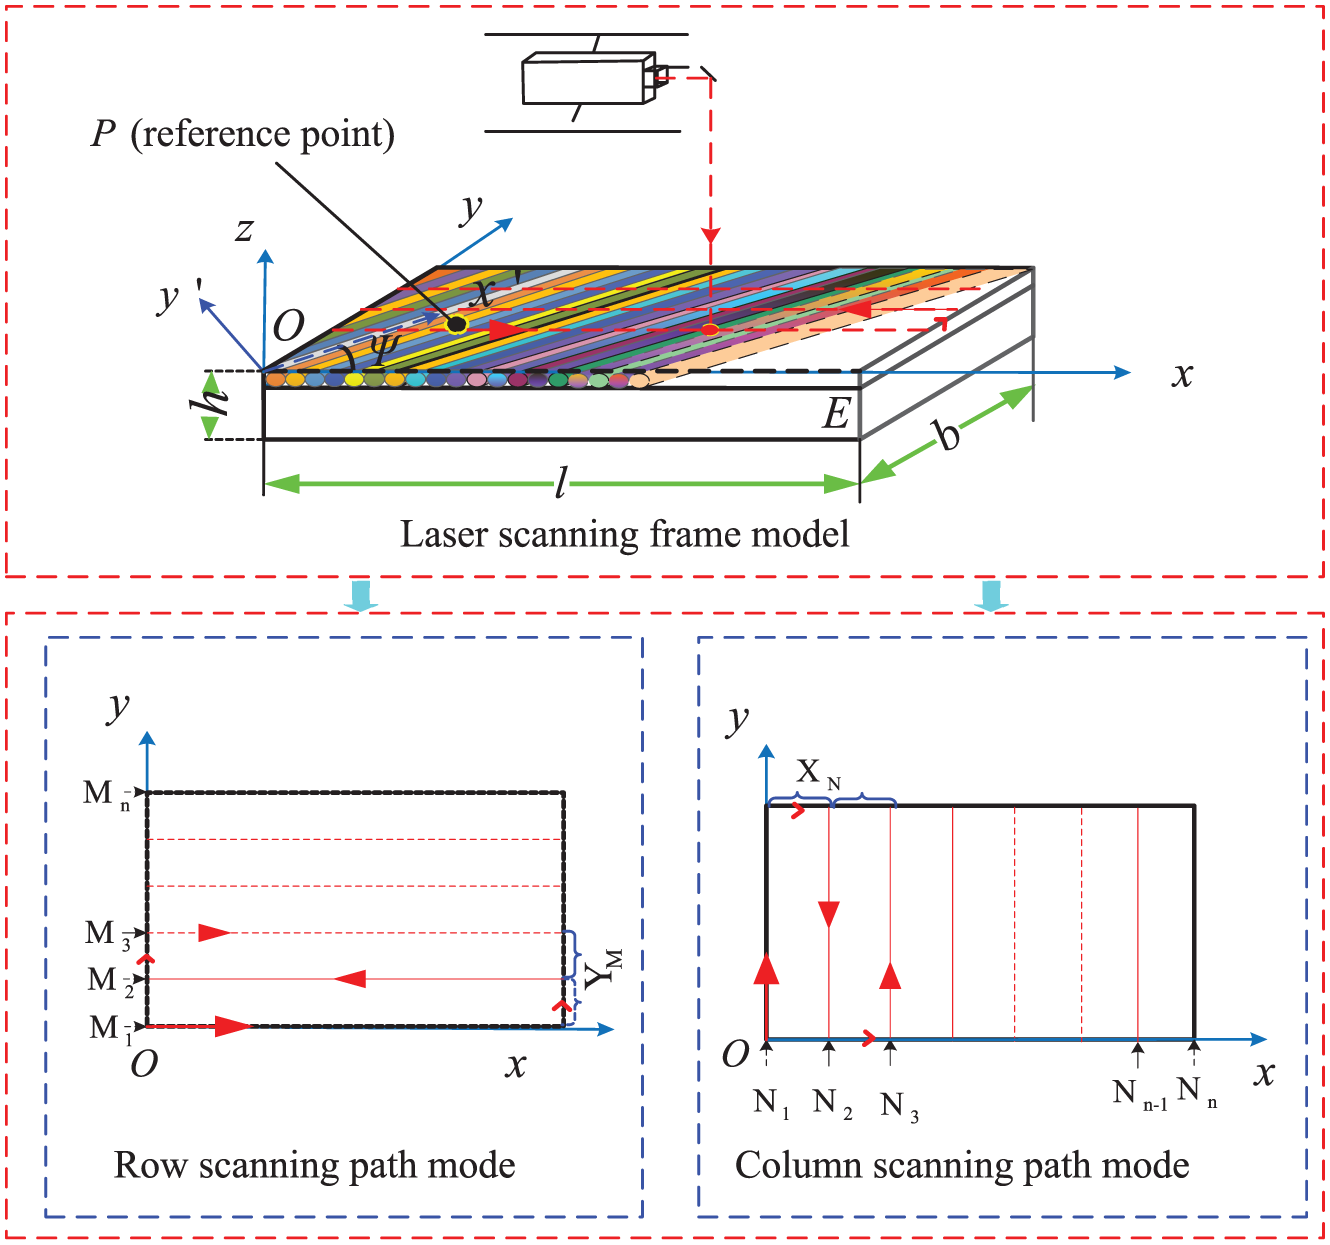
Laser scanning frame model of the fiber-reinforced composite plate.
Assuming that the laser point released by the SPLV can move along the straight line, the modal shape scanning process can be divided into the row scanning path mode (
Taking row scanning path mode for an example, first take a short distance along the
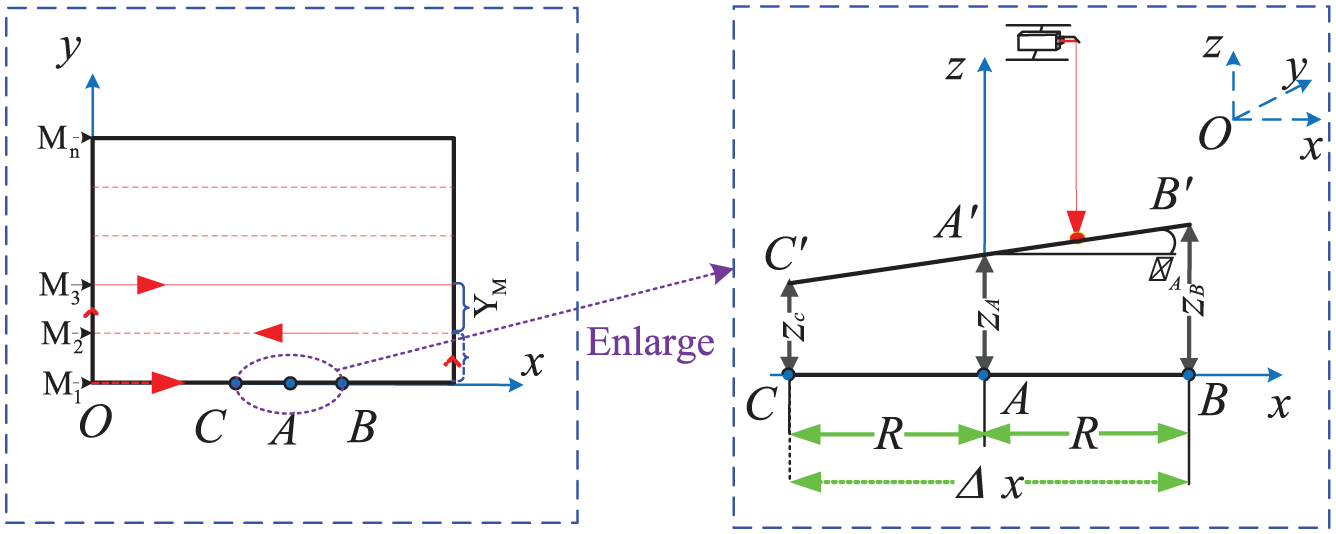
Schematic representation of laser linear scanning test.
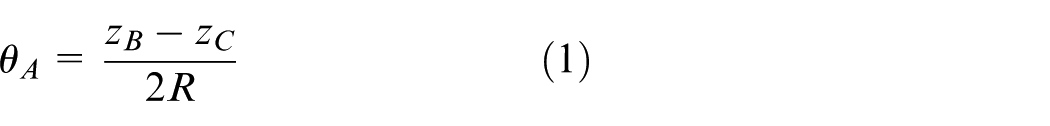
The angular velocity of the scanning point A can be expressed as
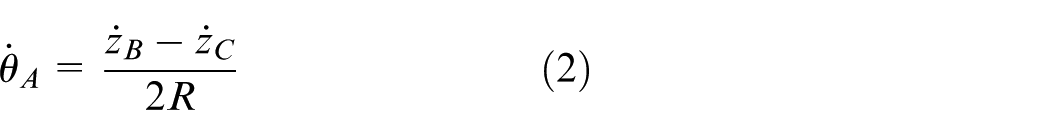
Suppose that laser scanning rate which can be represented by v is a constant. When laser point moves to the scanning point A, its vibration velocity in the coordinate system of

Then, suppose that u represents the distance of the scanning point A in the coordinate system

Assuming the composite plate is subjected to the basic excitation load, it is proportional to the excitation force


where
According to laser Doppler principle, the time waveform of the response signal

Carry out FFT (fast Fourier transformation) operation to
where
When a certain natural frequency
where,
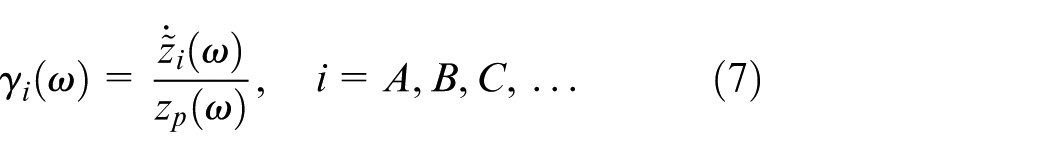
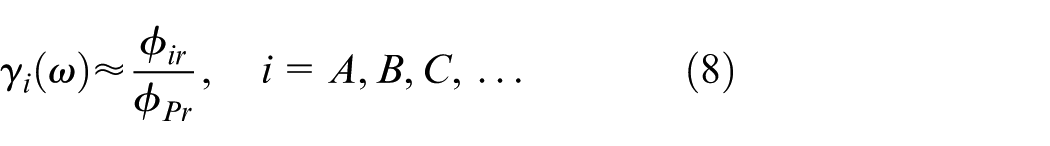
In order to reduce the influences of ambient noise, the transmissibility function
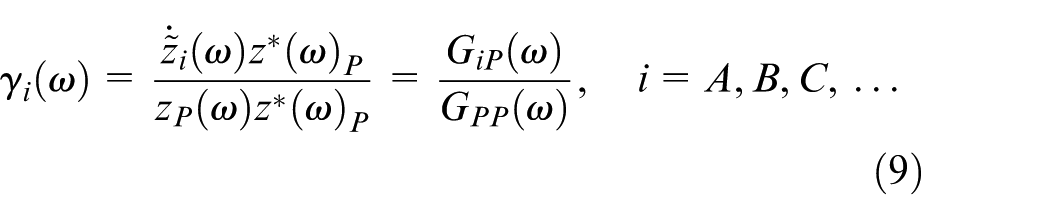
where
Through Equation (9), the amplitude and phase information from the transmissibility function at the resonance state when the excitation frequency is equal to the certain natural frequency can be read, because the amplitude values and phase relations can be clearly determined between the scanning points and the same reference point.
If we can extract the above information and load them on the modal shape model which are mainly composed of the scanning points of the established laser scanning frame model, a certain modal shape of composite thin plate can be drawn. (We will explain the drawing method of modal shape in the “Drawing method of modal shape” section.)
The extraction principle of modal shape data
Assuming that each modal shape measurement of fiber-reinforced composite thin plate is finished by row scanning path mode, the total number of measurement points in each row of frame model (such as the row of
The concerned time of
Then, the time width
where
Finally, we can extract vibration response data of different scanning points in each scanning row in Figure 1. For example, for the first scanning point when
Selection criterion of laser scanning rate
In the scanning practice, it is found that the slower scanning rate and the smaller row or column spacing are selected, the more accurate modal shape results will be gotten, but it will severely affect test efficiency. Therefore, it is necessary to discuss the relationship between laser scanning rate and scanning spacing (the row spacing or the column spacing), so that we can work out a rational selection criterion of the scanning rate.
We still assume that row scanning path mode is chosen to finish laser scanning test. Otherwise, laser scanning rate is v and the length of laser scanning frame model is
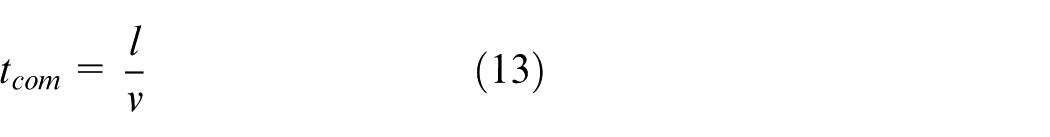
Assuming that the sampling frequency of scanning process is constant, it can be represented by

In the row scanning path mode, in order to draw the modal shape model conveniently, usually we need to ensure that the distances between adjacent scanning points are equal in the x and y directions, that is,
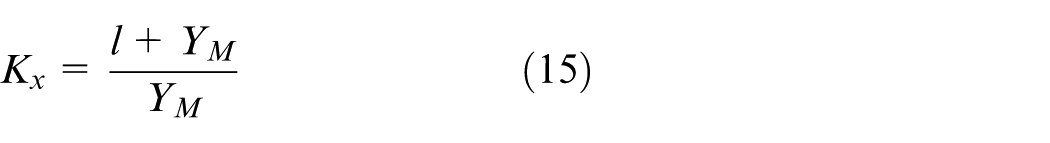
Similarly, the required number of the scanning points in the x direction,
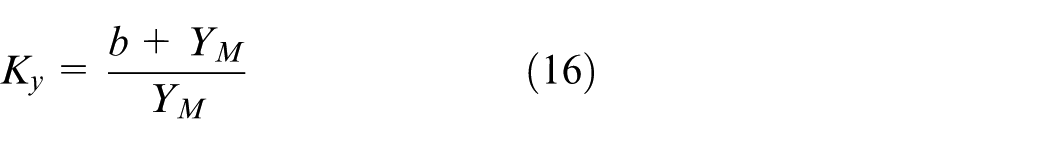
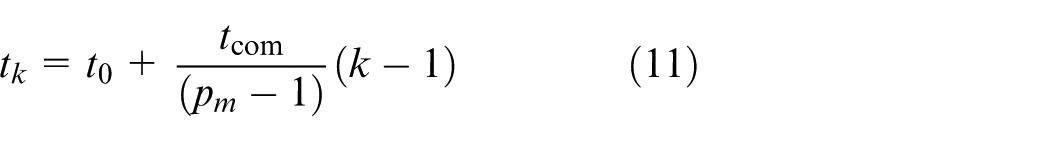
According to Equations (12) and (15), if the time width

Substituting Equation (15) into Equation (17), Equation (18) can be expressed as
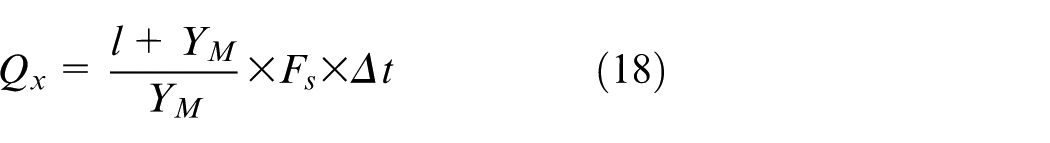
Because the total data amount of
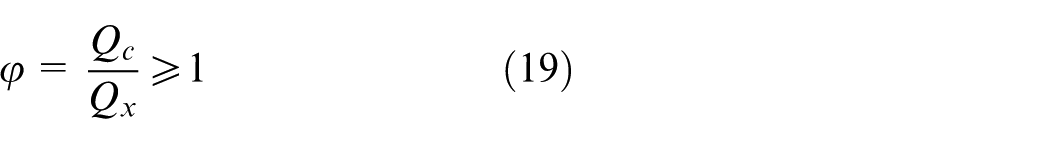
Then, substituting Equations (14) and (17) into Equation (19), the relationship can be obtained between laser scanning rate and scanning spacing (the row spacing) as follows
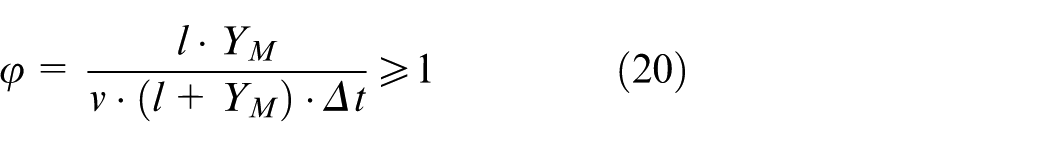
According to processing experience of shape data, in order to ensure high-quality modal shape results, the adjacent row spacing should be less or equal to one-tenth of the length of composite plate, that is,
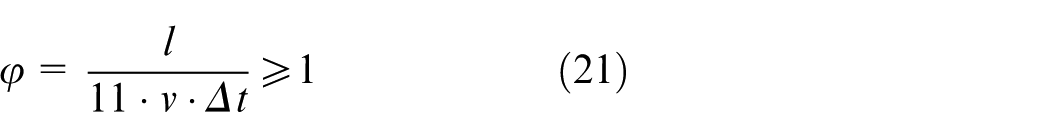
Equation (21) is the derived selection criterion of laser scanning rate, and only when
Design and development of laser linear scanning system
In order to measure vibration parameters accurately and efficiently, such as natural frequency, modal shape, and damping results of fiber-reinforced composite thin plate, first, laser linear scanning system is designed and established, whose hardware and software functions are introduced in the following section.
Hardware design of laser linear scanning system
The hardware components of laser linear scanning system are shown in Figure 3, which includes laser Doppler vibrometer, 45 degree mirror, step motor, stepping motor driver, motion controller, and other hardwares. In this scanning system, Polytec PDV-100 laser vibrometer is used to precisely measure vibration frequency and amplitude of composite plate, and 45 degree mirror is to adjust the laser beam from the horizontal direction to the vertical direction. Besides, X–Y sliding table can take the laser vibrometer to move along x and y directions with the two-direction sliding range of 300 × 400 mm 2 , and two Leadshine 86HS45 stepping motors are also installed in the sliding table to control the reciprocating motion of the slider, so that the continuous laser scanning function can be realized with the scanning rate of 0 to 20 mm/s. Finally, in order to control the stepping motors by the self-designed program based on the LabVIEW, Shuoke R-10 motion controller is selected to connect stepping motors to the notebook through RS485 serial communication port.
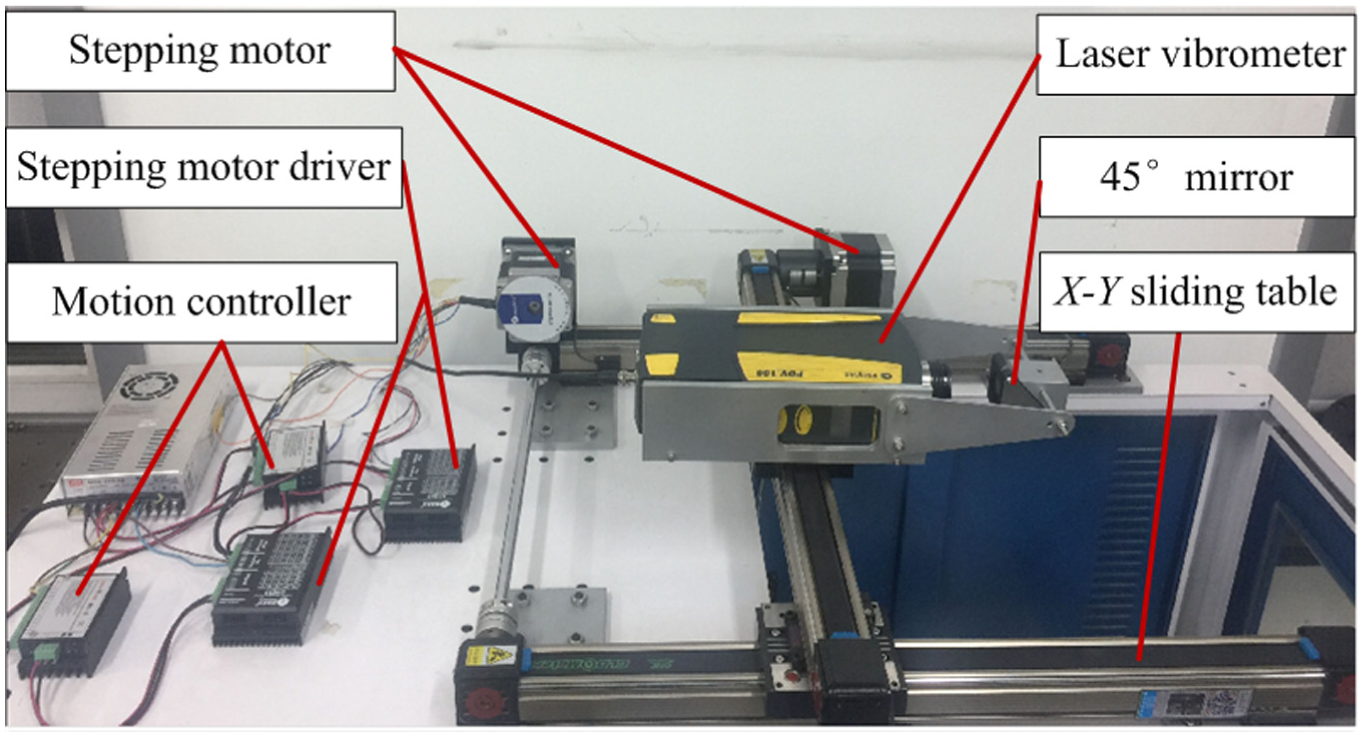
The hardware components of laser linear scanning system.
Software design of laser linear scanning system
Employ LabVIEW software to write the laser scanning control program and set a series of virtual buttons to realize different functions. Figure 4 gives the self-designed control software and its operation interface, which mainly has three basic functions, including scanning mode selection, automatic scanning setting, and manual scanning setting. First, we can input the length, width, and thickness of composite plate, and determine row scanning path mode or column scanning path mode by select button. Then, the different scanning parameters were set, which include the origin coordinate, the scanning rate, acceleration and deceleration distance, the target-position, forward run, reverse run, and so on. The laser linear scanning system can automatically perform scanning measurement in each scanning row or column, which will greatly improve test efficiency of modal shape results of composite plate. In addition, start and stop button, scanning rate adjustment disc, and scanning range scale in x and y directions are listed in the manual scanning interface. These virtual buttons can be clicked by the mouse to manually control the movement of laser point until the laser point reaches to the desired position; then, we can measure natural frequency and damping results by hammer excitation technique.
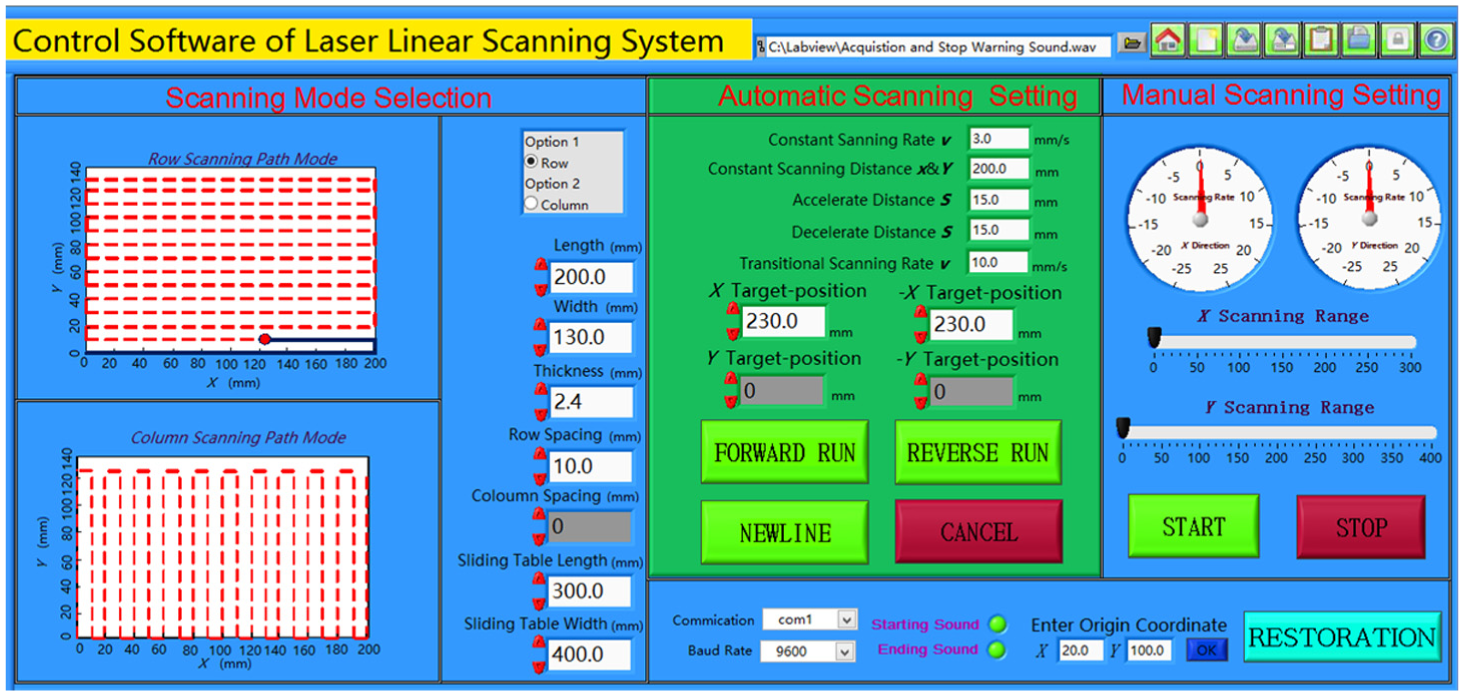
Control software of laser linear scanning system based on LabVIEW.
Control method of the constant laser scanning rate
When we measure modal shapes of fiber-reinforced composite thin plate by laser linear scanning method, in order to ensure we can use a constant laser scanning rate to finish modal shape scanning test, it is necessary to formulate a practical technique in the software to control laser scanning rate. Here, the actual scanning length of the laser point is divided into three different stages, as shown in Figure 5: (1) Acceleration stage (see the line segment of O1O), whose displacement to the coordinate point of O is s; (2) Constant stage, whose distance is equal to the length of composite plate (so it is
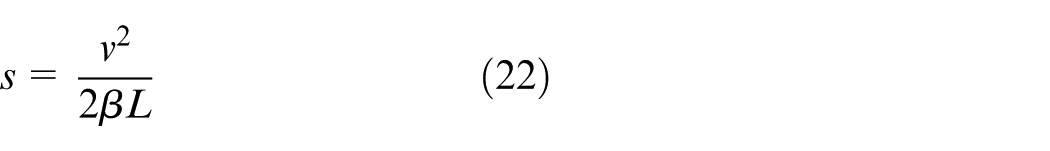
where
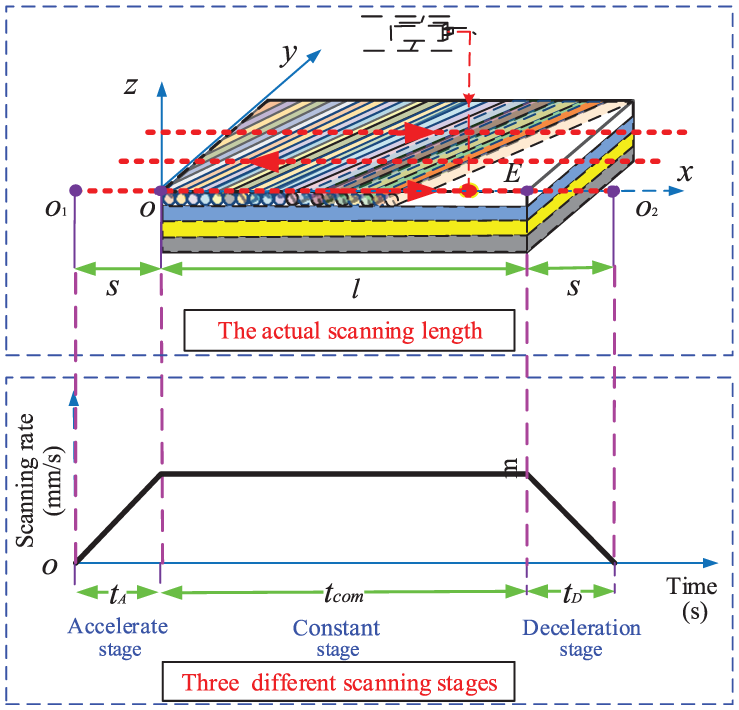
Schematic representation of the three different scanning stages in the laser scanning test.
Before the laser scanning measurement, the appropriate displacement value of
Test procedure of modal shape
In this section, modal shape scanning test procedure is illustrated by taking an example of row scanning path mode, which can be divided into the following four key steps:
Accurately test natural frequencies of fiber-reinforced composite thin plate
In order to accurately obtain natural frequency results of composite plate structure, first we can employ hammer excitation in the experiment to roughly obtain each natural frequency, or each frequency result can be calculated by finite element method theoretically. Then, according to these frequency results, the sweep frequency range of each mode can be determined, and the three-dimensional waterfall of the response signal in the certain laser point can be accurately measured which use the sine sweep excitation technique provided by electromagnetic exciter. Finally, by identifying the response peak in the three-dimensional waterfall of each mode, we can accurately obtain each natural frequency of the composite plate.
2. Excite the composite plate at the resonance state with sufficient excitation energy
In order to accurately measure the mode shapes of the fiber-reinforced composite plate, it is necessary to ensure that the excitation level is large enough to drive the composite plate at the resonance state. So, in this step, the excitation frequency of the electromagnetic exciter is adjusted to a certain natural frequency of the composite plate. Then, we need to check whether or not it is resonant with sufficient excitation energy. According to literature, 27 when a structure system is resonant, its response signals in each measuring point will be either in the same phase or in the opposite phase, so we can use the phase information in the different scanning point to judge if the excitation level is large enough to meet the test requirement. Besides, we can also use some acceleration sensors as well as force sensors to quantify the magnitude of the excitation energy.
3. Finish the laser scanning test in all of the scanning rows
Once the composite plate is resonant at a certain mode, the control method proposed in the “Control method of the constant laser scanning rate” section can be used to choose the appropriate displacement value, which is related with the acceleration stage and deceleration stage. Consequently, we can only record the vibration response signal of the scanning points with the same scanning rate controlled by the software of laser linear scanning system based on LabVIEW, and record the response signal of the reference point at the same time, so that laser linear scanning test in one row can be finished. Finally, move a fixed distance along y direction with the predefined row spacing, and then obtain the both laser scanning response signal in another row and reference response signal. By repeating the above scanning measurement operation, we can finish laser scanning test in all of the scanning rows.
4. Draw each mode shape of the composite plate
Using laser linear scanning method, the time–response data of the composite plate can be obtained in all of the scanning rows as well as reference response signal at one time, but in order to obtain high-qualified shape results from a large number of scanning points, we need to take many techniques to draw each mode shape of the composite plate, such as determining the data quality, windowing, filtering, and normalizing, which will be introduced in the “Drawing method of modal shape” section.
Drawing method of modal shape
In this section, the drawing method of modal shape of the composite plate is clarified in detail, which contains the following three key steps:
Determine the data quality by the spectrum analysis method
It is of great importance to determine the data quality before the shape data are employed to draw each modal shape of the composite plate. In this step, the data quality is judged by the spectrum analysis method. First, FFT operation is conducted to the time–response data in all of the scanning rows. If there are no other frequency components except for certain excitation frequency, or the harmonic frequency components can meet the requirement in Equation (23), the data quality is considered to meet the test requirements
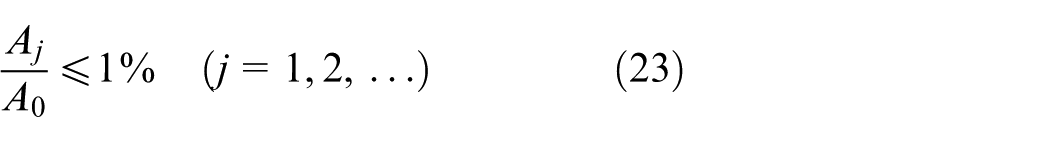
where the subscript j denotes the jth harmonic frequency, and A0 and Aj are response amplitudes of excitation frequency and j-harmonic frequency in the spectrum of the laser scanning response signals.
Consequently, several coherence functions are obtained between the reference signal and the laser scanning response signals in some randomly selected scanning points. If their coherence values at the excitation frequency are more than 0.85, a good test quality of the shape results can be ensured. Otherwise, we need to check the response data of the composite plate in some scanning rows and repeat modal shape scanning test several times.
2. Adopt windowing and filtering techniques
Due to background noise and vibration transmission from the stepping motors and other hardware components in the laser linear scanning system, there are some interferences to the scanning response signals inevitably. Therefore, it is necessary to adopt some signal processing techniques. On one hand, in order to reduce the spectral leakage errors and background noise, the Hanning window is used to smooth the scanning response signals and reference response signal. On the other hand, the low-pass filter technique is employed to improve the quality of the signals. Figure 6(a) shows the raw scan signal in the first row of the frame model under the first resonance state, and Figure 6(b) shows the resulting signals treated with windowing and filtering techniques. It is observed that there is an obvious improvement in the smoothness of the signal.
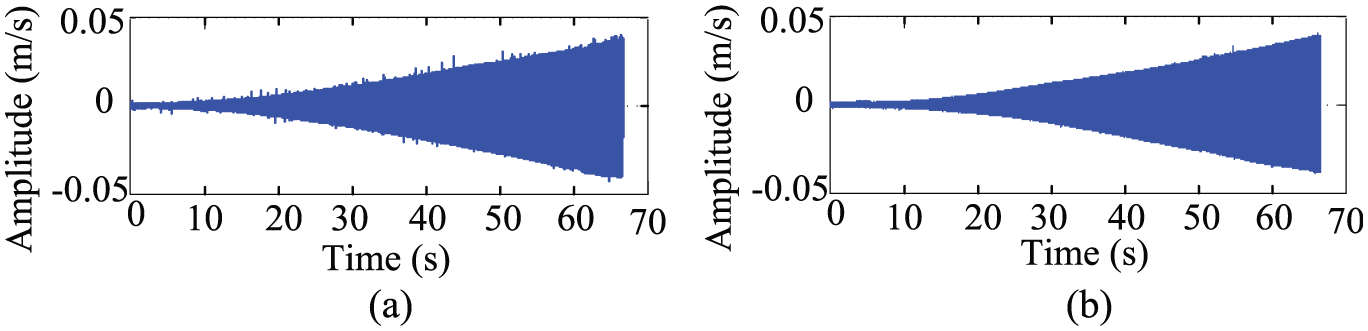
The raw scanning signal in the first row of the frame model under the first resonance state and the resulting signal treated with windowing and filtering techniques: (a) treated without windowing and filtering techniques, and (b) treated with windowing and filtering techniques.
3. Draw each modal shape by normalizing processing technique
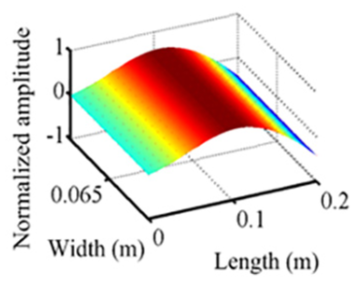
First, based on the established laser scanning frame model in the “Establishment of laser linear scanning frame model and the test principle” section, modal shape of the fiber-reinforced composite plate can be drawn. Then, the transmissibility functions can be obtained between the different scanning points and the same reference point by using the data extraction technique, and the amplitude and phase information can also be obtained by using Equation (9). Next, the amplitude in each scanning point is normalized and transformed into a dimensionless form, which reflects the relative vibration degrees of the scanning point rather than the absolute vibration information, so that the different shape results can be compared conveniently. Finally, load the normalized amplitude and phase results into the corresponding scanning points, and we can draw a certain modal shape of composite thin plate; Figure 7 gives the third modal shape result after the data extraction and data loading operation. By repeating the above steps, each modal shape of composite plate can be plotted.
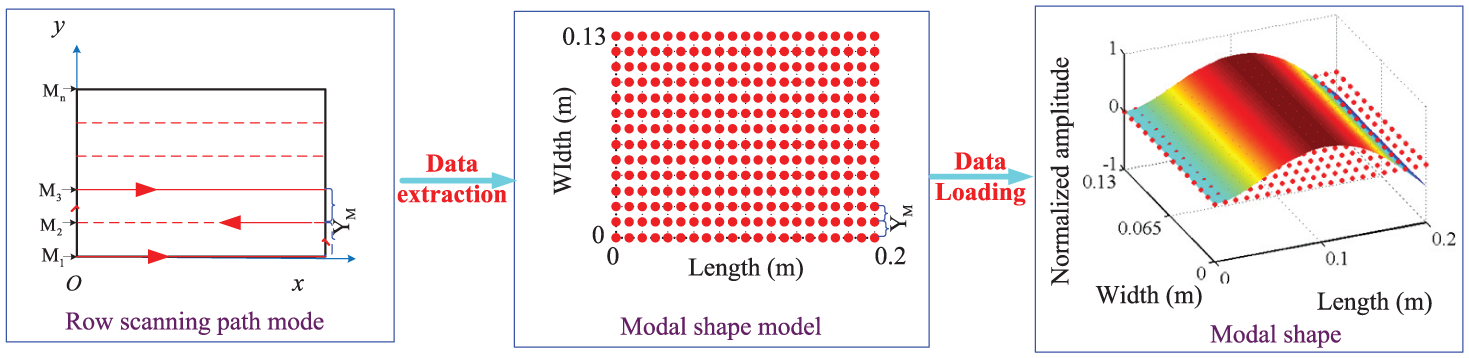
The third modal shape after the data extraction and data loading operation.
A case study
A TC300 carbon/resin composite plate with laminate configuration of [(0/90)s/0/(90/0)s] is taken as a research object, as shown in Figure 8. It is symmetrically laid with total 21 layers, and each layer has the same thickness and fiber volume fraction with longitudinal elastic modulus of 136 GPa, transverse elastic modulus of 7.92 GPa, shear modulus of 3.39 GPa, Poisson’s ratio of 0.32, and density of 1780 kg/m3. In the test, the clamp fixture and M12 bolts, as also seen in Figure 8, are used to clamp the one side of the composite plate so as to simulate the cantilever constraint boundary condition. Otherwise, its corresponding length, width, and thickness under such cantilever condition are about 200, 130 and 2.36 mm, respectively.
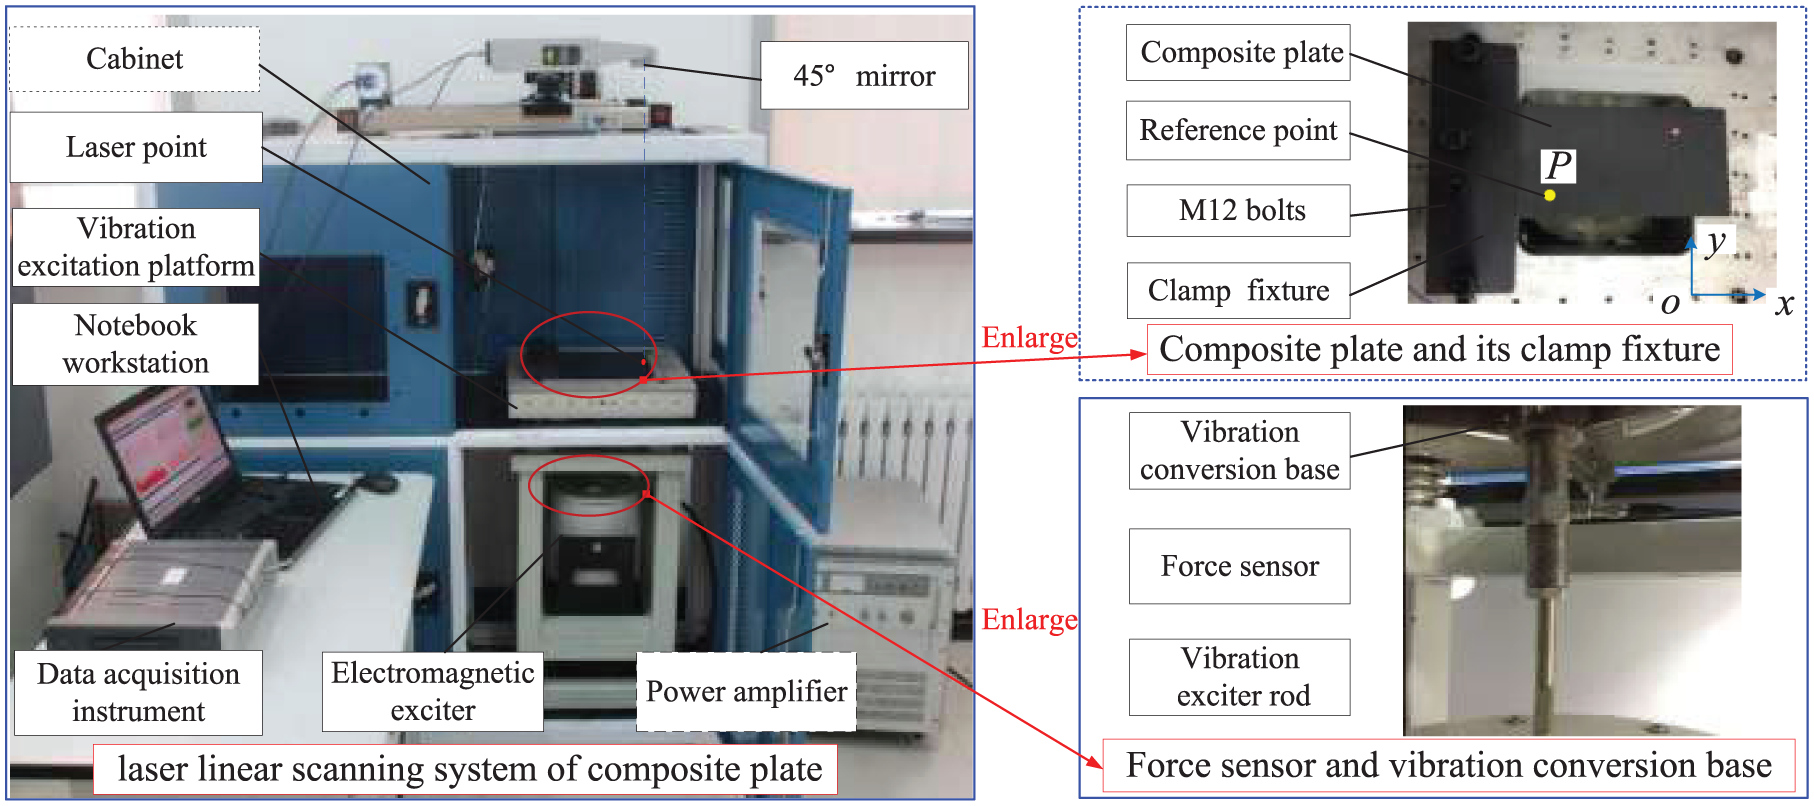
The laser linear scanning system of fiber-reinforced composite plate.
Figure 8 gives the established laser linear scanning system of fiber-reinforced composite plate, which mainly includes notebook workstation, electromagnetic vibration exciter, data acquisition instrument, the laser linear scanning system, vibration conversion base, vibration excitation platform, cabinet, and so on, whose names and models are shown in Table 1. In the test setup, Polytec PDV-100 laser vibrometer can quickly get vibration response signal of any measuring point of the composite plate through the X–Y sliding table, 45 degree mirror is used to adjust the laser beam from the horizontal direction to the vertical direction, LMS SCADAS 16-channel data acquisition front-end is responsible for recording vibration response signals and sending out the excitation signals, and Dell M4800 notebook computer (with Intel Core i7 2.93 GHz processor and 8 GB RAM) is used to operate LMS Test.Lab 12A software and store measured data.
Test instruments and their models.

First, we employ the YE5878 power amplifier to amplify the excitation signal, and control the JZK-100 electromagnetic exciter to generate strong vibrational excitation energy in the end of the rod, which can be transferred to the vibration excitation platform through the self-designed vibration conversion base (see Figure 8). Then, the base vibration excitation energy can further excite the tested composite plate through the clamp fixture, which can not only guarantee the uniform distribution of excitation energy but also cannot bring the extra mass of the excitation sensors to the plate. In addition, the PCB 208C03 force sensor is placed at the end of the rod of the electromagnetic exciter, as shown in Figure 8, so that the excitation force signal can be fed back to the data acquisition instrument. In this way, the excitation level and frequency of the base excitation can be controlled effectively, and too large excitation amplitude is also avoided which will probably cause the large geometric deformation to the tested composite plate (to avoid geometric nonlinear phenomena).
In order to ensure the tested composite plate is effectively clamped, four holes were set in the clamp fixture. Moreover, the first three natural frequencies of the plate are repeatedly measured under different tightening torque. The best repeatability of frequency values can be reached through comparing with each other. So, this torque value is always used in the measurement when the tightening torque is 50 Nm. After the repeated testing and comparison, B&K 4517 lightweight accelerometer is glued firmly at reference point P (which is on the back of the plate) by super glue 502, and the point P is 30 mm from the restrained in the left and 30 mm from the downside edge of the composite plate. Besides, the following setups and parameters are chosen: (1) modal shape measurement is done in row scanning path mode with the adjacent row spacing
When the modal shape scanning test is done, first, we use hammer excitation to roughly measure natural frequency of the composite plate. Consequently, the sweep frequency range of each mode is determined and natural frequency results are gotten under the base excitation with high precision by sine sweep measurement. Then, the excitation frequency of the electromagnetic exciter is adjusted to a certain natural frequency of the cantilever composite plate, and drive it at the resonance state with sufficient excitation energy. Next, the response signal of the reference point and the response signal in each row of laser scanning path (along x direction) are measured and recorded with the constant scanning rate, and the first seven natural frequency and modal shape results are obtained, as listed in Table 2. Moreover, the corresponding shape results obtained by finite element method and traditional experimental modal method are also given in Table 2. It can be seen that the morphological character of each modal shape is very similar by different methods, so the effectiveness and reliability of such a laser scanning method have been verified.
The first seven natural frequencies and modal shapes of composite plate obtained by finite element method, experimental modal method, and laser linear scanning method.
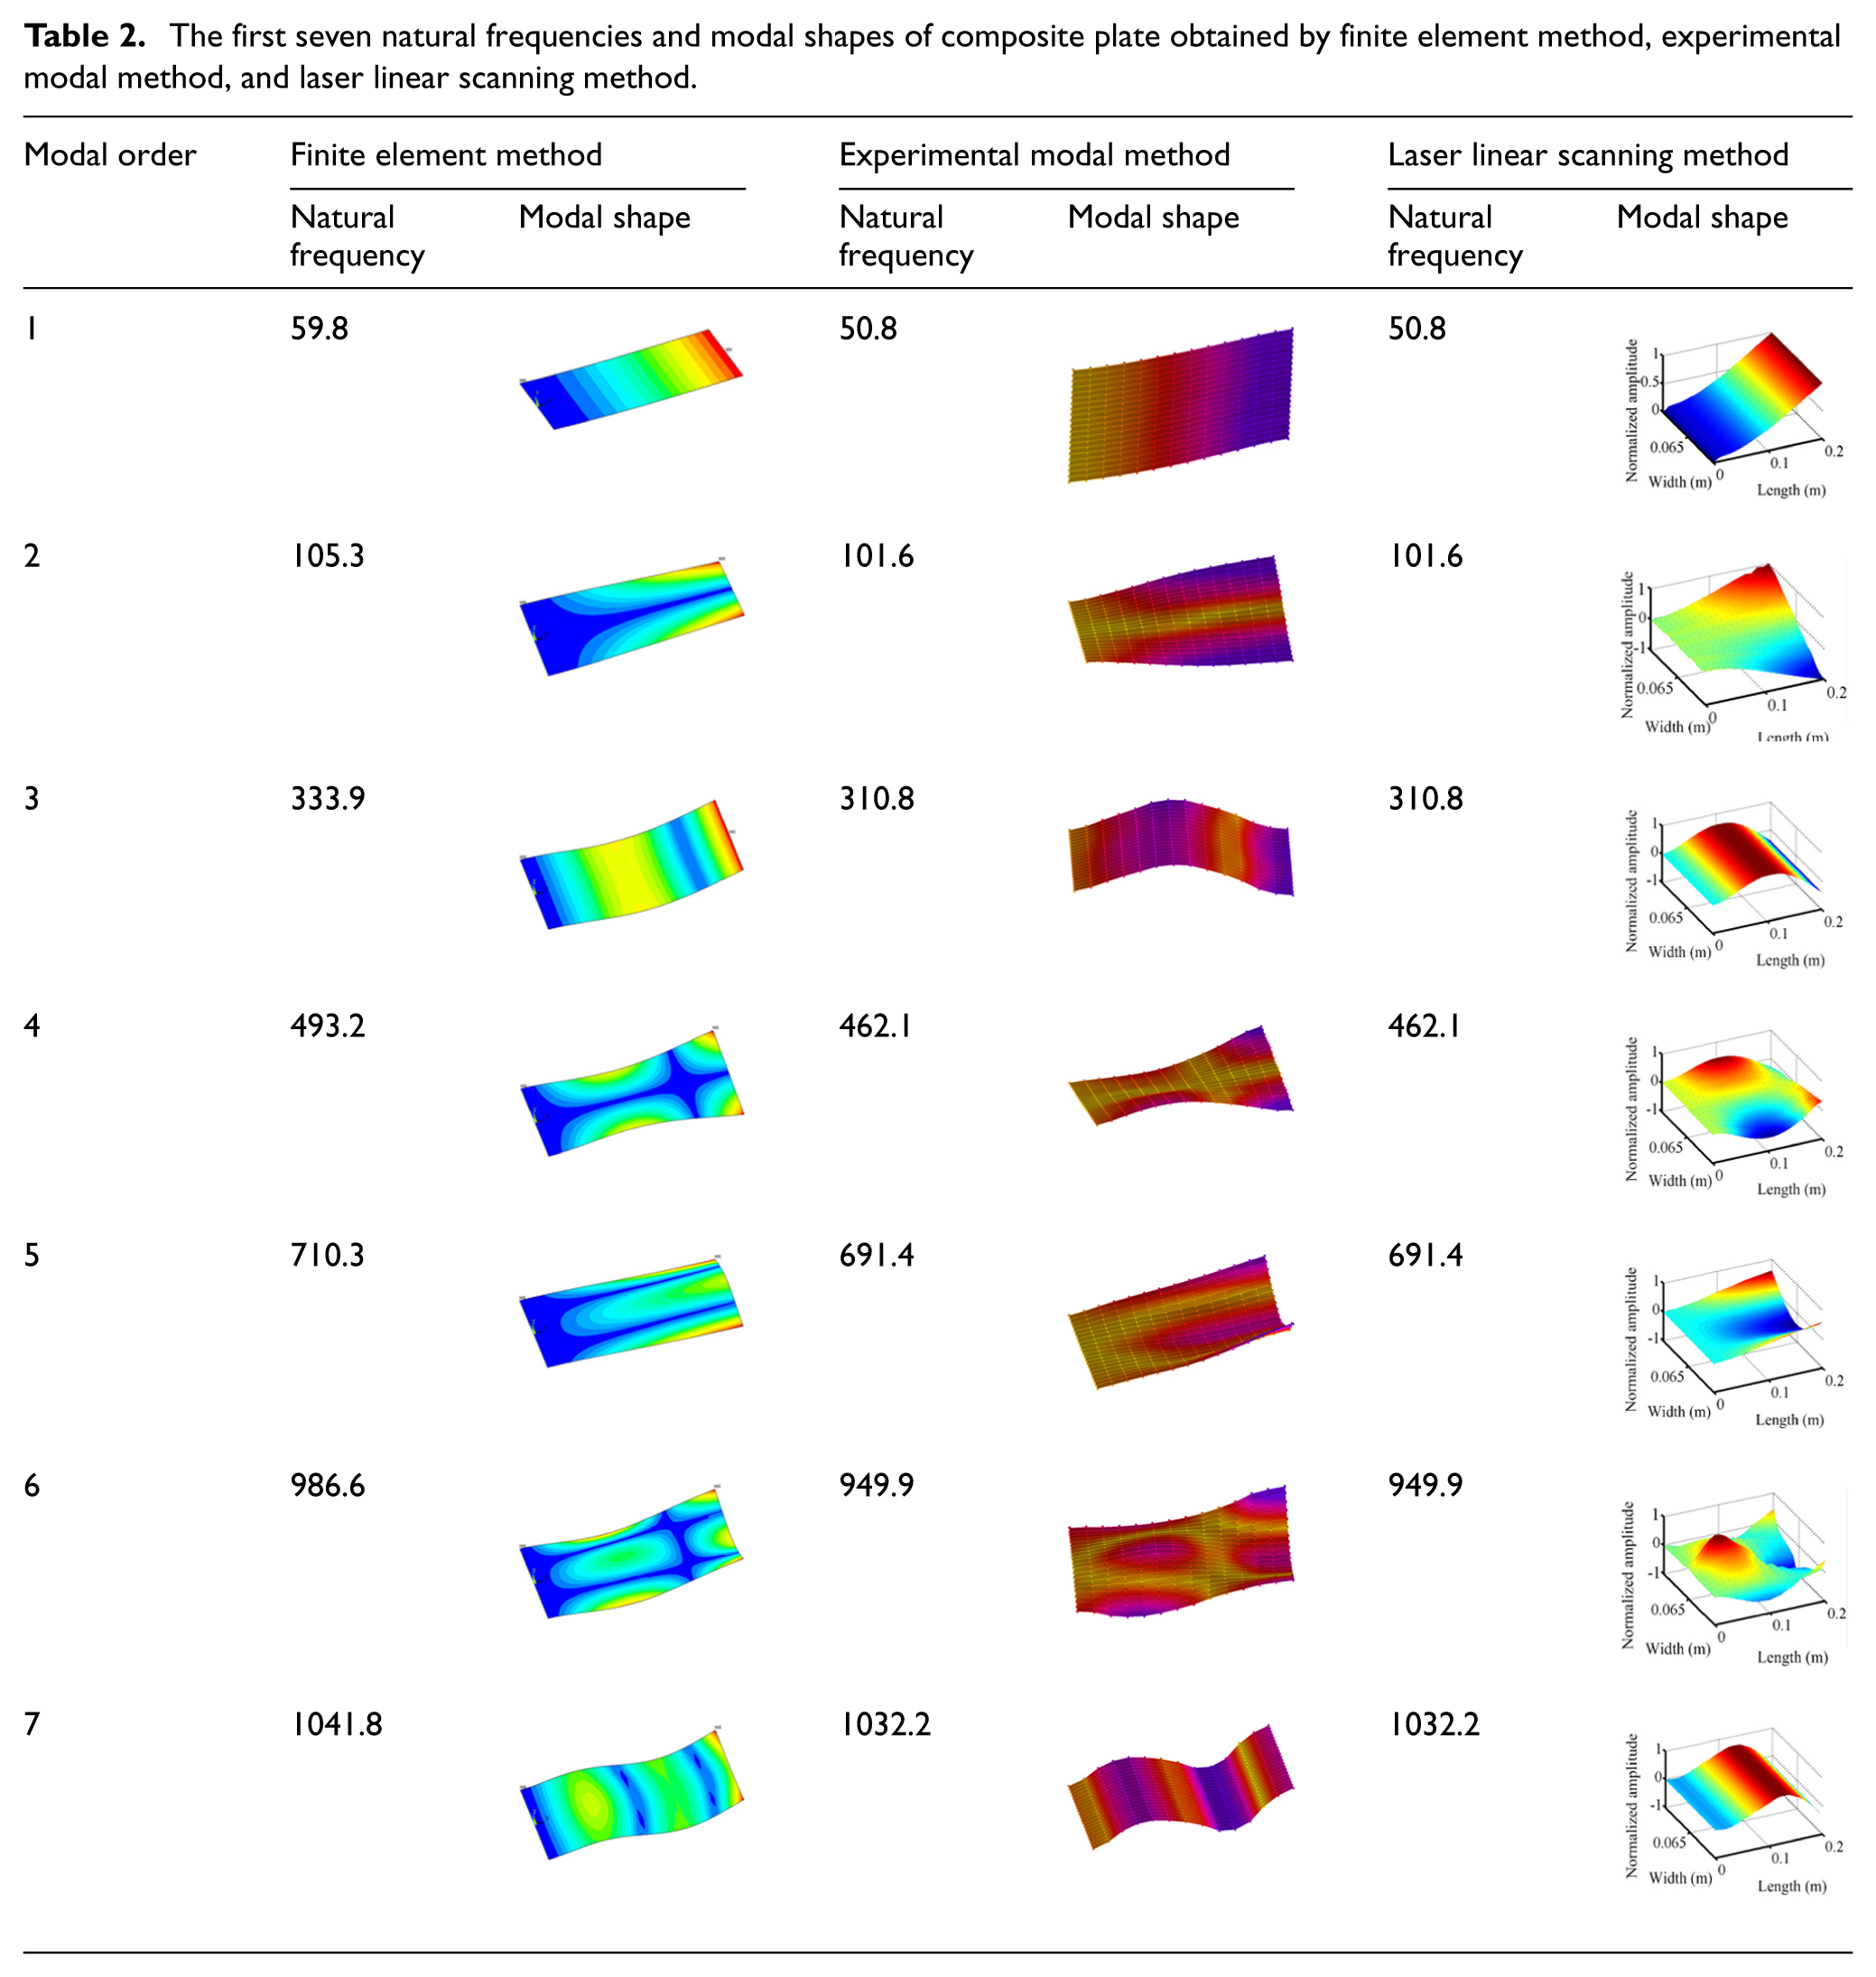
When the laser linear scanning method is employed to get modal shape of fiber-reinforced composite plate, it should be noted that a total data amount of 2,984,716 are obtained and 294 scanning points in the frame model are extracted to draw each shape result when the sampling frequency is set as 3200 Hz, and the time required for completing the first seven modal shapes is about 110 min. By comparison, it is a time-consuming test process to obtain the first seven modal shapes of the above plate containing a grid of 294 points by the traditional experimental modal method, because it will take about 3∼4 h to complete the modal shape test. Therefore, taking into account the time cost expenditure, the proposed laser linear scanning method has higher efficiency than the traditional method, and it will have a greater advantage if the test accuracy is also considered (we will discuss the problem in this section). However, by comparing with the continuous scanning technology used in the literature, 28 it can be found that the test efficiency based on the SPLV is relatively lower than that of the CSLV. One reason might be that some time is wasted in the switching scanning line of composite plate into the row scanning path mode. Another reason might be that some extra time cost is needed in the acceleration stage and deceleration stage to finish modal shape scanning test in order to ensure a constant laser scanning rate.
In order to verify the measurement accuracy of the proposed method, modal assurance criterion (MAC),
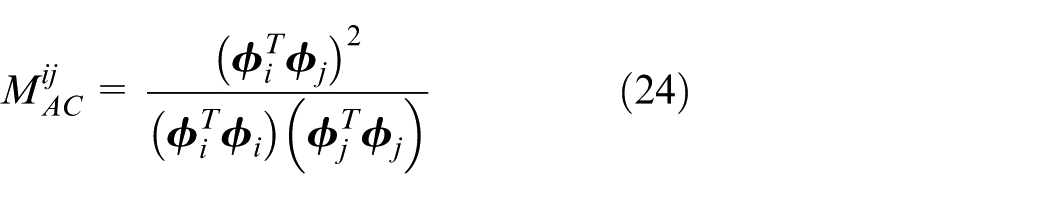
where
Each finite element result is taken (in Table 2) as a benchmark; the corresponding MAC results of the first seven modal shapes of composite plate, which are obtained by the traditional experimental mode method and laser linear scanning method, are calculated based on Equation (24), as listed in Table 3. Through the comparison, it can be found that the MAC values between the experimental modal method and finite element method are in the range of 0.8915 to 0.9216, while the MAC values between the laser linear scanning method and finite element method are in the range of 0.9005 to 0.9432. Therefore, it can be concluded that the laser linear scanning method has higher testing accuracy for modal shapes of composite thin plates.
The MAC of the first seven modal shapes of composite plate obtained by the traditional experimental mode method and laser linear scanning method when they are compared with finite element results.
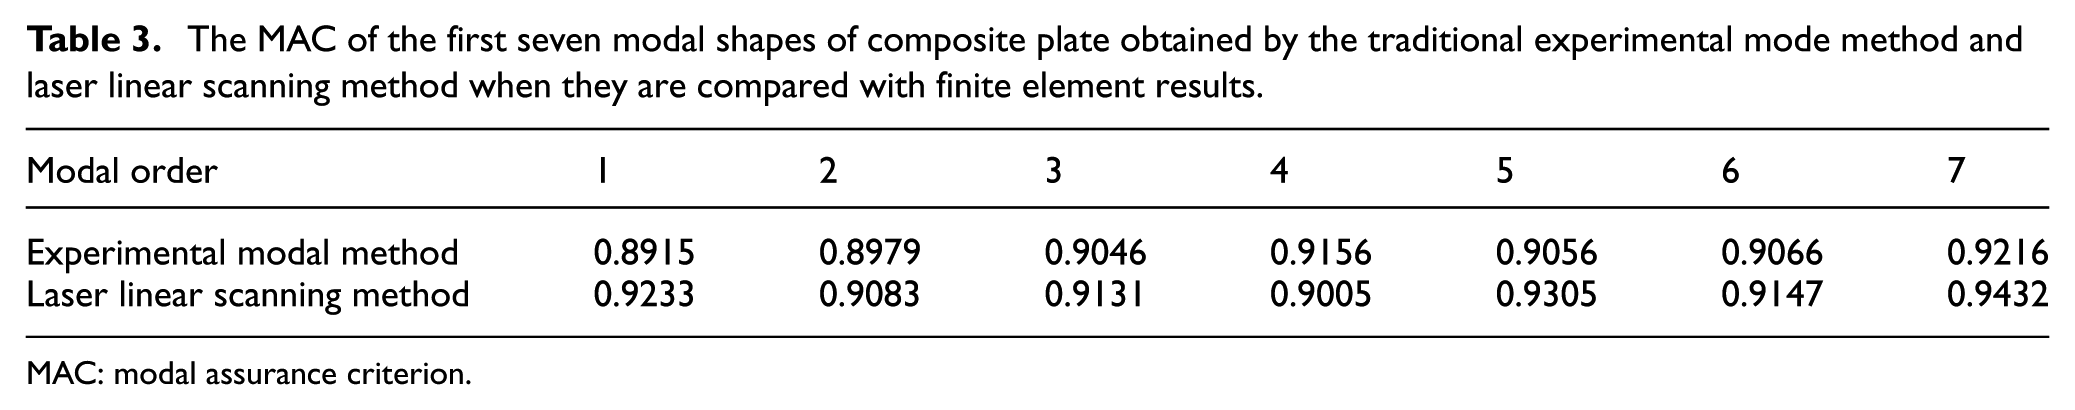
MAC: modal assurance criterion.
Influence analysis on test accuracy of modal shape
Good practice in our modal shape test series dictates that laser scanning rate, scanning spacing, and scanning path mode may have influences on the precise measurement of modal shape of fiber-reinforced composite plate. Besides, the constraint boundary condition, the different fiber angles, and material damage, including the matrix cracking, delamination, and fiber breakage, can also affect test accuracy of modal shape results. Therefore, in this section, we discuss these influence factors in detail.
Influence analysis of the different constraint boundary conditions
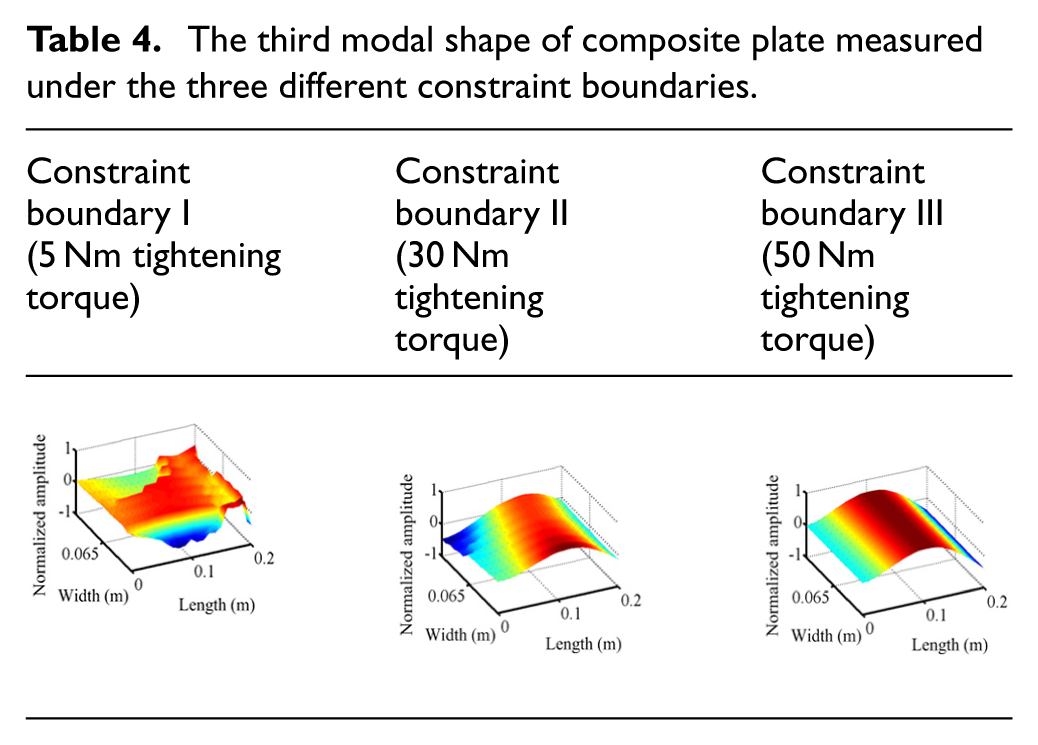
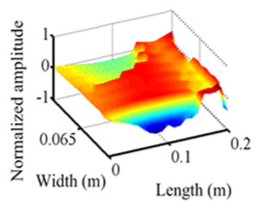
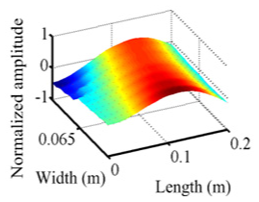
Because the cantilever boundary condition is very common in the application of composite plate, we first discuss the influences of different cantilever boundaries on the test accuracy of modal shape results. In the actual experiment, three different tightening torques, i.e. 5, 30, and 50Nm are used to tighten the four M12 bolt, so that three different constraint boundaries can be simulated. Then, according to the test procedure proposed in the “Test procedure of modal shape” section, modal shape scanning test can be finished in the row scanning path mode. Otherwise, the laser scanning rate is set as 3 mm/s with the adjacent row spacing of 10 mm.
The third modal shape result is obtained under the above three different constraint boundaries, as listed in Table 4. It can be observed that the constraint boundary condition has a great influence on the modal results. When the boundary condition is elastic, that is, the tightening torque value which is related with constraint boundary is not enough, the modal shape is obviously distorted and dislocated. Only when the composite plate is clamped by enough tightening torque (which ensures it is under good constraint state), its morphological characteristics become normal and its nodal lines are also clear and easy to identify.
The third modal shape of composite plate measured under the three different constraint boundaries.

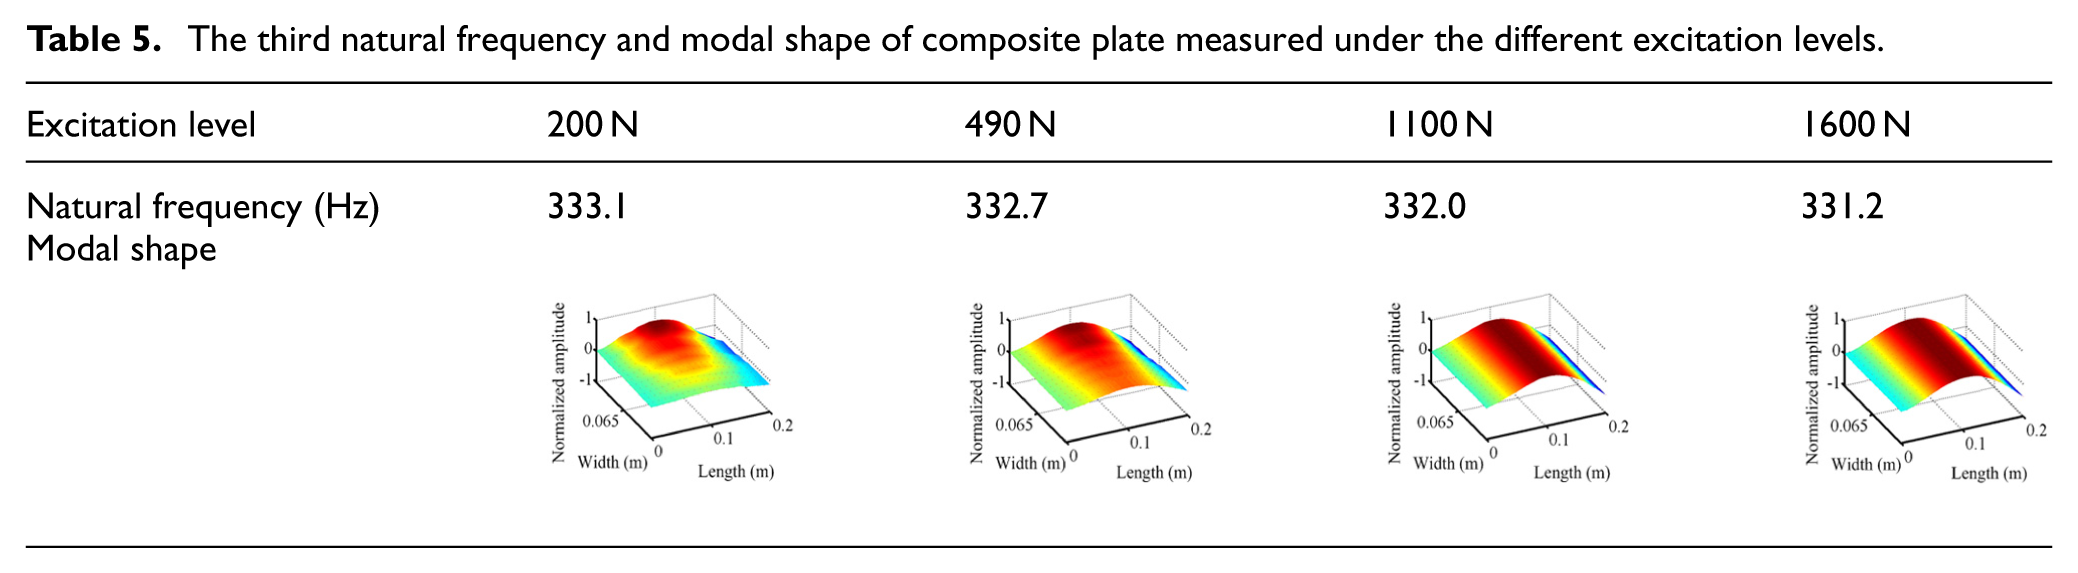
Influence analysis of the different excitation levels
First, four different excitation levels are set, namely, 200, 490, 1100, and 1600 N, and each of them is used to excite the tested composite plate at the resonance state. Then, the same scanning parameters are employed which are used in the “Influence analysis of the different constraint boundary conditions” section to complete modal shape scanning test. The third natural frequency and modal shape results are listed in Table 5 under the above four different excitation levels. It can be observed that excitation levels have some slight influences on natural frequency but will not change modal shape results. For example, with the increase of excitation level, the third natural frequency of fiber-reinforced composite plate slightly decreases, which shows soft nonlinear stiffness characteristic. When the excitation level is small, that is, it is equal to 200 or 490 N, it will lead to unsatisfactory shape results (e.g. the fuzzy nodal lines). With the increase of excitation level, the shape result becomes gradually smooth and the nodal lines can be clearly identified. But when the excitation energy is increased to 1600 N, the clarity of nodal lines appears to be no change compared with the ones under the excitation level of 1100 N. So, in order to improve the test accuracy of modal shape results, we need to use sufficient excitation level to excite the tested composite plate at the resonance state. However, too large excitation energy needs to be avoided, because it may cause other negative effects, including the geometric nonlinearity, too large local vibration, and so on.
The third natural frequency and modal shape of composite plate measured under the different excitation levels.
Influence analysis of the different scanning parameters
Scanning path mode
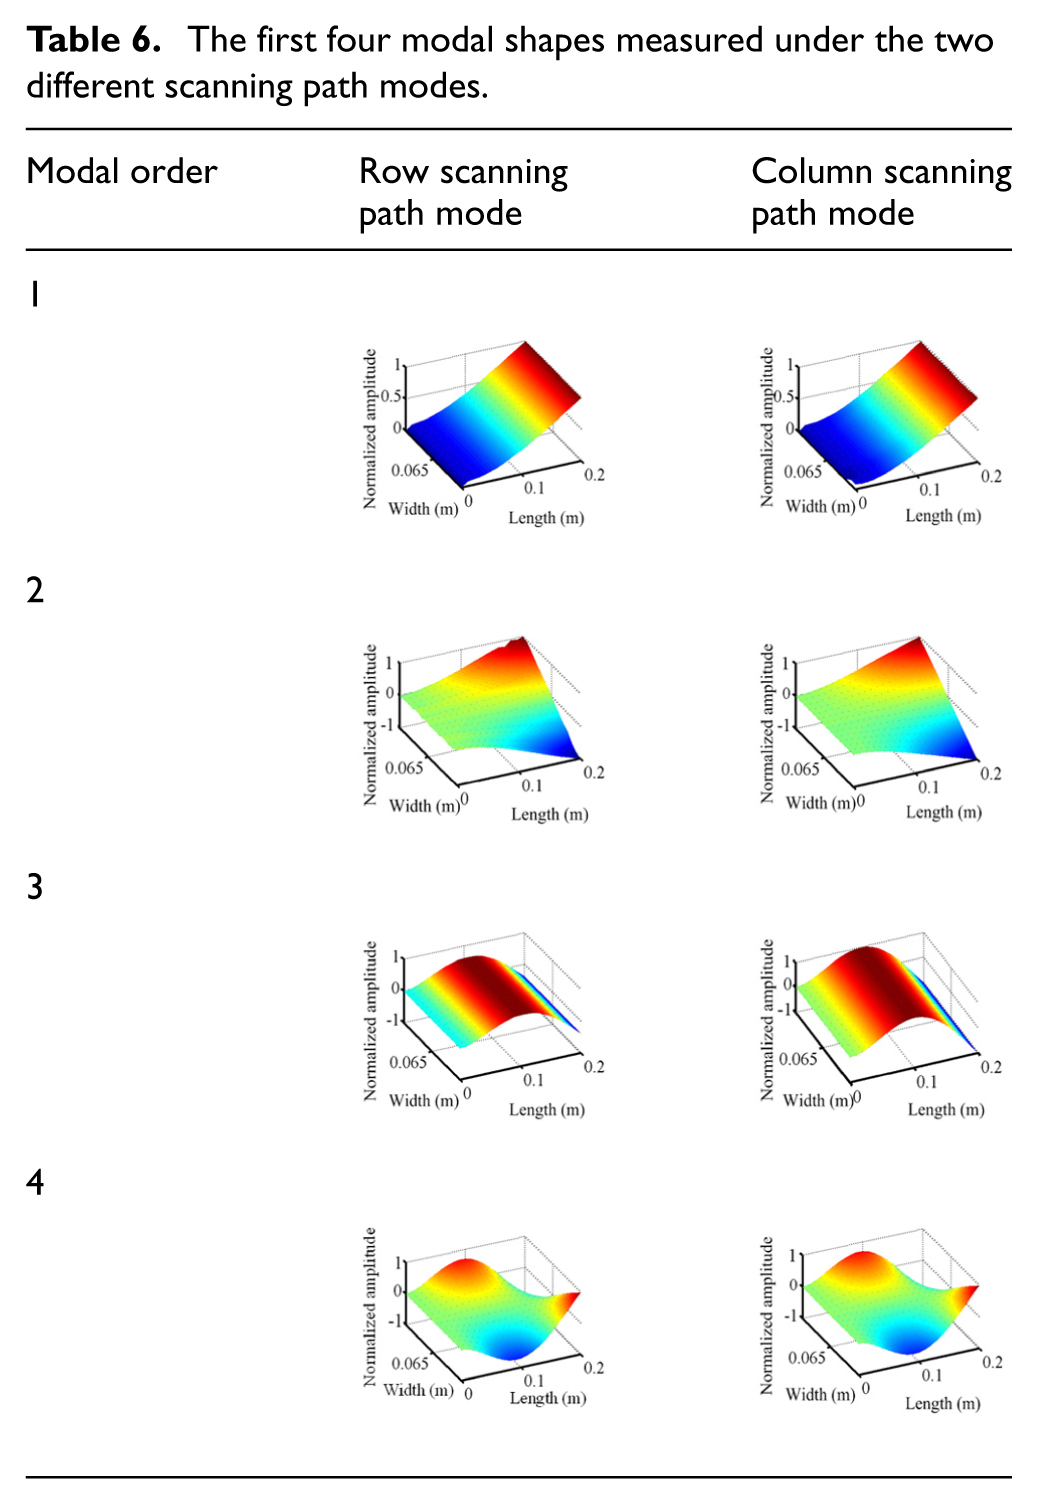
First, with the adjacent row or column spacing of 10 mm, the laser scanning rate and excitation levels are set as 3 mm/s and 800 ∼ 1100 N, respectively. Then, the laser linear scanning system is employed to complete modal shape scanning test under row scanning path mode and column scanning path mode, respectively. The first four modal shapes measured under such two different scanning path modes are listed in Table 6. There are no significant differences in the shape data when the positions of nodal lines and morphological details are compared. So, it can be concluded that the scanning mode has no effects on the modal shape results.
The first four modal shapes measured under the two different scanning path modes.
2. Laser scanning rate
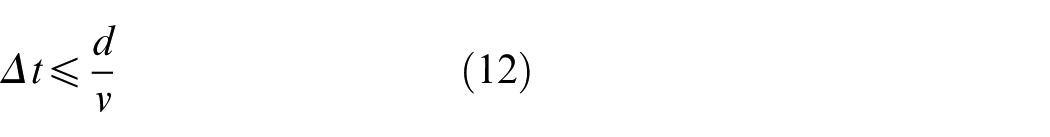
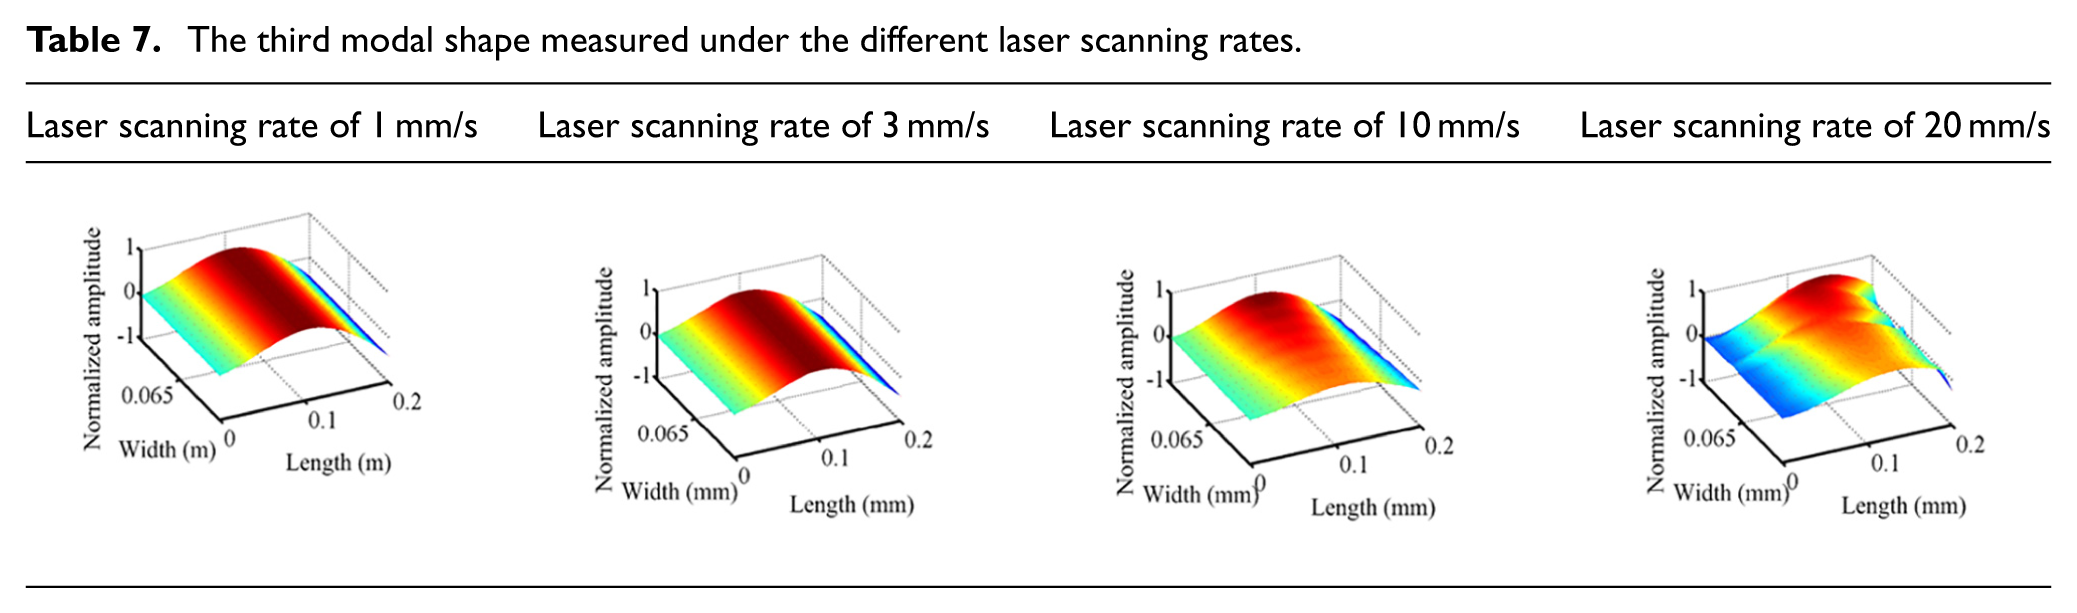
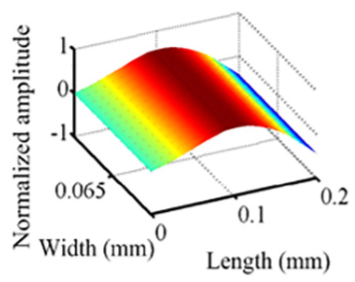
In order to study the influence of laser scanning rate on test accuracy of modal shape results, four different scanning rate values are chosen, namely, 1, 3, 10, and 20 mm/s. Moreover, the excitation levels are set as 1100 N and the adjacent row spacing is set as 10 mm to finish modal shape scanning test. The third modal shape is given in Table 7 measured under the above different scanning rates. It can be found out that when the scanning rate is 1 mm/s, the measurement points in each row of modal shape model are very dense and the nodal lines are quite clear, but with the increase of scanning rate, the number of measuring points comes down and the clarity of shape morphology becomes gradually fuzzy, especially when the scanning rate reaches to 20 mm/s, serious distortion can be found in the third modal shape of composite plate. This negative phenomenon can be explained by the selection criterion of laser scanning rate proposed in the “Selection criterion of laser scanning rate” section. Here, in the actual test, because the diameter of laser point is about 3mm and the length of composite plate is 200 mm, in order to satisfy Equation (12), the time width Δt in each row of laser scanning frame model should be set as 1 s. Then, bring the used scanning rate values of 1, 3, 10, and 20 into Equation (20); the selection criterion
The third modal shape measured under the different laser scanning rates.
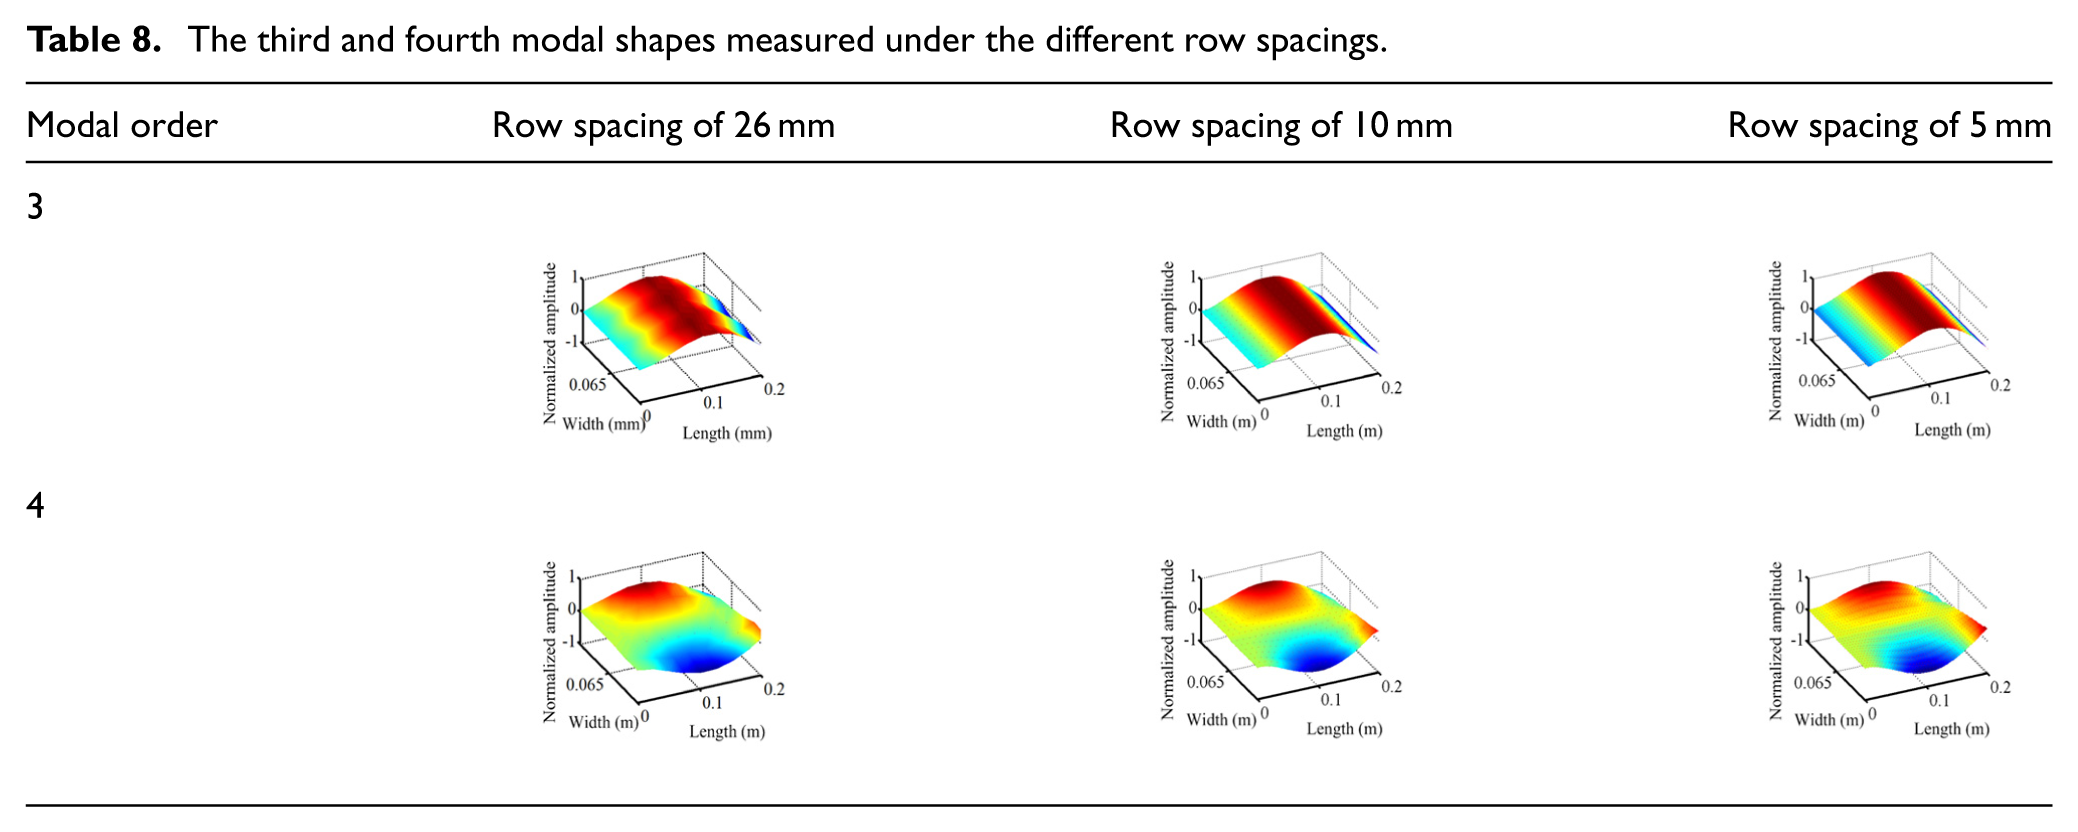
3. Scanning spacing
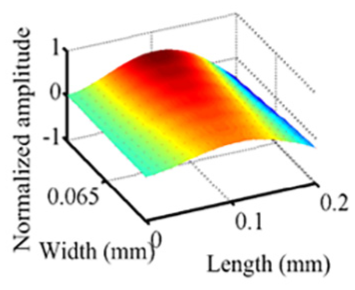
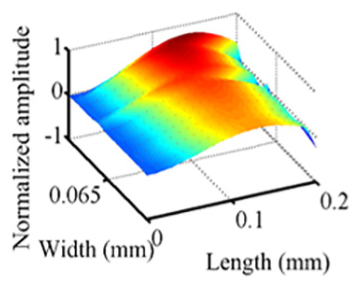
In order to study the influence of scanning spacing on test accuracy of modal shape results, three different scanning spacing values are chosen, namely, 5, 10, and 26 mm; then the excitation levels are set as 800 ∼ 1100 N; and laser scanning rate is set as 3 mm/s to finish modal shape scanning test. Table 8 gives the third and fourth modal shapes measured under the different row spacings. It can be found that the measuring points are sparse and the nodal lines are not so clear when the adjacent row spacing is set as 26 mm. So, in order to ensure high-quality modal shape results, the scanning spacing (the row spacing or the column spacing) should not be too large. Besides, by comparing the shape results when the adjacent row spacing is set as 5 and 10 mm, we cannot distinguish the obvious difference between them. So, a suitable scanning spacing parameter may need to be chosen and tried for several times, and it should meet both the requirement of test precision and test efficiency as much as possible. In this case, the adjacent row spacing of 10 mm is the optimal scanning parameter, and it should be less than or equal to one-tenth of the length of composite plate according to processing experience of shape data.
The third and fourth modal shapes measured under the different row spacings.
Influence analysis of the different fiber angles
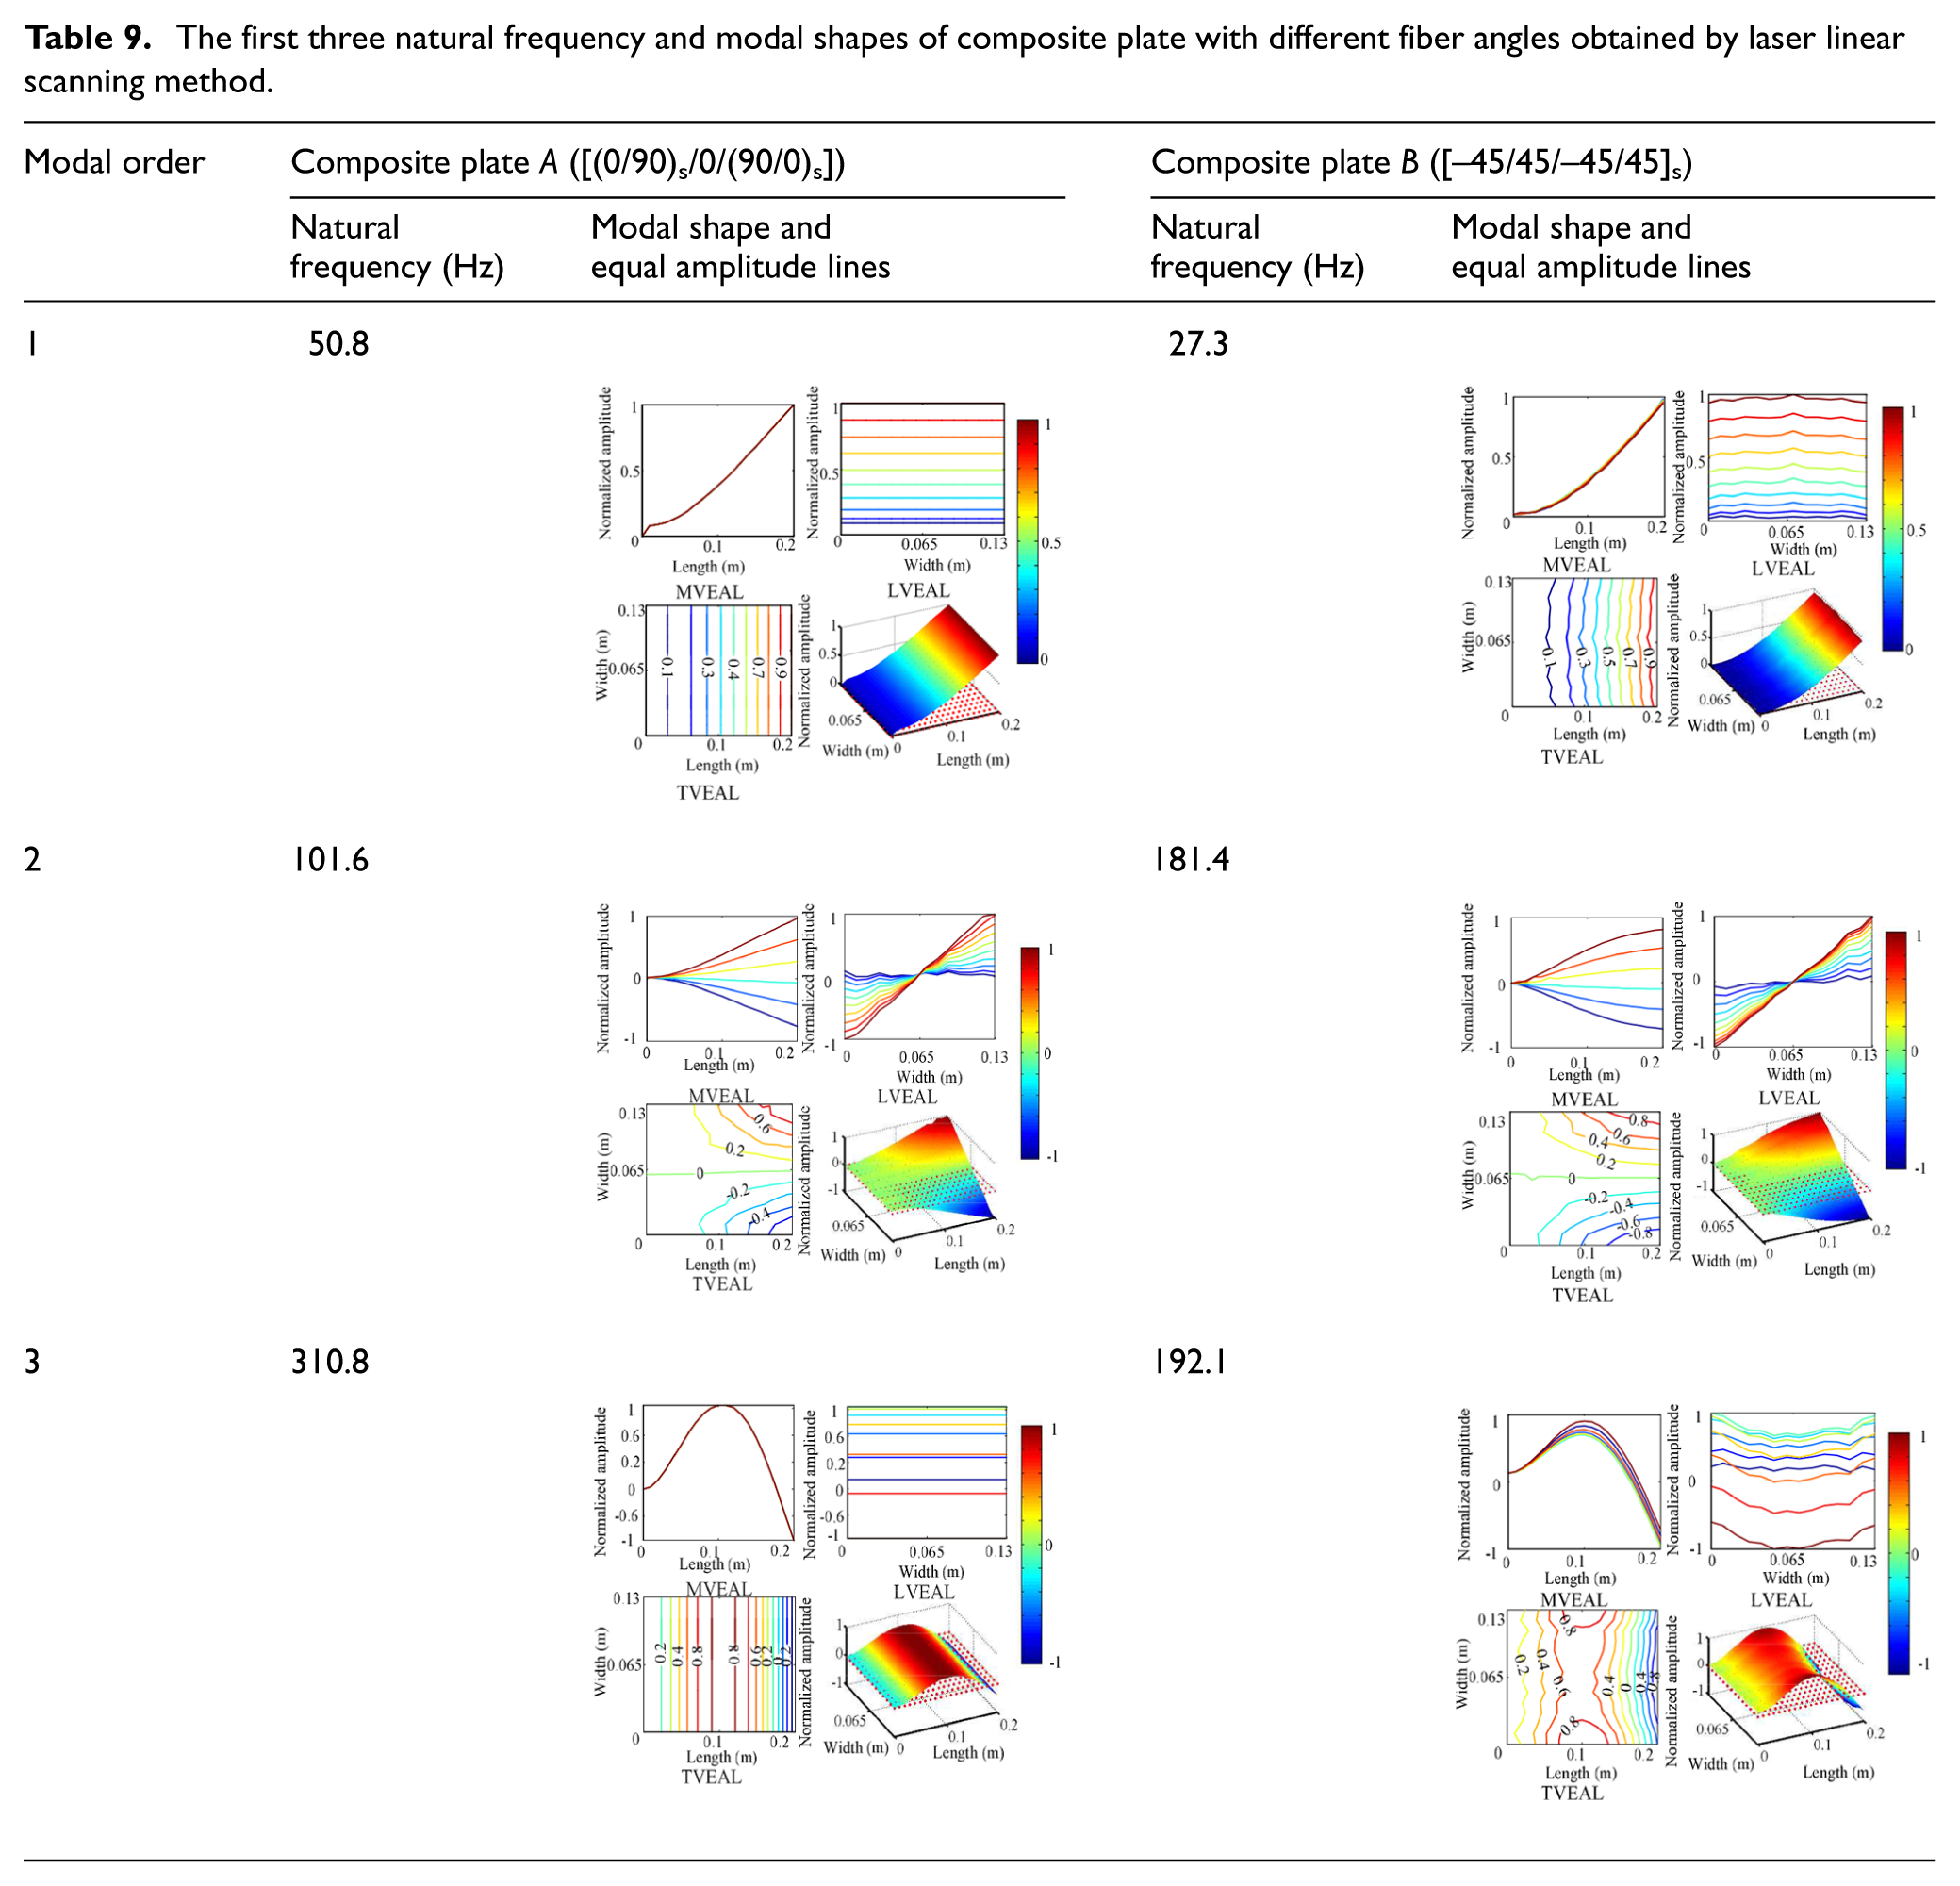
Here, two composite plates are used with different fiber angles as the test objects, one is named composite plate A, whose dimensional and material parameters have been given in “A case study” section, the other one is named composite plate B which has the same length, width, and thickness with the plate A, yet its laminate configuration is [–45/45/–45/45]s with total 20 layers.
Still, the laser scanning rate is employed as 3 mm/s; excitation levels are set as 800 ∼ 1100 N with the adjacent row spacing of 10 mm to complete modal shape scanning test under row scanning path mode. The first three natural frequencies and modal shapes of composite plates with different fiber angles are given in Table 9, and the main view of equal amplitude line (MVEAL), top view of equal amplitude line (TVEAL), and left view of equal amplitude line (LVEAL) are also plotted in Table 9, where the nodal lines are at the positions when the amplitude of the equal amplitude lines is equal to zero. It can be observed that when the fiber angle is different, the pattern and location of equal amplitude line are also different. So, we can use the modal shape data in the different projection views to study the influence of fiber angles on composite plate.
The first three natural frequency and modal shapes of composite plate with different fiber angles obtained by laser linear scanning method.
Influence analysis of fiber breakage damage
There are many types of fatigue and damage in fiber-reinforced composite plate, including matrix cracking, delamination damage, fiber breakage, and so on. Here, fiber breakage damage in the composite plate B is taken as an example to study its influence on modal shape results. The picture of the composite plate B with and without fiber breakage damage is given in Figure 9, and the “broken line” is about 80 mm with 50 mm from the free edge.
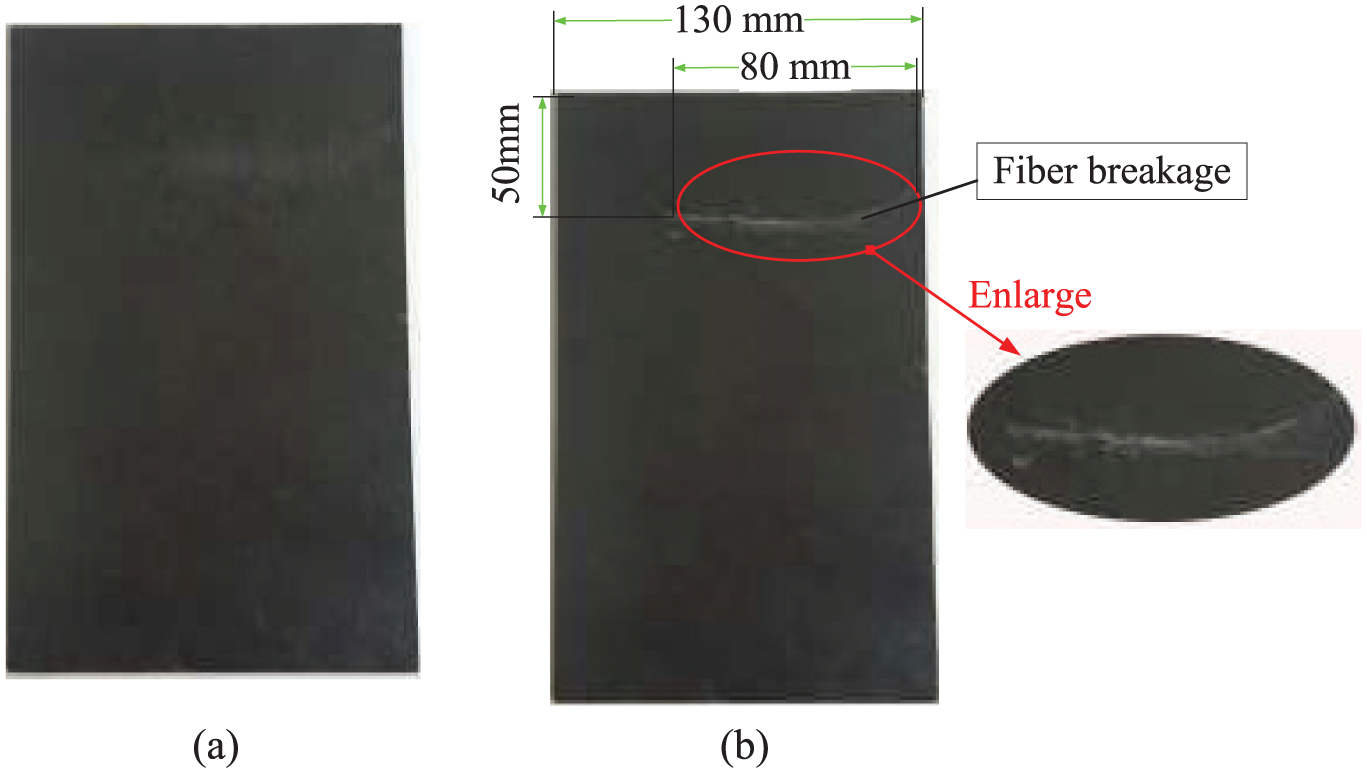
The picture of the composite plate B with and without fiber breakage damage: (a) composite thin plate B without damage and (b) composite thin plate B with fiber breakage.
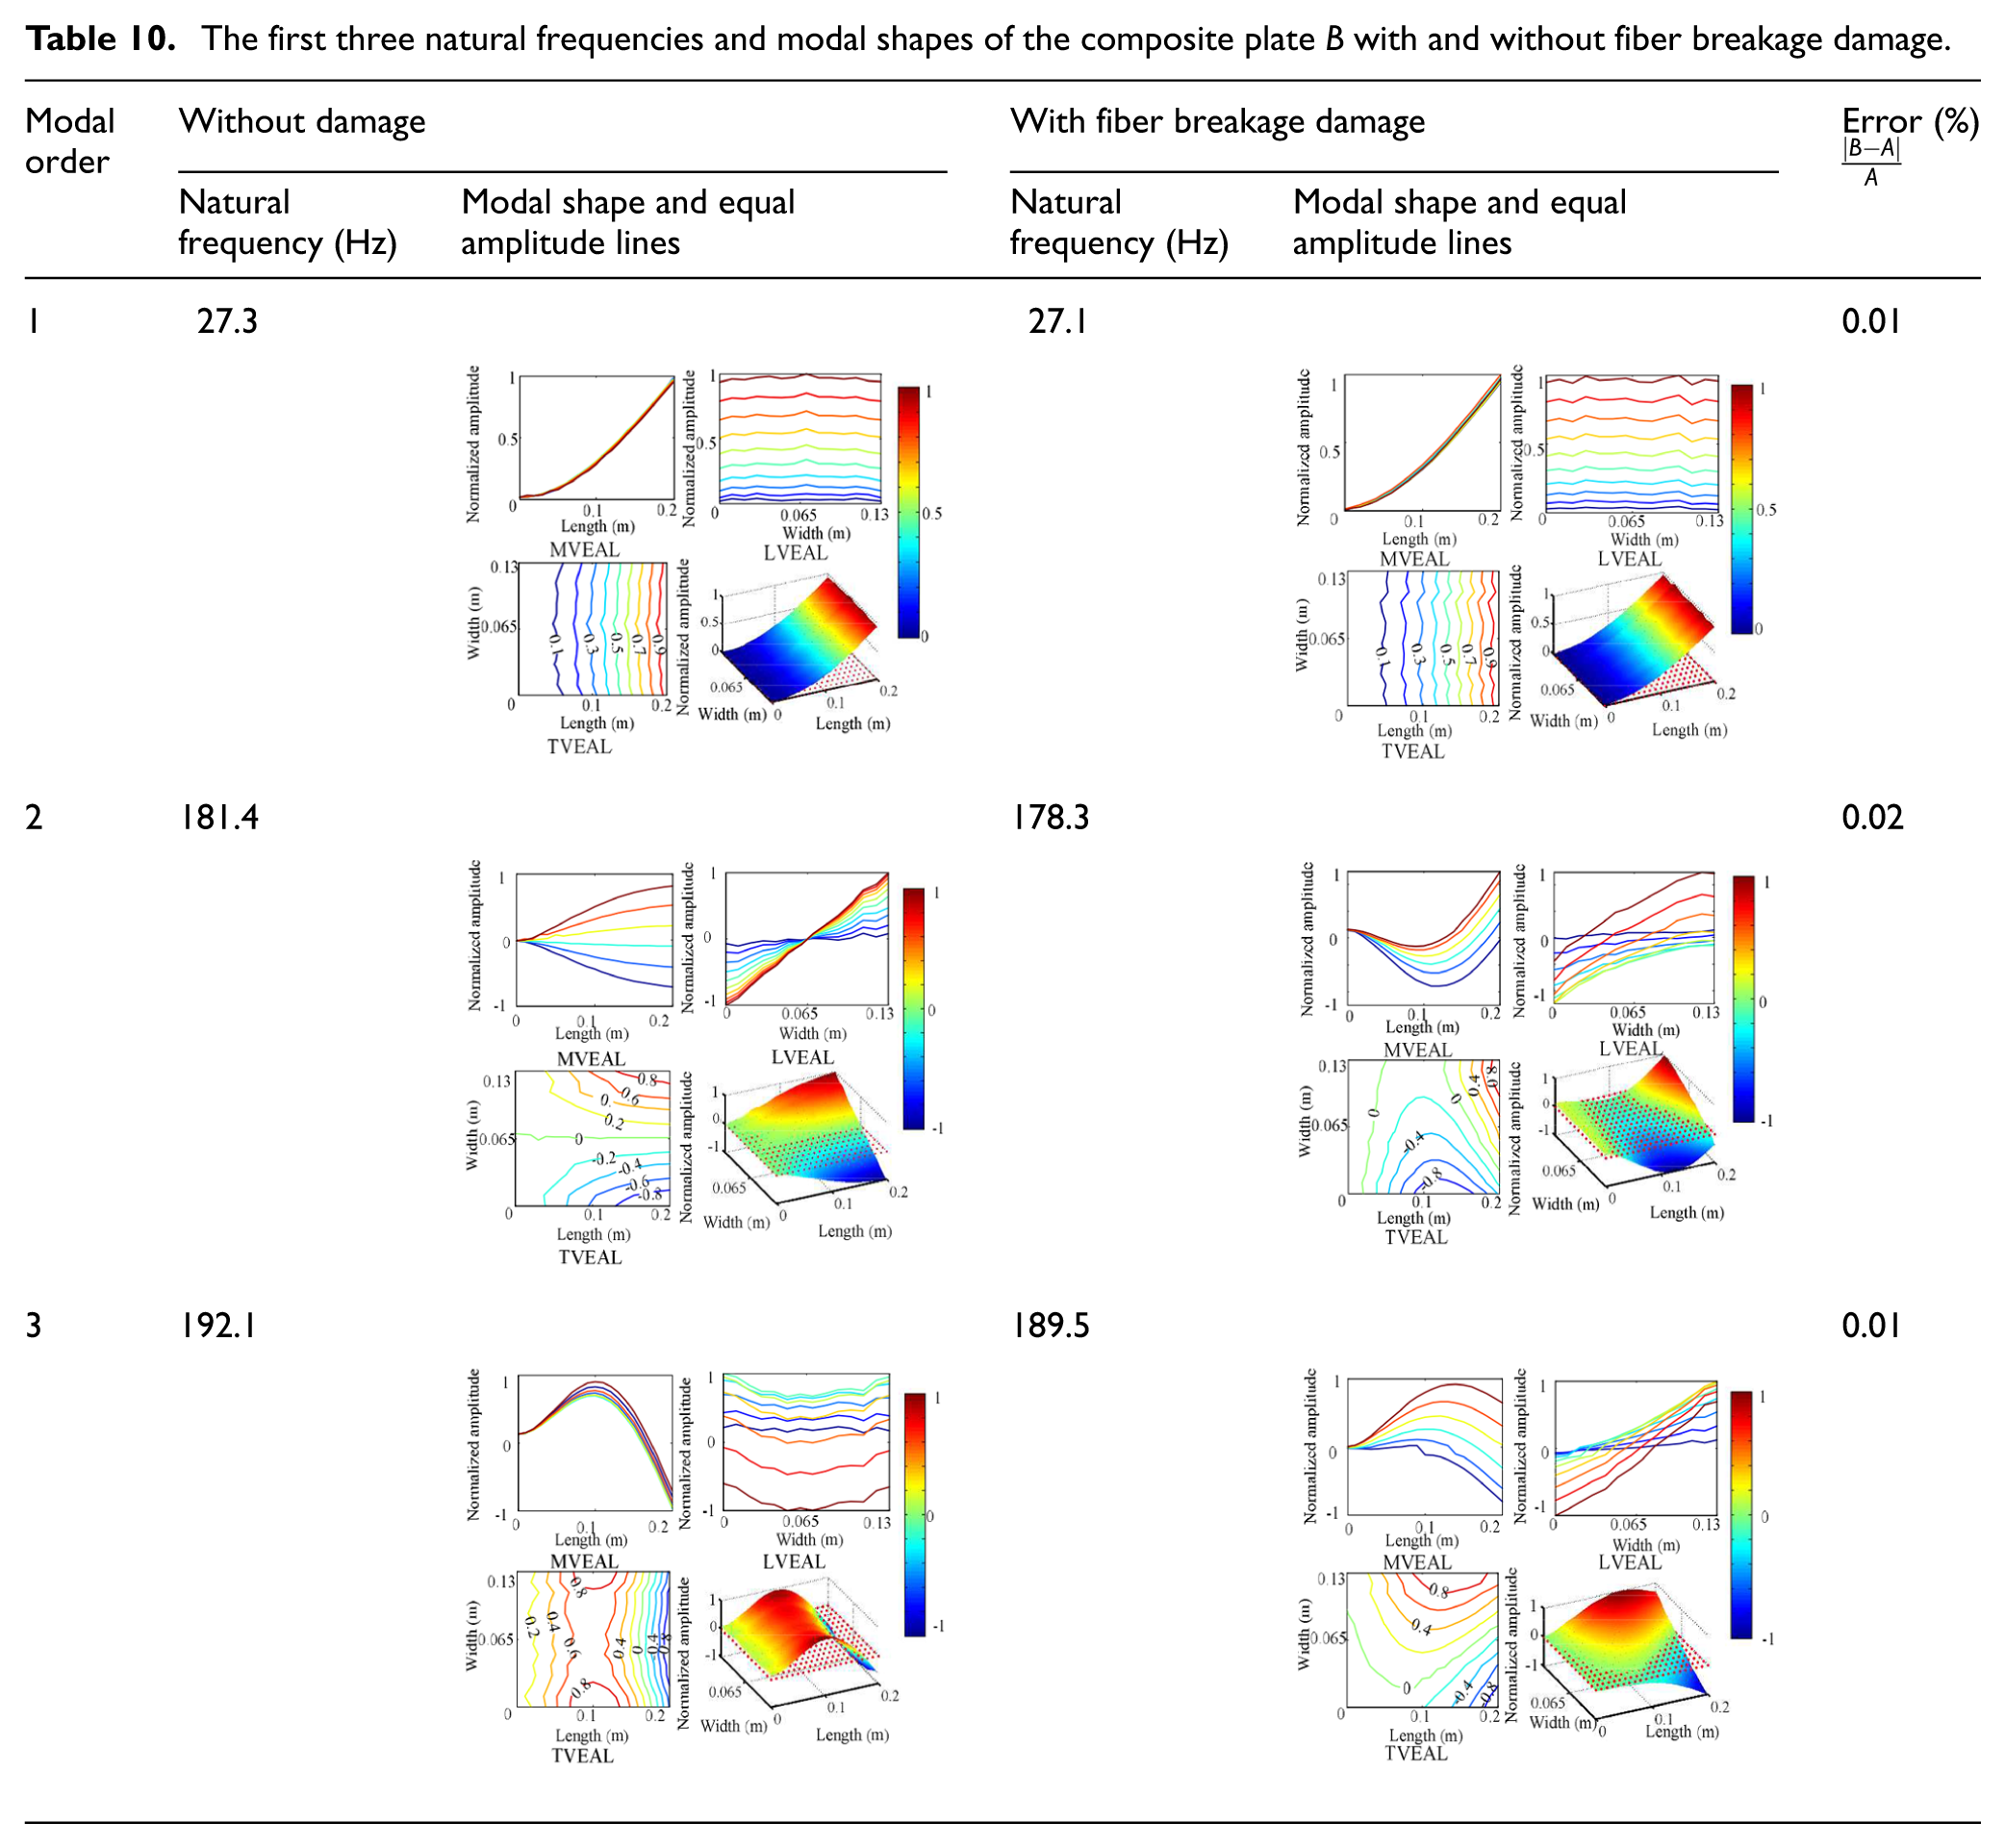
First, still the same laser scanning parameters are employed which are used in the “Influence analysis of the different fiber angles” section to complete modal shape scanning test on the undamaged plate. Then, a sharp knife is used to break the fibers under the same constraint boundary to carry out modal shape scanning test on the fiber breakage plate. The first three natural frequencies and modal shapes of the composite plate B with and without fiber breakage damage are listed in Table 10, and the corresponding equal amplitude line in different projection views is also given. It can be concluded that fiber breakage damage may cause a slight decrease in natural frequency of composite plate, but it is hard to use frequency results as the damage index because of the too small changing degree. However, we can clearly see the differences between the damaged and undamaged shape results, especially from the second and third modal shape results. For example, the damaged shape results are asymmetric and their equal amplitude lines in different projection views are also quite different with normal shape results. So, by using the high-density modal shape results obtained by laser linear scanning method, we can determine whether or not the damage at various degrees has produced in the composite plate, and the information of damage location, extent, and type may even be identified by this method (we will study these problems in the later days).
The first three natural frequencies and modal shapes of the composite plate B with and without fiber breakage damage.
Conclusion
The laser linear scanning system is designed and laser linear scanning method is proposed to test modal shape of fiber-reinforced composite plate with high test efficiency and precision in the research. Besides, the corresponding test procedure of modal shape, drawing method from the shape scanning data, and control method of the constant laser scanning rate are also proposed. Finally, the influences of constraint boundary condition, excitation level, laser scanning rate, scanning spacing, scanning path mode, the fiber angles, and fiber material damage on modal shape results are discussed, and the conclusions are as follows:
The boundary condition has a great influence on modal shape result of the composite plate, so it must be clamped by enough tightening torque to ensure it is under good constraint state. Only in this way, can we obtain good modal shape results by the laser linear scanning method.
When the excitation level is small, it will lead to the modal result distorted and dislocated. With the increase of excitation level, the shape results become gradually smooth, and the nodal lines can be clearly identified. So, in order to improve the test accuracy, sufficient excitation level is needed to excite the tested composite plate at the resonance state.
Row scanning mode and column scanning mode have no effects on the modal shape results, but in order to ensure high-quality modal shape results, the scanning spacing (the row spacing or the column spacing) should not be too large. According to processing experience of shape data with the high efficiency, the adjacent row spacing should be less than or equal to one-tenth of the length of the composite plate. Also, we can refer to the proposed selection criterion to choose an appropriate laser scanning rate.
Laser linear scanning method has the advantage to obtain the high-density modal shape results, so these shape data can be used in the different projection views to study the influence of fiber angles and material damage. Besides, it has been proved that the shape data can be employed to identify some fatigue and damage failures in fiber-reinforced composite plate.
Footnotes
Declaration of conflicting interests
The author(s) declared no potential conflicts of interest with respect to the research, authorship, and/or publication of this article.
Funding
This study was supported by the National Natural Science Foundation of China, Grant No. 51505070; the Fundamental Research Funds for the Central Universities of China, Grant Nos N150304011, N160313002, N160312001, and N170302001; the Scholarship Fund of China Scholarship Council (CSC), Grant No. 201806085032; and the Key Laboratory of Vibration and Control of Aero-Propulsion System Ministry of Education, Northeastern University, Grant No. VCAME201603.