
Abstract
The article analyzes vibrational oscillation’s strength dissemination and the parameters in the centering and leveling table using the covariance function theory. The implementation of measurement techniques requires to use most advanced ideas, and to seek and develop new tools, based on which the direction of angle calibration system’s development could be substantiated and calibration methodologies could be enabled. Vibrational oscillation strength measurements across fixed five ring points’ observations were recorded on a time scale in five vectors arrays (matrices). The covariance functions have enabled the evaluation of the influence of the vibrations of the corresponding rings on the accuracy of the measurement results. Expressions of auto-covariance and cross-covariance functions show the changes in the time scale of the interdependence between the parameters of the corresponding vibrations of the rings on the smoothing device. These changes significantly affect the measurement data errors. The digital vibrational strength measurement arrays’ reciprocal covariance functions were calculated, and estimates of individual arrays’ auto-covariance functions, by changing the quantization interval on the time scale. The covariance model proposed by the authors for the analysis of the dynamical parameters of the centering–leveling devices can be used to investigate the dynamic characteristics of the angular comparators containing the said devices and at the same time to determine the ways of improving the precision of these angular comparators. The calculations were carried out using the special computer program developed by the authors of the Matlab7 Operator Package (The MathWorks, Inc. R2012a 7.14.0.739 License Number 699298).
Introduction
In this work, an analysis of the centering and leveling device dynamic parameters was carried out using the random function theory.
By rapid development of equipment and its separate parts’ and components’ manufacturing technologies, their technical characteristics were significantly improved, investment costs were reduced, and there are other important developmental aspects as well. Angular measurement also improves these technologies.
Advances in high-tech measurement techniques demand higher calibration accuracy of angle measurement, that is why the implementation of these measurement techniques requires to use most advanced ideas, and to seek and develop new tools, based on which the direction of angle calibration system’s development could be substantiated and calibration methodologies could be enabled.
The measurements of circular scales, their review, and their analysis show a big interest in the scales’ accuracy and measurement efficiency. To ensure the quality of the measurement, we are often faced with additional disadvantages in measuring technique.
Extremely high precision is required in limbs centering and leveling devices, which have to transfer movements of micrometer parts and, after performing it, to reliably capture a measuring object. 1 Normal centering schemes for measuring dashed angular positions of raster limbs are presented in Figure 1; however, there are many measurement systems for which these are not suitable. Also, the tables that are followed cannot be automated in the modern angle measuring devices.
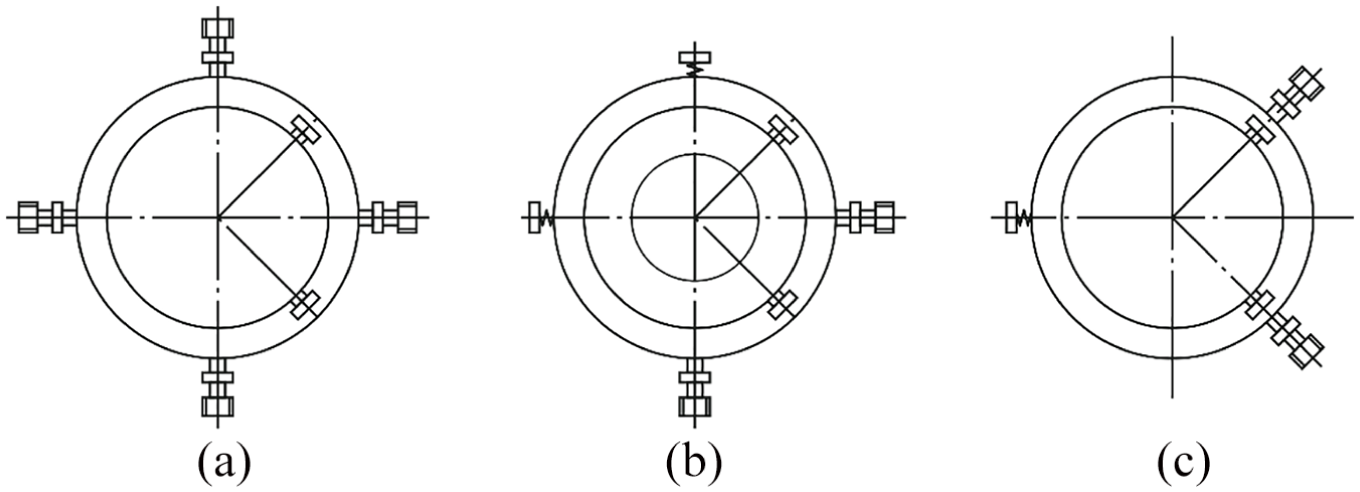
The scheme of leveling–centering device: (a) centered with four screws; (b) centered with two screws and couple spring; and (c) centered in three points—two bolts and one spring.
This table is used in angular measuring comparators and is one of the main parts that affect the accuracy of measurement of both raster scales and angular transducers. The most angular comparators are working in static mode, that is, by set angle; deduct measured angle value; and compare it with the reference value. In particular, this table can be used for a new generation of angle measurement comparators operating in continuous dynamic mode. Dynamic research of such type comparator with the above-mentioned centering leveling table is presented in the publication. 2
For setting the errors of angular coordinates of dashes, gauges, or angle forming surfaces, the readings of angular measuring systems are compared to those of reference measurement of the angle or of the reference measuring systems indications. Comparison, in static mode, means comparing the mobile comparators system (turn table) positioning to the set position, or, in dynamic mode, to the moving (turning) pivotally of comparator system.
Dynamic parameters become very significant during calibration of angular transducers or by measuring the raster scales in dynamic mode. However, the measurement of dynamic parameters of a significant points of measuring system during operation is impossible due to subtleties of the precision measuring process (comparator curtain for reducing temperature deformations, the measurement process itself, etc.). A leveling–centering table in conjunction with the angle comparator is investigated. The dynamic parameters of that device are investigated, in other words, the effect of vibrations on accuracy, using the theory of correlation functions. Using this theory, the dynamic parameters of the system’s points are predicted, knowing the dynamical parameters of other system points, which have already been measured under more favorable conditions. This allows optimization of the operating modes of the entire measuring system in order to obtain the lowest influence of the dynamic effects on the accuracy of the measurement when the measurements are carried out in a continuous (dynamic) mode.
Circular scales determine the errors of their dashes’ positions, and then that is used as a reference standard in scales and various technical machines, and in the positioning and displacement of the measuring devices. In new circular scales measurements, to reduce the errors of scale positioning, centering–leveling table is created for accurate measurements of dashes’ angular position for circular scales, installed in measuring devices (tachometers, machines’ rotatable tables, geodetic instruments’ adjustment devices, etc.).
The theoretical model based on the concept of stationary random function, given that the vibrational oscillations’ parameters measurement errors are random and of equal accuracy, that is, the errors average
Data reconciliation, first introduced by Kuehn and Davidson, 3 is a model-based filtering method that applies simple process models to improve the reliability and precision of measured variables. Data reconciliation has been applied to a large number of processes as summarized by Mah 4 and Narasimhan and Jordache. 5 Other topics are related to data reconciliation, such as sampling error and reconciliation criterion weighting factor evaluation, 6 reconciled value accuracy evaluation, 7 and use of reconciled values to calculate and display plant performance indices, such as concentrate grade and recovery.2,8,9 Poulin et al. 10 studied steady-state data reconciliation applied on a real-time basis. Vasebi et al. 11 proposed a modified stationary observer that takes advantage of the correlation of node imbalances to improve estimation performances.
Estimates of two deformation signals, digital arrays covariance function or a single array auto-covariance function, are calculated by spreading the digital oscillation arrays in a vector form. For the processing of the digital signals, the discrete Fourier transformation12,13 and wavelet or small wave function theory are applied.14–17
Test object
The centering and leveling table construction consists of (Figure 2) (1) a body (outer ring) on which all other parts of the equipment are assembled; (2) the centering and leveling disk (inner ring); (3) lower ring for fitting the table to the other measurement systems; and (4) two centering–leveling micro-feeds, and few elements (shots, springs, cone-shaped tips, etc.) for micro-feed transmission.
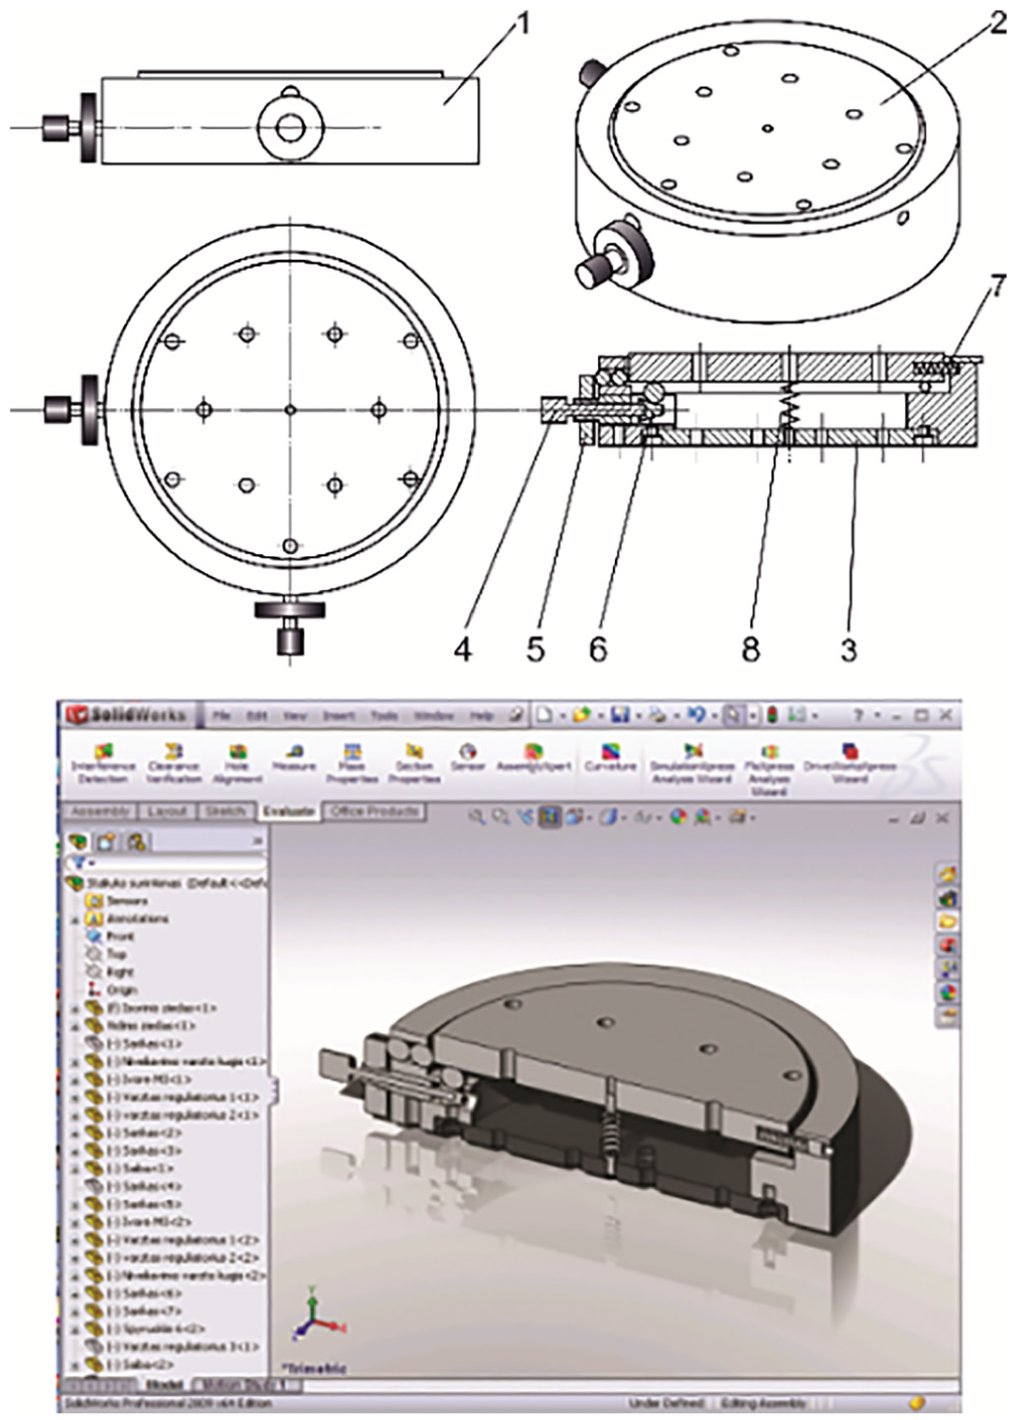
The table assembling drawing and 3D model cut.
The adjustment table for optical and geodetic instruments has two pairs of adjustment mechanisms. Centering and leveling positions are adjusted in the same plane, in two perpendicular axes relative to each other. This device (Figure 2) is special because it is easy to simplify and enhance its accuracy. Centering–leveling micro-mechanisms are mounted concentrically in two perpendicular axes, with feed transferred to two disk supports. In order to increase the displacement accuracy and mechanism resolution, both concentric mechanisms are mounted to work independently of each other. Centering position is adjusted by two rings (5), the surface of which has a slope of 0.2 mm, and acting as concentric pushes the shots through the inner ring (2) in the right position. Centering is carried out under a microscope when the disk position coincides with the center of rotation.
Leveling position is adjusted by two screwed cams (4), on whose ends are screwed conical grinding tips (6). The screws are rotating to one or the other side, sliding like the conical tip leveling the inner ring (2) through the shots in necessary position. The springs (7 and 8) support tightness and hold the disk compact with adjustment mechanism. Leveling also could be realized through monitoring the object under a microscope or by leaning the indicator to a position where the disk takes an accurate position.
For the analysis of vibration signal parameters, the model of covariance functions is used, created by authors and described in literature.2,8,9
A block diagram of research stand for the identification of the dynamic mechanical characteristics of the system is presented in Figure 3.
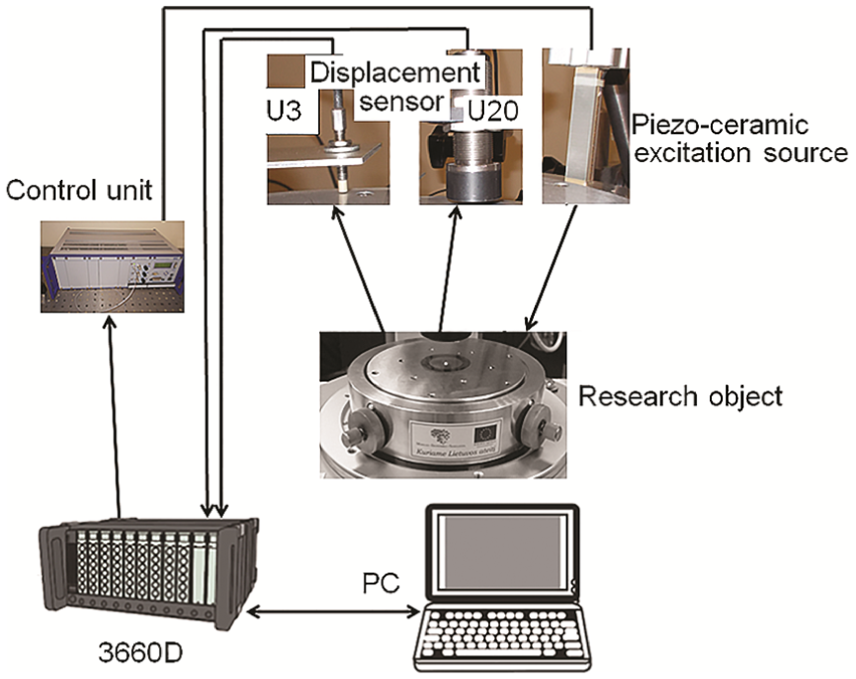
The block diagram of research stand.
With this, the displacement measurements dots of the centering and leveling table’s upper part are made (dots presented on Figure 4) under external excitation (to excite modes up to 1000 Hz, the selected signal is variable in 1 s of 0–1000 Hz (SWEP)). Measurements were performed in the vertical direction.
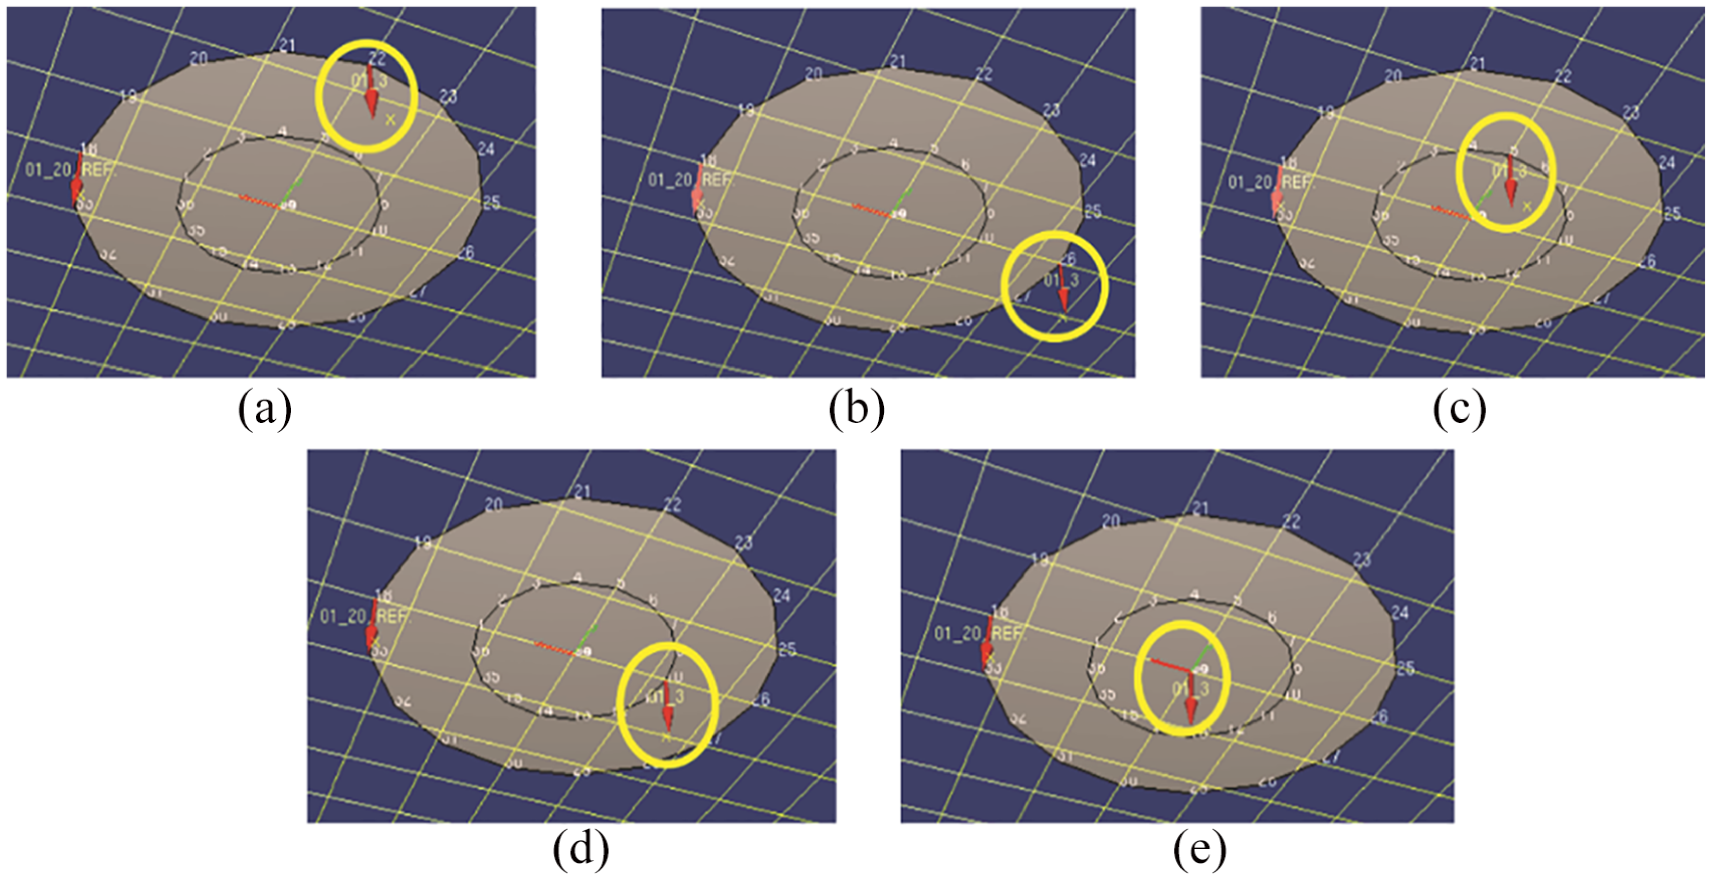
Displacement measurements dots of the centering and leveling table’s upper part: (a) and (b) are two dots of quarter in the outer upper part of the circle; (c) and (d) are two dots of quarter in the inner circle of the upper part; (e) is the center dot of the upper part.
The results are shown in Figure 5.
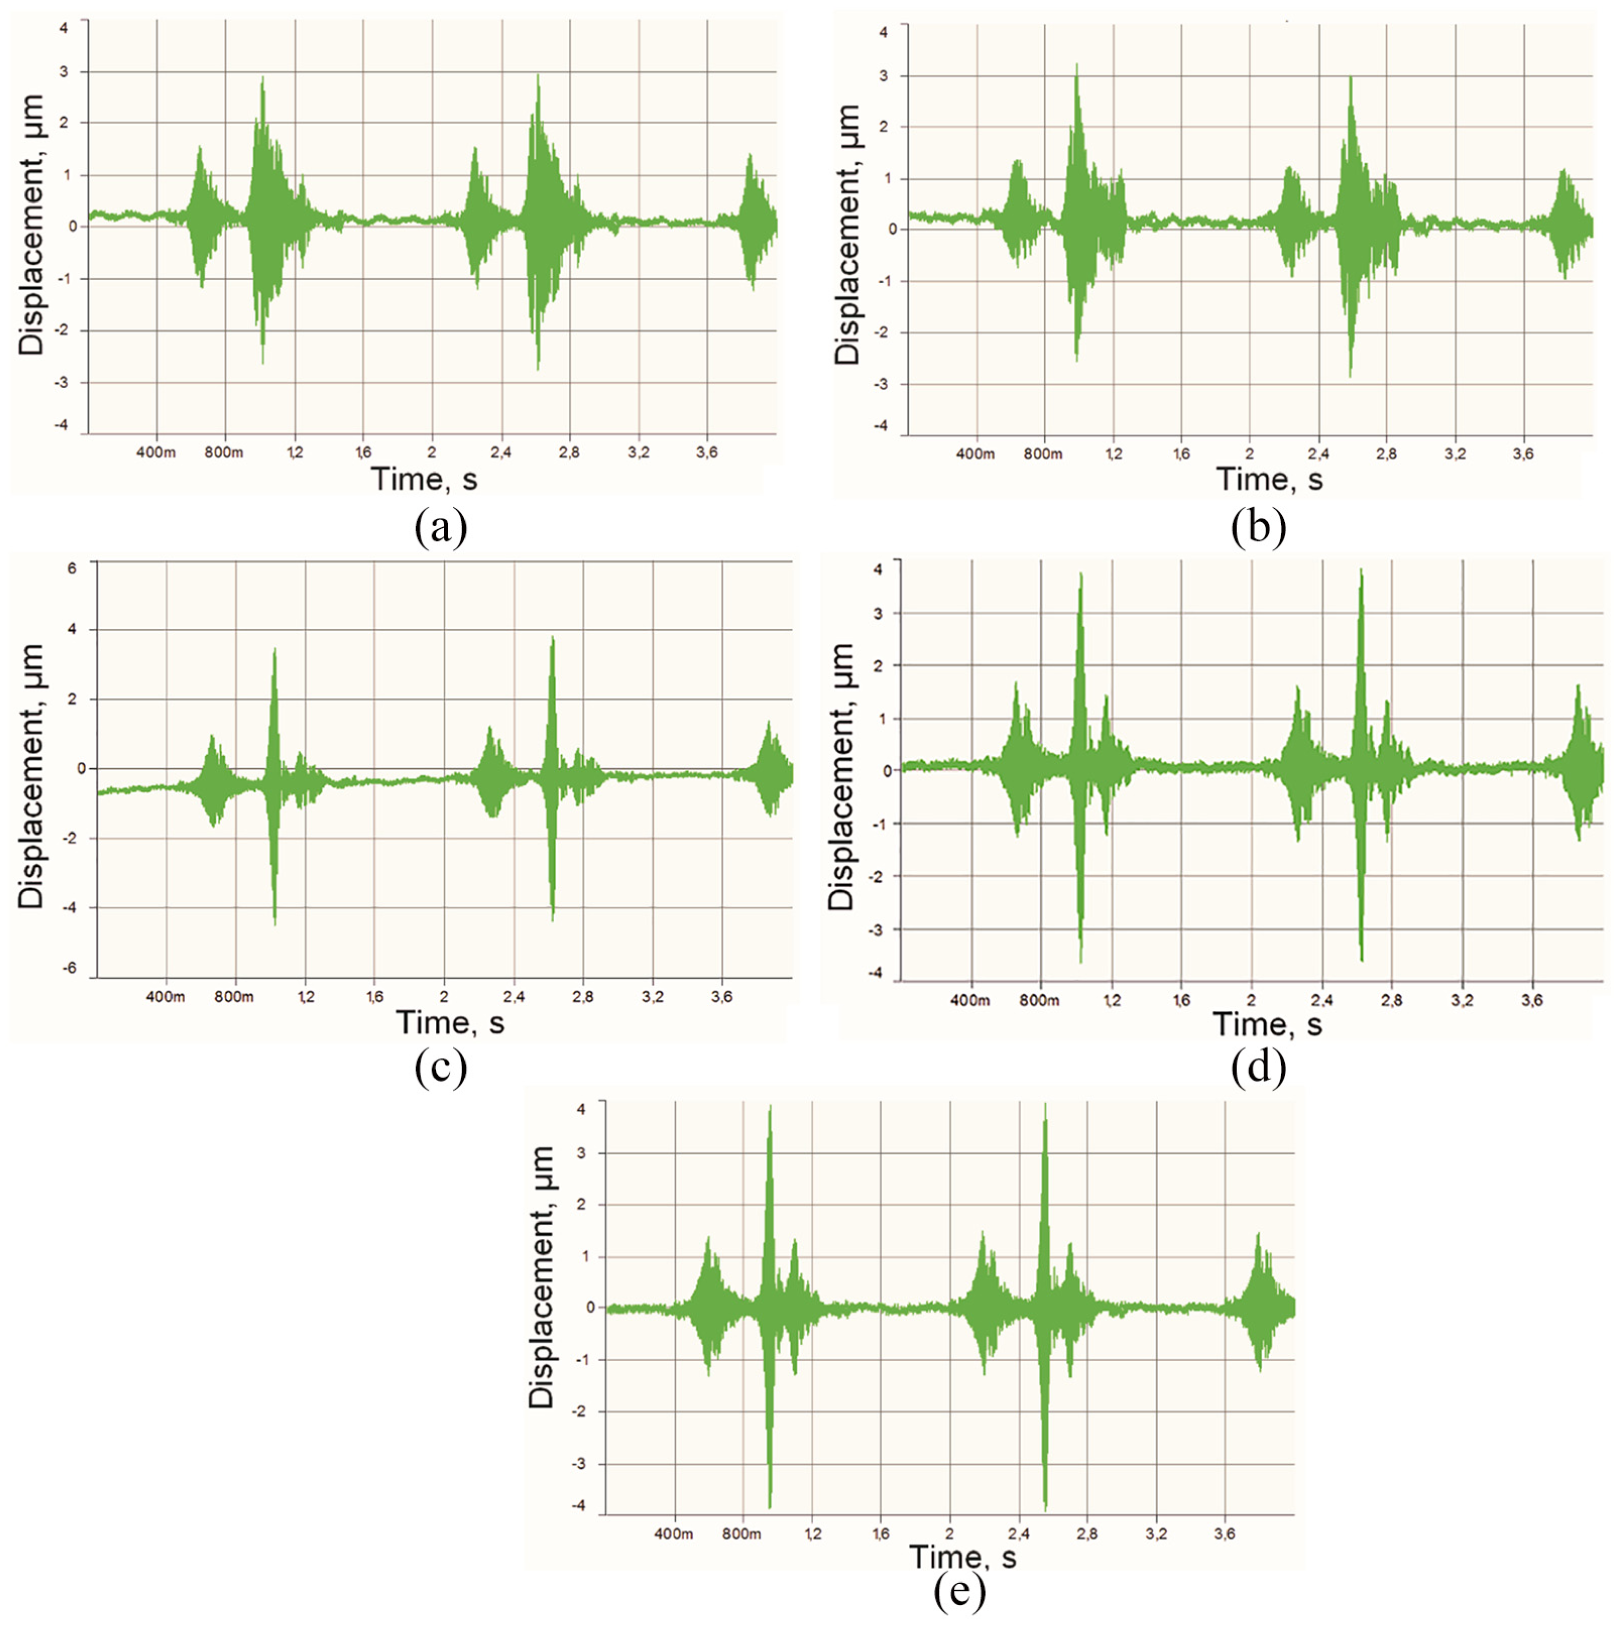
A vertical vibration displacement amplitudes of the centering–leveling table dots: (a) and (b) are two dots of quarter in the outer upper part of the circle. (c) and (d) are two dots of quarter in the inner circle of the upper part. (e) is the center dot of the upper part.
Of the 32 dots in the upper part of the table that were measured, five dots were selected for the analysis (Figure 4): two in the outer circle of the upper part, two in the inner circle of the upper part, and one dot at the center of the upper part.
Experiment, analysis results, and discussion
Data arrays of the vibrational signals of corresponding parameters are obtained by vibration measurements of centering and leveling rings, as presented in Figure 5.
In the relevant points of rings of centering device, the vectors of vibration signals were measured and data of the five vectors’ measurement were got. The signals there found to be in intervals
We applied a vectors numbering order (1, 2, 3, 4, 5; see Figure 12) for the calculation procedures. Measurement data arrays were processed on computer, using the special computer program developed by the authors of the Matlab7 Operator Package (The MathWorks, Inc. R2012a 7.14.0.739 License Number 699298).
The values of normative covariance functions quantization interval vary from 1 to n/2 values, here
All expressions of the five vectors’ normative auto-covariance functions have dual harmonic shape, when the period of major harmonic is equal to
Normative auto-covariance functions take the maximum value of the correlation coefficient
For the centering device, the five vectors’ deformation signals’ inter-normative covariance functions have the same shape of double harmonic on the grand harmonic period
More significant graphical expressions of normative auto-covariance and inter-normative covariance functions are presented in Figures 6–11. Figure 12 presents a graphical image of the five vectors’ array’s generalized (spatial) correlation matrix for centering device. The correlation matrix expression takes the shape of a five-block pyramid, where correlation coefficient values are shown by the shades of color spectrum. It is shown in the colored projection of pyramids.
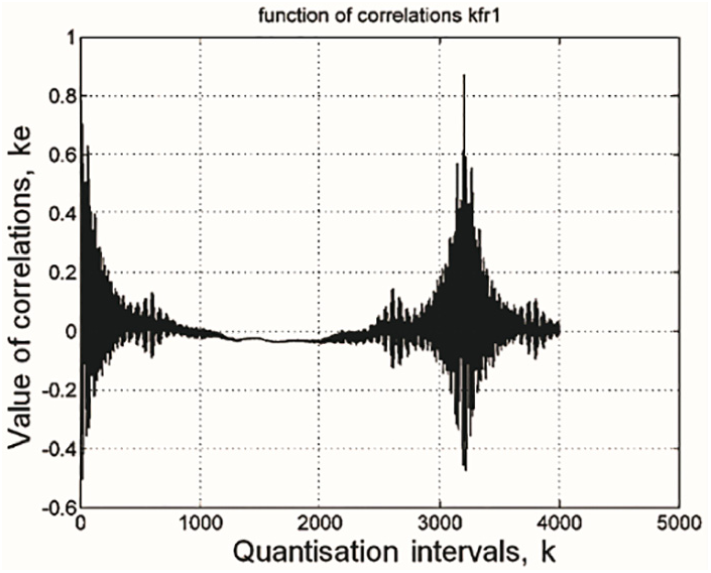
Normative auto-covariance function for the vector of the vibration signals from point 1.
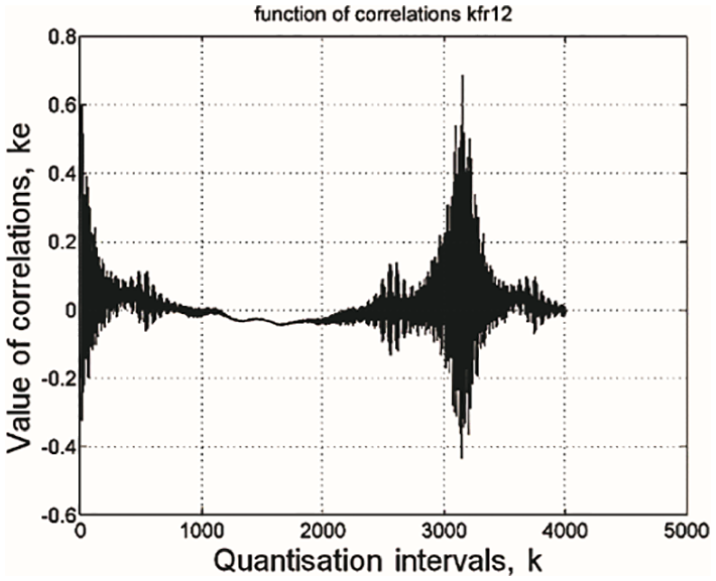
Normative cross-covariance function for the vectors of the vibration signals from points 1 and 2.
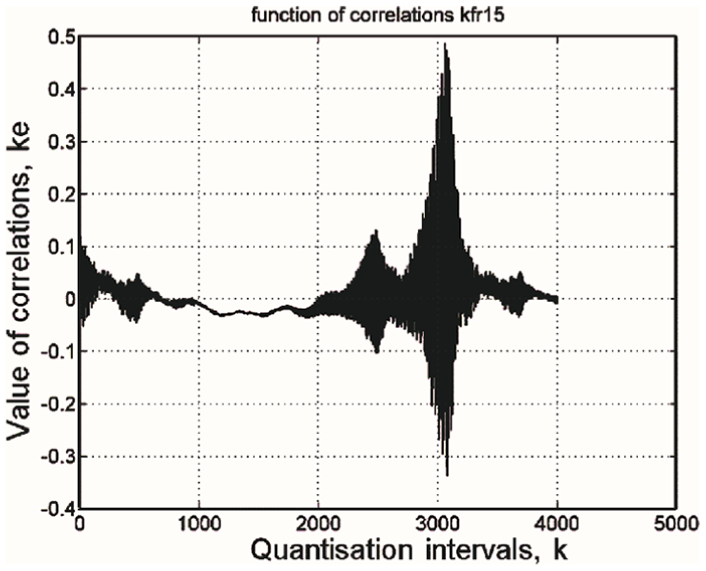
Normative cross-covariance function for the vectors of the vibration signals from points 1 and 5.
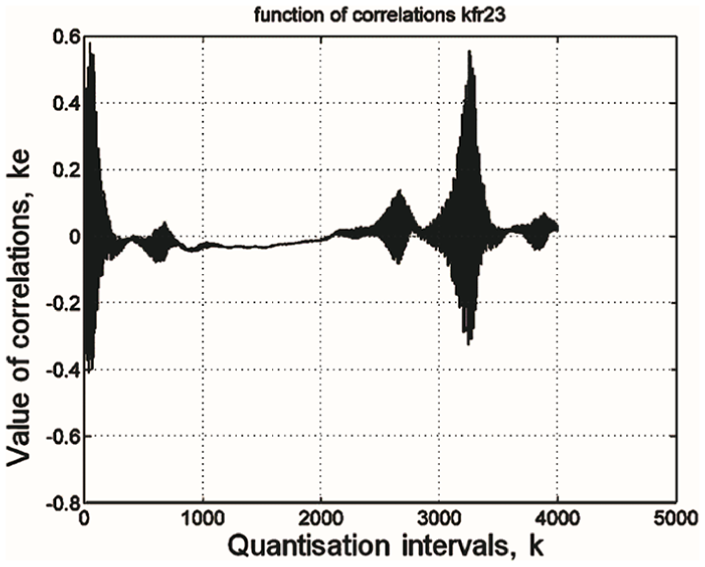
Normative cross-covariance function for the vectors of the vibration signals from points 2 and 3.
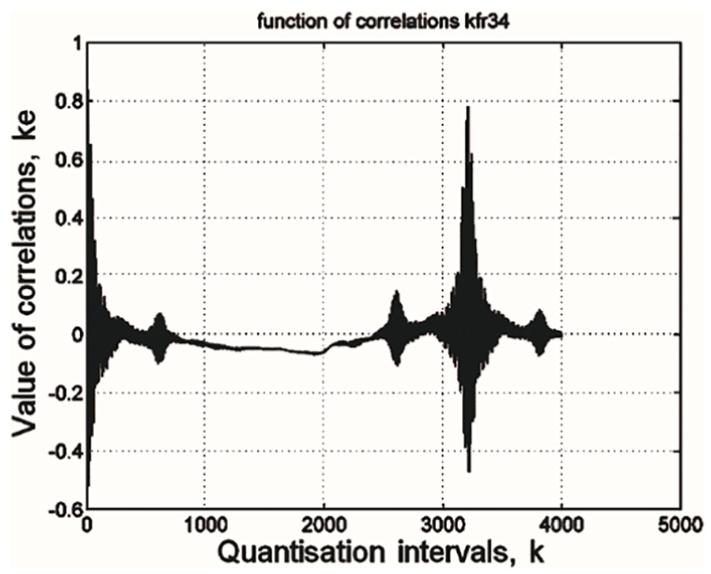
Normative cross-covariance function for the vectors of the vibration signals from points 3 and 4.
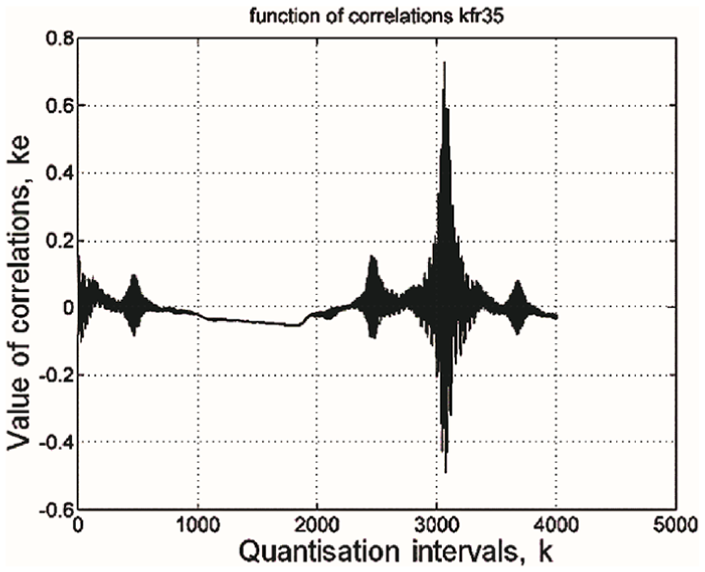
Normative cross-covariance function for the vectors of the vibration signals from points 3 and 5.
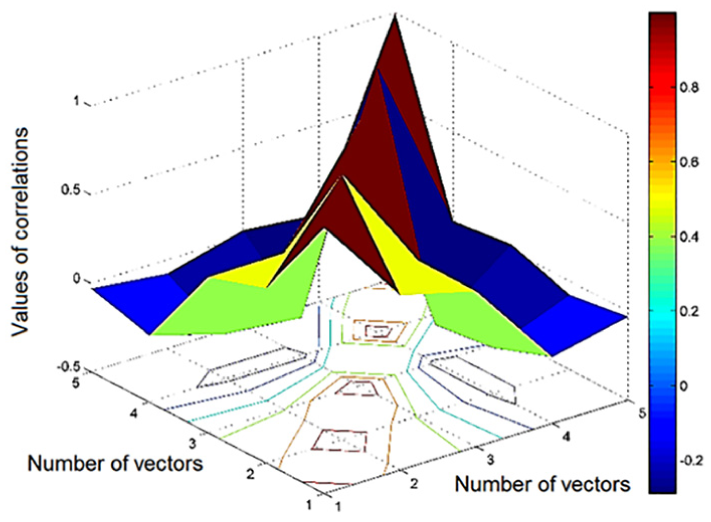
Graphical image of the vibrational signals of the five-vector array’s generalized (spatial) correlation matrix for centering and leveling equipment.
Normative auto-covariance and cross-covariance functions for deformation signals’ vectors have the shape of dual harmonic, similar to the vibration signals of piezoelectric generator. This indicates that the piezoelectric vibrations are correlated, and its autocorrelation signals’ period is equal to
Conclusion
Normative auto-covariance and cross-covariance functions of centering and leveling device’s points’ deformation signals enable us to identify a correlation change between the data vectors by the time quantization interval of the signals.
The dependence of vibrations vectors between the alignment of the table rings is quite strong. It means that the self-vibrations of the rings of this table, used in the angular comparators, has been a significant affect on the accuracy of the measurements results.
The covariance model proposed by the authors for the analysis of the dynamical parameters of the centering leveling devices can be used to investigate the dynamic characteristics of the angular comparators containing the said devices and at the same time to determine the ways of improving the precision of these angular comparators.
Footnotes
Declaration of conflicting interests
The author(s) declared no potential conflicts of interest with respect to the research, authorship, and/or publication of this article.
Funding
The author(s) received no financial support for the research, authorship, and/or publication of this article.