
Abstract
The size of the load pad had a significant effect on the output of the column-type force transducer. It was important to eliminate the influence when the transducer was loaded in a force transducer build-up system which worked as the primary force transfer standard. A common model of the output about the column-type force transducer affected by the shape of load pad was analysed. Seven load pads with various dimensions were designed and fixed on a 300-kN force transducer to investigate the influence of the dimension on the indication error of the transducer. The results showed that the load pad of the sphere–plane contact design would cause the smallest indication error but the largest contact stress. It was better to use the load pad of the sphere–sphere contact design with the spherical radius ratio of ball to cup equalled to 0.2. The spherical radius of the ball should be small under the permission of material strength. In addition, it was important to enhance the stiffness of the build-up system to eliminate the effect of the load pad size on the indication error of the transducer.
Introduction
The demand of high-accuracy measurement with a nominal force more than 20 MN is increasing in various industries such as the aerospace, huge bridge construction, nuclear, building, and wind industries.1–5 Since the late 1970s, several build-up force calibration machines (BUFCM) with capacities over 20 MN have been set up to satisfy the dissemination of the force in the meganewton range, which includes a 30 MN BUFCM at the National Physical Laboratory (NPL) in the United Kingdom, 6 with its twin machine at ‘Ukrmetrteststandard’ in Ukraine; 7 a 53 MN BUFCM at National Institute of Standards and Technology (NIST) in the United States;8,9 and a 60 MN BUFCM at the Fujian Institute of Metrology (FJIM) in China.10–12
Since unable to be traced directly to the base SI units of mass, length, and time, the BUFCM with such a large capacity should be calibrated by a force transducer build-up system (BUS), which works as the force transfer standard. 13 As shown in Figure 1, the BUS consists several force transducers with the same capacities and build-up structure, such as the upper load pad, upper platen, and ground platen. 6 To calibrate the BUFCM, the force transducers should be calibrated separately in a force standard machine (FSM) at first and then assembled to be a BUS. Therefore, the BUS works as the primary standard in the ultra-high force range, and it is significantly important to enhance its accuracy. 14
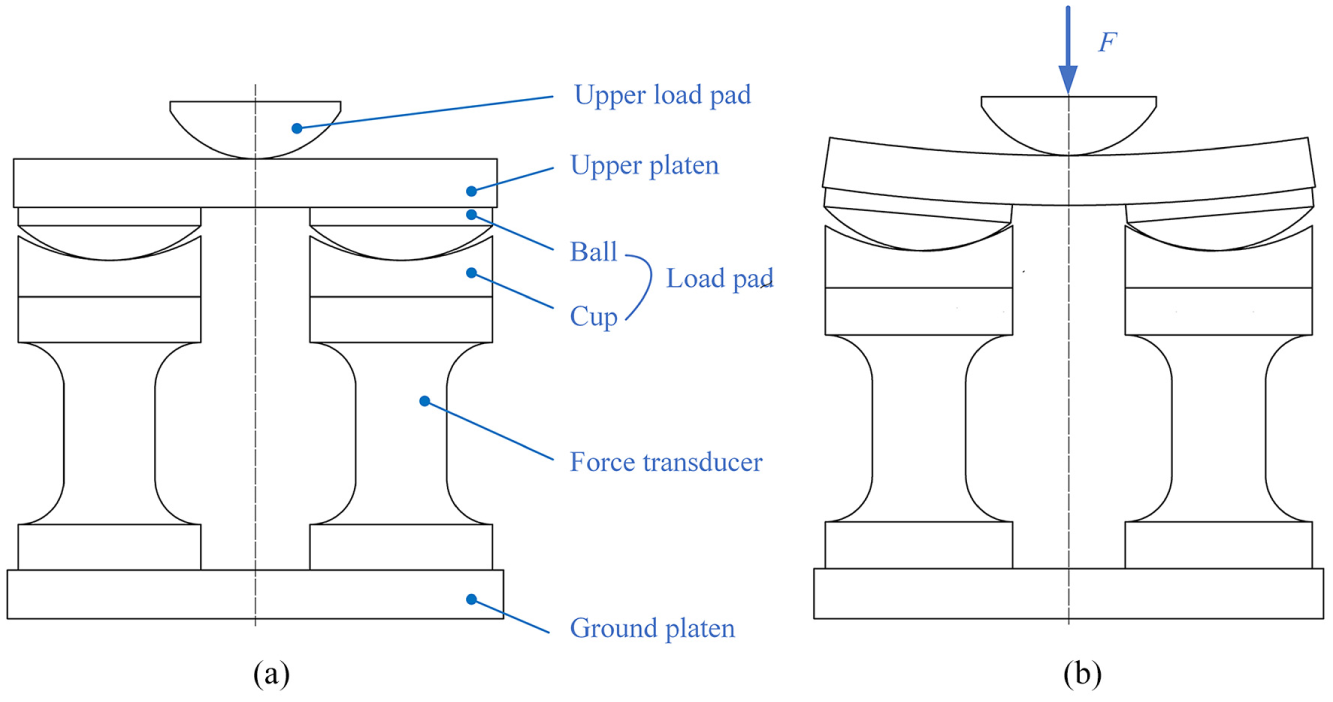
Schematic diagram of the force transducer build-up system (BUS): (a) components of the BUS and (b) loaded BUS with deformation.
An indication error exists in the BUS.14,15 As shown in Figure 1, the upper platen will deform when the BUS is loaded. For being fixed on the platen, the ball of the load pad will rotate on the cup. Therefore, the contact point between the ball and the cup will move away from the axial line of the force transducer. The parasitic components, which include a side force and an additional moment, are induced on the force transducer. In this case, the loading condition of the force transducer is quite different from that when the transducer is measured individually in an FSM.
The indication error, which is considered as a systematic error,14,15 should be eliminated to improve the accuracy of the BUS. The influence of the parasitic components should be diminished. The magnitude of the parasitic components is determined mainly by the rigidity of the upper platen and the dimension of the load pad, especially the spherical radius of the ball and cup. It is important to enhance the stiffness of the upper platen and also to improve the design of the load pad.
To date, there are few reports about the study of the load pad in the BUS. The load pad of the sphere–plane contact design, where the ball contacts with a flat pad, was often used in the BUS.1,3,14,16 But for the force transducer with a capacity over 10 MN or up to 20 MN even, the contact stresses of the load pad are much large. The strength of the material should be checked carefully, and the suitable spherical radius is necessary to confine the stresses at the contact point within the limit of the material. 7 Using a very small radius will result in failure of the material at the contact point or even fracture.17,18
In 2015, Wagner et al. 7 designed a 15 MN BUS to calibrate a 30 MN force calibration machine (FCM) in Ukraine. A concave-shaped load pad was designed for the transducer in the BUS to reduce contact stress. It is a new and beneficial idea in designing load pads for transducers in BUSs. More research should be carried out to investigate the performance of the concave-shaped load pads.
In this study, both the load pads of the sphere–plane contact design and the sphere–sphere contact design were studied. A common model of the output about the column-type force transducer affected by the shape of the load pad was analysed. Seven load pads with various dimensions were designed and fixed on the same force transducer to investigate their performances.
Model proposed
The side force and additional moment produced on the force transducer
As shown in Figure 2, an angular misalignment will exist after the deformation of the upper platen, and the contact point between the ball and cup will move sideways. Therefore, as shown in Figure 3, the force on the primary axis of the transducer,

where
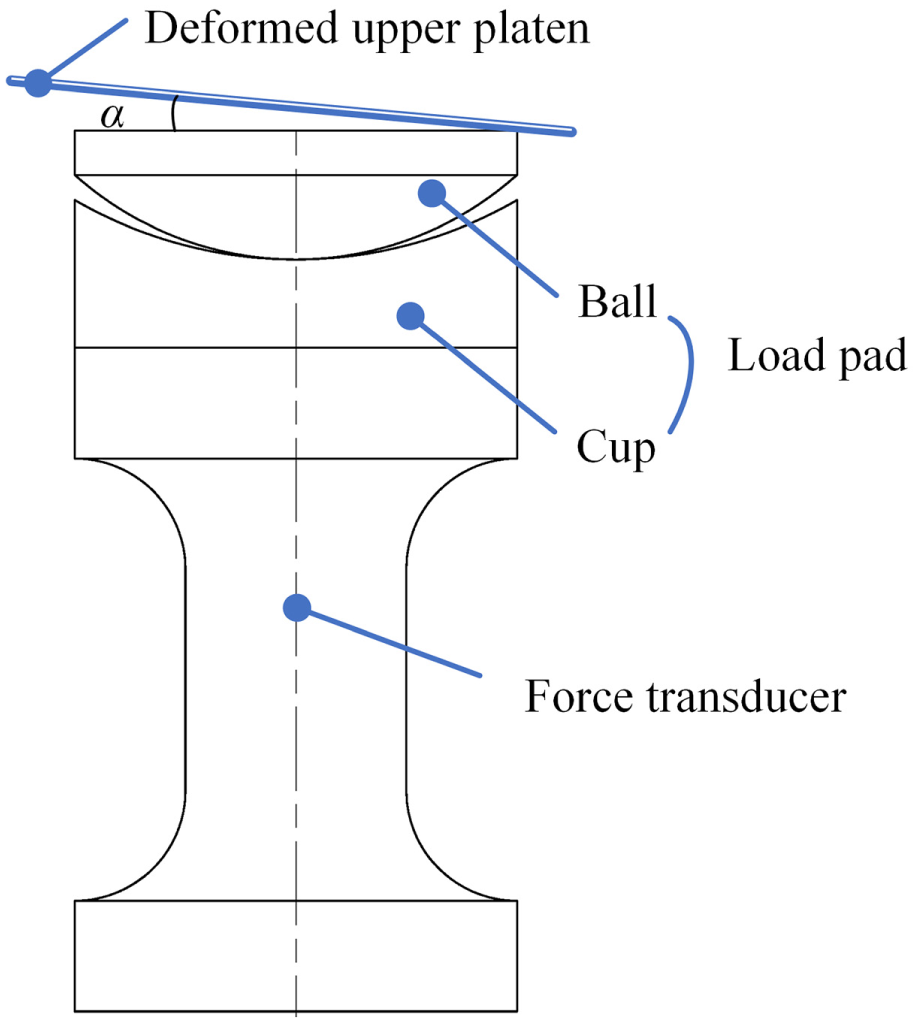
Schematic diagram of the force transducer and load pad.
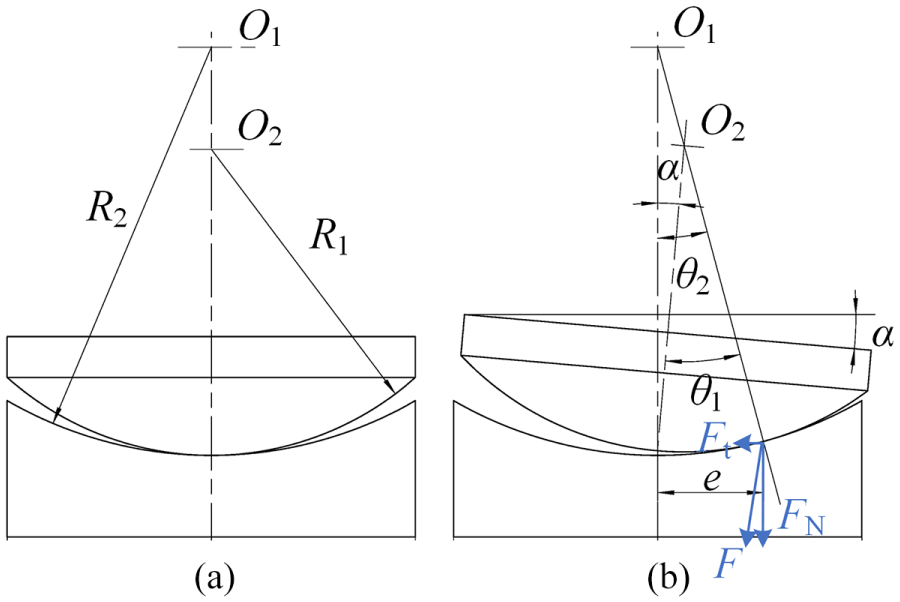
Schematic diagram of the load pad: (a) before rotation and (b) after rotation.
The side force,

and an additional moment,

where e is the eccentricity of the load (Figure 3)

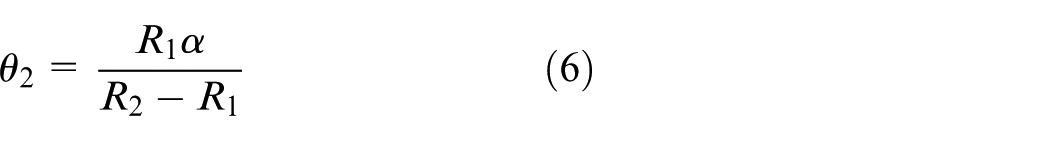
From the geometrical relationship in Figure 3, we obtain
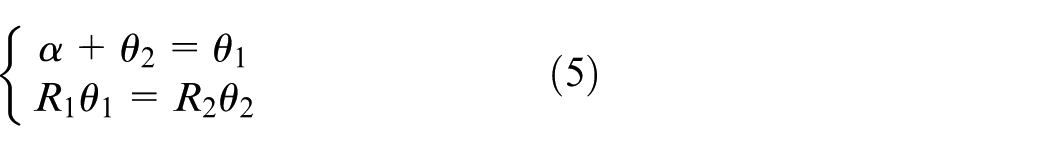
where
Simplifying equation (5),
Substituting equations (1), (4), and (6) into equation (3), we obtain
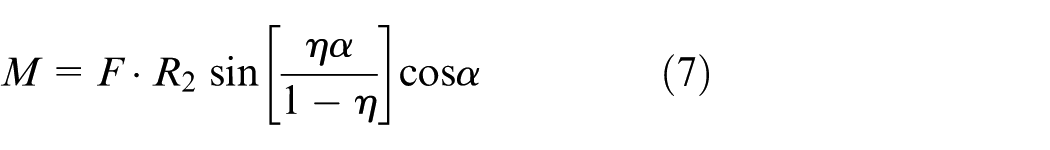
where
The output of the force transducer influenced by the side force and additional moment
Figure 4(a) shows that the loads, including the primary load,
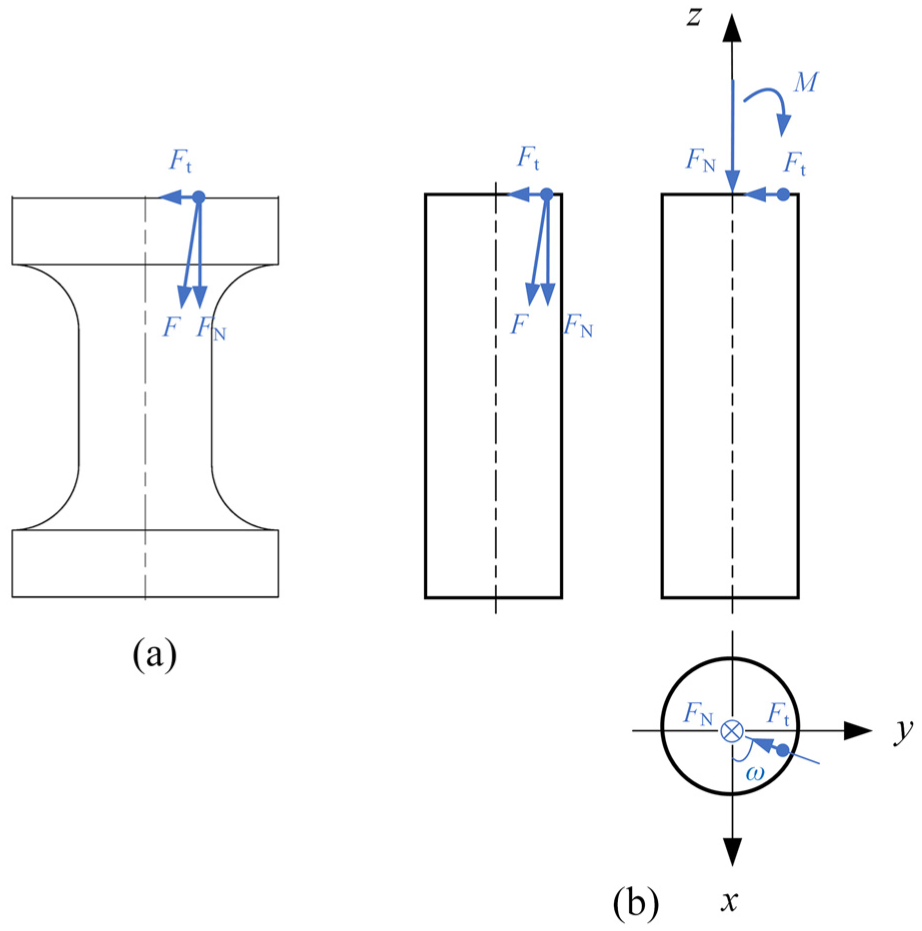
Mechanical model of the force transducer: (a) loading condition of the transducer and (b) simplified model of transducer under loading.
Four strain gauges are attached to the elastic element, as shown in Figure 5(a). But for the technical limitation of the strain gauges attachment, the angular misalignment will exist, such as
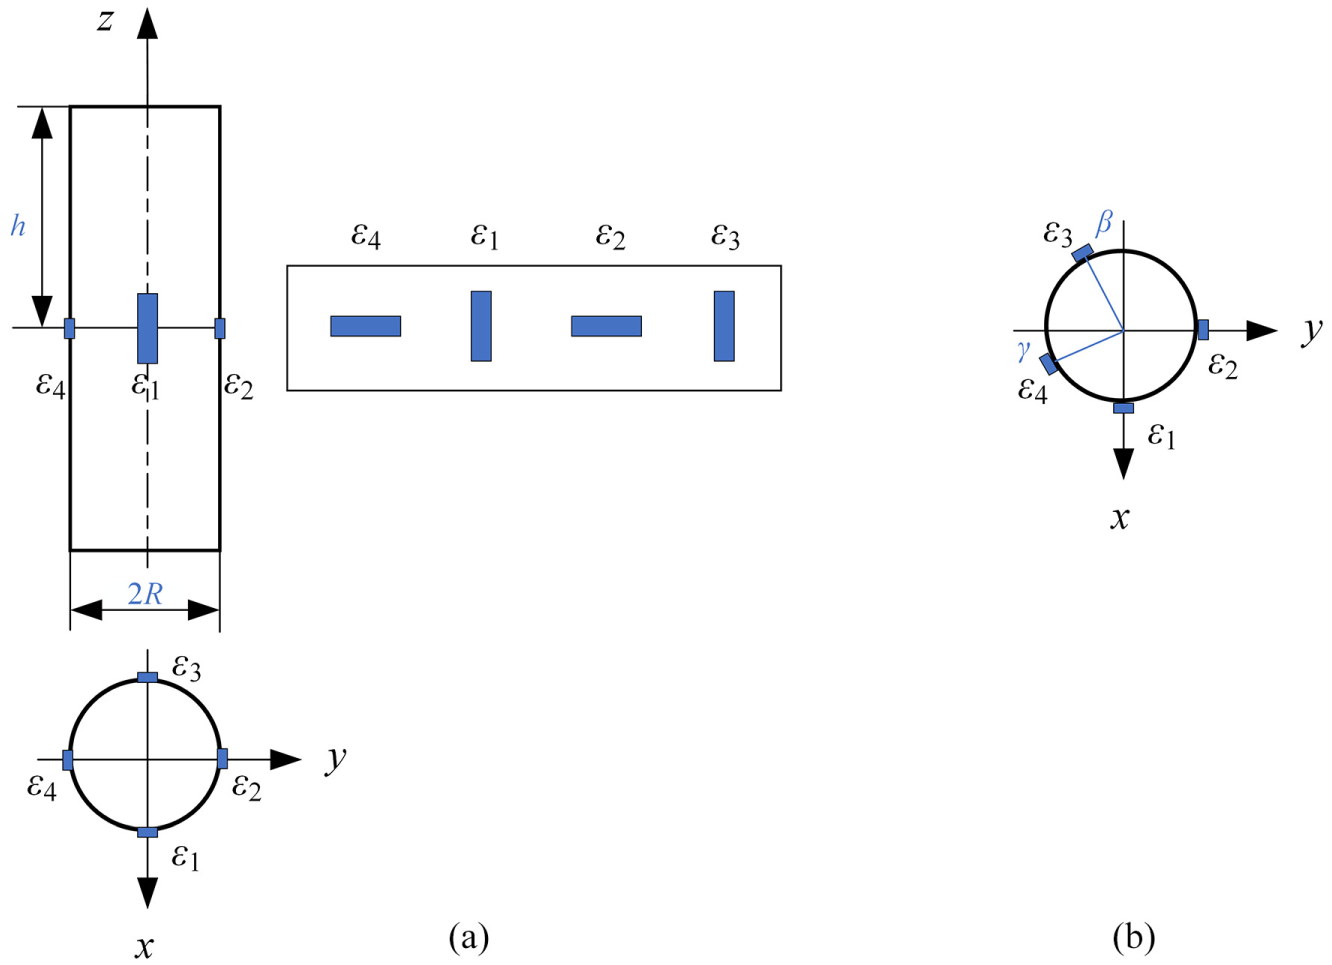
Schematic diagram of the strain gauges attached to the elastic element: (a) strain gauge distribution and (b) strain gauges attached with angular misalignment.
With the knowledge of solid mechanics, 19 the strains of the strain gauges can be calculated by
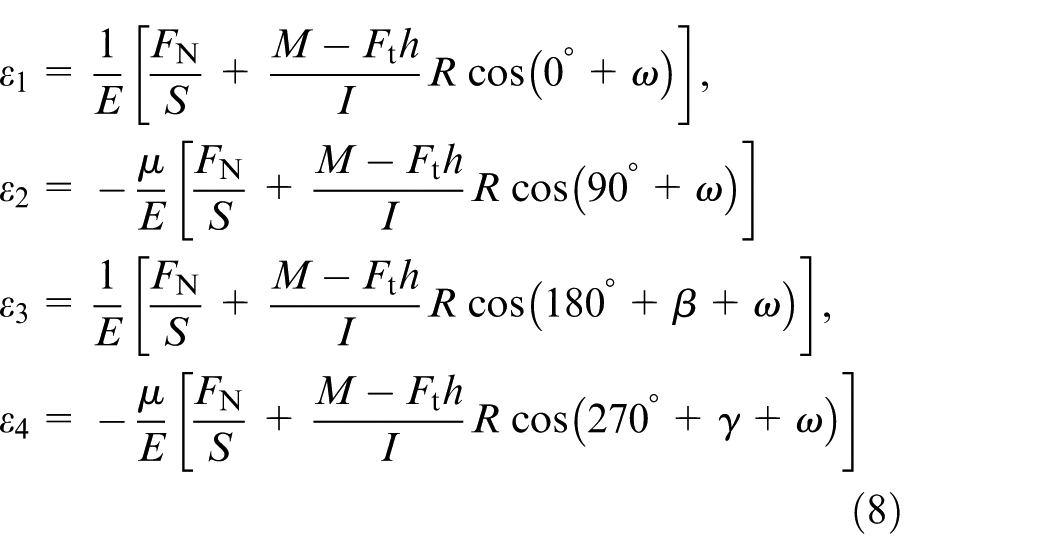
where S is the section area of the elastic element,
From the Wheatstone bridge circuit, as shown in Figure 6, the output
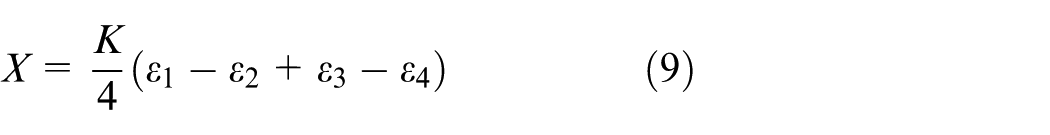
where K is the sensitivity coefficient.
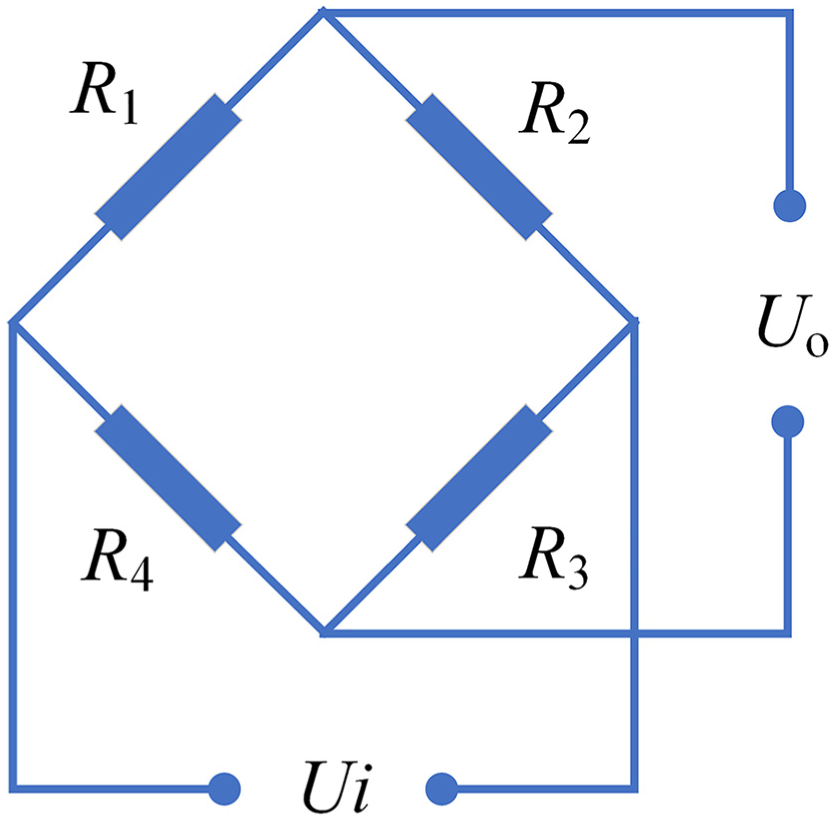
Wheatstone bridge circuit.
Substituting equation (8) into equation (9), we obtain
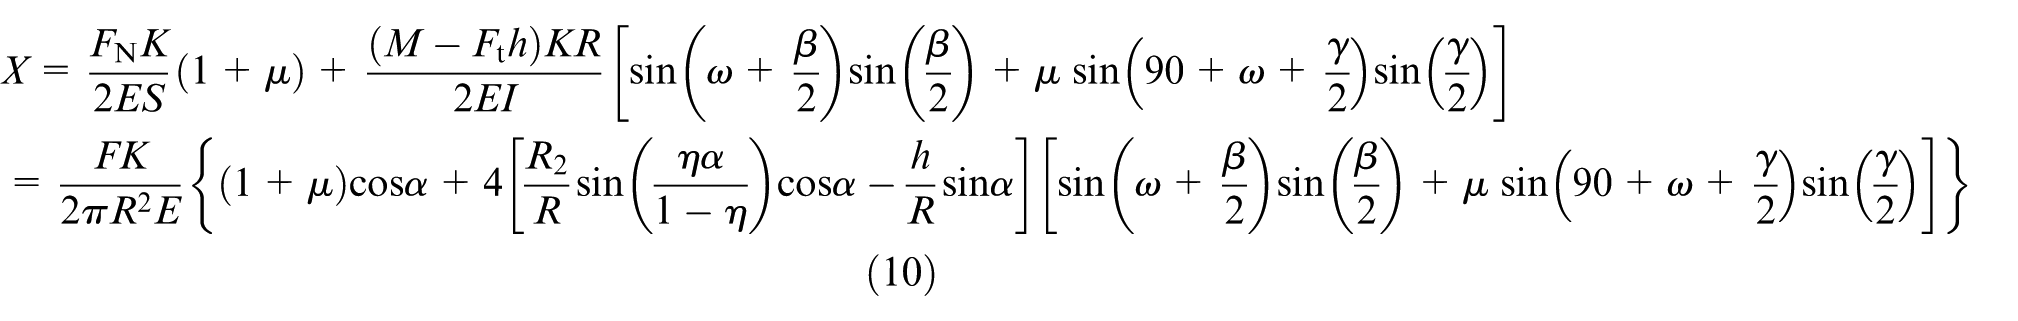
Define a geometrical factor
If the transducer is measured in several uniformly distributed positions over 360°, such as 0°, 120°, and 240°, the outputs,
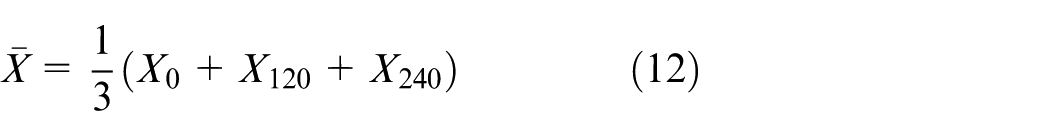
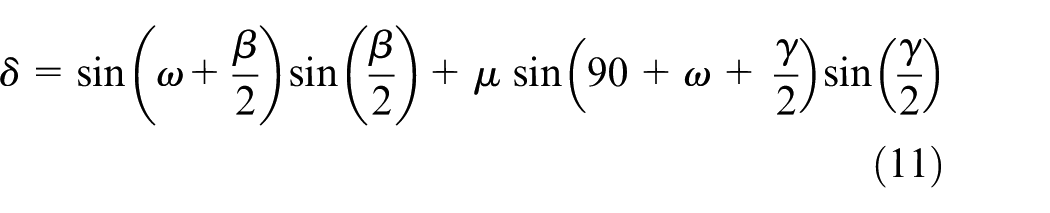
In formula (12), the geometrical factor
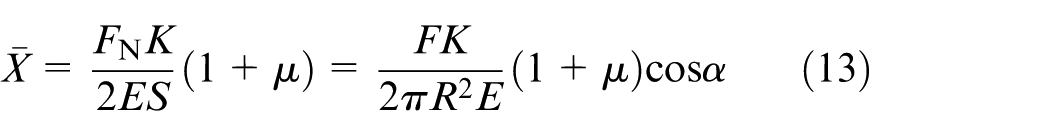
From equation (13), it is verified that the average output is not sensitive to the additional moment when the column-type force transducer is calibrated in several uniformly distributed positions.
If the force, F, is applied to the axis of the force transducer, in which case
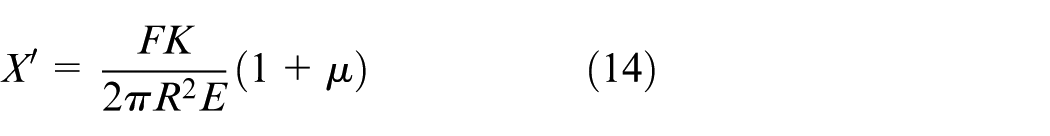
The relative indication error of the force transducer,
Substituting equations (10) and (14) into equation (15), we obtain
In this paper, the effects of the spherical radiuses of the ball and cup on the indication error are investigated.
The contact stress
According to the contact mechanics, 19 the contact stress of the load pad is calculated by the following equation
where
The radius of the contact area,
Experiment
Figure 7 shows the experimental setup, which consists a column-type force transducer with a capacity of 300 kN, a load pad, a wedge-shape platen, and a 300-kN dead weight force standard machine (DWFSM) with a relative expanded uncertainty of 0.005% (k = 2). A load pad was fixed on the 300-kN column-type force transducer. The transducer was ground to make the top and bottom planes parallel. A wedge-shaped platen was placed under the transducer. A DMP41 (made by HBM, Germany) was used as the amplifier and indicator of the force transducer.
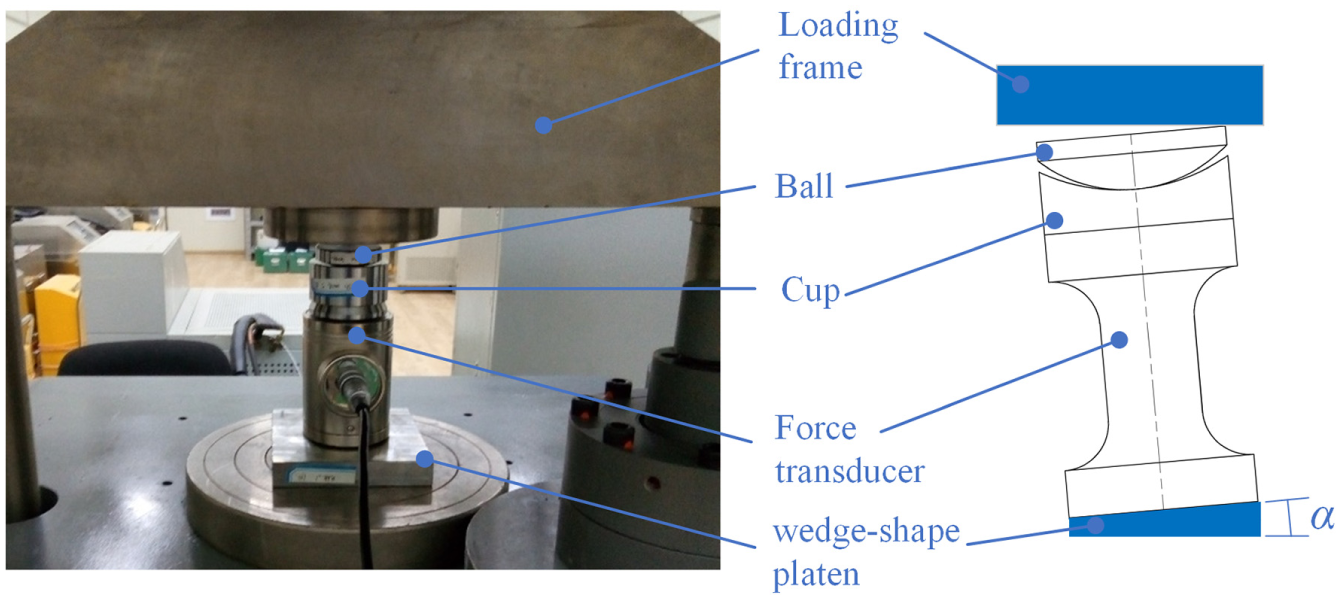
Experiment setup.
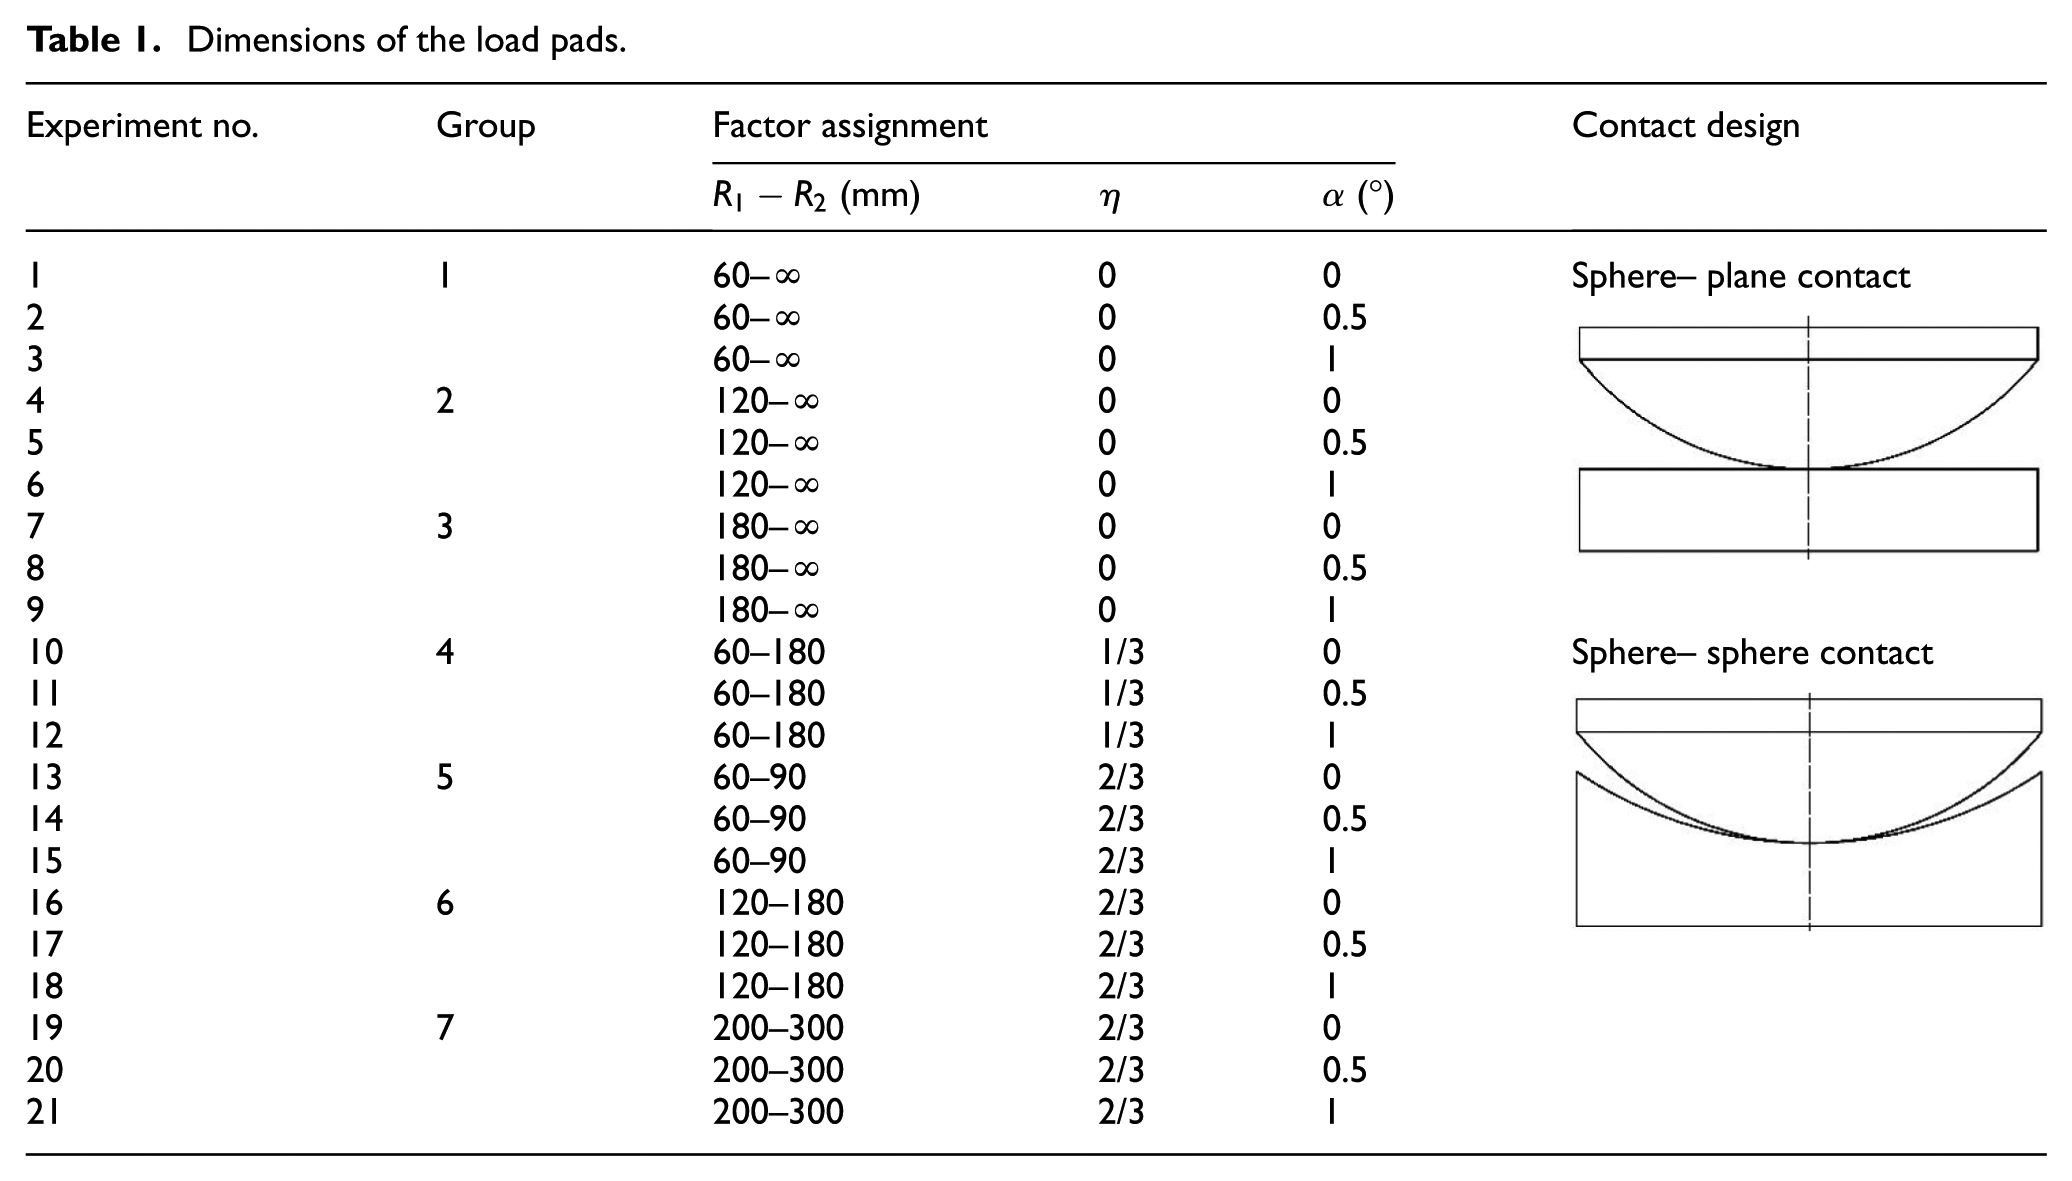
Seven load pads, were designed with various dimensions and numbered by group, as shown in Table 1 and Figure 8, to investigate the effect of the load pad shapes on the output of column-type transducer. The load pads were made from the same material (100Gr6), with the same heat treatment. The material with high strength and hardness was commonly used to manufacture bearings. According to the International Organization for Standardization (ISO) 376:2011, 20 the hardness of the load pads was controlled in the range of 45–50 HRC (Rockwell hardness). The machining errors of the load pads were smaller than 0.1%.
Dimensions of the load pads.
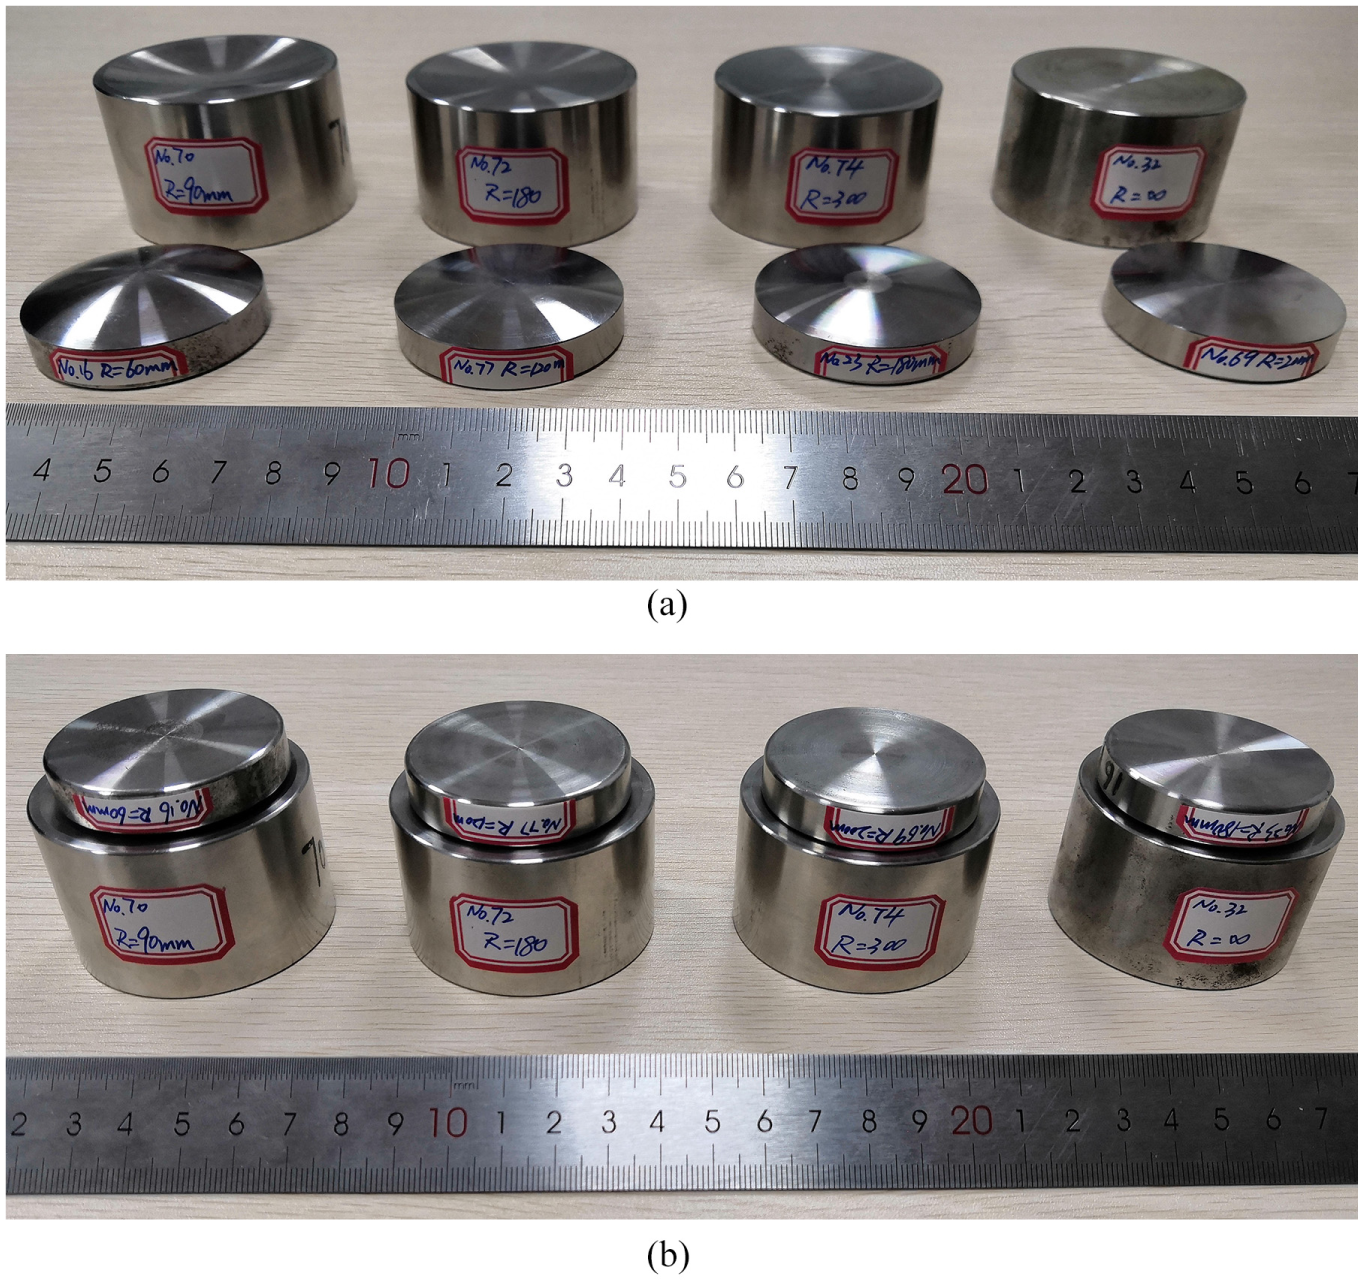
The photograph of the load pads: (a) before being assembled and (b) after being assembled.
As shown in Table 1, 21 experimental setups, with various load pads and a wedge-shaped platen, were measured according to the ISO 376:2011 20 separately. Two series of increasing force with five uniformly distributed force steps were applied to the transducer after three times preloads in the first load position. And then, the force transducer and the load pad were rotated by 120° around the axis of the transducer. The wedge-shaped platen was fixed always in the same position. After one-time preload, one series of increasing and decreasing force with the same force steps was loaded to the transducer. Finally, the same measurements, which were the same as those in the second loading position, were carried out in the third loading position after rotating the load pad and the transducer by 120°.
The indication error of the experiment was calculated by
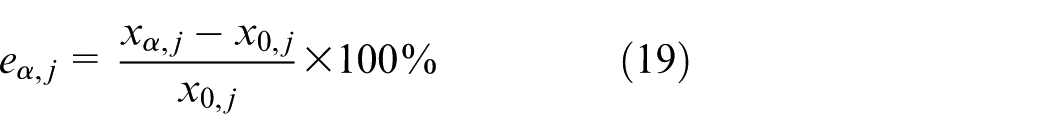
where
The indication error of the transducer under the rated load, which was measured with a relatively lower expanded uncertainty, was used in the following discussion.
Results and discussion
Sphere–plane contact
In the particular case of
The scatter plot in Figure 9 shows the experiment results of the indication error of the transducer measured with the load pads of Groups 1, 2, and 3, respectively. It is obvious that larger spherical radius of the ball,
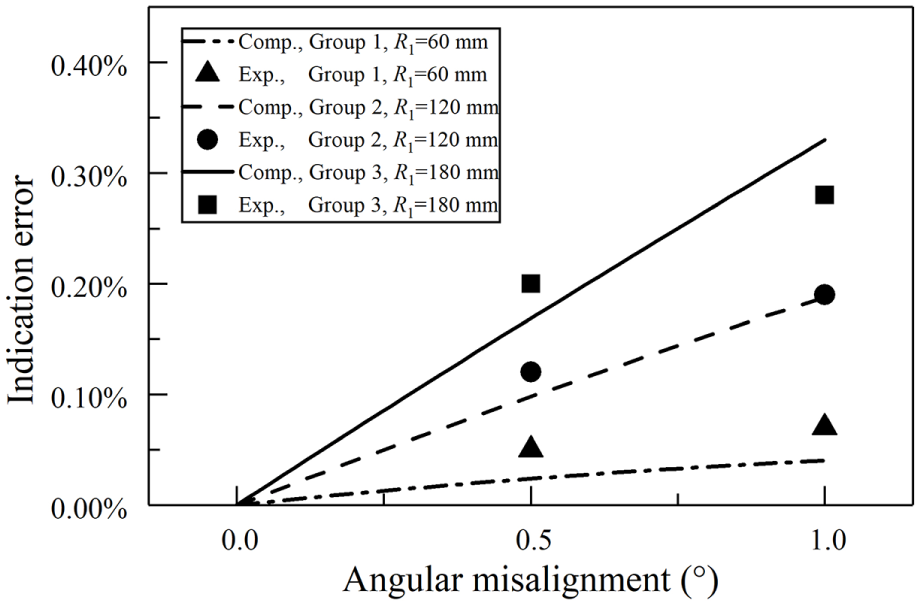
Comparison of the indication errors from the experiment (Exp.) with the theoretical computation (Comp.). The load pads of Groups 1, 2, and 3, which were fixed on the 300-kN force transducer, were tested separately using the wedge-shaped platen with the angular misalignment of 0.5° and 1° in the first load position. The indication error was calculated using equation (16) with the parameters of the 300-kN force transducer in the experiment that R = 19 mm, h = 37 mm,
The theoretical computation of the indication errors plotted according to equation (16) with
For the further investigation, the indication error with various misalignments,
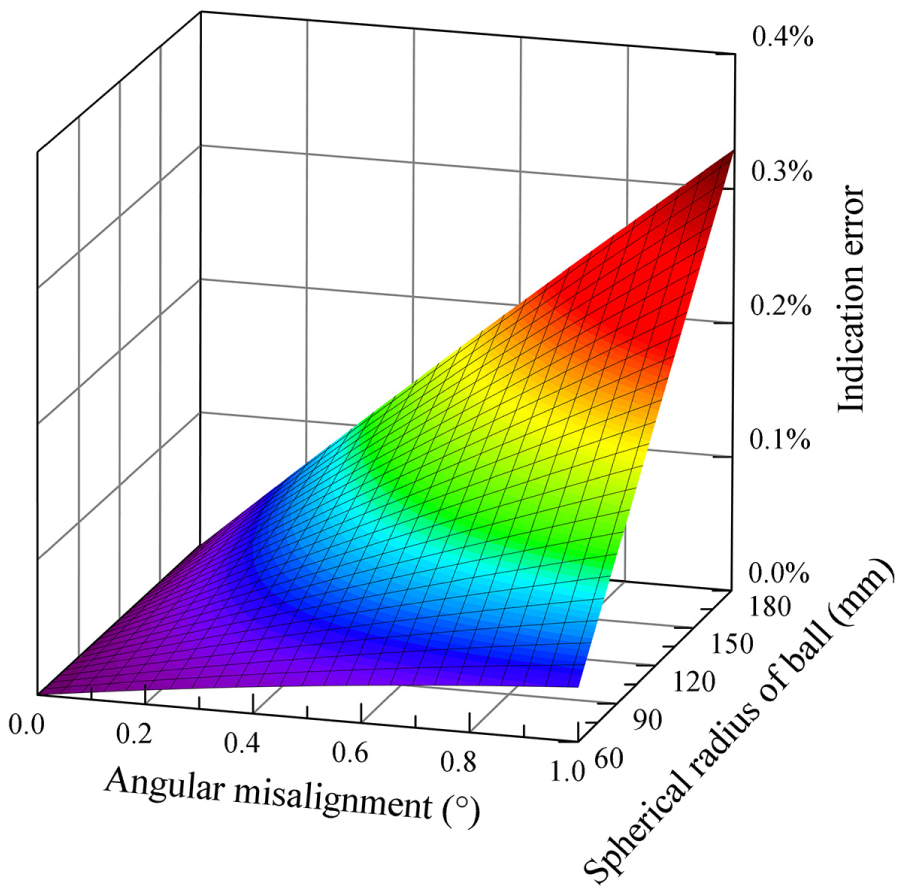
The indication error plotted using equation (16) with the parameters of the 300-kN force transducer in the experiment that R = 19 mm, h = 37 mm,
When the transducer was measured with a large angular misalignment, the contact point between the sphere and the plane could move farther away from the original contact point. In this case, a large eccentricity of the load was induced, and a large moment was introduced to the force transducer, which caused a large indication error.
In summary, it was important to enhance the stiffness of the upper platen of the BUS to eliminate the angular misalignment.
Similar experiment results were also received when the transducer was tested on the wedge-shaped platen with an angular misalignment of 0.5° in the other two loading positions. As shown in Figure 11, the indication error of the load pad with
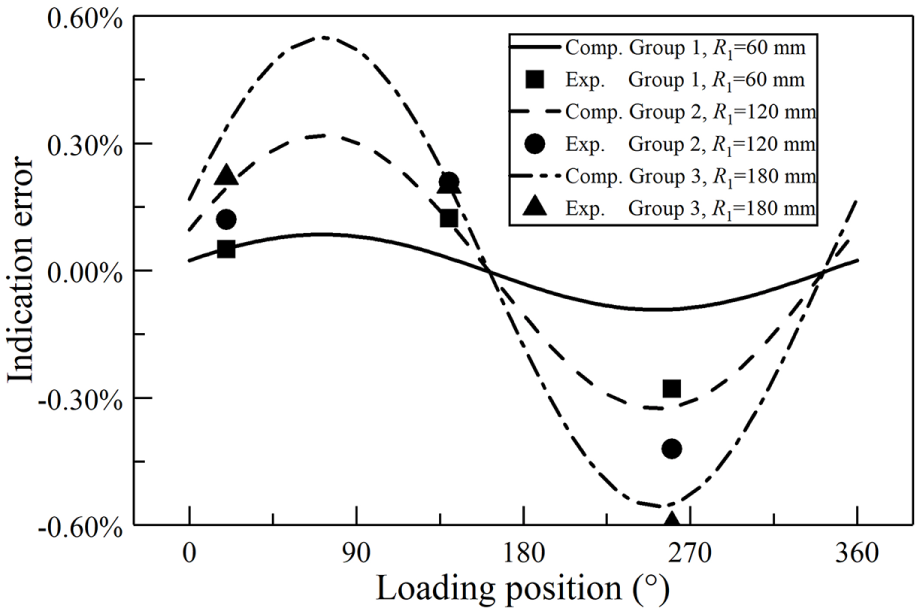
Comparison of the indication errors from the experiment (Exp.) with the theoretical computation (Comp.). The load pads of Groups 1, 2, and 3, which were fixed on the 300-kN force transducer, were tested separately using the wedge-shaped platen with the angular misalignment of 0.5°. The indication error was calculated using equation (16) with the parameters of the 300-kN force transducer in the experiment that R = 19 mm, h = 37 mm,
Using equation (16), the theoretical computation curves of the indication errors of Group 1, 2, and 3 were plotted with the loading position ranging from 0° to 360°, as shown in Figure 11. The curves were characterized by a sinusoid with the change of the loading position, which is similar to the results by Kang and Hong. 21 The phase positions of the curves were not dependent on the spherical radius of the ball. All the peaks and troughs of the three curves were located on 75° and 255°. The indication error equals 0 in the loading positions of 165° and 345°. The deviation between the peak and the trough of the sinusoid was the so-called ‘position error’ of the force transducer.
Because of the housing of the force transducer, it was hard to observe the exact locations of the strain gauges attached on elastic element. In this case, the coordination system in Figure 4 and the loading positions,
It was obvious that the amplitudes of the indication error sinusoids in Figure 11 were related to
Figure 12 shows the indication error surface of the force transducer using the load pad with
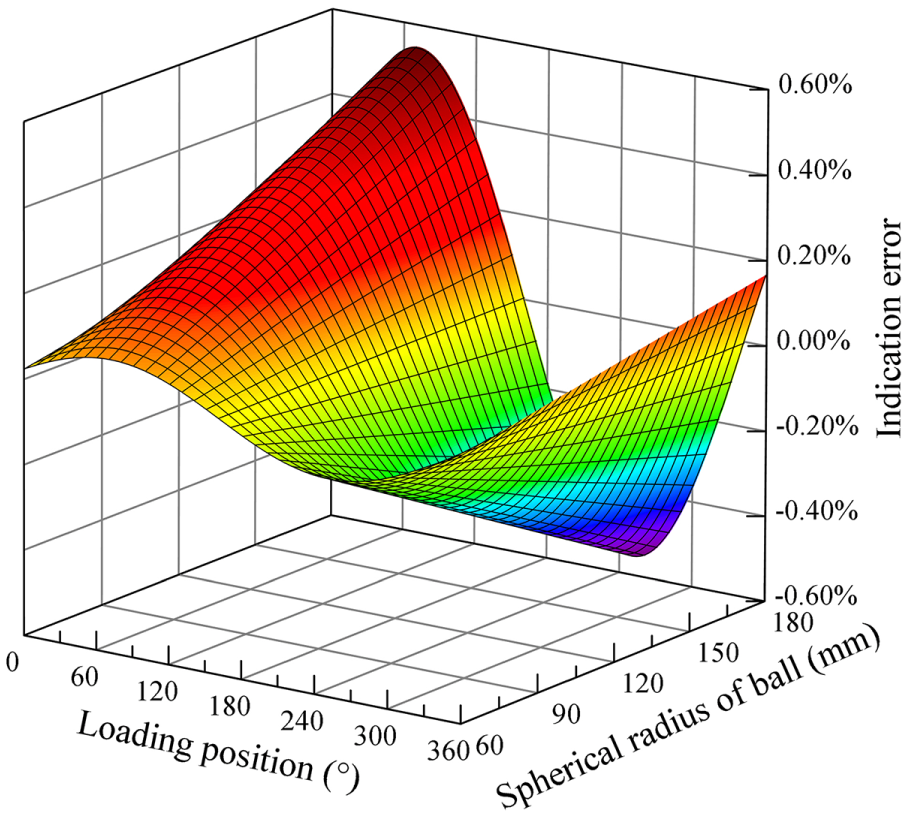
The indication error plotted using equation (16) with the parameters of the 300-kN force transducer in the experiment that R = 19 mm, h = 37 mm,
With the same misalignment,
The spherical radius of the ball had a significant effect on the indication error. It should not be too large when this type of load pad was designed.
Sphere–sphere contact
Effect of spherical radius ratio
The indication error of the force transducer tested using the load pads of Group 1, 4, and 5 with the spherical radius ratios of 0, 1/3, and 2/3 were compared and discussed.
Figure 13 shows that the indication error increased with the increment of the ratio when the load pads were tested using the same wedge-shaped platen with an angular misalignment of 0.5° or 1°. And when the angular misalignment increased, all the indication error increased. It is easy to find that the increase rate was related to the spherical radius ratio. The larger spherical radius ratio resulted in the quicker increase of the indication error. In Figure 13, the indication error of
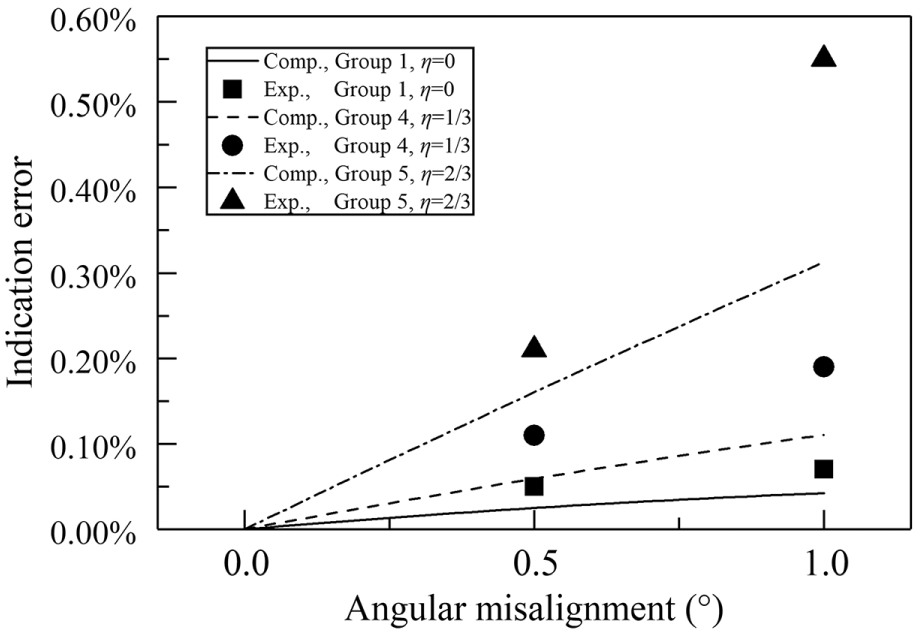
Comparison of indication error of the transducer from experiment (Exp.) with the theoretical computation (Comp.) measured in the first loading position with the angular misalignments of 0.5° and 1°, using the load pads of Groups 1, 4, and 5 in Table 1. The indication error was calculated using equation (16) with the parameters of the 300-kN force transducer in the experiment that R = 19 mm, h = 37 mm,
To deeply understand the effect of the ratio, the indication error surface was plotted according to equation (16) with
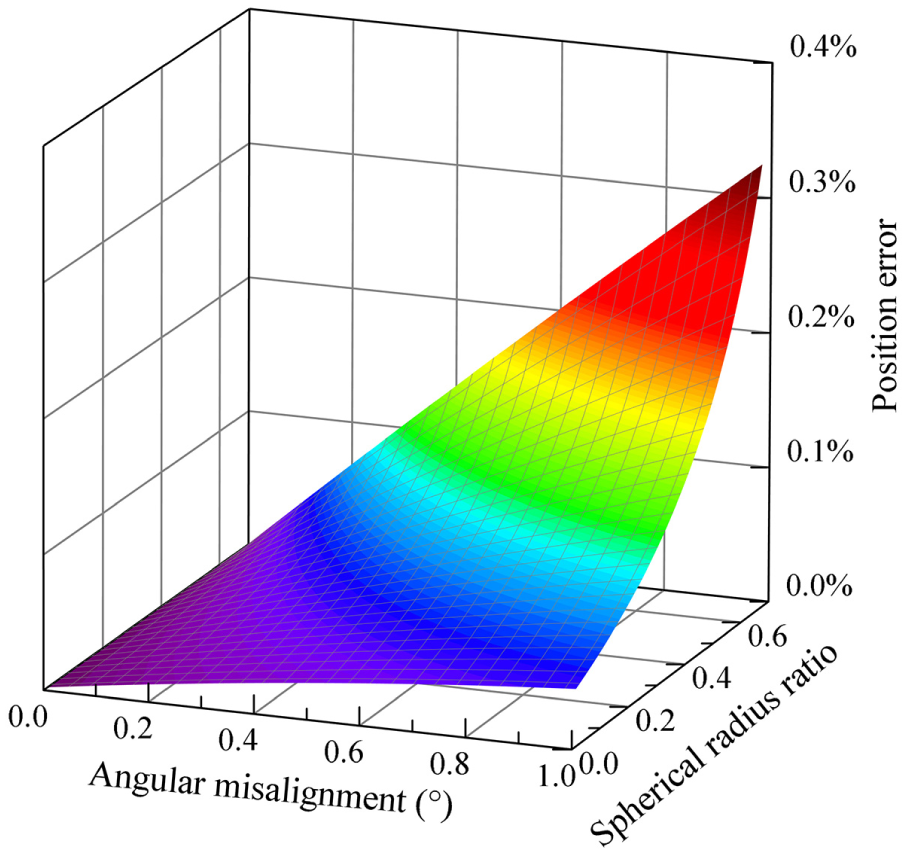
The indication error plotted using equation (16) with the parameters of the 300-kN force transducer in the experiment that R = 19 mm, h = 37 mm,
The indication errors of the force transducer tested on a 0.5° wedge-shaped platen using the three load pads in three different load positions are shown in Figure 15. It obviously shows that a large ratio causes a large error no matter in which position the transducer was loaded.
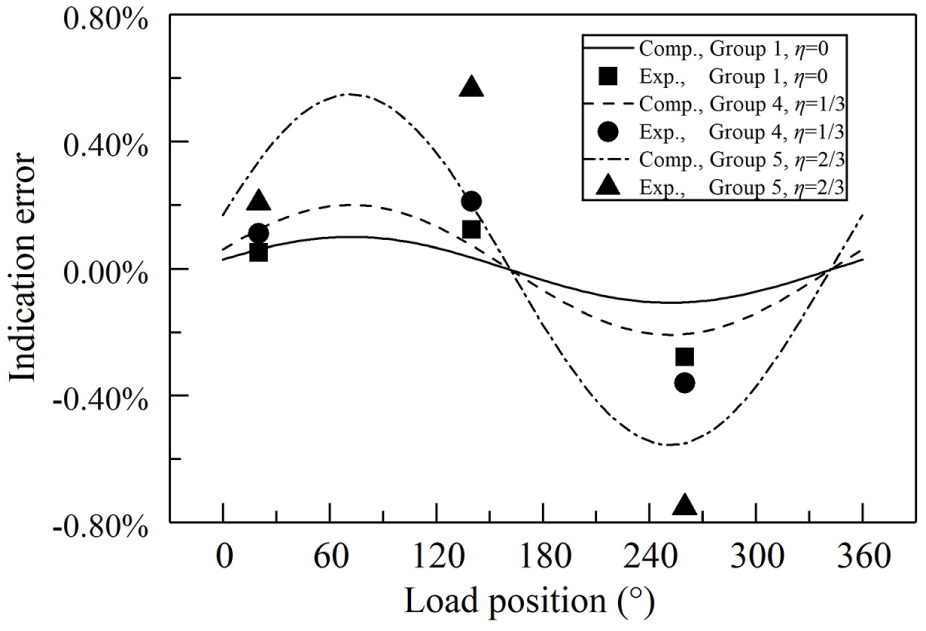
Comparison of the indication error of the transducer from experiment (Exp.) with the theoretical computation (Comp.) measured in various loading positions with an angular misalignment of 0.5°, using the load pads of Groups 1, 4, and 5 in Table 1. The indication error was calculated using equation (16) with the parameters of the 300-kN force transducer in the experiment that R = 19 mm, h = 37 mm,
The three sinusoids in Figure 15 were plotted using equation (16). The theoretical computation presented similar results as the experiment. The ratio had a significant effect on the amplitude. Large ratio caused a larger indication error and position error. In addition, all the curves reached the same peaks and troughs in 75° and 255°, respectively, as the same with the curves in Figure 11.
The surface in Figure 16 presents the indication error of the force transducer using the load pad with the ratio in the range of 0–0.66 loaded in any position. The biggest error existed when
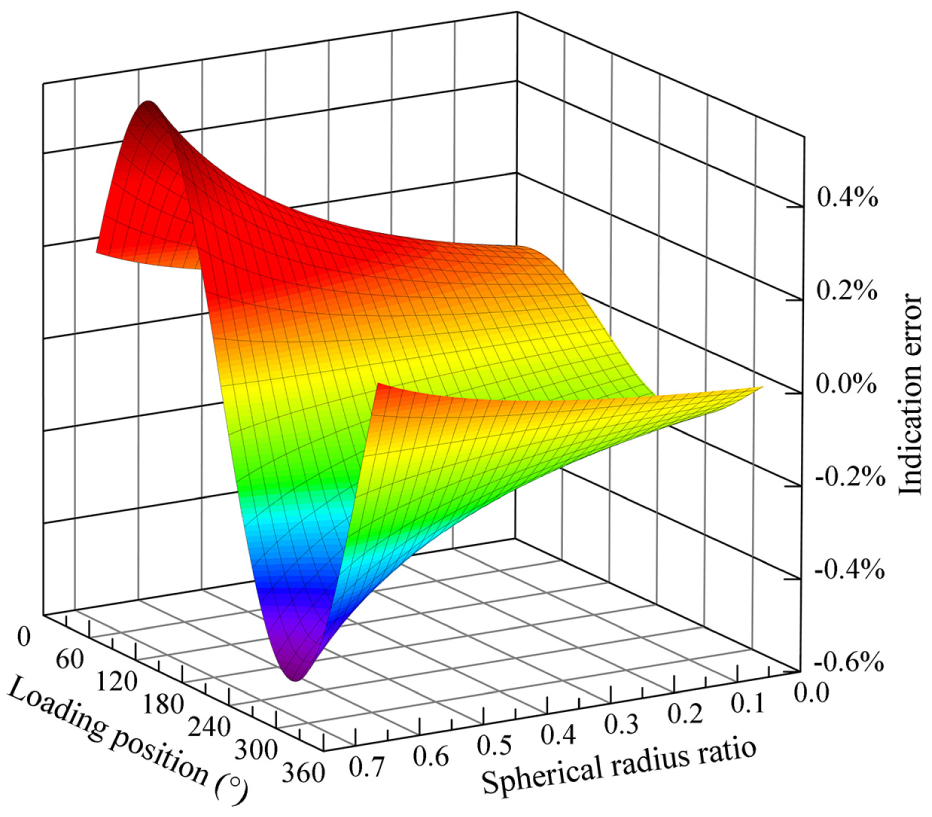
The indication error plotted using equation (16) with the parameters of the 300-kN force transducer in the experiment that R = 19 mm, h = 37 mm,
In summary, the spherical radius ratio should not be larger than 0.2 in the sphere–sphere contact design load pads.
Effect of the spherical radius with the same radius ratio
The indication error of the force transducer tested using the load pads of Group 5, 6, and 7, of which the spherical radius ratios were 2/3, with the spherical ball radius of 60, 120, and 200 mm were compared and discussed.
As shown in Figure 17, the experiment results presented that the indication error increased as the spherical radius increased when the load pads were tested with the same spherical radius ratio. The indication errors increased as
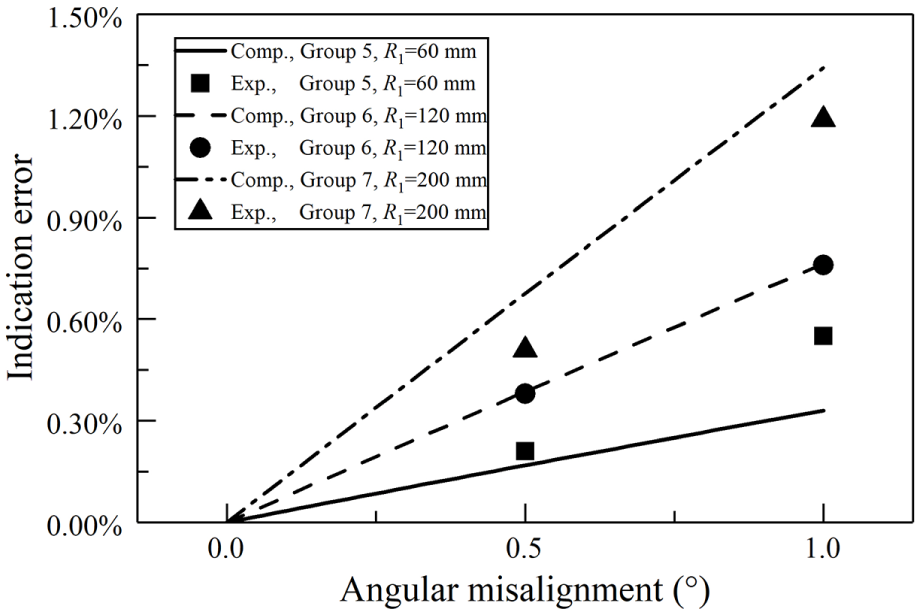
Comparison of the indication error of the transducer from experiment (Exp.) with the theoretical computation (Comp.) measured in the first loading position with the angular misalignments of 0.5° and 1°, using the load pads of Groups 5, 6, and 7 in Table 1. The indication error was calculated using equation (16) with the parameters of the 300-kN force transducer in the experiment that R = 19 mm, h = 37 mm,
The indication error of the transducer tested using the load pad with the biggest radius of 200 mm increased by 0.68%, while the one with 120 mm increased by 0.38% and the one with 60 mm increased by 0.34%. It is possible to conclude that the large spherical radius is the main influencial factor of the large indication error. The phenomenon was verified by the experiment results in Figure 17.
Figure 18 shows the indication error surface of the transducer using the load pad with the ratio equal to 2/3 and the radius in the range from 60 to 200 mm. Being similar to the surface in Figure 10, with the increment of the radius, the indication error increased slowly when
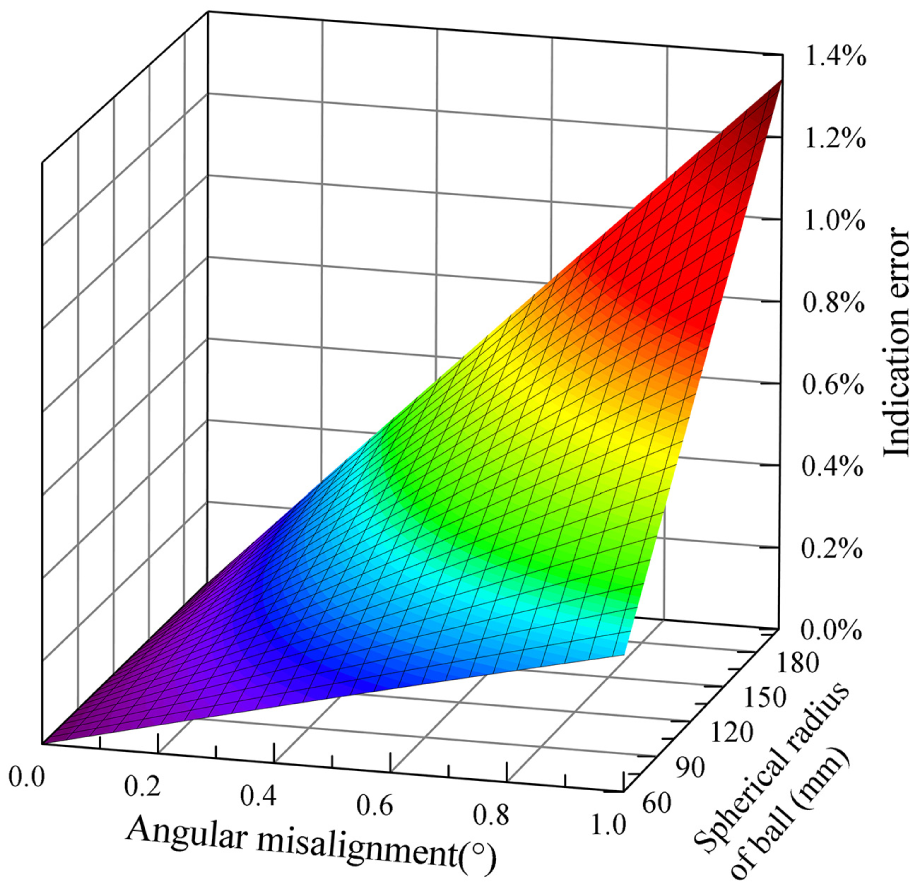
The indication error plotted using equation (16) with the parameters of the 300-kN force transducer in the experiment that R = 19 mm, h = 37 mm,
As shown Figure 19, the experiment results of the indication errors of the transducer tested using the three load pads with the same radius ratio indicated that large radius was an important factor for the increment of the indication error wherever the load applied to the transducer. The curves plotted using equation (16) and the experiment results had a good agreement. The large radius caused the big amplitudes of the indication error sinusoid, which also was verified by the indication error surface in Figure 20. It was suggested that big radius should be avoided when the ratio was large, such as 2/3 in this study.
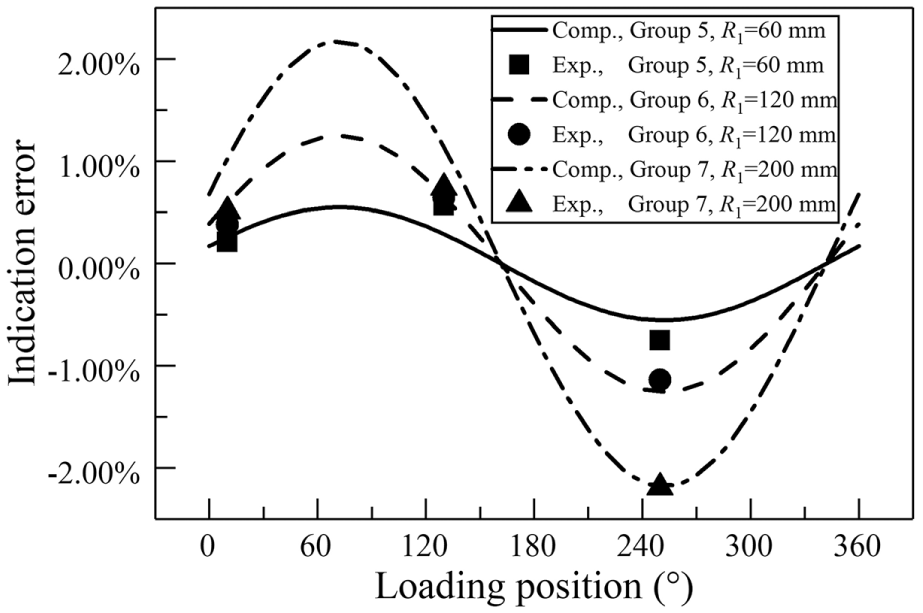
Comparison of the indication error of the transducer from experiment (Exp.) with the theoretical computation (Comp.) measured in various loading positions with an angular misalignment of 0.5°, using the load pads of Groups 5, 6, and 7 in Table 1. The indication error was calculated using equation (16) with the parameters of the 300-kN force transducer in the experiment that R = 19 mm, h = 37 mm,
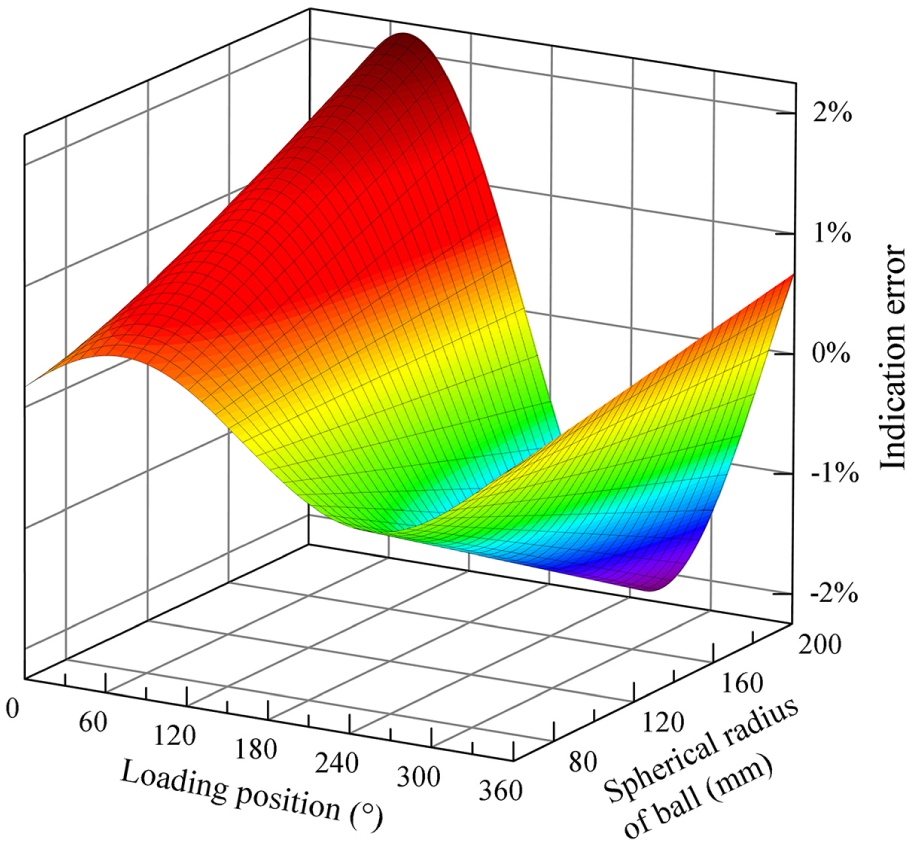
The indication error plotted using equation (16) with the parameters of the 300-kN force transducer in the experiment that R = 19 mm, h = 37 mm,
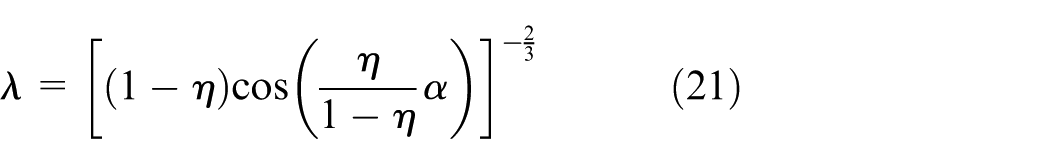
Comparison of the contact stress
From the above analysis results, it is known that the spherical radius of the ball should be small enough to avoid large indication error. But a too small radius would induce large contact stress, which caused the plastic deformation and failure of the load pad. To evaluate the contact stresses of the load pads of the sphere–plane and the sphere–sphere contact designs, a contact stress ratio
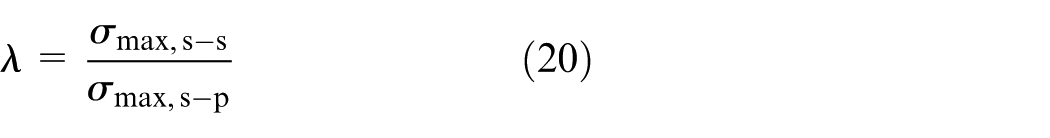
where
The surface of
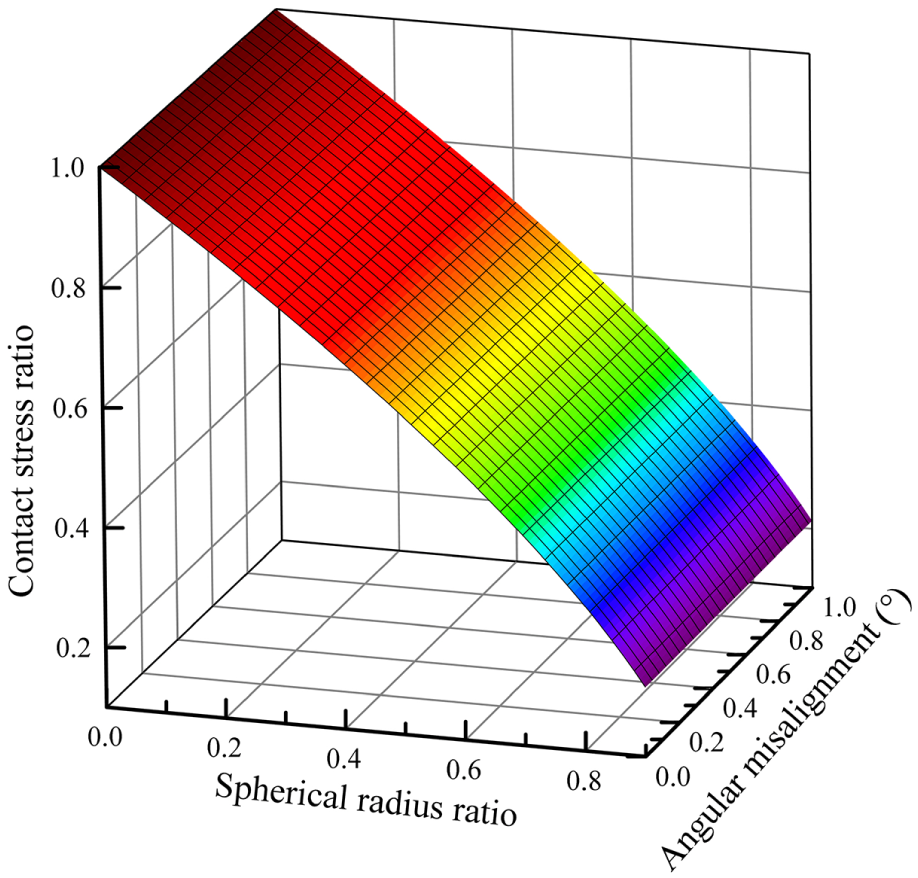
The contact stress ratio of the maximum contact stress of the sphere–sphere contact design to that of the sphere–plane contact design.
Conclusion
From the theoretical analysis and experiment results, it is revealed that the dimension of the spherical radius of the load pad had a significant effect on the indication error of the transducer.
Compared with the load pad of the sphere–sphere contact design, the load pad of the sphere–plane contact design would cause the smallest indication error and the largest contact stress with the same spherical radius of the ball. It is suggested that the spherical radius ratio of the ball to the cup could be fixed at about 0.2 to get a relatively small indication error and contact stress.
The spherical radius of the ball should be small under the permission of material strength to avoid producing large side force and additional moment and causing a large indication error.
In addition, it is important to enhance the stiffness of the upper platen of the BUS to eliminate the angular misalignment because big misalignment would enlarge the effect of the load pad size on the indication error of the transducer in the BUS.
Footnotes
Declaration of conflicting interests
The author(s) declared no potential conflicts of interest with respect to the research, authorship, and/or publication of this article.
Funding
The research has been funded from the research budget for a research project 2011YQ090009 of the Chinese major national scientific instrument and equipment development projects.