
Abstract
As an important support for test and control projects, sensor’s performance is directly related to the accuracy of the measurement. To fully analyze the sources of measurement uncertainty for a surface acoustic wave micro-pressure sensor, in this study the Monte Carlo method and Guide to the Expression of Uncertainty in Measurement to evaluate measurement uncertainty of sensors are used, the sensing experiment was conducted and the measurement addition model was established. We determined the source of measurement uncertainty for a surface acoustic wave micro-pressure sensor. The results show that the Monte Carlo method can obtain a more reliable and accurate inclusion interval in the measurement uncertainty evaluation of a surface acoustic wave micro-pressure sensor.
Introduction
With the continuous development and application of sensor technology, surface acoustic wave (SAW) micro-pressure sensors are widely used to measure important physical quantities, such as surface force, hydraulic pressure and object acceleration, which has strong anti-interference ability and high accuracy and resolution when performing pressure measurement.1,2 However, measurement uncertainty analysis of the sensor is not only a criterion for evaluating the quality of the measurement results, but also an important index that directly affects the above-mentioned various applications. 3 Measurement uncertainty is widely accepted as a quantitative indicator of the quality of measurement results, which the results including are complete, reliable and of practical value. 4 All measurement results inevitably have some uncertainty, and the availability and conformance of measurement data largely depend on the uncertainty. 5 Therefore, it is very important to improve the accuracy and reliability of the measurement data by evaluating the measurement uncertainty of a SAW micro-pressure sensor.
The measurement uncertainty analysis methods mainly include Guide to the Expression of Uncertainty in Measurement (GUM) and Monte Carlo method (MCM). GUM is the earliest recognized international standard in measurement uncertainty analysis methods, 6 which is generally applicable to all measurement fields. But MCM uses the random sampling of probability distributions for distributed propagation and its scope of application is more extensive than GUM. 7 Bernstein and Weckenmann 8 introduced the uncertainty analysis of a new optical multi-sensor measurement system, used GUM to test the uncertainty of four typical industrial environments and explored the potential of multi-sensor measurement methods. Shi et al.9,10 studied the uncertainty of the different design parameters in different microelectromechanical system (MEMS) pressure sensors with slit structure and analyzed the influence of phase drift and different slit sizes on performance, which provided a reference for the optimal design of sensors. Li et al. 11 summarized the application of MCM in the evaluation of sensor’s uncertainty and that MCM based on probability distribution propagation has higher applicability in the complex model. Chen and Chen 12 compared GUM and MCM for evaluating measurement uncertainty of perspiration measurement systems and there was no significant difference between the two methods. GUM and MCM are widely used in the above-mentioned various types of measurement uncertainty analysis. So it can be seen that these two methods have good applicability and high reliability in the field of measurement.
We have designed a delay line–type SAW micro-pressure sensor with passive wireless transmission function, good stability and high accuracy. 13 Based on previous research and experiments, this paper will use MCM and GUM to analyze the measurement uncertainty of the SAW micro-pressure sensor’s static characteristics through MATLAB software, compare the two methods and verify the reliability and accuracy of evaluation of the MCM and GUM, which can provide new guidance for measurement and evaluation in a SAW micro-pressure sensor.
Uncertainty evaluation methods
SAW micro-pressure sensor measurement
SAW devices mainly include filters, delay lines, oscillators and gyroscopes, in which delay lines are used in electronic devices, such as radar, communications, to delay electrical signals for a certain period of time. 14 Because the SAW delay line has the characteristics of simple structure, small size, high temperature stability and good consistency, the SAW micro-pressure sensor designed and manufactured chose the delay line as the basic structure. The basic structure is composed of a piezoelectric substrate and an interdigital transducer (IDT) disposed therein. The SAW signal propagates in a piezoelectric medium between two transducers. The basic structure of SAW delay line is shown in Figure 1. 15
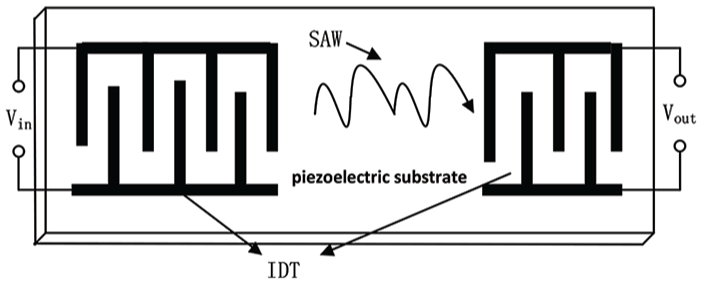
Delay line structure.
The SAW micro-pressure sensor is mainly composed of two IDTs, a LiNbO3 piezoelectric substrate, a metal base and wires, as shown in Figure 2(a), and the external structure of the metal is shown in Figure 2(b) which plays a protective role. The dimensions of the SAW micro-pressure sensor are shown in Table 1.
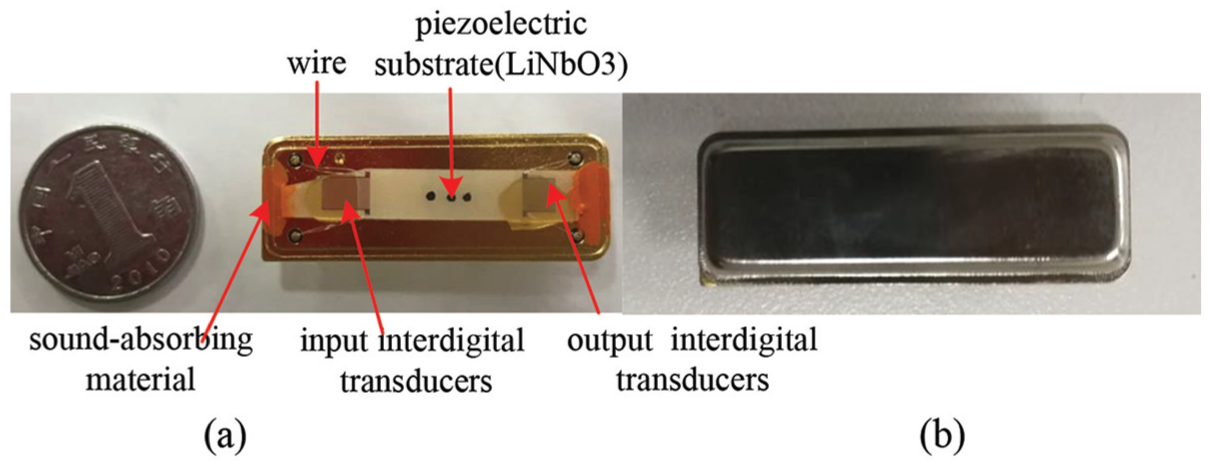
SAW micro-pressure sensor: (a) encapsulation of sensor and (b) outer cover of sensor.
Dimensions of the SAW micro-pressure sensor.
IDT: interdigital transducer.
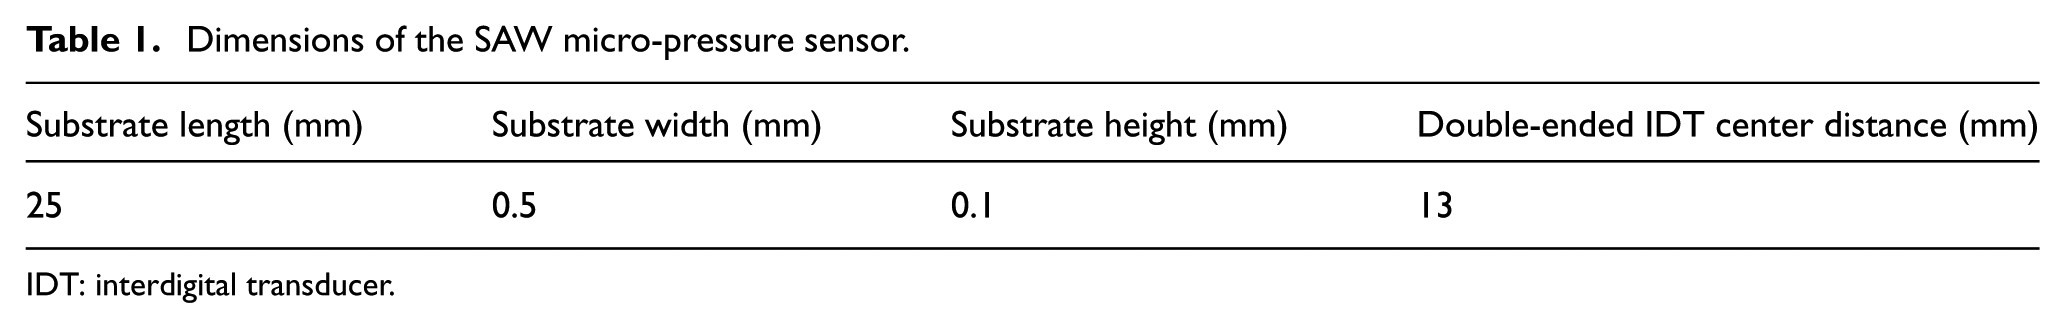
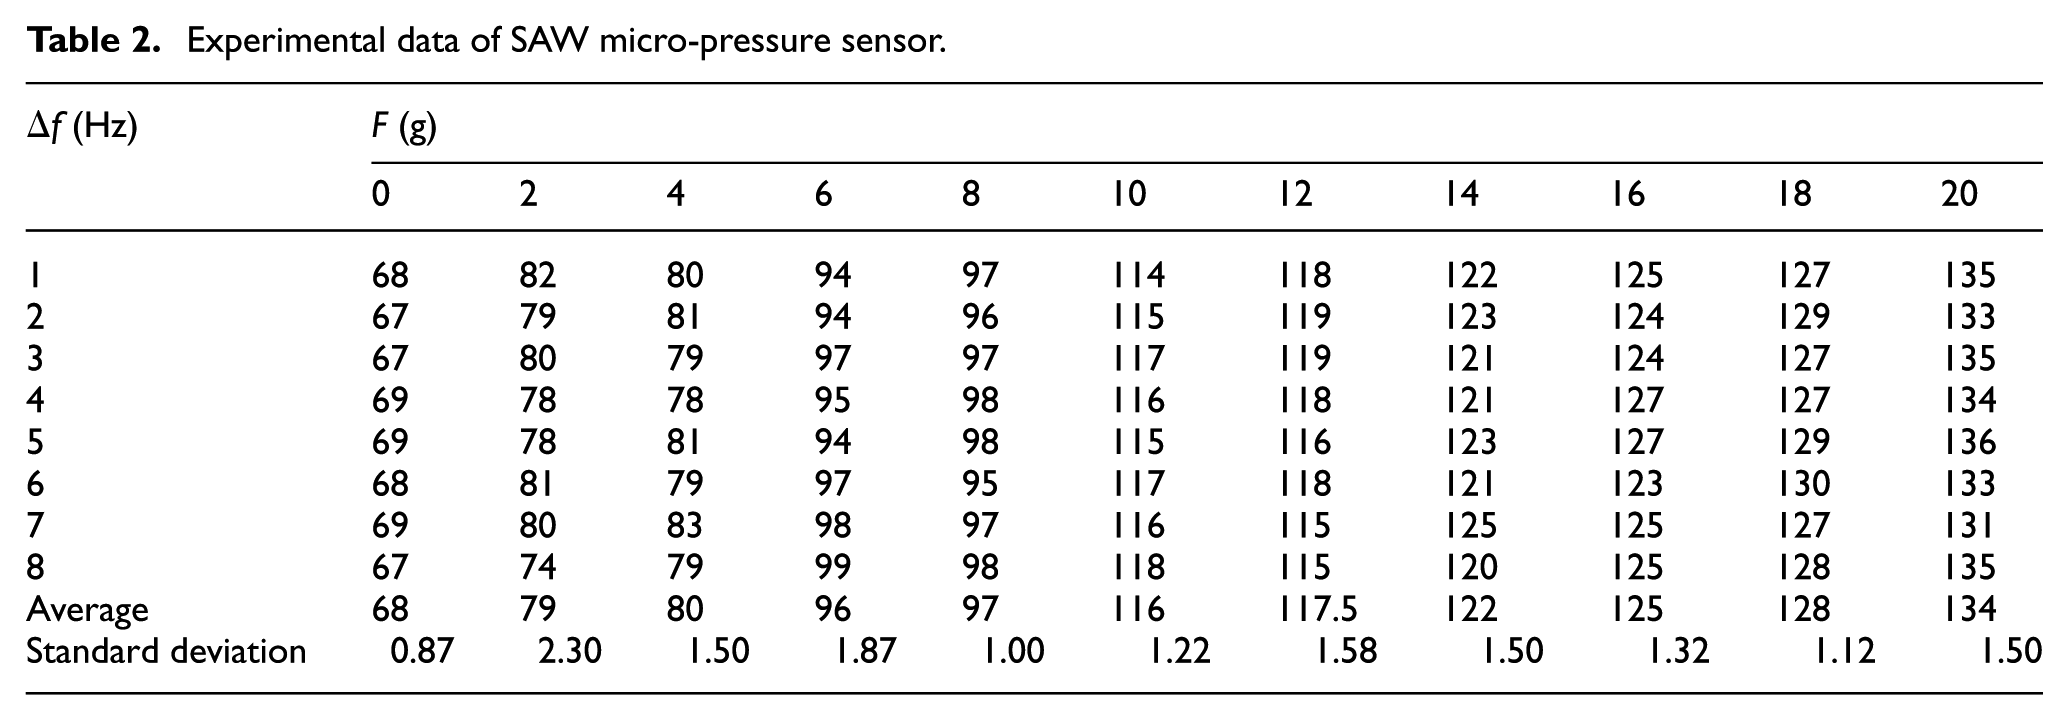
In our experiment, we measured the SAW micro-pressure sensor and connected it with the network analyzer, as shown in Figure 3. The weights of 0, 2, 4, 8 and 10 g are used as the size of the micro-force, and according to different micro-forces different weights are used in the center of the substrate to measure the frequency data. The frequency data measured by each different weight are recorded. The experimental measurement range is 0–20 g and the step size is 2. The working center frequency is 50 MHz. Because the frequency fluctuates during the measurement process, it is necessary to select 10 groups of data from averaging multiple sets of frequency data measured by the network analyzer under different micro-forces and then use the relative variables to calculate input and output, which can double the sensitivity in the differential output format. Eight groups are selected from the frequency difference measured several times under different micro-forces and then averaged. The data of frequency difference and pressure are shown in Table 2. F is the pressure and Δf is the frequency offset.
(a) The network analyzer, (b) SAW micro-pressure sensor with base and (c) the test result measured by the network analyzer.
Experimental data of SAW micro-pressure sensor.
Uncertainty sources and the measurement model
During the whole measurement process, the input and output characteristics can be divided into static and dynamic characteristics. The internal structural parameters of each type of sensor have their own characteristics. The factors that affect the measurement uncertainty are shown in Figure 4. 16
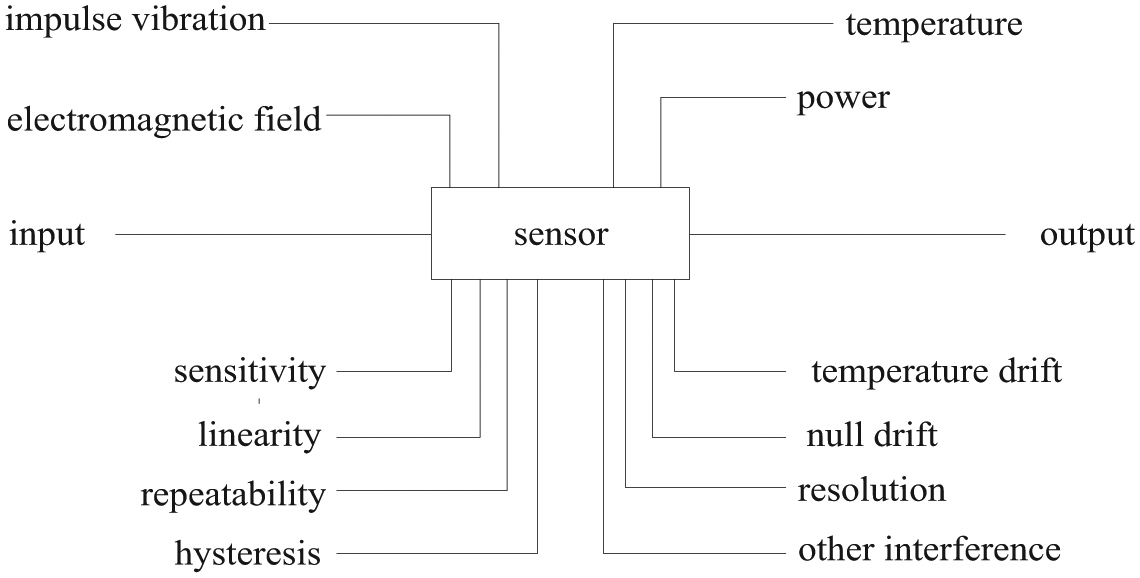
Uncertainty factors.
Based on the measurement results, this paper selects sensitivity, non-linearity and repeatability as the uncertain sources of the SAW micro-pressure sensor. The following three uncertain components are distributed independently and obey uniform distribution.
Non-linearity
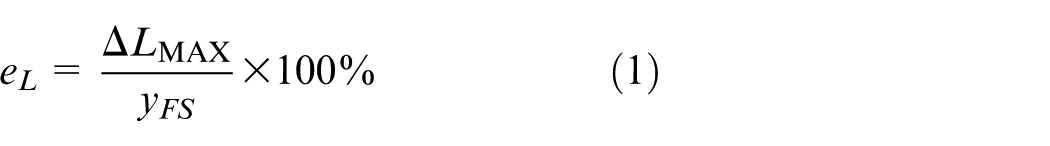
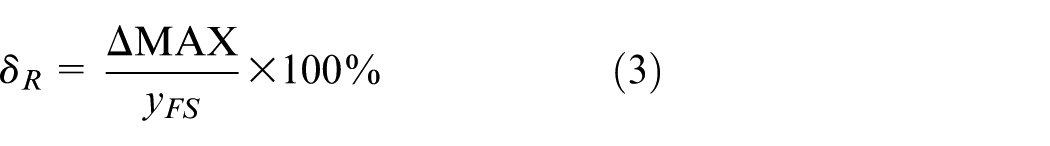
Non-linearity refers to the degree of inconsistency of the actual correlation curve and its fitting straight line between input and output. The process of selecting a fitted line is the process of linearization. The deviation between the actual curve and the theoretical straight line is the non-linearity error of the sensor, and the ratio of the maximum value to the output full-scale value is taken as the index for evaluating the linearity. The non-linearity is calculated as follows
where
Sensitivity
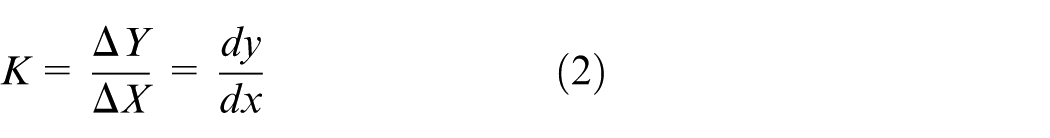
The sensitivity of the SAW sensor refers to the ratio of output change to input change when it reaches a steady state of operation. The sensitivity is calculated as follows
Repeatability
Repeatability refers to the inconsistency of the characteristic curve resulting from the continuous change of the input in the whole measurement range and the same direction under the same working conditions. The repeatability is calculated as follows
where
For the direct measurement of the SAW micro-pressure sensor, the factors affecting the uncertainty are mutually independent and random, so the synthetic uncertainty problem is transformed into solving the uncertainty problem of n independent random variables mutually. Assuming that the uncertain components of the SAW micro-pressure sensor are independent of each other, the mathematical model of the sensor’s measurement uncertainty can be established as

where
Results and discussion
Calculation of the uncertainty component
The SAW micro-pressure sensor has an input variable (micro-pressure) and an output variable (frequency). According to the empirical value measured by the SAW micro-pressure sensor, there is a linear relationship between the input and output values. Therefore, a linear regression mathematical model can be obtained by the linear regression analysis theory. The regression mathematical model includes the input pressure and frequency variation of the SAW micro-pressure sensor. Setting the experimental data samples
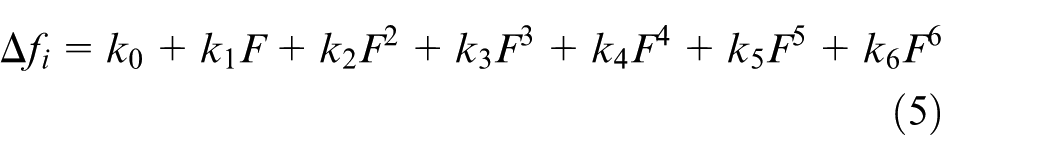
The regression coefficient is solved by the least-squares method. MATLAB is used to solve the model. The polyfit function is used for parameter estimation and fitting and the number of fittings is selected as 6, when establishing the model. MATLAB is used to write a program. The average values of the eight groups of data in Table 1 were fitted to obtain the polynomial curve of the pressure and frequency difference of the SAW micro-pressure sensor. As shown in Figure 5, the red hollow circle is the experimental result and the blue line segment is a polynomial curve.
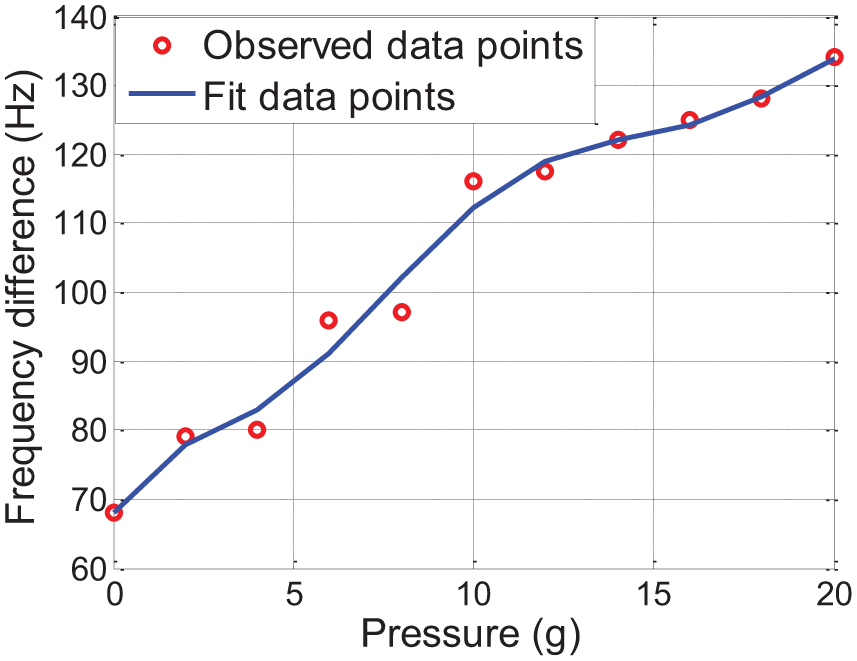
The relation between frequency and pressure of the SAW micro-pressure sensor.
From the fitting curve, the theoretical value of the measurement point can be obtained and the maximum linear deviation can be calculated. So the uncertainty component of non-linearity is calculated as
The average value in Table 1 is taken as the data sample

Therefore, the uncertainty component of sensitivity is
Measurement uncertainty by GUM
Using the GUM to synthesize the three uncertainty components, the synthetic measurement uncertainty is 17
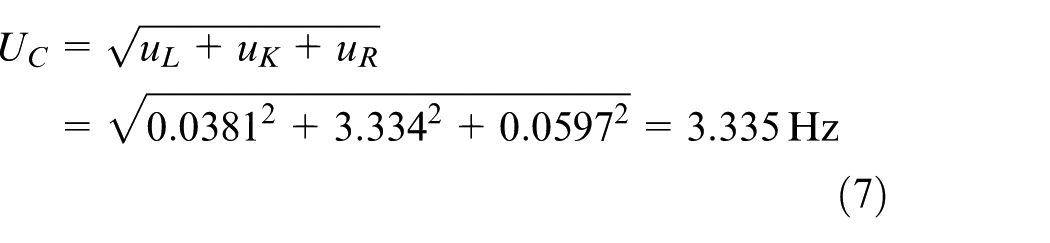
The extended uncertainty with a probability of 95% (k = 1.96) is

According to the propagation rule of uncertainty, the uncertainty of the synthetic standard evaluated by the GUM method is 3.335 and the value tolerance is set to 0.005. The factor is set to 1.96. After multiple comparison and simulations, the sample M takes 1,000,000 because the distribution result is more stable when the sample M is 10,000,000. MATLAB is used to write a program and the output of the probability density function graphic is drawn by GUM simulation, which is a normal distribution, as shown in Figure 7. The purple curve represents the normal distribution of the GUM output and the purple vertical line shows the 95% probability symmetrical inclusion interval of GUM. It turned out that the endpoints of the 95% probability symmetrical inclusion interval determined by GUM is approximately
Monte Carlo simulation
Compared with GUM which uses the linearized model to propagate the uncertainty, the MCM is a numerical method that achieves distributed propagation by repeated sampling. The steps of the MCM are shown in Figure 6. 18
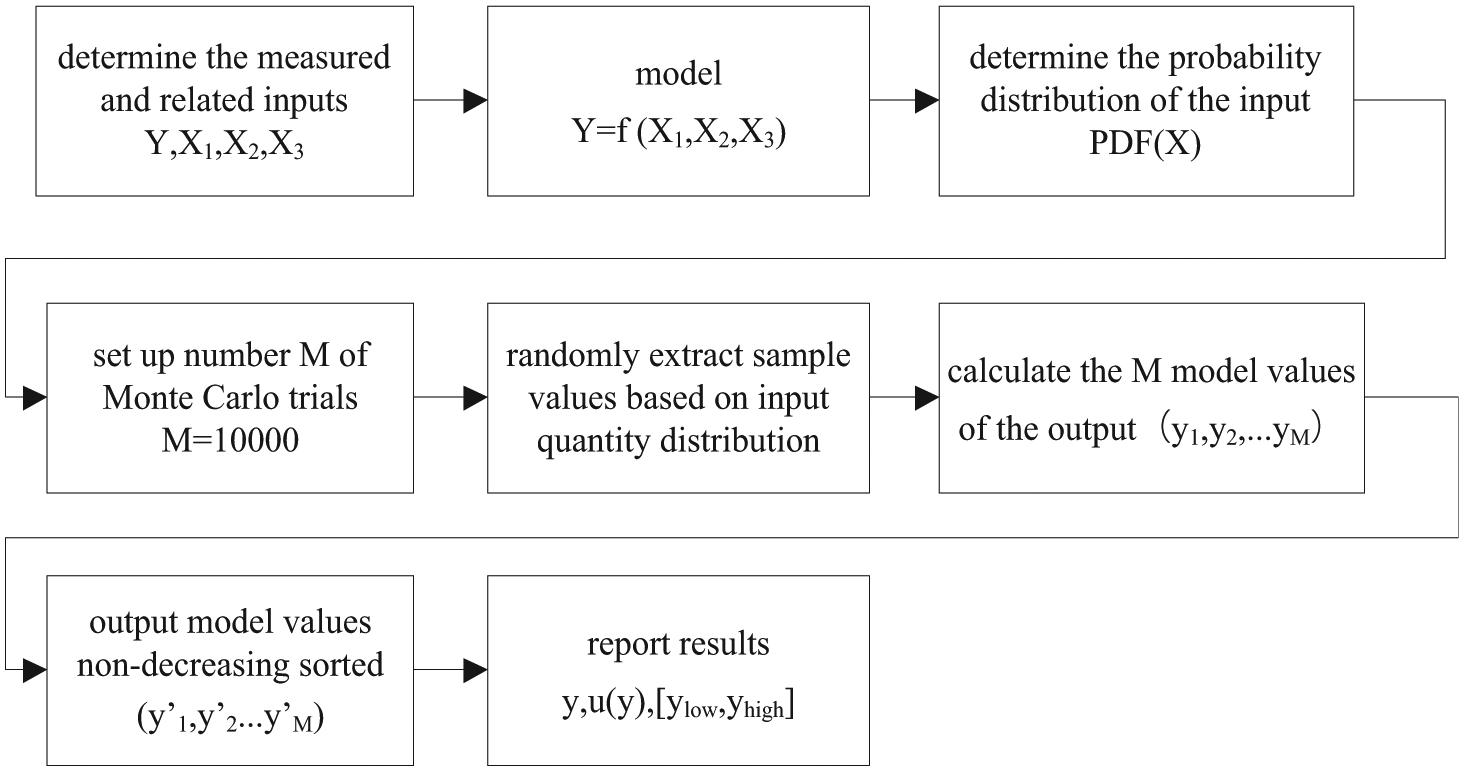
Steps of the MCM.
Assuming that the individual components of the SAW micro-pressure sensor are independent of each other, the mathematical model of measurement uncertainty of the sensor is established as

where
Based on their respective distributions, the compositional uncertainty is evaluated. MATLAB is used for simulation by MCM and the sample M takes 10,000. Through the rand function and unifrnd function, the output probability density is shown in Figure 7. The two vertical blue lines represent the shortest inclusion interval of the 95% probability by MCM. The result shows that the indication error is 0 and the standard deviation is 1.92. The endpoints of the 95% probability symmetrical inclusion interval determined are approximately

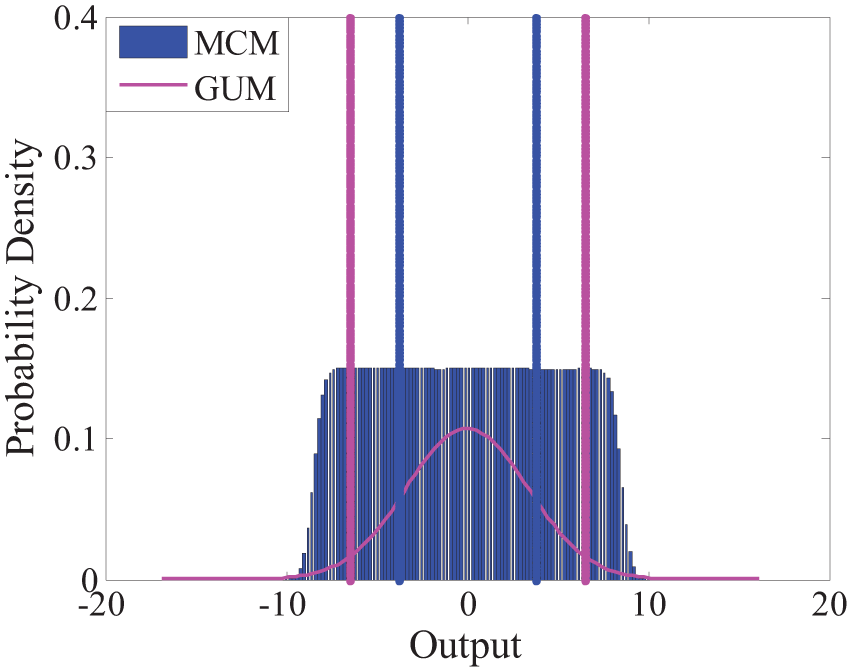
Probability density function by MCM and GUM (purple represents GUM and blue represents MCM).
From the comparison of the results of the two methods, the 95% probability symmetry inclusion interval determined by MCM can clearly display the distribution of the synthetic results under the premise of ensuring accuracy, and MCM can calculate the synthetic standard uncertainty. However, GUM only estimates the composition distribution based on the most influential components and then determines the synthesis result, which may cause the unreliability of the result. MCM has better universality.
Conclusion
This paper proposes the use of GUM and MCM, respectively, for the measurement uncertainty evaluation of the SAW micro-pressure sensor. The uncertainty components of the SAW micro-pressure sensor were calculated based on the least-squares method. The uncertainties were synthesized by GUM and MCM, respectively, and the 95% probability symmetrical inclusion interval was determined. The results show that MCM has higher reliability and universal applicability in the measurement uncertainty evaluation of the SAW micro-pressure sensor, which reasonably quantifies the quality of the measurement results, improves the reliability and accuracy of the measurement data and provides a new reference direction for better performance of the sensor and measurement uncertainty evaluation.
Footnotes
Declaration of conflicting interests
The author(s) declared no potential conflicts of interest with respect to the research, authorship and/or publication of this article.
Funding
The authors would like to express their gratitude to the National Natural Science Foundation of China (61803254) for the financial support provided for this work.