
Abstract
Background:
Detecting of human movements is an important task in various areas such as healthcare, fitness and eldercare. It is now possible to achieve this aim using mobile applications. These applications provide users, doctors and related persons a better understanding about daily physical activities. It can also lead to various useful habits by following the activities of the users in their daily life. In addition, dangerous actions such as the fall of elderly people or young children are identified and necessary precautions are taken as soon as possible. Classification of human motions with motion sensor data is among the current topics of study. Smart watches have these sensors built-in. Thus, it is possible to follow the activities of a user carrying only a smart watch.
Methods:
The purpose of this work is to detect human movements using smart watch sensor data and machine learning methods. The data are obtained from the accelerometer, gyroscope, step counter and heart rate sensors of the smart watch. The obtained data have been divided into 2 s windows and a data set containing 500 patterns for each class has been created for each class.
Results and Discussion:
After the features were determined, the data set to which the principal component analysis has been applied was classified by random forest, support vector machine, C4.5 and k-nearest neighbor methods, and their performances were compared. The most successful result was obtained from the random forest method.
Keywords
Introduction
The use of wearable technology is rapidly increasing, and its effects are observed positively in the user’s healthcare follow-up. Wearable sensors are small devices that people can carry around while performing their daily activities. Sensors like accelerometer, microphone, barometer and GPS (global positioning system) can record the person’s physical condition, location change and speed. Today’s smartphones and smart watches have many sensors internally.1,2 Thanks to these sensors, devices like smartphones and smart watches that can be worn on the wrist are used extensively in current activity recognition studies. 3 When the literature is reviewed, it is seen that various devices and methods of machine learning are used in determining human activities.
Ravi et al. 4 have classified eight different human activities using an accelerometer. Shoaib et al. 3 have used both smartphones and smart watches together to identify different daily human activities. As a method, they have used C4.5 decision tree, k-nearest neighbor (kNN) and support vector machine (SVM). Sağbaş and Ballı 5 have compared the success of Naive Bayes and kNN methods in classifying human activities using accelerometer and step counter sensors of smart watch. In the study carried out by Parkka et al., 6 daily activities have been identified with the accelerometer and gyroscope sensors located in the hip, wrist and ankle and the achievements obtained in these three positions have been compared. Dong et al. 7 have identified the eating cycles of the user with the smartphone that has placed on the wrist of the user. In the study, accelerometer and gyroscope sensor data of the smartphone have been used. Wang et al. 8 have aimed at obtaining a user’s laptop computer keyboard usage information using a smart watch. Samsung Galaxy Live smart watch was used during the training phase to perform Bayes extraction with keystroke hand movements. The data are obtained from accelerometer and gyroscope sensors of the smart watch. Riboni and Bettini 9 have used Bayes networks, C4.5, multiclass logistic regression, Naive Bayes and SVM to classify the data obtained from android smartphone and Sun Microsystems wearable device. Da Silva and Galeazzo 10 have classified eight different daily actions data using accelerometer sensor data obtained from ez-430 Choronos smart watch. Ramos-Garcia and Hoover 11 have detected eating movements with the device that can be worn on wrist and has accelerometer and gyroscope sensors. In summary, it is seen that in addition to accelerometer,4,5 gyroscope sensor 6–8,11 has also been used in action recognition studies. The sensor data are obtained by smart phone3,7,9 or wearable devices.3–11 Smart watches have been used in studies with reference number.3,5,8,10 In addition to daily activities, identified activities may also differ in subjects such as eating habits 7 and keyboard use. 8
In this study, sensor data (accelerometer, gyroscope, step counter and heart rate) obtained from smart watch are used. Using Orange data mining software, eight different daily human activities (brushing teeth, walking, running, vacuuming, writing on the board, writing on the paper, using the keyboard and stationary state) have been classified. The main novelty of this study lies in a hybrid method entitled principal component analysis (PCA) + random forest (RF) which combines an efficient clustering feature extraction method with an efficient classification algorithm. In this study, the PCA method was used as a feature dimensionality reduction in order to increase the classification accuracy of a RF classifier and to decrease the variance of the attributes in datasets. The steps of the proposed method are briefly as follows: In the scope of the study, 14 features were obtained initially and PCA has been applied to these data. The features obtained by applying the PCA algorithm are classified by random forest algorithm. Experiments have been carried out with different classification methods to evaluate the success of this algorithm. Materials and methods used in the study are explained in section “Material and method.” In section “Experimental results and discussions,” experimental study which has been carried out is explained and the results are discussed. Finally, information about the obtained results is given in section “Conclusion.”
Material and method
Data set and feature extraction
The data set is obtained from the accelerometer, gyroscope, heart rate and step counter sensors of the Moto 360 12 smart watch and this watch is presented in Figure 1.
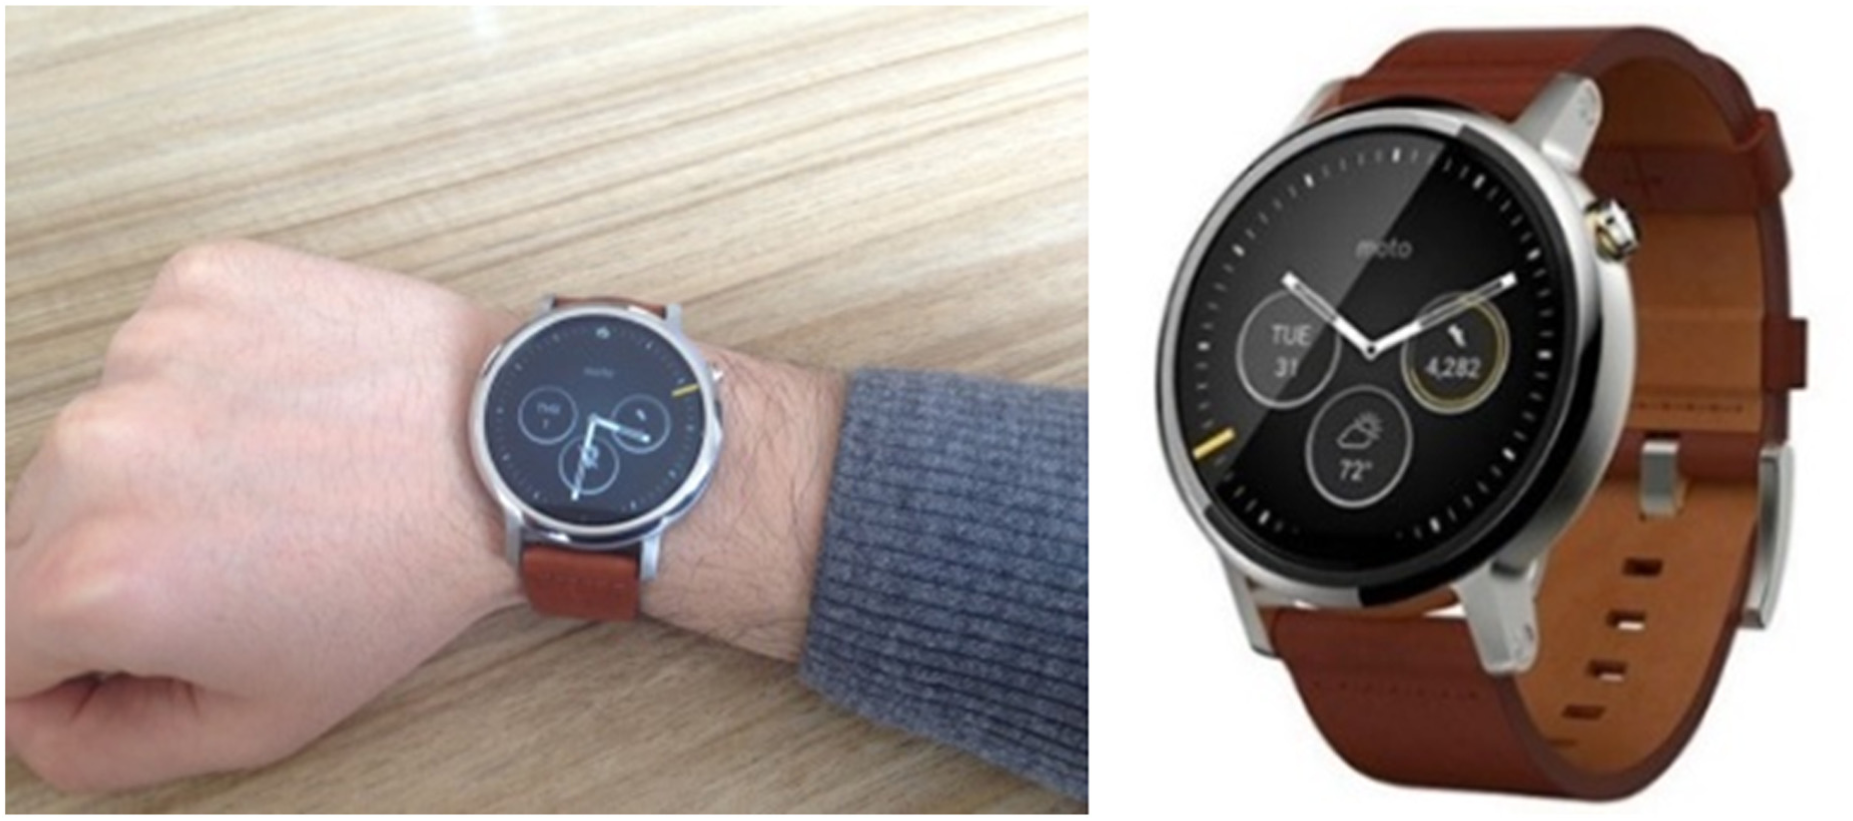
Smart watch used in data collection.
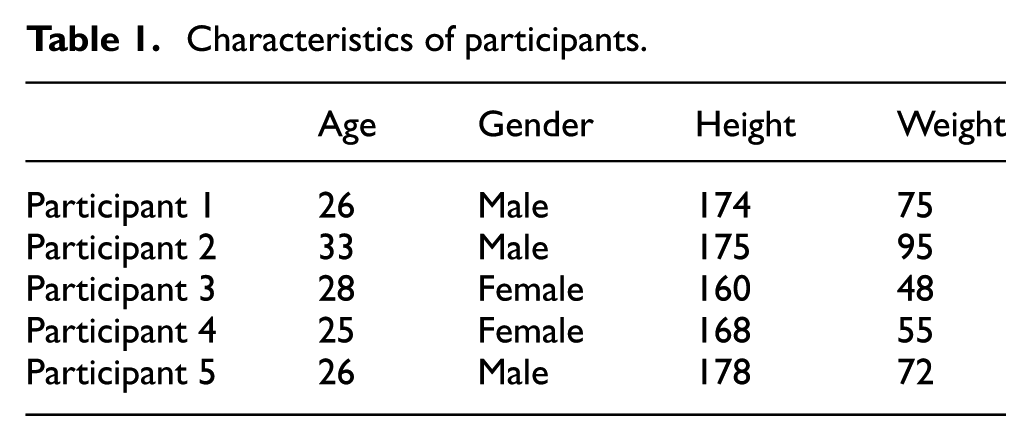
Figure 2 shows structure of storing sensor data to smartphone internal storage. The collected sensor data are transferred to the connected smartphone and stored in smartphone internal memory as CSV (comma-separated values) format with the desired label name. A total of 8000 s (1000 s for each) of sensor data are collected and tagged while each of the eight different activities is performed with the smart watch set to collect 50 sample sensor data per second. 13 The data have been divided into 2 s window intervals. And for each action, 500 patterns have been obtained from five participants having the characteristics shown in Table 1.
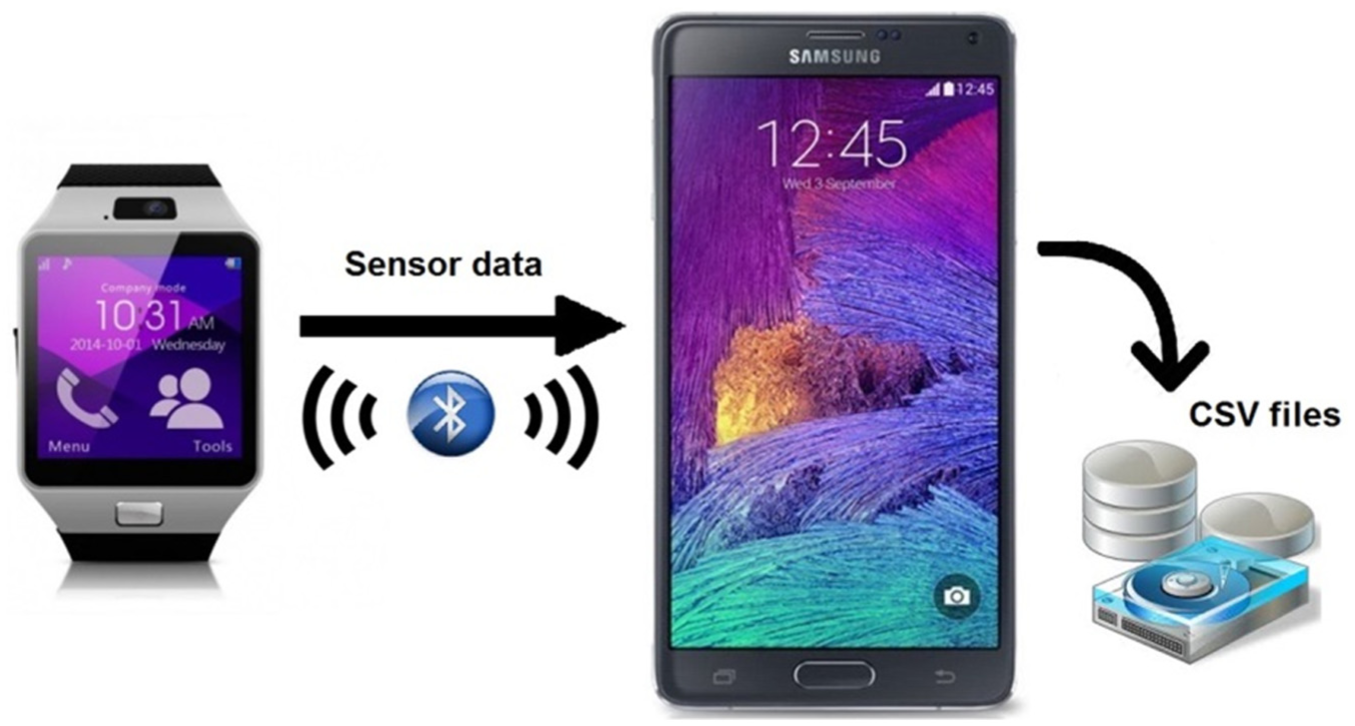
Structure of collecting data set.
Characteristics of participants.
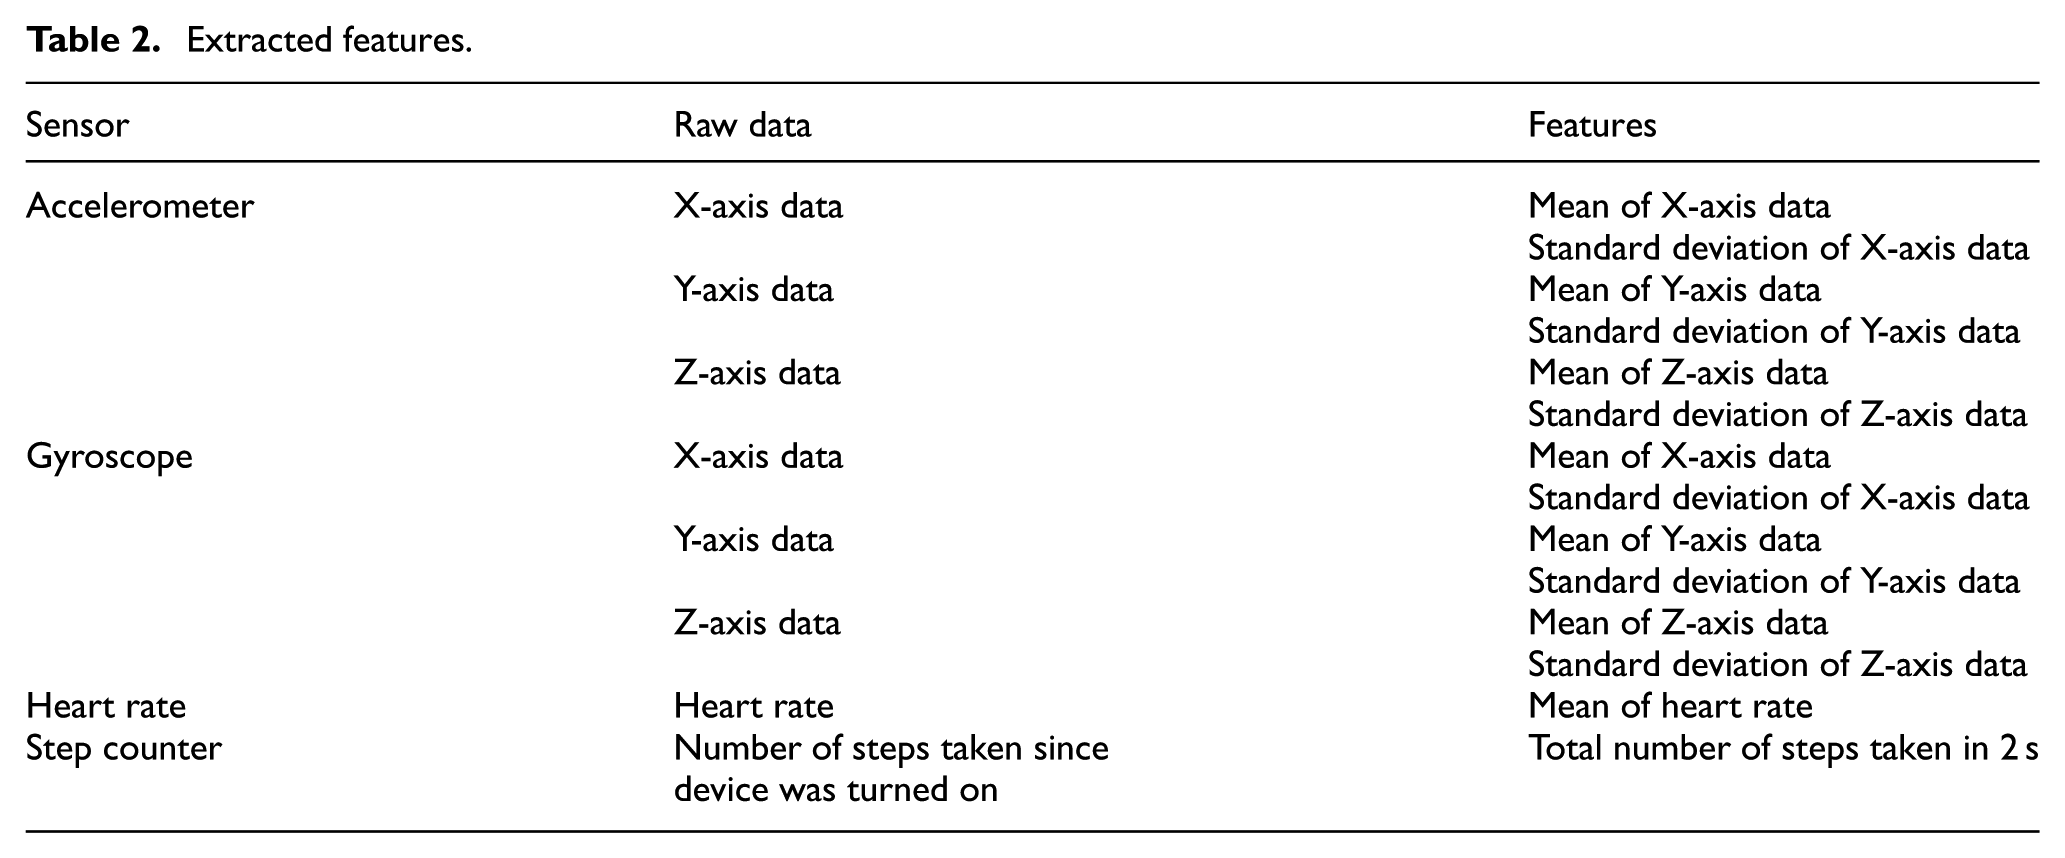
The accelerometer sensor calculates the acceleration force, which affects the device on the three axes (x, y and z) in meter per second squared, including the gravitational force. Since the fact that the accelerometer sensor can directly calculate the physical movement of the device positioned in any action, it is often used in smart device based activity recognition applications. For example, if the user moves from jumping state to walking state, the vertical axis of the accelerometer signals will change. If the Z value is 0 or very close, the device is standing on one of the edges. The gyroscope sensor calculates the angular velocity (rad/s) achieved by the device on its three axes. The gyroscope is used in character-oriented smartphone games. This sensor is used to help achieve direction determination in action recognition studies.2,14,15 The standard deviations and mean values of each data obtained on three axes in both sensors have been selected as the feature. The heart rate sensor gives the stroke per min value of human heart. Many wearable devices with a heart rate sensor use the so-called photoplethysmography (PPG) method to calculate heart rate. PPG is a technical term that calculates the amount of light scattered by blood flow by illuminating the skin. In this way, the change in heart rate can be calculated.16,17 The step counter sensor calculates the number of steps taken from the moment the device is turned on. 16 Step counter applications work using the smart device’s internal accelerometer sensor. The application keeps the data in memory and examines the patterns that appear afterward. 18 The number of taken steps in any action, is a valuable information to distinguish stationary actions (such as writing, keyboard usage, etc.) and non-stationary actions (such as walking, running, vacuuming, etc.). In studies carried out in,5,19 it is observed that the step counter sensor increases the classification accuracy. The heart rate sensor is intended to distinguish between running and other actions more clearly. In the patterns divided into 2 s windows, the average number of heart beats and the number of steps taken are selected as feature. The extracted features are summarized in Table 2.
Extracted features.
PCA
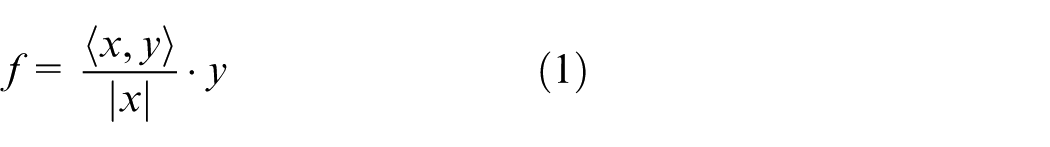
As a dimensionality reduction algorithm, PCA is a data preprocessing method that allows shifting of m-dimensional X data to n-dimensional Y data with minimum loss.20,21 The main goal in this method is to determine the projection vectors which are in the direction of the greatest variance. The obtained projection vectors are represented by unique values in a different space. 20 A vector x and a vector y are specified on the same plane. The projection of the vector x on the vector y (defined as f) is calculated according to equation (1)
When the projection vectors are obtained, eigenvalue-eigenvector transformation is used for the covariance obtained from the data. The eigenvalues are sorted from large to small. The columns of the matrix are arranged using the first

As it is seen in equation (2), dimension reduction contains a single matrix multiplication process. This weight matrix
Random forest algorithm
Random forest method is a classification method that is performed using a large number of tree structures instead of a single tree structure. In this method, samples from the data set are selected by Bootstrap method and classification trees are created. Using these classification trees, the observation class is decided for each tree, and the most repeated class value is selected among the classifications. The method used to create each tree in the random forest method is important in terms of determining the outcome. If classification trees are used, the new observation class is determined as the class that receives the most votes. In the case of using regression trees, the average of the obtained predicted values is taken. The steps of the classification process which is performed using the random forest algorithm are shown in Figure 3.23,24
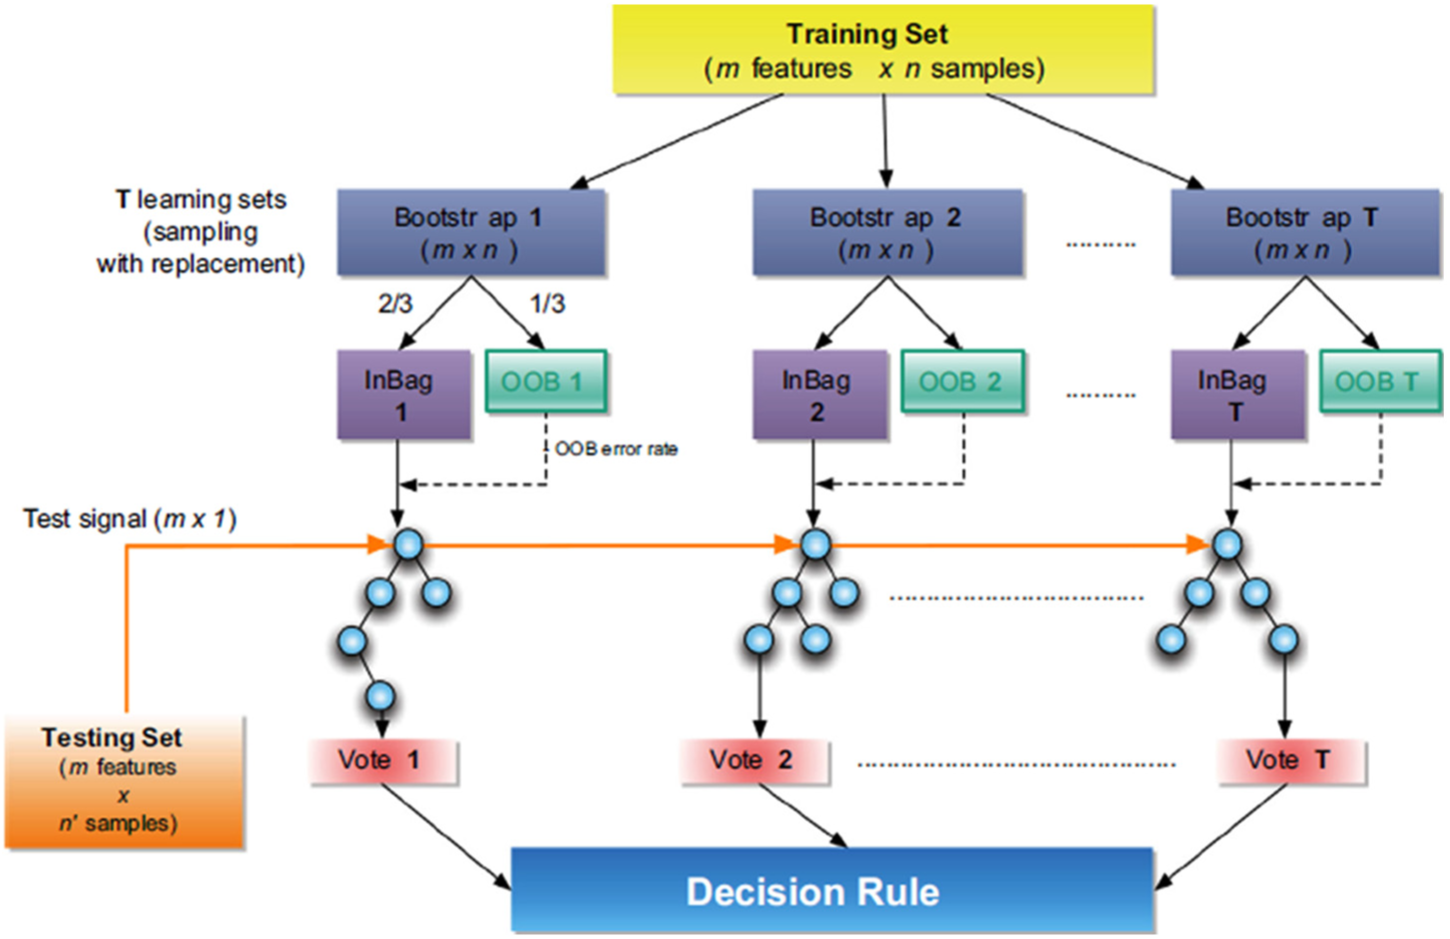
Flow chart of random forest algorithm. 23
During the classification, the decision tree consists of
Orange data mining software
Orange, 26 which is an open source data mining and machine learning software distributed free of charge under the General Public License (GPL), is developed by the Computer Science and Information Science Department of University of Ljubljana from Slovenia. This software includes libraries and components for powerful and flexible visual programming, data analysis aimed at search and visualization. It is adapted to Python for flexibility and to C++ for speed. It includes a comprehensive set of components such as data preprocessing, feature scoring and filtering, modeling, model evaluation and knowledge discovery techniques. 27
Experimental results and discussions
Three principal components have been obtained by applying the PCA preprocessing algorithm to the 14 features extracted from the obtained sensor data. The model created using the Orange software is shown in Figure 4.
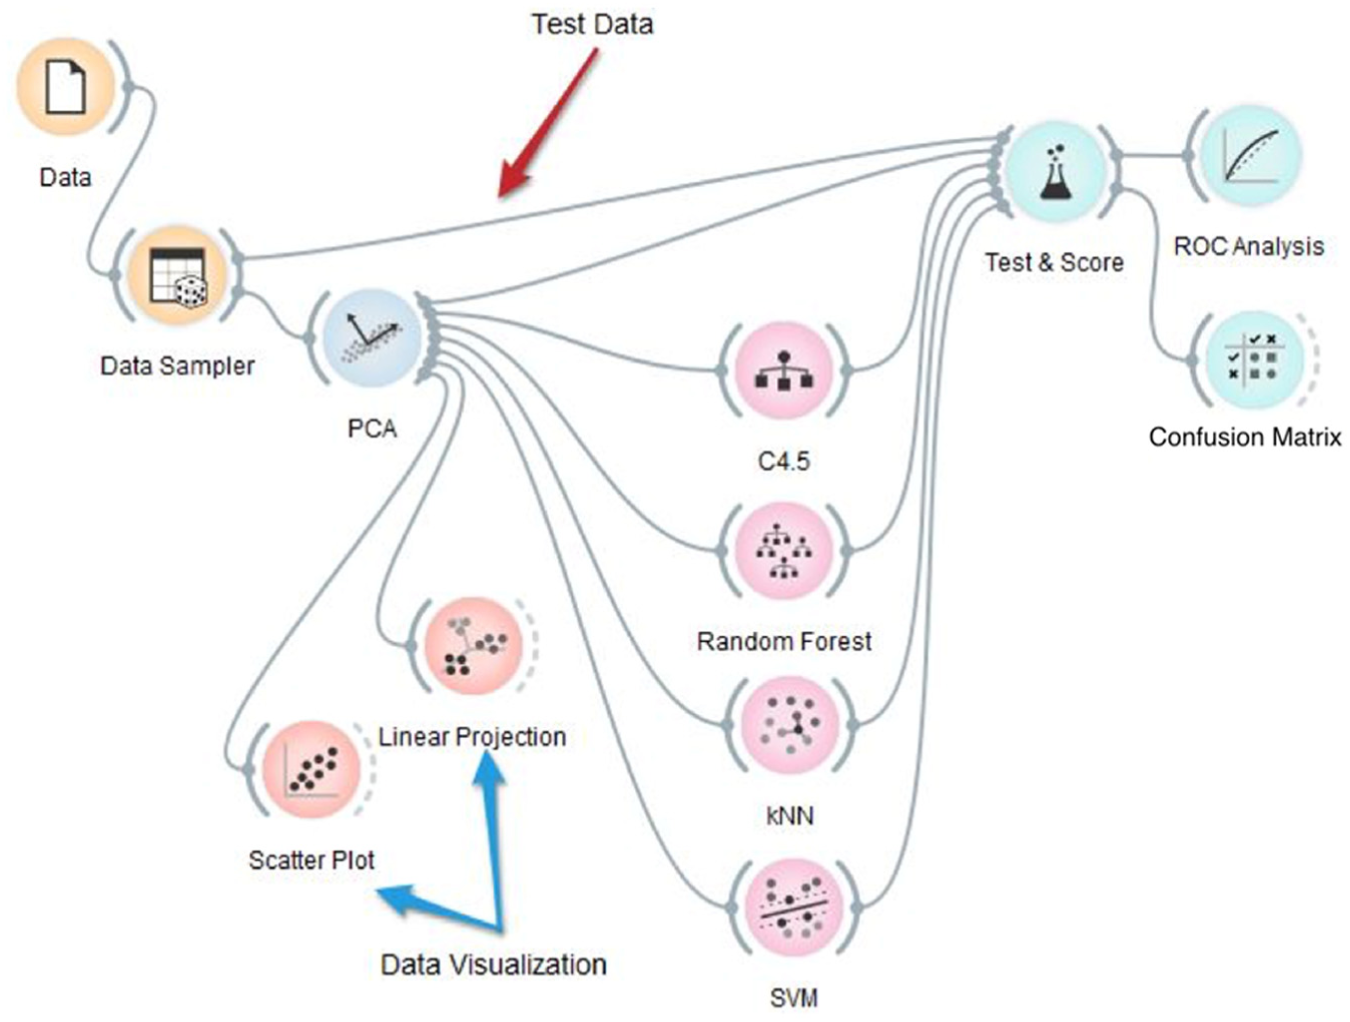
A graphical depiction of the methodology followed in this study.
After the PCA process, three principal components (PC1, PC2 and PC3) have been obtained, and the classifications have been performed with these features. PCA features, obtained according to classes of brushing teeth (TEETH), running, writing on paper (WRITING), writing on board (BOARD), using keyboard (KEYBOARD), cleaning with vacuum cleaner (VACUUMING), walking and stationary, are given in Figure 5. Figure 5(a) shows PC1–PC2 and Figure 5(b) shows PC1–PC3 graph (scatter plot). Figure 5(c) shows the PCA variables (linear projection) obtained according to the classes. According to Figure 5(c), it is observed that the data are decomposed better with PCA in high value. When the results are examined, it can be said that the data are well split in the feature space which is created by PCA. It seems that the data belonging to different classes approach each other only because of the reduction of the graph. The most important reason for using PCA is to create a higher quality feature group and reduce the data size. As a matter of fact, the data set with 14 features has decreased to three features after applying the PCA algorithm.
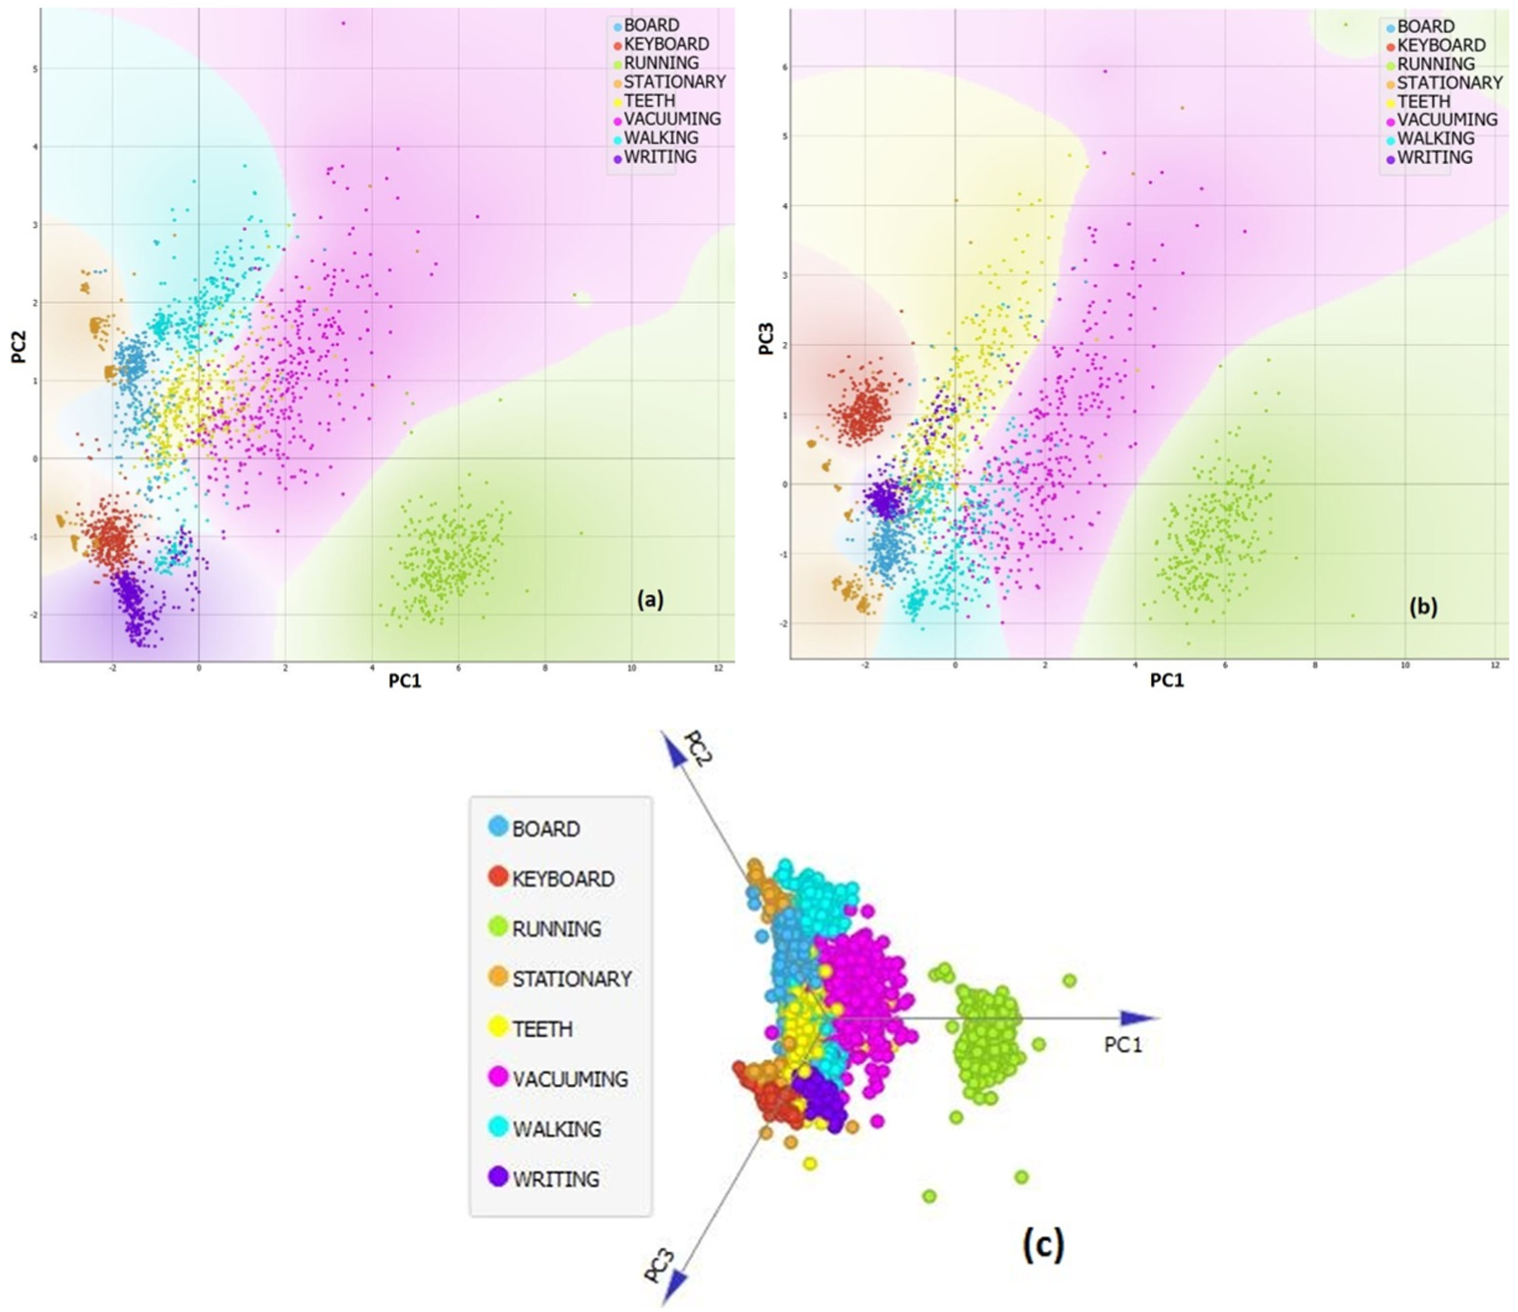
Distribution of PCA features obtained according to classes. 5(a) PC1-PC2 scatter plot, 5(b) PC1-PC3 scatter plot and 5(c) linear projection of PCA variables.
Data set with a total of 4000 samples has been divided as 70% training data and 30% test data and has been classified using C4.5, SVM, random forest and kNN methods. In the C4.5 method, the maximum number of trees has been selected as 100. In kNN method, k is set to 5 and Euclidean distance criterion is used as distance criterion. In the random forest algorithm, the number of trees has been chosen as 10. Radial basis function (RBF) kernel function has been preferred as kernel function in SVM.
The success of the proposed method has also been assessed with different evaluation criteria. At this stage, area under curve (AUC), classification accuracy (CA) and F-measure have been used. These criteria are often preferred in human action recognition studies and classification problems.7,9,18 The reason why three different measures are used is to evaluate the performance of the proposed method according to the other methods considering different evaluation criteria. Classification accuracy is calculated as shown in equation (3). This value is the ratio of the correctly classified sample number to the total sample number
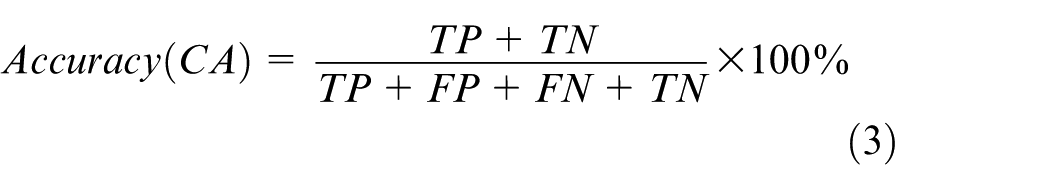
where TP is the number of true positives, TN defines the number of true negatives, FP is the number of false positives and FN is the number of false negatives.
The receiver operating characteristic curve (ROC) curve is often used because diagnostic test identifies its own accuracy and it allows a reliable comparison between tests. The area under the ROC (AUC) for a diagnostic test can range from 0.50 to 1.00 depending on the activity level. The larger this area, the diagnostic test will have more ability to distinguish.
In this study, F-measure calculated depending on Precision and Recall values is used for performance evaluation. Precision and Recall values are calculated as shown in equations (4) and (5). F-measure is the harmonic mean of Precision and Recall values. This measure is between 0 and 1. In a successful classification, it is expected for F-measure to be close to 1
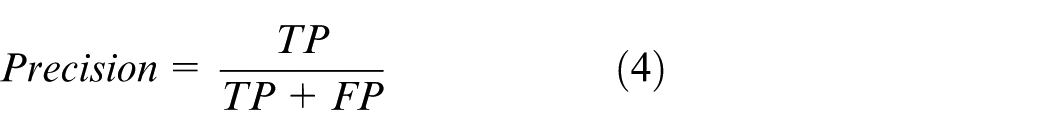
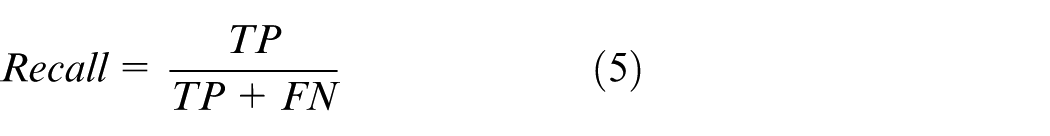
Table 3 shows the AUC, CA and F-measure values obtained as a result of the performed tests with and without heart rate and pedometer sensors.
The obtained results according to different performance evaluation metrics (Shaded is the best).
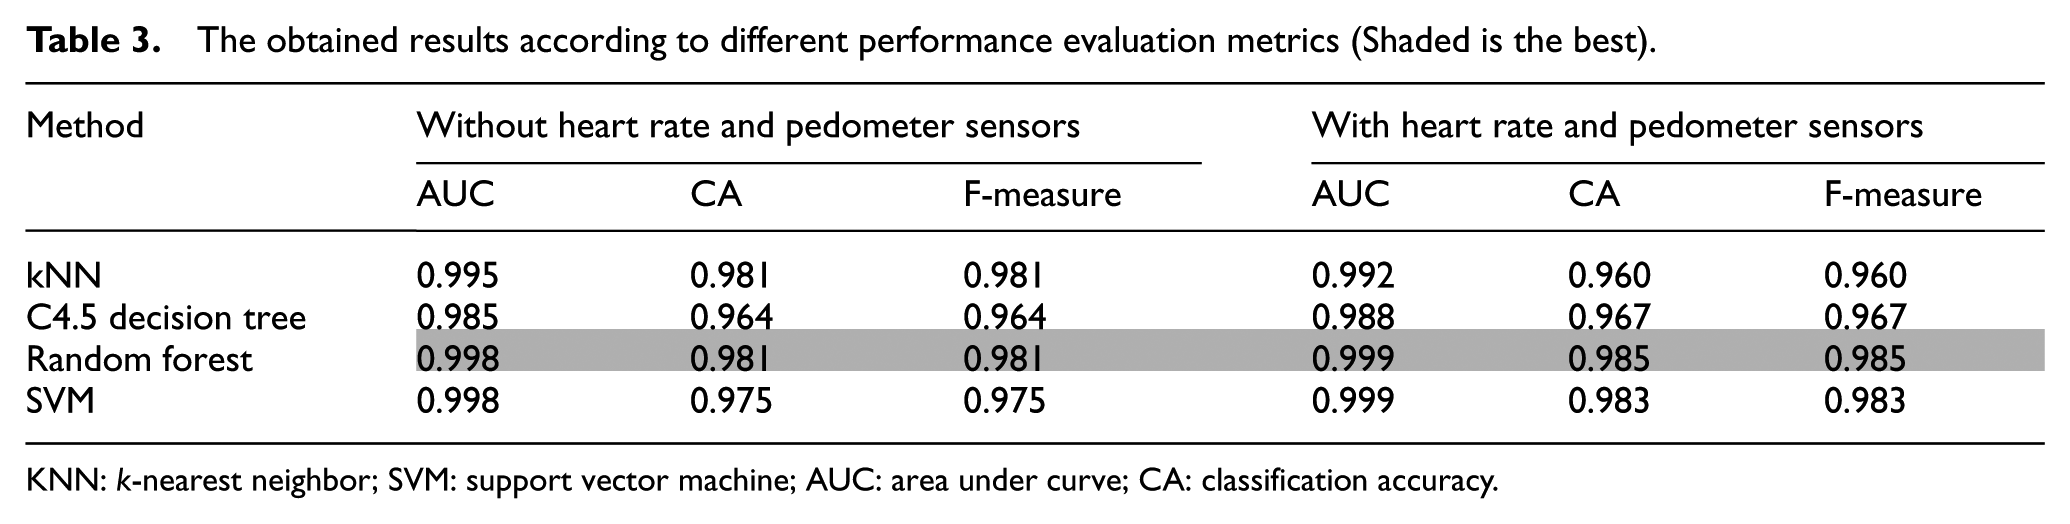
KNN: k-nearest neighbor; SVM: support vector machine; AUC: area under curve; CA: classification accuracy.
According to Table 3, it is seen that the most successful result is obtained from the random forest method. This method is followed by SVM, C4.5 and kNN, respectively. The value for the area under the mean curve (AUC) of the random forest method which classifies with 98.5% accuracy rate has been calculated as 0.999. Among the tested methods and sensor combination, the kNN method, which has the lowest success rate, has performed 96.0% classification success. The confusion matrices obtained according to the methods are presented in Figure 6. The reason for achieving high success rate by different methods is the obtained features and the PCA method applied to these features. In this way, features which represent the data set well have been obtained.
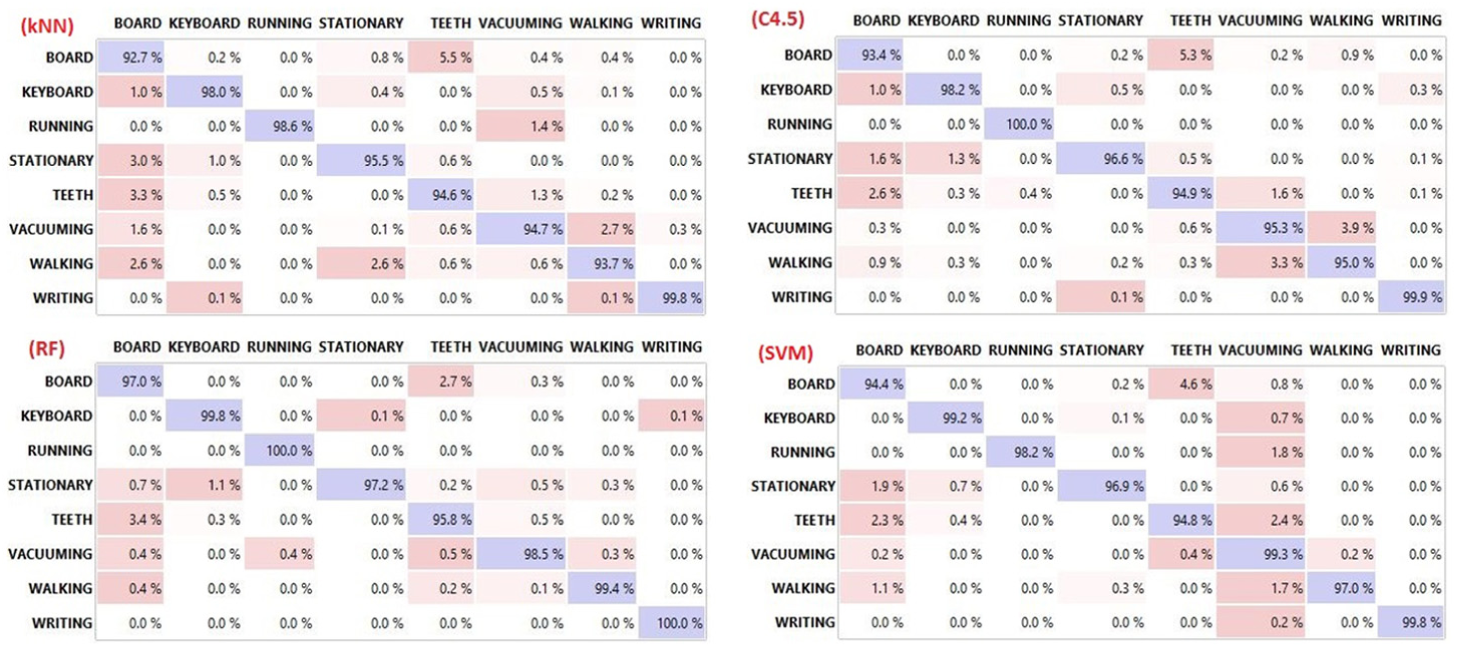
The confusion matrices obtained according to the methods.
When the confusion matrices are examined (Figure 6), it is seen that the most unsuccessful classification of the test result by the kNN method is writing on the board action with 92.7%. This action is mostly mixed with brushing teeth. This is due to the absence of a characteristic structure of the brushing teeth action and proximity of its vibrations to the writing action. In the test result carried out by the C4.5 method, similarly, it is observed that the actions of brushing teeth and writing on the board mixed with each other. In addition, the classification performance of the cleaning action with vacuum cleaner is 95.3%. This action mostly mixed with walking action. The main reason for this is that the act of vacuuming includes walking action. In the random forest method, all classes are correctly classified over 97% expect brushing teeth. In the SVM where the second best result is obtained, it is seen that the writing on the board mixed with the brushing teeth action, similarly to the kNN method. In each four tests performed, keyboard use, writing and running actions have been classified with over 98% success rate. Random forest and C4.5 methods classified running action with 100% accuracy. Figure 7 shows the ROC curves of brushing teeth, writing on board and using vacuum cleaner.
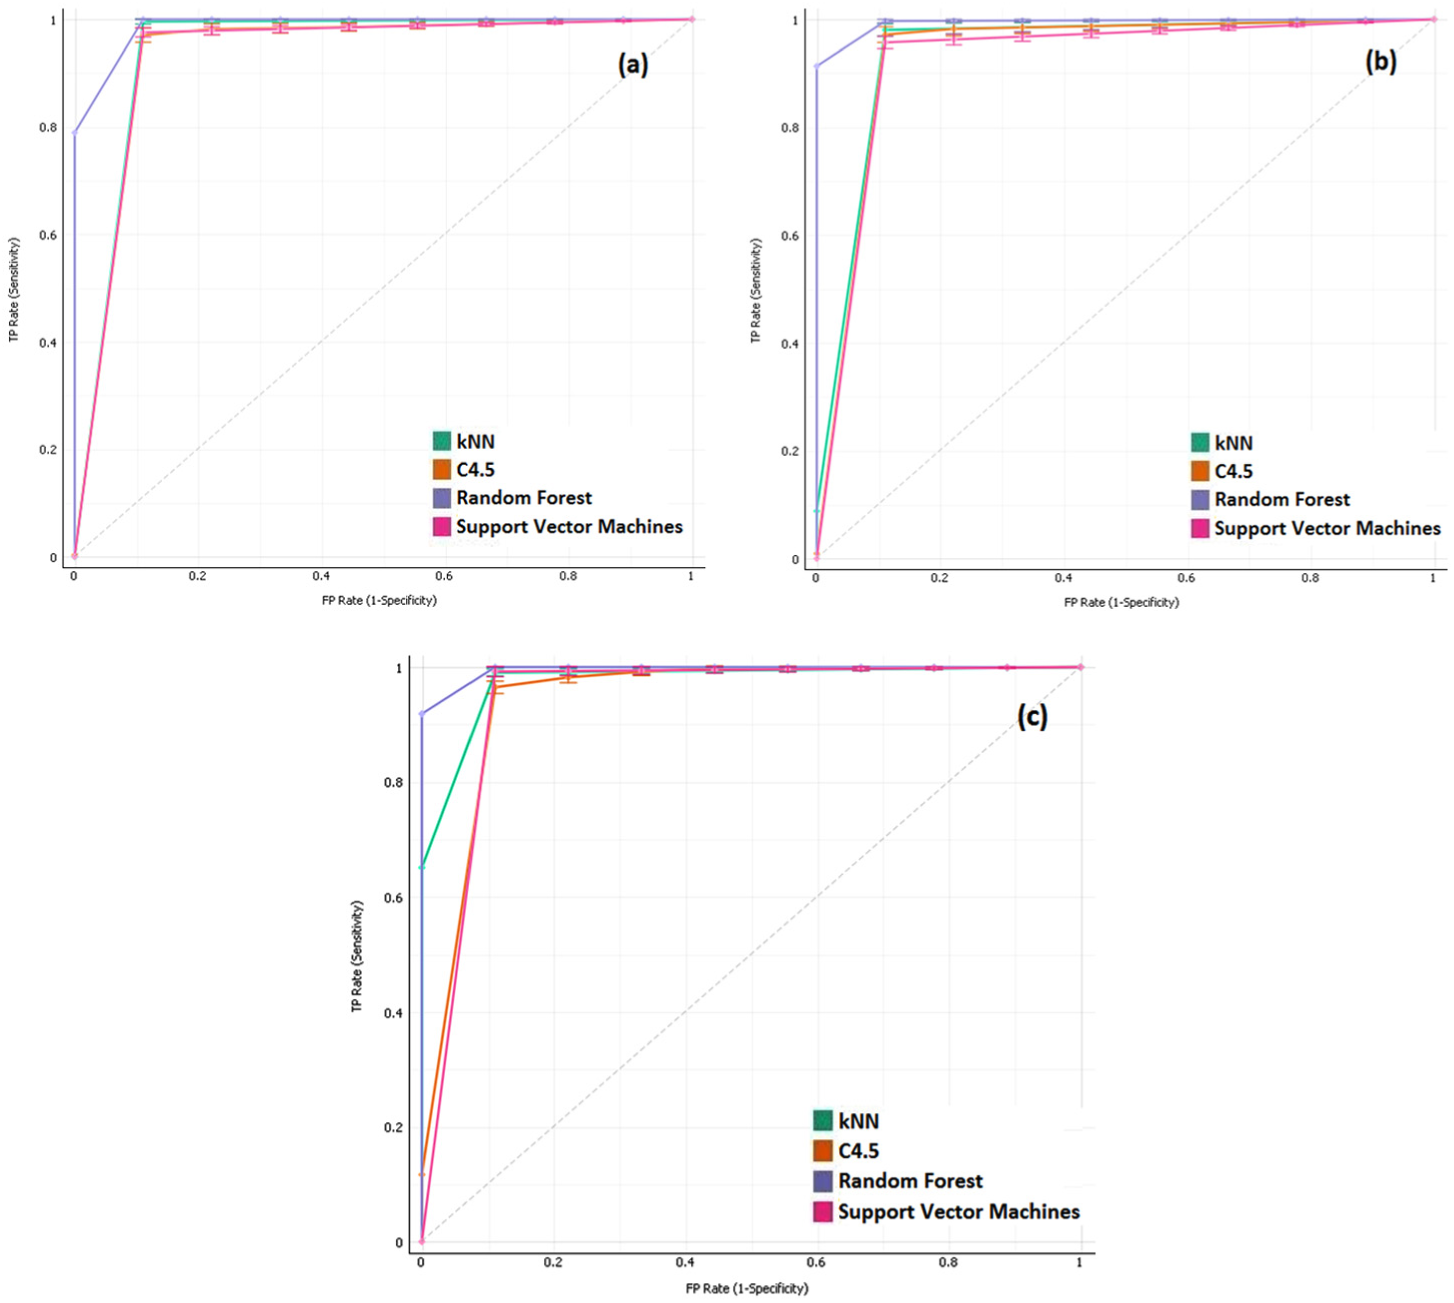
ROC curves of brushing teeth (a), writing on board (b) and using vacuum cleaner (c) actions.
The ROC curves have been used to compare the class discrimination performances of the methods. Figure 6 presents the actions of brushing teeth, writing on the board and using vacuum cleaner, which are classified with higher error among the classes. As can be seen, the random forest method gives significantly better results than other methods. Although the kNN method has a more successful graph than C4.5 and the SVM in the use of vacuum cleaner action, the Random Forest method is the most successful method.
The statistical significance has been measured using an N-way analysis of variance test. At a significance level of 0.05, the achieved p-value reported across the different classification methods was
The proposed method is a two-stage hybrid system. In the first stage, the PCA method has been used to reduce the data size and increase the data quality. In the second stage, RF method which is a strong classifier has been used. Therefore, the most important contribution of this study is to obtain better results in recognizing human movements with the PCA + RF combination. The comparative analysis is presented to show that the presented method gives better results than the existing methods. Thus, it is possible to say that the proposed method is PCA + RF focused, and that other methods are used for comparison purposes.
One of the important innovations of the study is the use of the pedometer and heart rate sensors in addition to motion sensors (accelerometer and gyroscope). As a result of the tests performed, it has been observed that these sensors increase the classification accuracy (Table 3). The use of these sensors is one of the different points of this study comparing to the others.
One of the important limitations of this work is that a real-time motion recognition application with the proposed method has not yet been implemented. Real-time application of the proposed method is targeted for future studies. In this context, parallel programming techniques will be used for a faster system.
The parameter values of the methods used in the classification phase are empirically found. This makes it difficult to carry out the experiment with a large number of values and makes it difficult to determine parameter values that will give better results. In this context, it is aimed to use heuristic optimization methods for automatic detection of parameter values which will give better results in future studies.
In this study, the PCA method has been preferred in order to reduce the size and increase the data quality. There are, of course, different methods presented in the literature for this purpose. For example, Kernel PCA, Linear discriminant analysis (LDA) methods are frequently preferred methods in the literature. It is aimed to include these methods into future studies and to determine the method which will give better results.
Conclusion
In this study, the features obtained after applying PCA to the data set generated by the sensor data obtained from the smart watch are classified using machine learning methods. In this study, where eight different daily human activities are classified, the most successful result is obtained from random forest method. Applications of detection of human activities can support people in healthy life subject. It can be helpful in detecting and preventing of dangerous actions such as falling and disappearing of older people and young children, or actions which are not good for the health of a person. These applications can also help the user as alerter in everyday life. Such applications can track information such as how far people walk, how many steps they take and how long they sleep. The developed system recognizes the actions that people have done. Running of an elderly person can be inconvenient for that person. In this case, measures may be taken by notifying the person or a relative. Smart watches and smartphones are interacting with each other. In this context, mobile application can be programmed to detect smartphone’s location via the GPS sensor and perform the necessary actions when the system comprehends an undesired or emergency state. This study can be expanded further by adding eating, smoking, cooking, hand shaking, hand waiving and so on. In this way, activities such as the individual’s nutritional follow-up, detection of bad habits and frequency of use can be tracked. In addition, individuals can walk as their hands in their pockets, as well as by shaking their hands or carrying an object. For this reason, classifying actions by separating them into smaller pieces will lead to healthier results.
Footnotes
Declaration of conflicting interests
The author(s) declared no potential conflicts of interest with respect to the research, authorship and/or publication of this article.
Funding
This study is supported by Muğla Sıtkı Koçman University Scientific Research Projects under the grant number 016-061.