
Abstract
This paper presents the development of a smartphone-controlled wireless device for cell optical density sensing in microfluidic chips. The footprint of the device is very compact relative to a classical laboratory spectrophotometer, making it a portable device. The cell optical density sensing device consists of an embedded microcontroller, optical sensing components, and a wireless transceiver performing cell optical density measurements in disposable microfluidic chips fabricated from poly(methylmethacrylate) polymers. The device is controlled by an Android application allowing for true portability and the possibility of remote or field operation of the device. The use of microfluidic chips as the sample carrier for optical density detection instead of a plastic cuvette allows users the flexibility to explore and/or conduct a variety of micro-scale chemical analysis using the device which would be difficult in a cuvette-based system. The function of the device is validated through a series of off-line and online optical density measurements using Saccharomyces cerevisae yeast cultures. The device is low cost, small enough to fit in most laboratory flow hood cabinets, and can be easily integrated into miniature bioreactor systems. Moreover, wireless communication enables the user to operate the device using smartphones or rapidly transfer the measured data to an online repository for analysis or storage.
Introduction
In microbiology, optical density (OD) measurements are a commonly employed method for estimation of suspended cell (bacteria cultures) concentration.1,2 It is a label-free, non-invasive, straightforward technique to implement for assessing the progress of cells growth. OD is defined as the logarithmic ratio of the intensity of transmitted light to the intensity of the incident light. 3 The measurement is based on the amount of light scattered by the suspended cells where a linear correlation between the concentration of the suspended cells and the intensity of light transmitted along a known path length can be obtained via the applicability of the Beer–Lambert’s law.4–6 The only disadvantage is that dead microbial cells and cell debris also scatter the light. This means that the absorbance value attained may not be accurately correlated to viable microbial cells. Nonetheless, the method enables simple identification of the stage of cell growth for pre/post-operation steps such as culture induction, inoculation, and harvest. Electrochemical impedance spectroscopy is also a viable alternative for measuring cell density. This technique applies an alternating current (AC) electrical field to the suspended cells and measures cell conductivity as a function of frequency.7,8 However, industrial impedance spectroscopy is relatively costly and does not offer much flexibility for integration with other instruments.
At present, researchers rely mainly on benchtop spectrometers to perform OD measurements in the laboratory. In a spectrometer, OD values are usually obtained through off-line measurements where samples containing bacterial cultures are transferred into a separate cuvette, and the relative absorbance is measured.1,9,10 In a case where sampling is not possible due to small working volumes and/or if there is a need to obtain real-time data, additional optical probes are applied as waveguides to perform OD measurements. This is a common practice particularly for micro bioreactor operators.11,12 Commercial OD spectrometers are now available at a reasonable price and as portable devices (e.g. DR1900 Hach™, SpectroVis Vernier™, etc.). Nevertheless, OD spectrometers use a cuvette which is limited only as a sample container for detection. OD spectrometers cannot easily be adapted to facilitate their integration with lab-on-a-chip (or microfluidics) devices. Alternatively, one could opt for a microtiter plate reader that offers additional functions such as simultaneous mixing, temperature control, and OD detection up to 96 wells.6,13 However, commercial plate readers are bulky, expensive, and do not have the capacity to establish wireless communications.
Our interest is to establish a low-cost and a simple transmission measurement device for reading cells OD in disposable microfluidic chips. Microfluidic technology has shown great potential for many biological and clinical applications, offering advantages such as low-cost operation, that is, low reagent consumption and disposable, high-throughput, and fast analysis. It is a technology characterized by devices consisting of micron scale channels (10–1000 µm, width and depths) with the capacity to integrate multiple processes on a single chip.14–16 Results attained from microfluidic OD devices may not be as accurate as a measurement performed using high-end conventional laboratory equipment; however, they can be an ideal solution for processes where complex sample preparation is not necessary and changes in OD (or color) are adequate for diagnosis. In addition, microfluidic devices are often inexpensive to manufacture, robust, and easy to use.17,18
In this work, we present the design and implementation of an integrated smartphone-controlled wireless OD sensing device for point of use applications. The use of a smartphone has many advantages including advanced computing capability, integration of a touch-screen display, inclusion of a reasonable amount of data storage, and a variety of wireless and Internet communications features. 19 The inclusion of Bluetooth wireless capability in our device allows for rapid and low-cost wireless communications with the smartphone, offering immediate savings in the cost of wiring and physical device interface. The proposed cell OD sensing device involves an embedded microcontroller, low-cost optical sensing components, a Bluetooth transceiver, and disposable microfluidic chips made of poly(methylmethacrylate) (PMMA) polymers. An Android application has been developed and deployed into a smartphone to control the operation of the device. The paper includes three main aspects. First, a detailed description of the mechanical and electrical design of the device is described. Second, the function of the device in relation to off-line OD measurements and its capacity to obtain real-time OD readings (online monitoring of OD) in a minibioreactor system is explained. Finally, the potential of the device as a point of use application is discussed.
Materials and methods
Microfluidic chip design and fabrication
In the cell OD sensing device, plastic microfluidic chips were used as the sample carrier for the detection. Two different types of microfluidic chips were fabricated for the OD off-line measurements (Figure 1). The first chip, ODChip1, consisted of a 10 mm long microchannel with channel width and depth of about 1.5 and 1 mm, respectively. ODChip1 also features a sample/waste reservoir (Ø2 mm) at each end of the microchannel and a circular detection area (Ø3.5 mm) in the center of the microchannel. The second chip, ODChip2, has a similar design except without the circular detection area. The working volumes for these microchannels are approximately 30–35 µL. Both chips are 35 mm (length) × 15 mm (width) × 1 mm (thickness) and were made from a 1 mm precast PMMA (Resiplex, Australia) sheet. The chips were fabricated using a CO2 laser engraving/cutting system (Trotec SP500, Australia) where they were cut at laser power output of 40 W and engraving speed of 75 cm s–1 to achieve the designated channel design. Additional multi-pass engraving methods 18 were also applied to obtain a channel surface with a good optical clarity. In the final step, the chips were sealed using a 0.2 mm thick mobile screen protector to form a closed channel structure, with holes in the top layer for access to the waste and sample reservoirs for delivery of liquid into the microchannel.
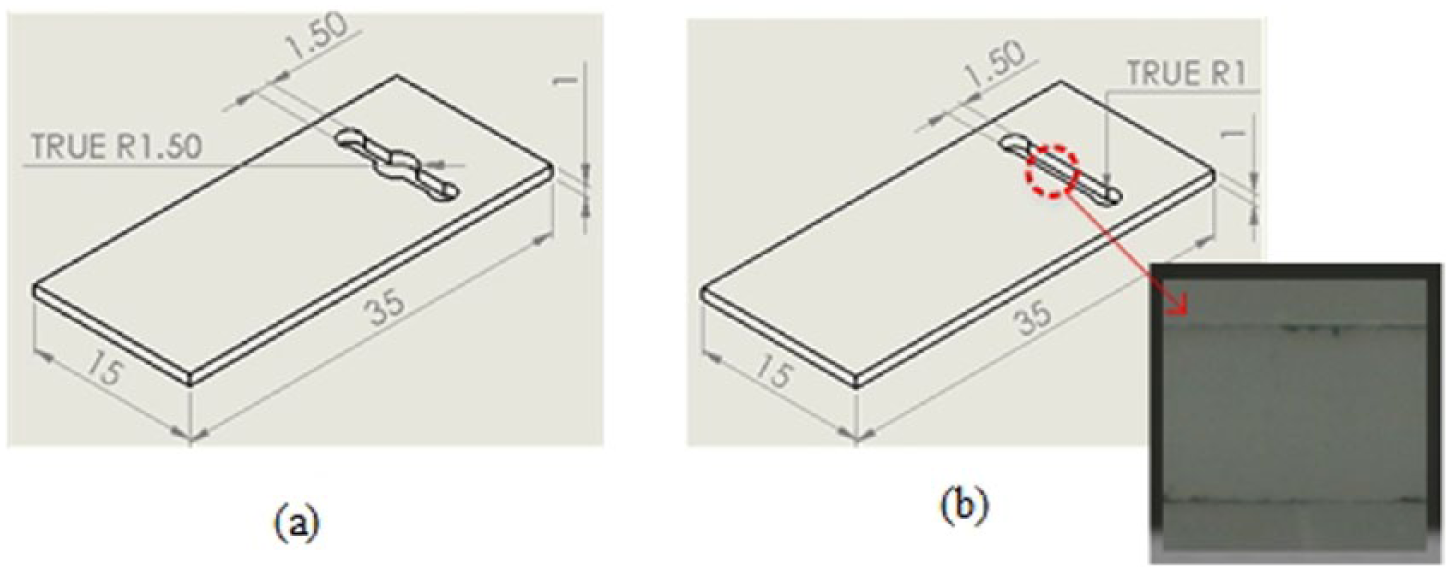
Microfluidic chip devices (a) ODchip 1 and (b) ODchip 2 that were fabricated to evaluate the functionality of the cells OD sensing device proposed in the work. Inset shows the optical clarity of the microfluidic structure attained.
OD sensor
The OD sensor is shown in Figure 2. The holder for the optical components (i.e. the top section of the sensor) consisted of a light-emitting diode (LED), optical fibers, and a detection photodiode (PD). This component was fabricated from black high-density polyethylene (HDPE) thermoplastic via computer-numerical controlled (CNC) milling (Datron M7HP from Datron AG, Germany). As shown in Figure 1, the optical component holder has two parts. The top part of the holder is 15 mm (height) × 25 mm (length) × 25 mm (width) and comprised of a space for the integration of the LED. A low-cost plastic transmitter (SFH756, Avago Technologies, US) was used to emit light for the OD measurements. It incorporates a LED that has a peak emission wavelength at 660 nm and comes with a pre-molded microlens for light collimation. An aperture (Ø3.5 mm × 4.6 mm (length)) within the plastic transmitter allows for easy coupling of optical fibers. In the work presented, an unjacketed optical grade plastic optical fibers with outer diameter of 1000 µm and Numerical Aperture (NA) value of 0.51 were used (Edmund Optics, US). The bottom part of the holder has the same configuration as the top part except that it was embedded with a receiving PD (SFH250, Avago Technologies, US). This PD has a photosensitivity spectral range between 400 and 1000 nm where sensitivity is the highest at the wavelength of 850 nm.
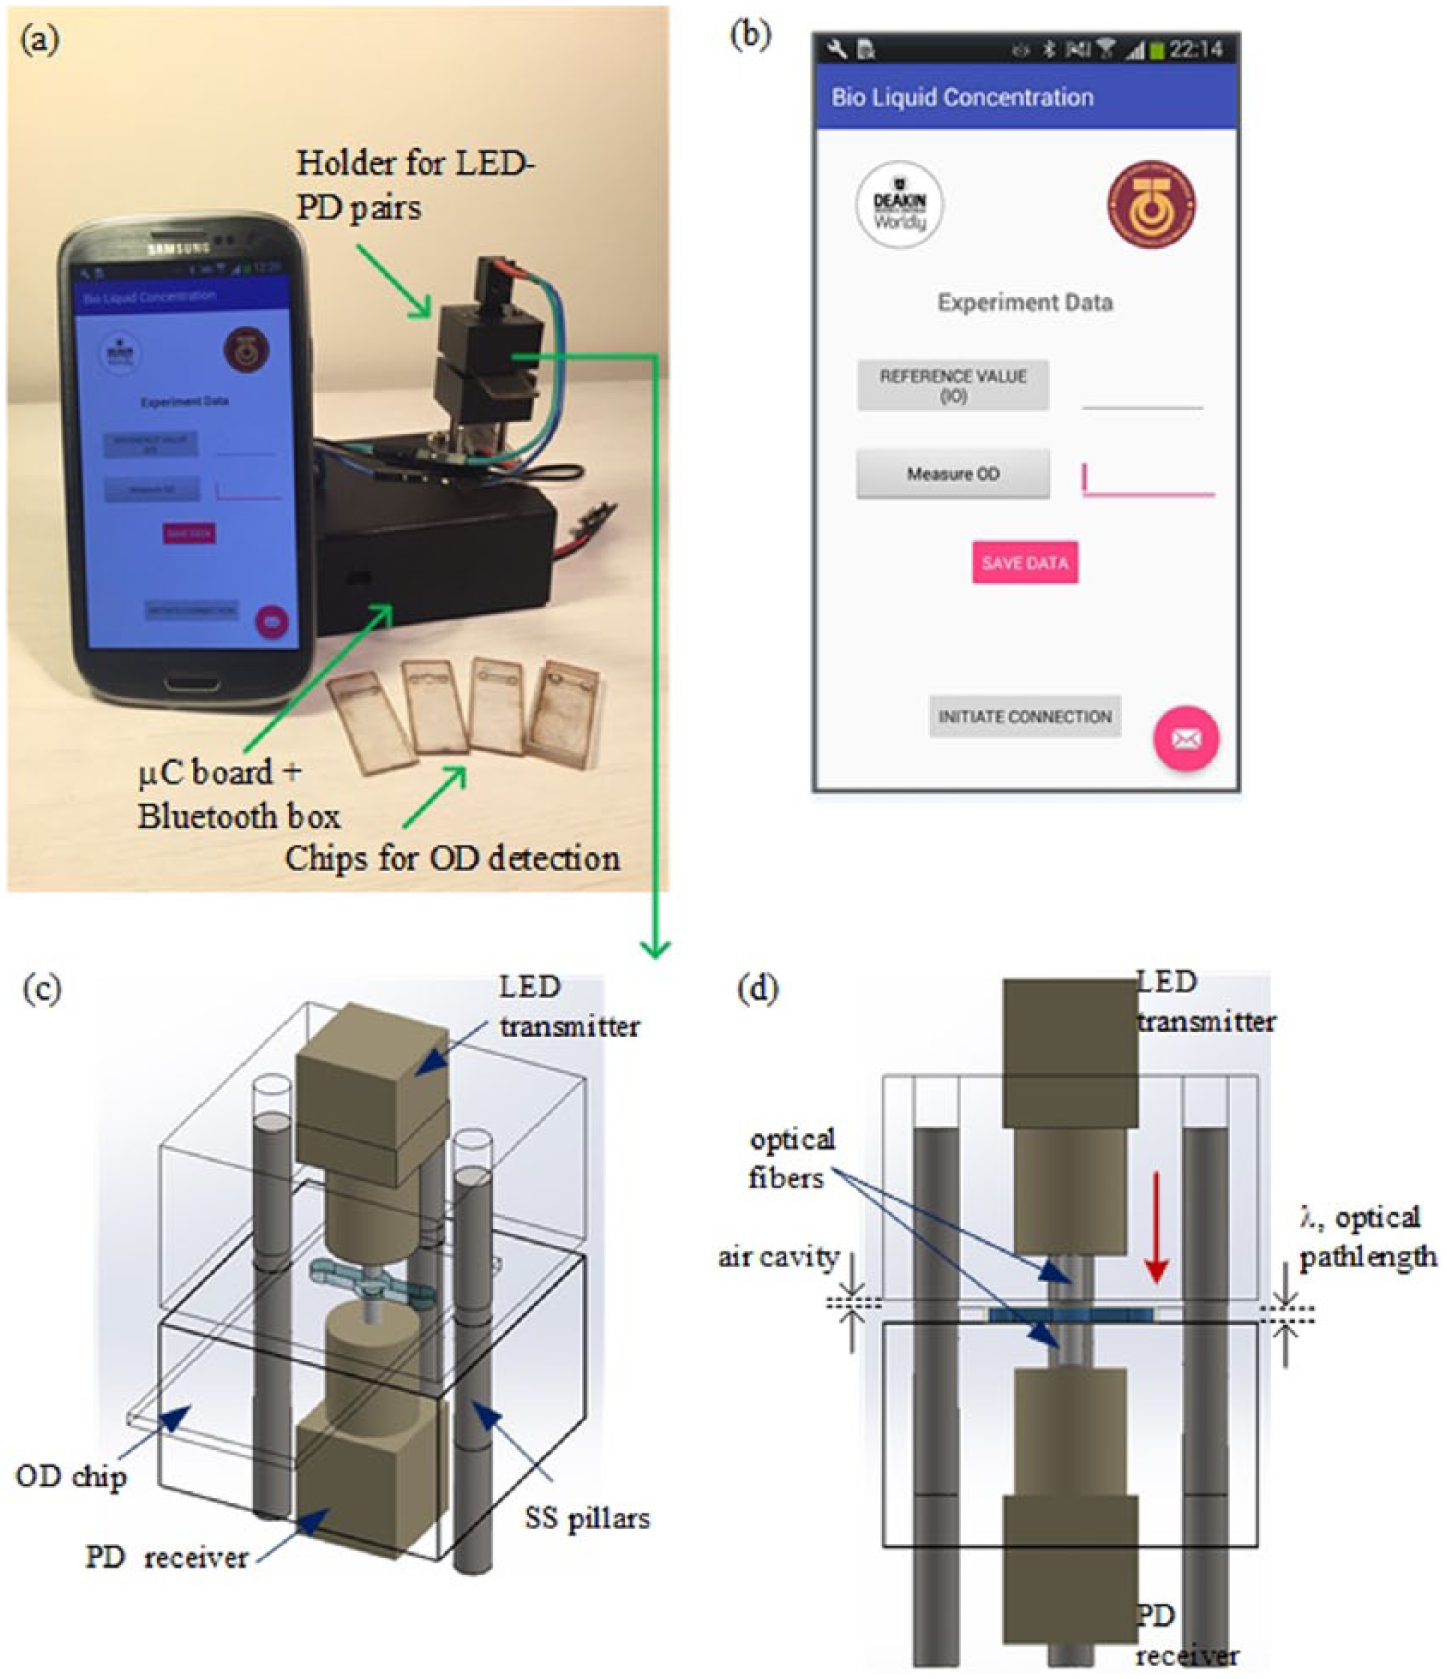
Smartphone-controlled portable device for sensing cell optical density: (a) Proposed device which includes the OD sensor, microfluidic chips, and smartphone. (b) Close-up image of the Android application that is used to manage OD measurements. (c) Isometric view of the OD sensing platform indicating the placement of the microfluidic chip in the platform. (d) A sectional view of the OD sensing device highlighting the positioning of the microfluidic chip perpendicular to the LED–PD pairs. Red arrow indicates the direction the light travels from the LED, passing through the microfluidic chip, and into the photodiode.
An electronic circuit controls the synchronization of the LED and the acquisition of the light signal from the PD. The circuit also includes a microcontroller and a Bluetooth transceiver. The microcontroller performs the OD calculation from the acquired data and transmits the OD readings via a wireless link to a smartphone. All of the electronics parts have been enclosed within a plastic box (35 mm (height) × 160 mm (length) × 65 mm (width)) that is linked to the optical component holders by stainless steel rods (Ø3 mm).
An Android application has been developed to enable the user to control the OD sensing device using the smartphone. The wireless connection between the OD sensing platform and the smartphone is initiated using the “Initiate Connection” button. The user has the option to obtain a reference value and subsequently proceed with the OD measurements through the designated control buttons in the application. The reference value will be stored (unless modified/changed) and used to calculate the OD value. The OD value is calculated in accordance with the Beer–Lambert law (Equation (1)) which has been implemented in the microcontroller code. The OD value is transmitted back to the smartphone via the Bluetooth connection and displayed on the smartphone screen. Alternatively, the user can also transfer the data via an email. The wireless connection of the OD sensing device is not limited to only smartphones; it is also applicable to other Android devices such as Tablet phones.
Miniature bioreactor system for testing online measurements
Online OD measurements were performed in a miniature bioreactor system. The reactor has a working volume of approximately 18 mL and features various feedback control loops including stirring, temperature, and aeration. Details of the reactor design and fabrication have been described in Whyte et al. 20 The bioreactor system was modified to include a miniature probe for measuring cell OD where light from a LED is transmitted into the bioreactor and then sent to a PD by using optical fibers (Figure 3). The optical fiber for light transmittance was mounted at the bottom of the reactor, while the receiving fiber was fixed into lid of the reactor, immersed in the solution. As illustrated in Figure 3, light from the LED is transmitted through a 3 mm thick transparent PMMA before passing through the bioreactor contents (optical pathlength, λ = 1.5 mm) and into the receiving fibers. This configuration may have resulted in a slight signal loss; however, it was necessary to maintain the reactor sterility during the fermentation experiment. In addition, the OD probe can (1) be freely adjusted to optimize optical path length for measurement and (2) be easily removed or replaced if needed. The control and automation of the reactor system were carried out via wireless communications using a smartphone where a Bluetooth HC-06 transceiver was used to establish the wireless link.
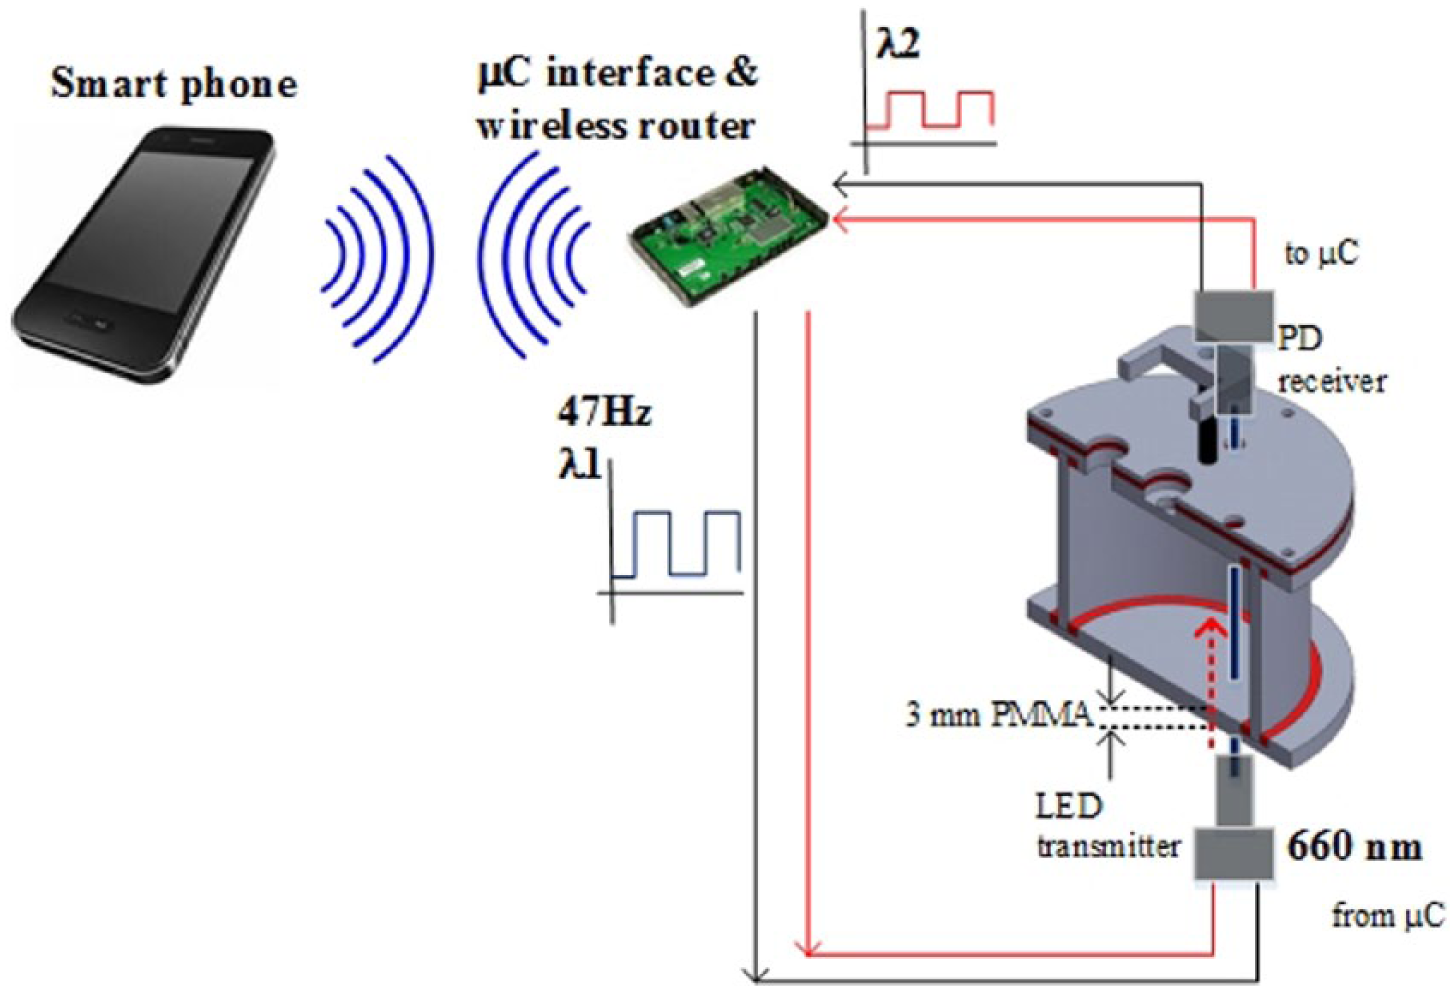
Close-up on the configuration of the LED–PD pairs for online OD measurements in a miniature bioreactor system.
Experimental work and OD calculations
Optical cell density off-line measurements were performed using yeast cells suspended in distilled water. Suspended yeast culture was prepared using a commercial dry yeast obtained from a local store. Yeast culture sample solutions with different cell concentrations ranging between 0.25 g L–1 and 15 g L–1 were prepared independently for the off-line OD analysis. Each sample was loaded into the microfluidic chip using a plastic pipette and the absorbance value of the sample obtained at 660 nm. This step is essential in order to generate a calibration curve to relate the OD values with the yeast cell concentration. Triplicates were made for each standards to check data reproducibility.
The absorbance value, that is, the voltage ratio between the intensity of the light that passed through the chip (I) and the reference signal (Io), was correlated to the actual cells concentration using the Beer–Lambert’s law equation. The Beer–Lambert’s law equation is as follows
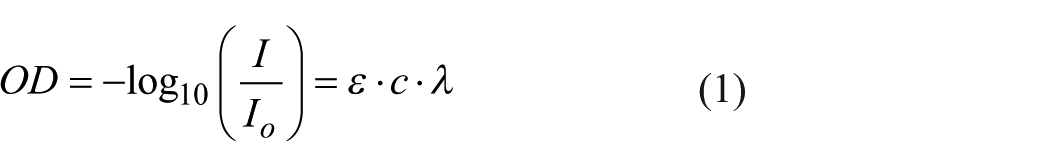
where I is the voltage reading representing the light transmittance into the sample, Io is the reference voltage value for medium containing no cells (c = 0), ε is the attenuation coefficient which normally differs depending on the instrument used and culture conditions and λ is the optical path length for the OD measurements.
For the online measurement experiments, OD readings were attained in real time from an active yeast fermentation process in the miniature bioreactor system. The yeast cells were grown in a standard Yeast Peptone Dextrose (YPD) medium which consisted of 20 g L–1 glucose (Sigma-Aldrich, US), 10 g L–1 peptone (Sigma-Aldrich, US), and 5 g L–1 yeast extract (Sigma-Aldrich, US) at 35°C and pH 6. The starting pH of the YPD medium was adjusted to pH 6 using 2 M sulfuric acid, H2SO4, and 2 M sodium hydroxide, NaOH solutions. The reactor was sparged with air at 100 µL h–1 for oxygenation and the stirring rate was set at 90 r/min to achieve a mixing time of about 6 s. 20 Sterilization of the reactor was performed in two steps. First, the reactor was cleaned with a 70% (v/v) ethanol solution before thoroughly rinsing it with distilled water several times. After assembling the washed and dried components, the reactor was placed under a ultraviolet (UV) light in a laminar flow hood cabinet for 10–12 h (overnight). The fermentation was initiated by loading 1 mL of 1 g L–1of yeast culture into the reactor containing the YPD medium which resulted in a final working volume of approximately 18 mL. Yeast fermentation process was carried out until cell growth came plateaued at a stationary phase.
Electronic circuit
Figure 4 illustrates the details of the circuit design for cell OD sensing. The device operates by first producing a 47 Hz square wave as an input to the optical transmitter LED (SFH756). A modulated square wave was chosen to eliminate any signal interference from DC current signal and modulation frequency of 47 Hz was selected to avoid signal interference/noise from local AC power supply which is usually at 50 Hz. Same settings were also used by Schäpper et al. 11 and Szita et al. 12 The diode converts the electrical signal into light pulses of peak wavelength 660 nm. A 16 bit timer register within the microcontroller is configured in normal mode to toggle a digital pin on compare match. This configuration is used to produce a 47 Hz square wave on its digital pin. Using a square wave eliminates any DC errors that can be introduced into the system. Light pulses are directed by optical fiber into the microfluidic chip containing the sample to be measured and then collected at the opposite end of the chip by the PD. The maximum sampling rate of this design is 10 kHz. The signal output from the PD detector is amplified to obtain a better reading for the OD measurements. The amplification subsystem consists of an operational-amplifier (LM358) where it was designed to act as a non-inverting amplifier with a gain of 2. The amplifier provides a linear relation between the input and output signal voltages. The relation between the output signal voltage of the amplifier and its input signal voltage is given by
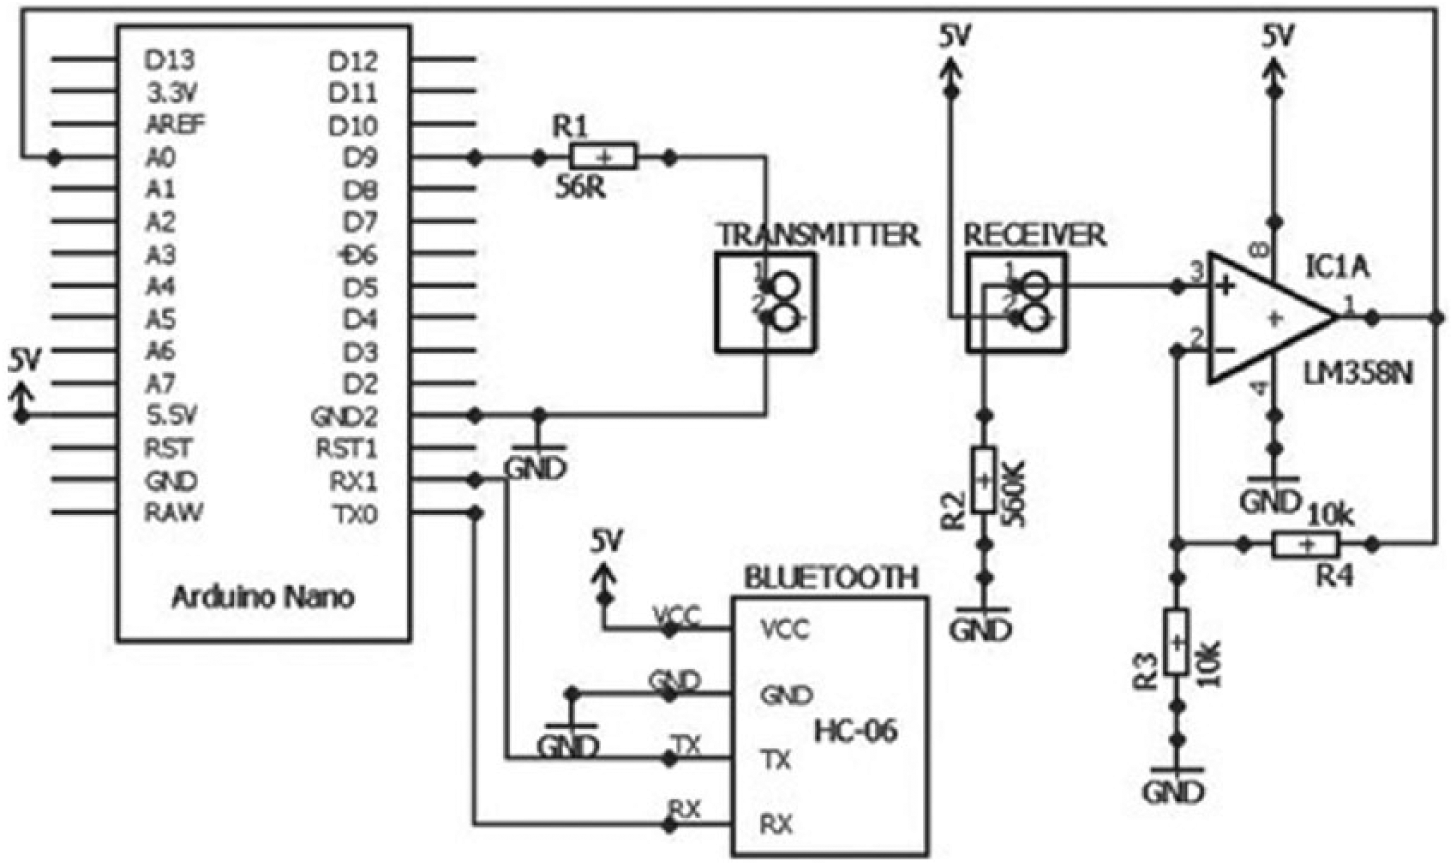
Details of the circuit design for the cell OD sending device. The main components of the circuit include the microcontroller board, operational-amplifier, and the Bluetooth transceiver module.
where Vin is the input signal voltage to the amplifier, Vout is the output signal voltage of the amplifier, Av is the gain of the amplifier, and R4 and R3 are the voltage divider resistors. R4 and R3 are set to 10 kΩ, which sets the gain of the amplifier to 2 based on Equations (2) and (3). A gain of 2 was chosen from experimental results with various liquid samples, to ensure that the output voltage does not exceed 5 V.
The microcontroller board hosts an Atmega328p microcontroller. This microcontroller has eight channels, 10-bit analog to digital converter (ADC). The microcontroller takes 0.0001 s to read a signal on its Analog input pin, which means the maximum sampling rate of the ADC is 10,000 samples per second. Ambient light was found to cause signal interference in the OD measurements. In order to reduce the noise in the output signal after analog to digital conversion, a software-based low-pass filter was used. The analog value read by the microcontroller represents both TON and TOFF of the square wave. TOFF voltage is neglected as this does not provide any useful information for this experiment. The voltage value of interest, TON, is recorded and passed through the low-pass filter. The following equations present a mathematical representation of the low-pass filter implemented in the program

where yi and xi are the sample output and input to the low-pass filter, respectively. The normalized cut-off frequency, fc used for the digital low-pass filter was 0.5. The output of the filter is averaged over 1 min, ∆t, to obtain the OD final value.
The Atmega328p microcontroller has 1024 bytes of EEPROM memory whose values are kept when the board is turned off. The final OD value is stored in the EEPROM memory with a time-stamp. OD readings are also transmitted wirelessly to an Android application in which the data are then stored as a database in the mobile phone’s memory. Wireless communications for the OD sensor is achieved using a Bluetooth transceiver module (HC-06). This module is used to transmit the OD value with the time-stamp from the Atmega328p microcontroller to the Android application for data visualization and storage. This module uses 2.4 GHz wireless transmission to transmit the data. On system power-up, the HC-06 Bluetooth starts advertising and waits for a connection from the mobile application. The mobile application when open, detects the advertising module and pairs with it. The data from the microcontroller are then transmitted over universal asynchronous receiver–transmitter (UART) serial to HC-06 Bluetooth module which then transmits wirelessly to the mobile application.
Results and discussion
Validation: OD off-line and online measurements
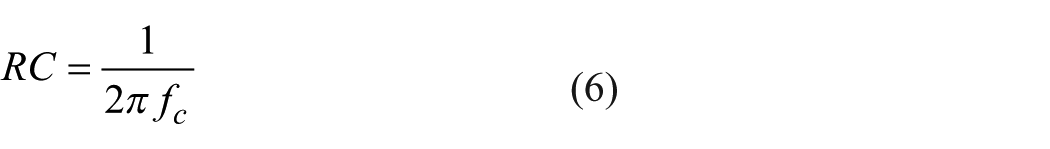
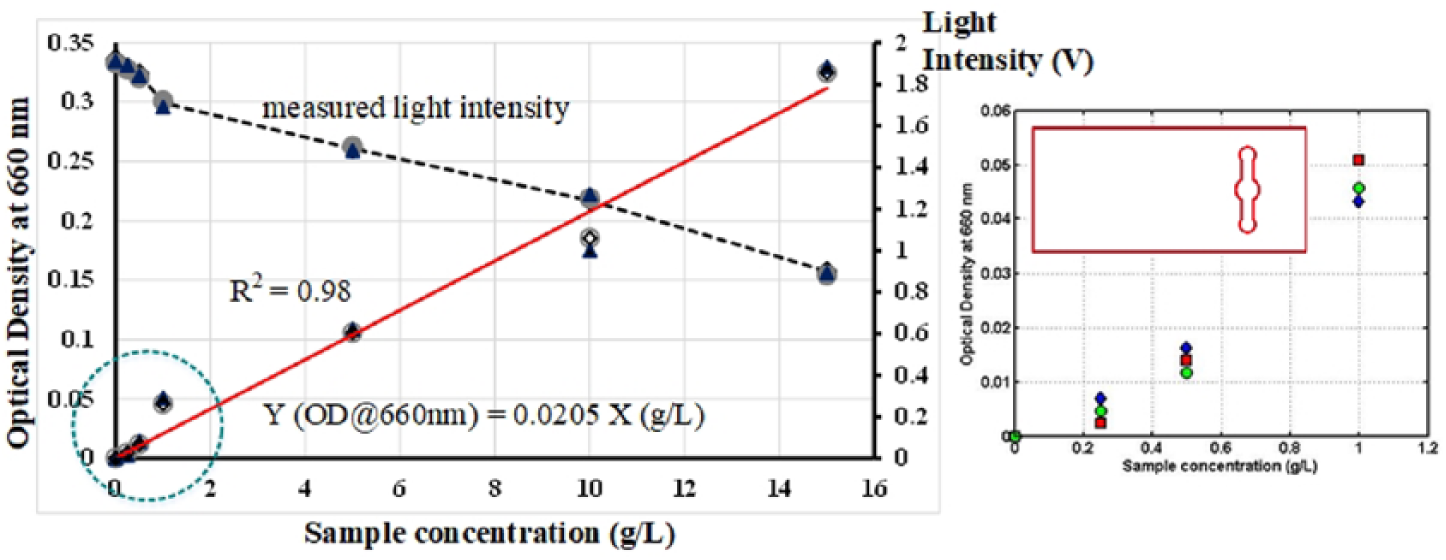
Instruments used in biochemical and/or chemical analysis can be characterized by the device specific response function; that is, an equation relating the instrument output signal to the known analyte concentration. In a microbial/molecular absorption spectroscopy such as the OD sensor presented in the work, it is anticipated that the device response would follow a typical linear trend of a Beer–Lambert equation with zero intercept to the data (Equation (1)). Since measurement conditions and the type of analyte (microbes) to be measured may differ from one experiment to another, calibration of the device is essential. Figures 5 and 6 present the plots of a calibration curve for yeast culture OD at the wavelength of 660 nm. Measurements were performed for different sample concentration ranging between 0.25 g L–1 and 15 g L–1 using two different types of microfluidic chip design. Standards for each concentration were prepared independently and not through a dilution step from a stock solution. This is important as any error resulted from the stock solution preparation would propagate through the other standards leading to a bias in the calibration. In both calibration curves, distilled water was used as blank measurement to obtain a reference voltage signal (Io) in a medium that has no cells (c = 0).
Calibration curve for yeast culture optical density at the wavelength of 660 nm. Measurements were performed for different sample concentration ranging between 0.25 g L–1 and 15 g L–1 using ODChip1. Inset shows detail plot for sample concentration lower than 1 g L–1. Also included, the values of light intensity measured for every OD measurement performed (Io = 1.9 V).
Calibration curve for yeast culture optical density at the wavelength of 660 nm. Measurements were performed for different sample concentration ranging between 0.25 g L–1 and 15 g L–1 using ODChip2. Inset shows detail plot for sample concentration lower than 1 g L–1. Also included, the values of light intensity measured for every OD measurement performed (Io = 1.97 V).
As shown in Figure 5, the experimental data followed a common trend of a Beer–Lambert law relation where the cells OD readings proportionally increased with the increasing of sample concentration. Despite some data non-linearity across the entire range of the sample concentration measured, a reasonable fit to the Beer–Lambert equation was achieved as indicated by a high regression coefficient, R2 values (R2 ⩾ 0.98). This indicated that the measurement performed is highly reproducible and accurate especially considering that measurements were repeated using triplicate samples. As can be seen from the results, the yeast cells OD, which predominantly attenuate light through scattering, display a linearity of the Beer–Lambert law to ODs of about 0.35, that is, corresponding to cells concentration of 15 g L–1. It was found that no additional dilution step was needed even when measuring OD of a sample that was saturated with yeast cells (X > 10 g L–1). Interestingly, when carrying out the OD measurements using ODChip2, an increase by at least 15%–20% in the OD readings especially at a higher cells concentration were attained (Figure 6). It is believed that this is related to the spatial distribution of cells within the designated detection area. When cells are illuminated using ODChip1 (Figure 5), the presence of a high number of cells within the detection area of the chip resulted in a more intense light scattering and hence, lowered the OD readings. On contrary, in the ODChip2, a higher portion of the incident light can be detected by the PD due to a lesser amount of cells within the detection area. The data suggested that the measurement sensitivity of the OD sensing device can also be manipulated by the design of the microfluidic chip itself. Such an option is not possible if OD measurement was performed using a conventional cuvette in a spectrometer. In an on-site analysis or point-of-need diagnosis where there is a requirement to measure OD of an unknown sample, this design feature can be handy as microfluidic chips of various channel design can be designed to cater for various measurement needs and therefore, eliminate the need to perform any sample dilution or pre-treatment steps prior to the analysis.
The functionality of the OD sensing device was also assessed from the practical point of view. Since the LED–PD pairs were securely fit into the designated compartments, misalignment or loss of signals in each measurements were not evident and hence, producing OD measurements with high reproducibility. This is indicated by a low standard deviation between for repeated measurements. A new/fresh chip is preferable but to a certain extent, OD measurements can also be performed repeatedly using the same chip. However, the chip needs to be thoroughly cleaned and rinsed to remove any cells, or solution residue, eliminating any biased cell estimation resulting from an uncleaned chip. Second, the chip has to be in an absolute dry state. From our observations, it was found that the presence of bubbles within the microchannel would disrupt the filling of the microchannel. Obviously, this is due to the large size of the bubbles compared to the size of the microchannel which significantly increased the flow resistance within the channel.
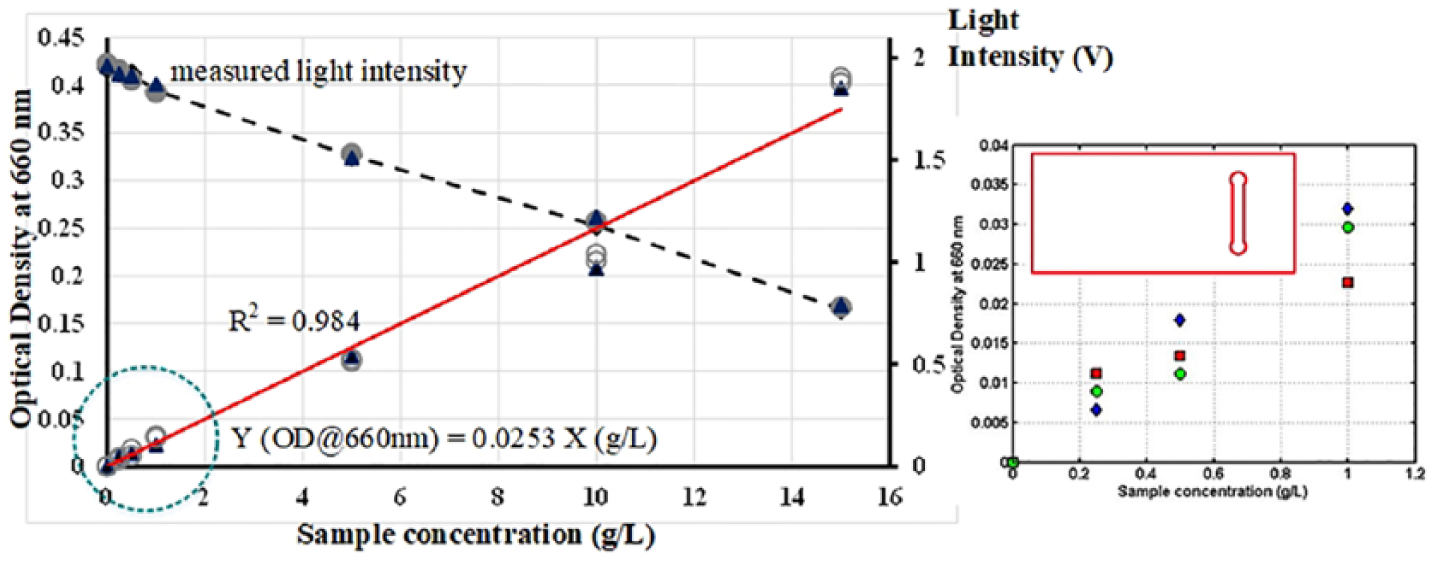
Figure 7 shows the results of the online OD measurements obtained from a yeast culture fermentation in the miniature bioreactor system. It illustrates the progress of the yeast culture growth starting from the moment the fermentation was initiated (t = 0 h) in which the cell OD data were obtained as updates transmitted to the smartphone in 1-min intervals. As can be seen in the cell growth profile, the cells underwent a lag phase for nearly 2 h where minimal cells growth was observed. After a brief lag phase to acclimate into new environment, the cells started growing exponentially reaching a maximum cell growth rate of approximately 0.404 h–1. This is indicated by the sharp increase on the OD readings at t = 130 min. During this period, it was suspected that the yeast cultures were actively utilizing glucose (reaction substrates) to form new biomass, carbon dioxide, and water under aerobic conditions.5,21 The cell growth rate, however, decelerated significantly to 0.05 h–1 before it came to a stationary phase after 30 h of cultivation. The wireless link to the smartphone for data transfer and the online monitoring of OD ran stably for the entire fermentation period without any lost data or interruption. Since the mixing of the reactor content was operated under laminar flow conditions (NRe < 100), excessive bubbles formation or an undesirable degree of turbulence that could potentially hinder the OD measurement was not evident. Also, as the measurement signal was modulated as a square wave at 47 Hz, there was no interference of signal from the ambient light. The successful application of the OD sensing device to conduct online monitoring of cell OD in a bioreactor system is another example of the measurement capacity offered by our apparatus.
Growth profiles for the S. cerevisae fermentation experiment obtained using the optical OD probe. Measured data were updated into a smartphone through a wireless communication. Inset shows the location of the OD probe within the reactor. Inset shows detail plot of transition from lag phase to exponential phase.
Discussion on the design of the OD sensor
The miniature OD sensor presented in the work was designed specifically to estimate cells OD at the wavelength of 660 nm using a plastic microfluidic chip. As illustrated in Figure 2, for the OD measurements, the chip is inserted into the gap in between the LED–PD pairs and securely held in place by three stainless steel pillars. This arrangement allows for easy chip insertion and removal. The OD sensor is also a maintenance-free device, low cost (materials costs are given in Table 1), and operated using a disposable microfluidic chip. The microchannel of the chip was designed to enable samples to passively fill the microchannel through natural capillary flow once the sample is loaded into the feed reservoir. Furthermore, the size of the chip is comparable to common microscope glass slides and can directly fit into a standard laboratory microscope platform for cell counting or viewing purposes if necessary.
Summary of the materials costs for the fabrication of the OD sensing device.
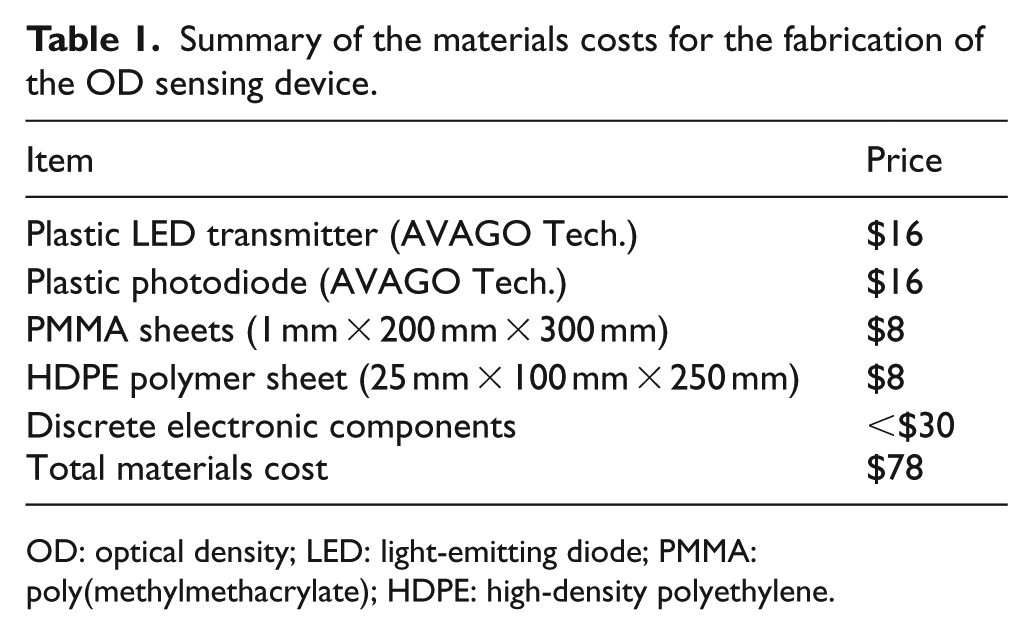
OD: optical density; LED: light-emitting diode; PMMA: poly(methylmethacrylate); HDPE: high-density polyethylene.
In our design, the LED–PD pairs are configured perpendicular to the microfluidic chip and are interfaced with two multimode optical fibers. The use of optical fibers is essential in order to minimize signal loss while ensuring a more intense illumination of the sample for accurate OD measurements. One of the benefits of using LED is its long lifetime. Plus, the setup proposed has no movable part that may break the LED. Nevertheless, light output from LED does decrease over time. Open sources have suggested that lifetime of LED (as standardized by luminaire industry) is 50,000 h and when light output decreases to 70% of its actual capacity (initial output), the LED needs to be replaced. Periodic inspection every 1000 h is recommendable to assess LED performance. Efforts have also been made to integrate the LED–PD pairs in the lateral axis however; we found that this configuration was too delicate and impractical particularly when it involves repetition of chip insertion and removal. Most OD spectrometer instruments operate with a defined optical path length but in our OD sensing device, the path length can be manually adjusted. This feature is indeed useful and enables users to accommodate different types of microfluidic chip that have different optical path lengths, usually defined by the chip thickness. Measurement accuracy can also be improved by manipulation of the path length. For example, as highlighted by Schäpper et al., 22 a shorter path length will allow for the measurement of culture with a high cells density and vice versa. Interestingly, adjustable path length would allow the user to take the advantage of the air cavities between the LED and the chip for a better sensitivity in the OD measurements. The differences between the refractive index of air and PMMA polymer allow such air cavities to also function as “air mirrors” that would reflect and/or focus the light from the LED back to the chip and hence, retaining a reasonable degree of detection sensitivity at increasing of optical path length. 16
In many microbiology laboratories, OD of bacteria cells especially S. cerevisiae and/or Escherichia coli (E. coli) has traditionally been measured at wavelength of 600 nm. Our system executed the OD measurements at 660 nm. We choose to work at this particular wavelength as we wanted to prevent any uncertainties or inaccuracy in the OD measurements that may be caused by re-emission and absorption of light from pigmentation or fluorescent proteins produced by some bacteria.1,6 In the context of cell OD measurements, the Beer–Lambert law only applies to a single-phase culture and it is normally based on the turbidity of the culture. Obviously, the method is unable to distinguish if the measured light attenuation was influenced by particle absorbance or mainly contributed by the mechanism of light scattering. Some E. coli bacteria would express red fluorescent proteins, which could be excited by light at a wavelength of 600 nm. If OD is measured at 600 nm in this condition, the incident light is reduced both by scattering effect and by absorbance via the fluorescent proteins. Absorbance by fluorescent proteins refers to the event where incident light is absorbed and reemitted in a different form of energy. This increases the relative transmission data and in turn biases the OD measurement at least by 8%–10%. 1 In contrast, bacteria with significant pigmentation such as the Chlorella vulgaris bacteria (an algae species) could substantially absorb light at lower wavelength range (i.e. ⩽600 nm) and would result in a significant signal reduction. Consequently, this unknowingly imposes faulty OD measurements. Some studies1,6 revealed that an unbiased OD estimation can be attained by performing the OD measurements at a slightly higher wavelength, that is, at the range equal and higher than 660 nm 1 or at infrared wavelength range of 870 nm. 6 At this wavelength range, the influence of the undesirable fluorescence proteins effect and light absorption by bacteria pigmentation are eliminated or very minimal. This justified our use of 660 nm for OD measurements in place of the customary wavelength of 600 nm. Also, OD measurements using the proposed setup were performed as off-line analysis in room temperature and time spent for each measurement is less than a minute. In this condition, microbial activity is very minimal or close to zero and thus, suggests that the surrounding temperature will not have any significant effect on the stability of the OD readings. As for online cells detection in the minibioreactor platform, reactor temperature was controlled at 35°C to ensure fermentation progress at optimal condition while it eliminates any temperature effect on the cells OD measurements.
In the proposed system, results attained in every measurement were directly displayed on the mobile phone screen. As for the online cells OD measurement in the minibioreactor platform, real-time data were obtained as updates to the smartphone on periodic basis (or whenever required) via wireless connection. The use of smartphones enables the user to access and remotely control the measurement instrument without the need of specialized training, all controlled using an Android application (touch-screen operations) that is accessible by anyone with smartphones or PC tablet. Moreover, data can be stored and/or easily transferred to a computer for post processing. Another advantage of linking smartphones to such a portable OD detection device is that the design of the instrument is simplified and less bulky. The proposed device has a small footprint compared to a commercial spectrophotometer and the microcontroller board can be further miniaturized if needed. We also compared the performance of the proposed device with a commercial spectrophotometer (Jenway 7310) and there was a good agreement among the cells OD measured by each device. This is shown in Figure 8.
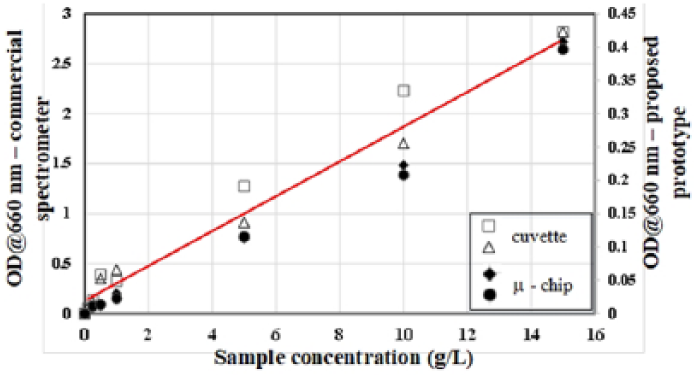
Performance comparison between our portable OD detection prototype and a commercial system (Jenway 7310). Cuvettes were used in the commercial setup whereas microfluidic chips were utilized in our OD detection device for cells OD measurements.
Conclusion and outlook
A miniature cell OD sensing platform with wireless data transmission and control using a smartphone was successfully designed and demonstrated. The device is compact, portable, and made of low-cost electronic and optical components. In order to evaluate the workability and the stability of the devices Bluetooth connectivity while performing OD measurements, a series of measurements using S. cerevisae yeast cultures were performed. The device demonstrated two significant sensing capabilities. First, its capacity to estimate cell OD for a sample ranges between 0.25 g L–1 and 15 g L–1 without any dilution steps. High R2 coefficients and low standard deviations in the measurements performed indicated that the device can be used as a reliable instrument for cell OD analysis. Second, the device can be easily reconfigured and reassembled into a miniature bioreactor system to facilitate online OD measurements for assessing the growth rates of S. cerevisae yeast cultures in real time. The use of smartphones for device control and disposable microfluidic chips as the sample carrier for OD detection introduced a more modern approach in facilitating OD measurements in laboratory environments. The Android App and interface creates an easy-to-use environment for OD analysis. In addition, data collection or even calculation of cells growth rates can be automatically stored into smartphones for further analysis. Excluding the smartphone, the device cost is less than $100 AUD and could potentially be applied in teaching, research, and industrial applications.
By exploiting advancements made in the area of microfluidics technology, the functionality of the proposed OD sensing platform can be extended. The microfluidic chip design could, for example, be modified to include heating, mixing, and actuating processes to cater for specific analysis, for example, glucose concentration. Other optical modules and wavelengths of interest (e.g. LED–PD pairs at IR range) could also be added or changed to accommodate various different analytical requirements. Future aims and direction of the work lies in making a low-cost but multifunctional optical sensing able to perform various chemical analysis relevant to the progress of a typical fermentation process using a single microfluidic chip. The electronics and the footprint of the current OD sensor design can also be further miniaturized if necessary.
Footnotes
Acknowledgements
We would like to express our thanks to the staff of Advanced Integrated Microsystems (AIM) of Deakin University who have assisted and supported the project.
Declaration of conflicting interests
The author(s) declared no potential conflicts of interest with respect to the research, authorship, and/or publication of this article.
Funding
The project is partially funded by UTM Research University Grant (Vote Q.J130000.2646.14J43).