
Abstract
Graduating from college into a recession is associated with earnings losses, but less is known about how these effects vary across colleges. Using restricted-use data from the National Survey of College Graduates, the authors study how the effects of graduating into adverse economic conditions vary over college quality in the context of the Great Recession. They find that earnings losses are concentrated among graduates from relatively high-quality colleges. Key mechanisms include substitution out of the labor force and into graduate school, decreased graduate degree completion, and differences in the economic stability of fields of study between graduates of high- and low-quality colleges.
To what extent do the adverse effects of graduating into a recession vary with college quality? Economists have long been interested in the short- and long-run consequences of exposure to negative economic shocks. Several papers have documented large and persistent negative labor market effects associated with graduating into a recession (e.g., Kahn (2010); Oreopoulos et al. (2012)), and other work has demonstrated that individuals graduating into a worse economy find it more difficult to match to a job that is compatible with their undergraduate field of study (Liu, Salvanes, and Sørensen 2016). However, comparatively less is known about how scarring effects differ between students who graduate from higher- versus lower-quality colleges. If these scarring effects are disproportionately concentrated among individuals graduating from better or worse schools, then this heterogeneity may have important implications for income inequality and intergenerational mobility. Additionally, while the existence of a college quality premium has been extensively documented in the economics literature, less attention has been paid to whether and to what extent this premium varies over the business cycle.
We study this question in the context of the 2008 financial crash and the subsequent Great Recession using restricted-use versions of the National Surveys of College Graduates (NSCG). Using a fixed effects design and leveraging variation in unemployment rates at graduation across states and over time, we find that the earnings losses of entering the labor market during a recession are larger for graduates of high-quality institutions relative to their peers who graduate from lower-quality colleges. We find that on average, a student who attends a one standard deviation higher-quality college earns approximately $3,700 more per year. However, this difference is $384 (i.e., about 10%) smaller for students graduating in a state with a one percentage point higher unemployment rate. Separating institutions into quartiles of quality reveals that this difference is driven by graduates of top-quartile colleges, who earn $2,113 less annually if they graduate from a state with a one percentage point higher unemployment rate.
Our analysis includes individuals with zero earnings, and we find that the labor force participation margin is one of the key mechanisms behind our earnings results. Among individuals who graduate into a recession, those from high-quality colleges substitute away from employment and into graduate school, whereas those from lower-quality colleges do not. Initially, one might think that this human capital investment would eventually benefit high-quality college graduates such that the negative earnings effect of graduating into a recession would disappear in the long run. In heterogeneity analyses by time since graduation, we find some evidence that the magnitude of the earnings penalties for graduates in top-quartile-quality colleges decreases over time, but we still find noisy negative point estimates when limiting the sample to six or more years post graduation. We also find that the relatively larger negative results of graduating into a worse labor market for those from higher-quality colleges persist when limiting the sample to individuals who are in the labor force and not currently enrolled in graduate school, although the magnitude of these results is attenuated from our main estimates. A similar pattern emerges when limiting the sample to individuals who are neither enrolled in graduate school nor have any graduate degrees.
We also find evidence that many of the high-quality college graduates who enroll in graduate school during a recession do not complete their graduate degrees. Although students from higher-quality colleges are more likely to enroll in graduate school, they are less likely to complete a graduate degree. Another mechanism behind our earnings results is undergraduate field of study: Students from high-quality colleges are more likely to major in fields that are more adversely affected by the recession (e.g., STEM [science, technology, engineering, and math], or social science) while students from lower-quality colleges are more likely to major in fields that are resilient over the business cycle (e.g., education). As a final mechanism, we find suggestive evidence that graduating into a recession reduces geographic labor mobility relatively more for higher-quality college graduates. These findings contribute to our understanding of the impact of recessions on equity and social mobility and may also be useful in designing and targeting policies to respond to economic downturns. As an example, both the Great Recession and the COVID pandemic prompted changes to federal student loan policy, either through expansions of borrowing limits or relief through payment pauses. Given that we find that graduates from higher-quality colleges are much more likely to respond to downturns by pursuing additional schooling, it is possible that such policy reforms in response to economic crises may have undesirable equity impacts if they primarily benefit higher-quality college graduates who have disproportionately affluent backgrounds (Chetty et al. 2020).
Literature
This article contributes to several strands of the economics literature, most directly to the literature that studies the persistent “scarring” effects of recession exposure upon labor market entry on individual outcomes (see von Wachter (2020) for a recent review). Graduating into recessions is associated with substantially depressed earnings for at least 10 years. While some work has suggested that these scarring effects fade after approximately a decade, other work has found that the effects can reemerge later in life and be near-permanent (Schwandt and von Wachter 2019; Stuart 2022). As data availability increases, a growing literature has studied the effects of the Great Recession by leveraging spatial variation in the shocks it induced, generally finding that the scarring effects associated with these shocks are severe (Yagan 2019; Rothstein 2021; Rinz 2022).
A smaller subset of this literature considers heterogeneity of scarring effects between more and less advantaged groups of individuals. Schwandt and von Wachter (2019) found that scarring effects are larger for high school dropouts relative to individuals with more education, and larger for non-white individuals than white individuals. Arellano-Bover (2022) found that the negative effects of bad labor market conditions on skill development are larger for individuals with lower parental education. Our findings that graduates of higher-quality colleges suffer greater losses than graduates of lower-quality colleges demonstrate that these patterns are not uniform, especially when focusing on four-year college graduates. Two existing articles have also considered how the effects of graduating into a recession vary by college type. Both Oreopoulos et al. (2012), who studied Canadian college students who graduated into recessions in the early 1980s and 90s, and Weinstein (2025), who studied graduates of selective colleges in the United States during the Great Recession, found that losses from graduating into a recession are larger among graduates of less-selective colleges. Compared to these studies, however, our baseline analysis captures a broader sample that more comprehensively captures heterogeneity in scarring effects among college graduates. First, our analysis includes individuals with zero earnings. This is an important distinction and reveals a difference in the conceptual model behind our analysis as compared to past work, in which we see the effect of graduating to a recession on individuals’ labor force participation as being a key mechanism explaining recession scarring. 1 This approach is also empirically motivated by our context of the Great Recession, during which real wages stayed fairly stable while employment collapsed. Additionally, we use variation across the entire college quality distribution of the United States whereas Weinstein (2025) focused on differences between graduates of elite (i.e., very high-quality) universities and the rest of the distribution. We find that these sample construction and measurement choices are important: When we restrict our sample to one comparable to Oreopoulos et al. (2012), our results resemble theirs more closely, and when we use the data and empirical strategy from Weinstein (2025) but apply our sample and college quality definitions, we broadly replicate our results. We present a deeper comparison between our work and these studies in the Comparison to Other Studies section.
Our article also fits into the broader literature on the relationship between college quality and earnings. Papers in this literature generally find that attending a higher-quality college increases earnings (Black, Daniel, and Smith 2005; Hoekstra 2009; Zimmerman 2014; Kozakowski 2023; Smith, Goodman, and Hurwitz 2025), with effects persisting up to 30 years after college attendance (Dillon and Smith 2020). 2 Our primary contribution on top of these papers is to explore how differences in earnings between graduates of higher- and lower-quality colleges vary over the business cycle.
Our work explores multiple mechanisms behind the main earnings effects, many of which have been studied in previous literature. First, our work contributes to the literature on how recessions affect higher education enrollment. Much work has demonstrated the countercyclicality of undergraduate college enrollment (e.g., see Bičáková et al. (2025) and references therein), including in the context of the Great Recession (Barr and Turner 2013; Long 2014). We find that these countercyclical enrollment patterns hold for graduate enrollment as well, particularly for graduates from high-quality undergraduate institutions. Bedard and Herman (2008), Kahn (2010), and Altonji, Kahn, and Speer (2016) also studied the effects of economic downturns on graduate school enrollment and graduate degree attainment over earlier periods. Findings are mixed across recession measures and demographic groups. We add to these findings by investigating how graduate school enrollment during recessions varies by undergraduate college quality. Our findings of large positive graduate enrollment effects but negative graduate degree completion effects among graduates of high-quality undergraduate institutions suggest differences in previous estimates may be attributable to heterogeneity in effects by college quality or the distinction of measuring graduate school enrollment versus completion.
Finally, our work relates to the literature on the relationship between labor markets conditions and major/occupation. Altonji et al. (2016) found that the negative effects of graduating into a recession are concentrated among lower-paying majors, but the effects of the Great Recession are more evenly distributed across majors than earlier recessions. We focus on broad major categories and find that STEM and social science graduates experience relatively worse effects of graduating in a worse economy, while education majors perform better. Prior work has also found that the teaching profession is more stable through recessions than other occupations (Kopelman and Rosen 2016; Nagler, Piopiunik, and West 2020; Deneault 2023). Another potential mechanism is cyclical skill mismatch (i.e., when an individual is working in a field requiring skills that differ from the field in which they were trained). Previous literature has explored this, such as Liu et al. (2016) who found that the likelihood of skill mismatch at a worker’s initial job is higher in worse economic conditions. We explore this effect and how it varies over college quality but do not find any evidence for meaningful heterogeneity. We also investigate changes in geographical mobility as a mechanism for earning losses. Yagan (2014) found that migratory insurance (i.e., individuals in heavily shocked areas move to more prosperous areas for economic opportunity) played a relatively small role in the Great Recession compared to earlier recessions. We find suggestive evidence that graduates of higher-quality colleges are more prone to decreases in interstate mobility, which could contribute to their larger earnings losses relative to lower-quality college graduates.
Data and Summary Statistics
We use restricted-access versions of the National Survey of College Graduates (NSCG) 2010, 2013, 2015, 2017, and 2019 accessed through the Census Research Data Center (U.S. Census Bureau 2023). The NSCG sample is drawn from the American Community Survey and includes individuals who have earned a bachelor’s degree and reside in the United States or Puerto Rico. We restrict our sample to include individuals who earned their degree between 2000 and 2012 to focus on the Great Recession while maintaining a reasonably narrow range of cohorts and ages among individuals in the sample. These sample restrictions imply that respondent’s earnings are measured between 1 and 19 years after they graduate from college. Although we are interested in the dynamics of scarring effects over time, we are limited in how much we can explore due to statistical power, so our main estimates pool across all years since graduation (i.e., our main estimates can be interpreted as a weighted average of the effect on earnings between one and 19 years after college graduation). We present heterogeneity analyses with coarse measures of years since graduation and find suggestive results that the negative effects for high-quality college graduates persist past six years since graduation. 3
The restricted-use version includes information on the exact college from which respondents obtained their degrees, which we link to the Integrated Postsecondary Education Data System (IPEDS) to construct the quality of the college attended (U.S. Department of Education 2021). Following Dillon and Smith (2020), our college quality measure is an index combining the pseudo-median SAT 4 score of entering students (midpoint of 25th and 75th percentiles), the applicant rejection rate, the faculty–student ratio, and the average salary of faculty engaged in instruction.
We acknowledge that college quality is not directly measurable in available data, so one should consider our college quality measure a useful summary measure of college inputs that proxy for quality. The individual measures capture key features of academic institutions that predict student success, in particular peer quality (captured by SAT scores and rejection rates) and instructional quality (captured by class sizes and faculty salary). To the extent that faculty salaries are likely to be positively correlated with spending on other features (such as career services, advising, or extracurricular offerings), these measures may also be useful for capturing other salient university features that are not directly included in our college quality measure. Prior work has found that combining several proxies for quality reduces measurement error (Black and Smith 2006); therefore, we use our composite measure for most analyses. However, to demonstrate that our results are not sensitive to this particular combination of quality proxies, in the Robustness section we show that our key findings are robust to using the individual subcomponents of our college quality index.
To construct the index, we take the first principal component of our four proxies and use it to calculate percentiles of our index across the enrollment-weighted distribution of four-year non-specialty colleges in the United States. 5 In our specifications, we use both a standardized version of this continuous measure and an alternative measure that includes indicators for each quality quartile. We observe college graduates only, so our analysis may be understating the degree to which labor market outcomes vary by college quality since higher-quality colleges boost graduation rates (Cohodes and Goodman 2014; Dillon and Smith 2020).
Table 1 presents summary statistics for our sample. Linking individuals to their institutions of graduation requires that they graduate from a US college, which forces us to drop any individuals in the sample who obtained their degree from an international college before moving to the United States. We present summary statistics for our sample both with and without these dropped individuals. The restriction reduces the proportion of Asian individuals in the sample, but other variables such as income, unemployment, and rates of graduate degree attainment do not change meaningfully, suggesting that linking individuals to their exact institution of study does not inject meaningful selection into the sample. As the sample includes only those who obtained a college degree, it is not representative demographically or economically of the United States as a whole.
Summary Statistics
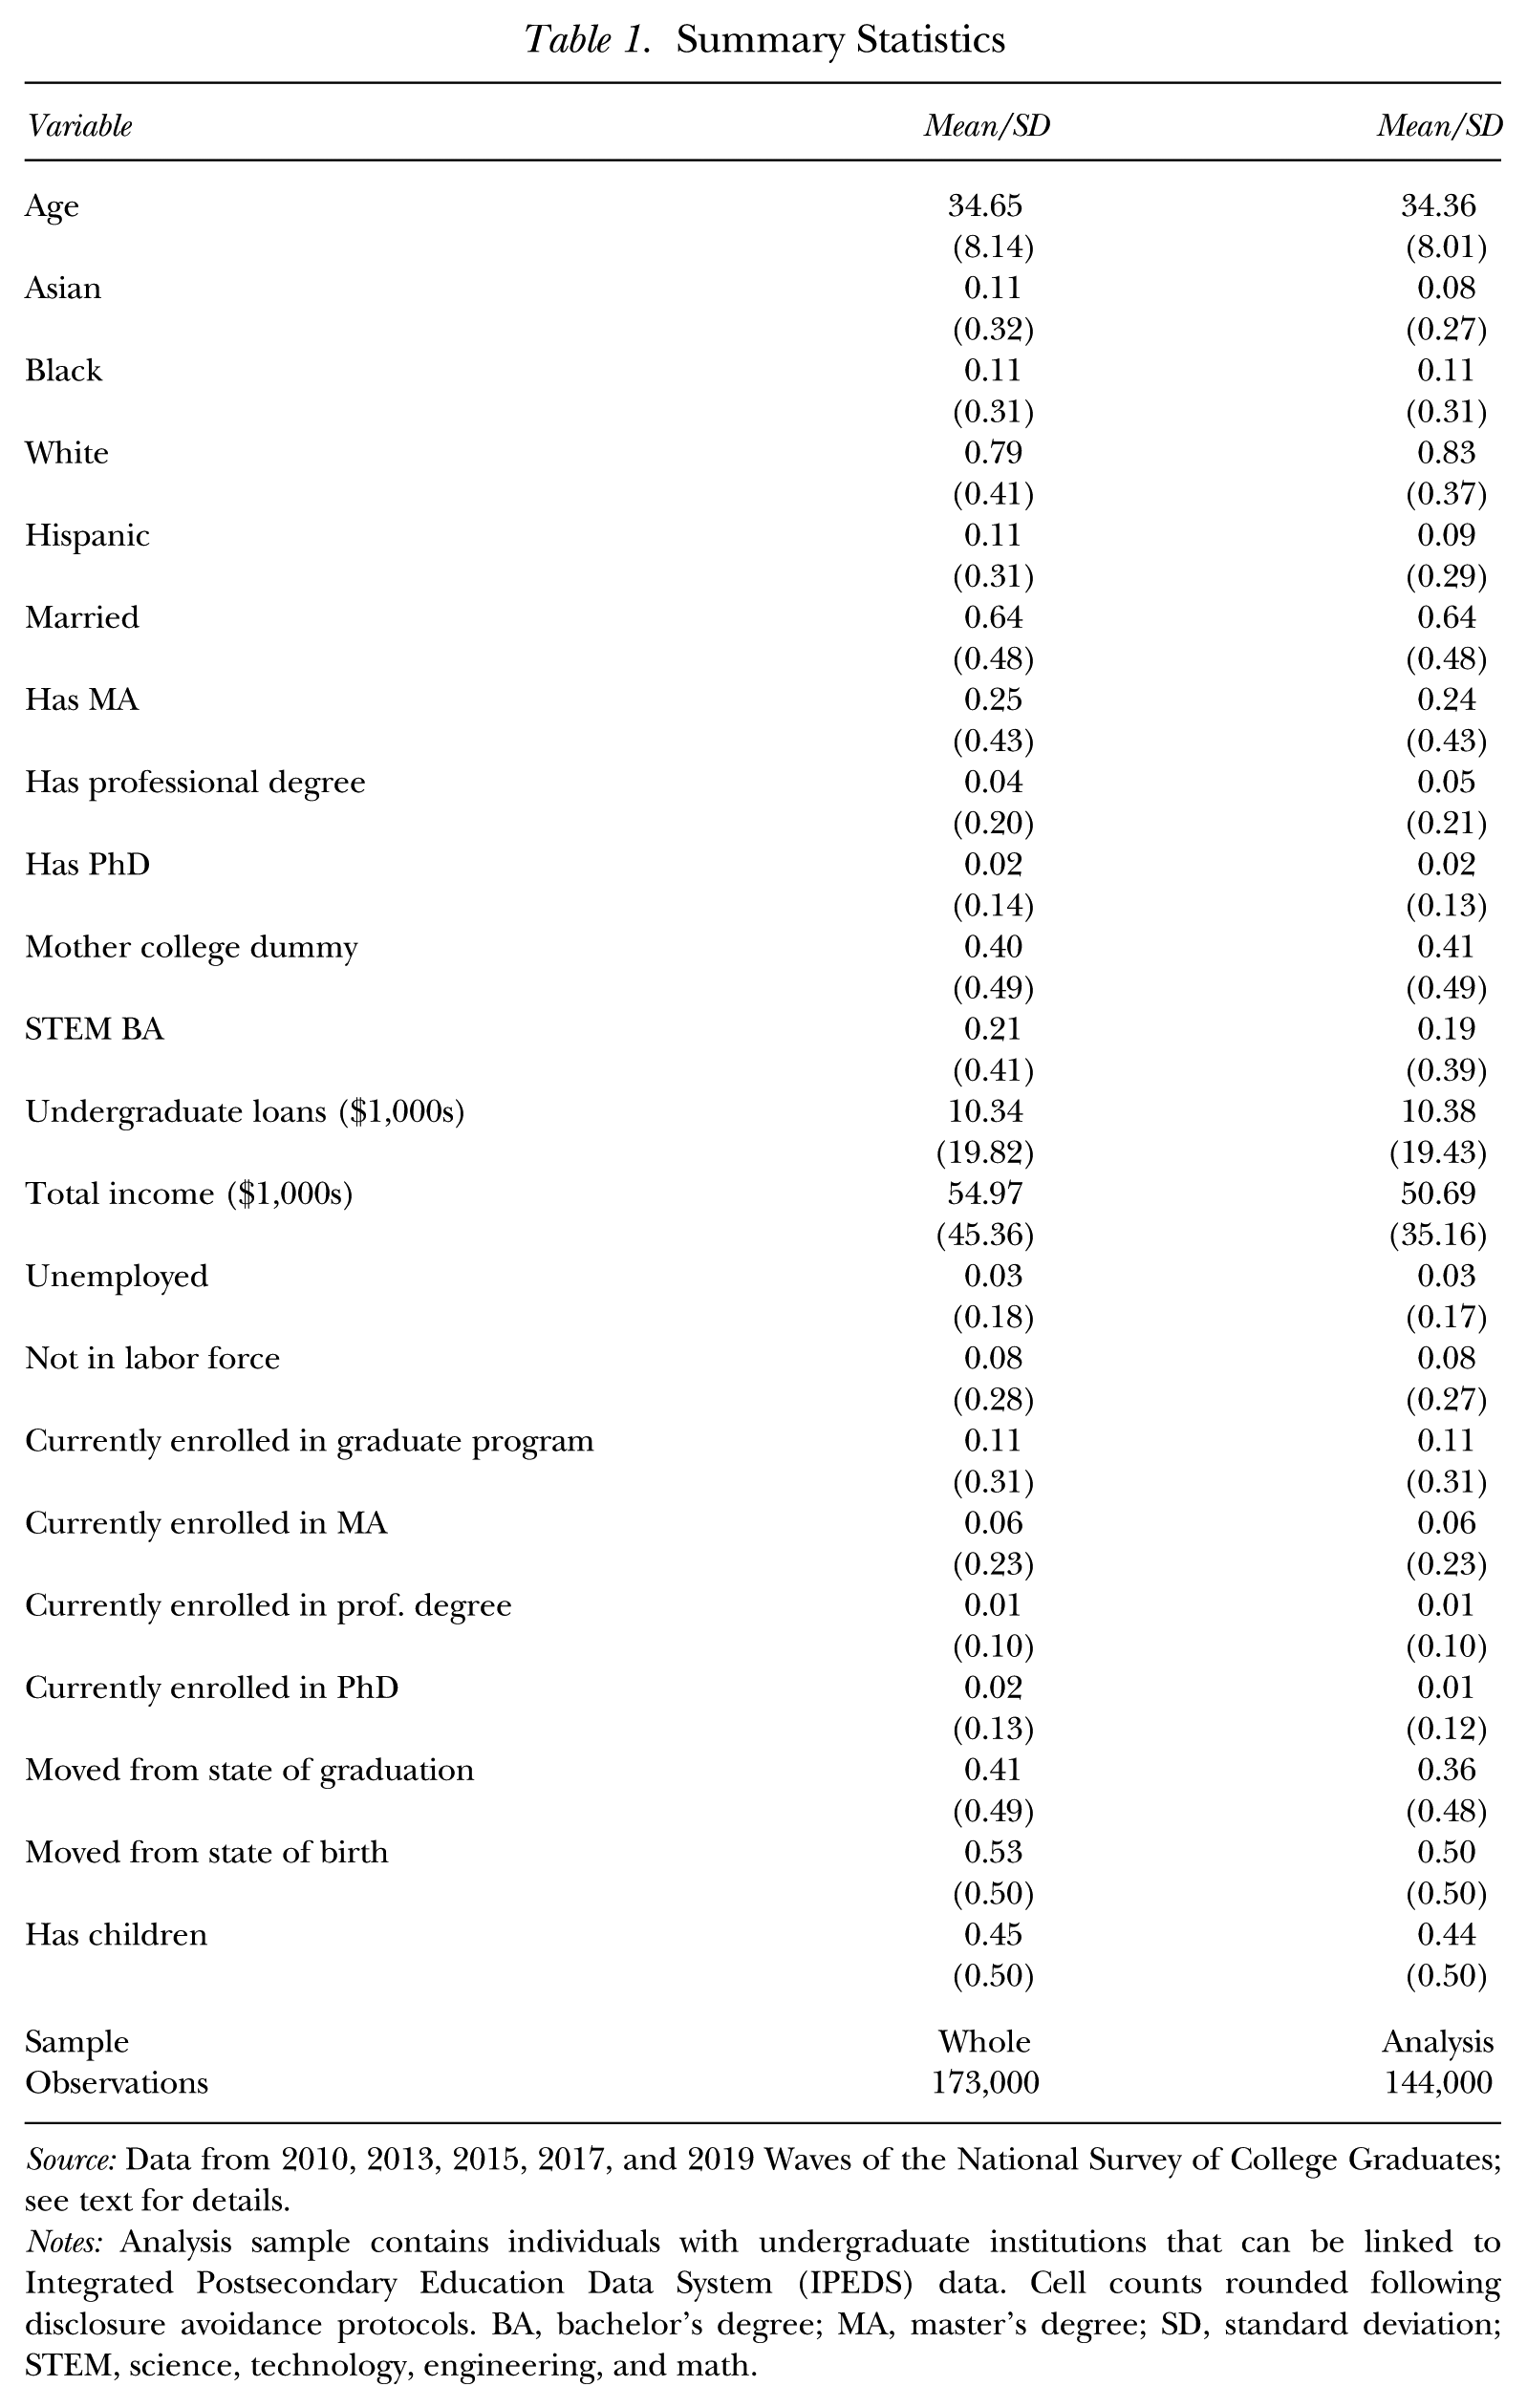
Source: Data from 2010, 2013, 2015, 2017, and 2019 Waves of the National Survey of College Graduates; see text for details.
Notes: Analysis sample contains individuals with undergraduate institutions that can be linked to Integrated Postsecondary Education Data System (IPEDS) data. Cell counts rounded following disclosure avoidance protocols. BA, bachelor’s degree; MA, master’s degree; SD, standard deviation; STEM, science, technology, engineering, and math.
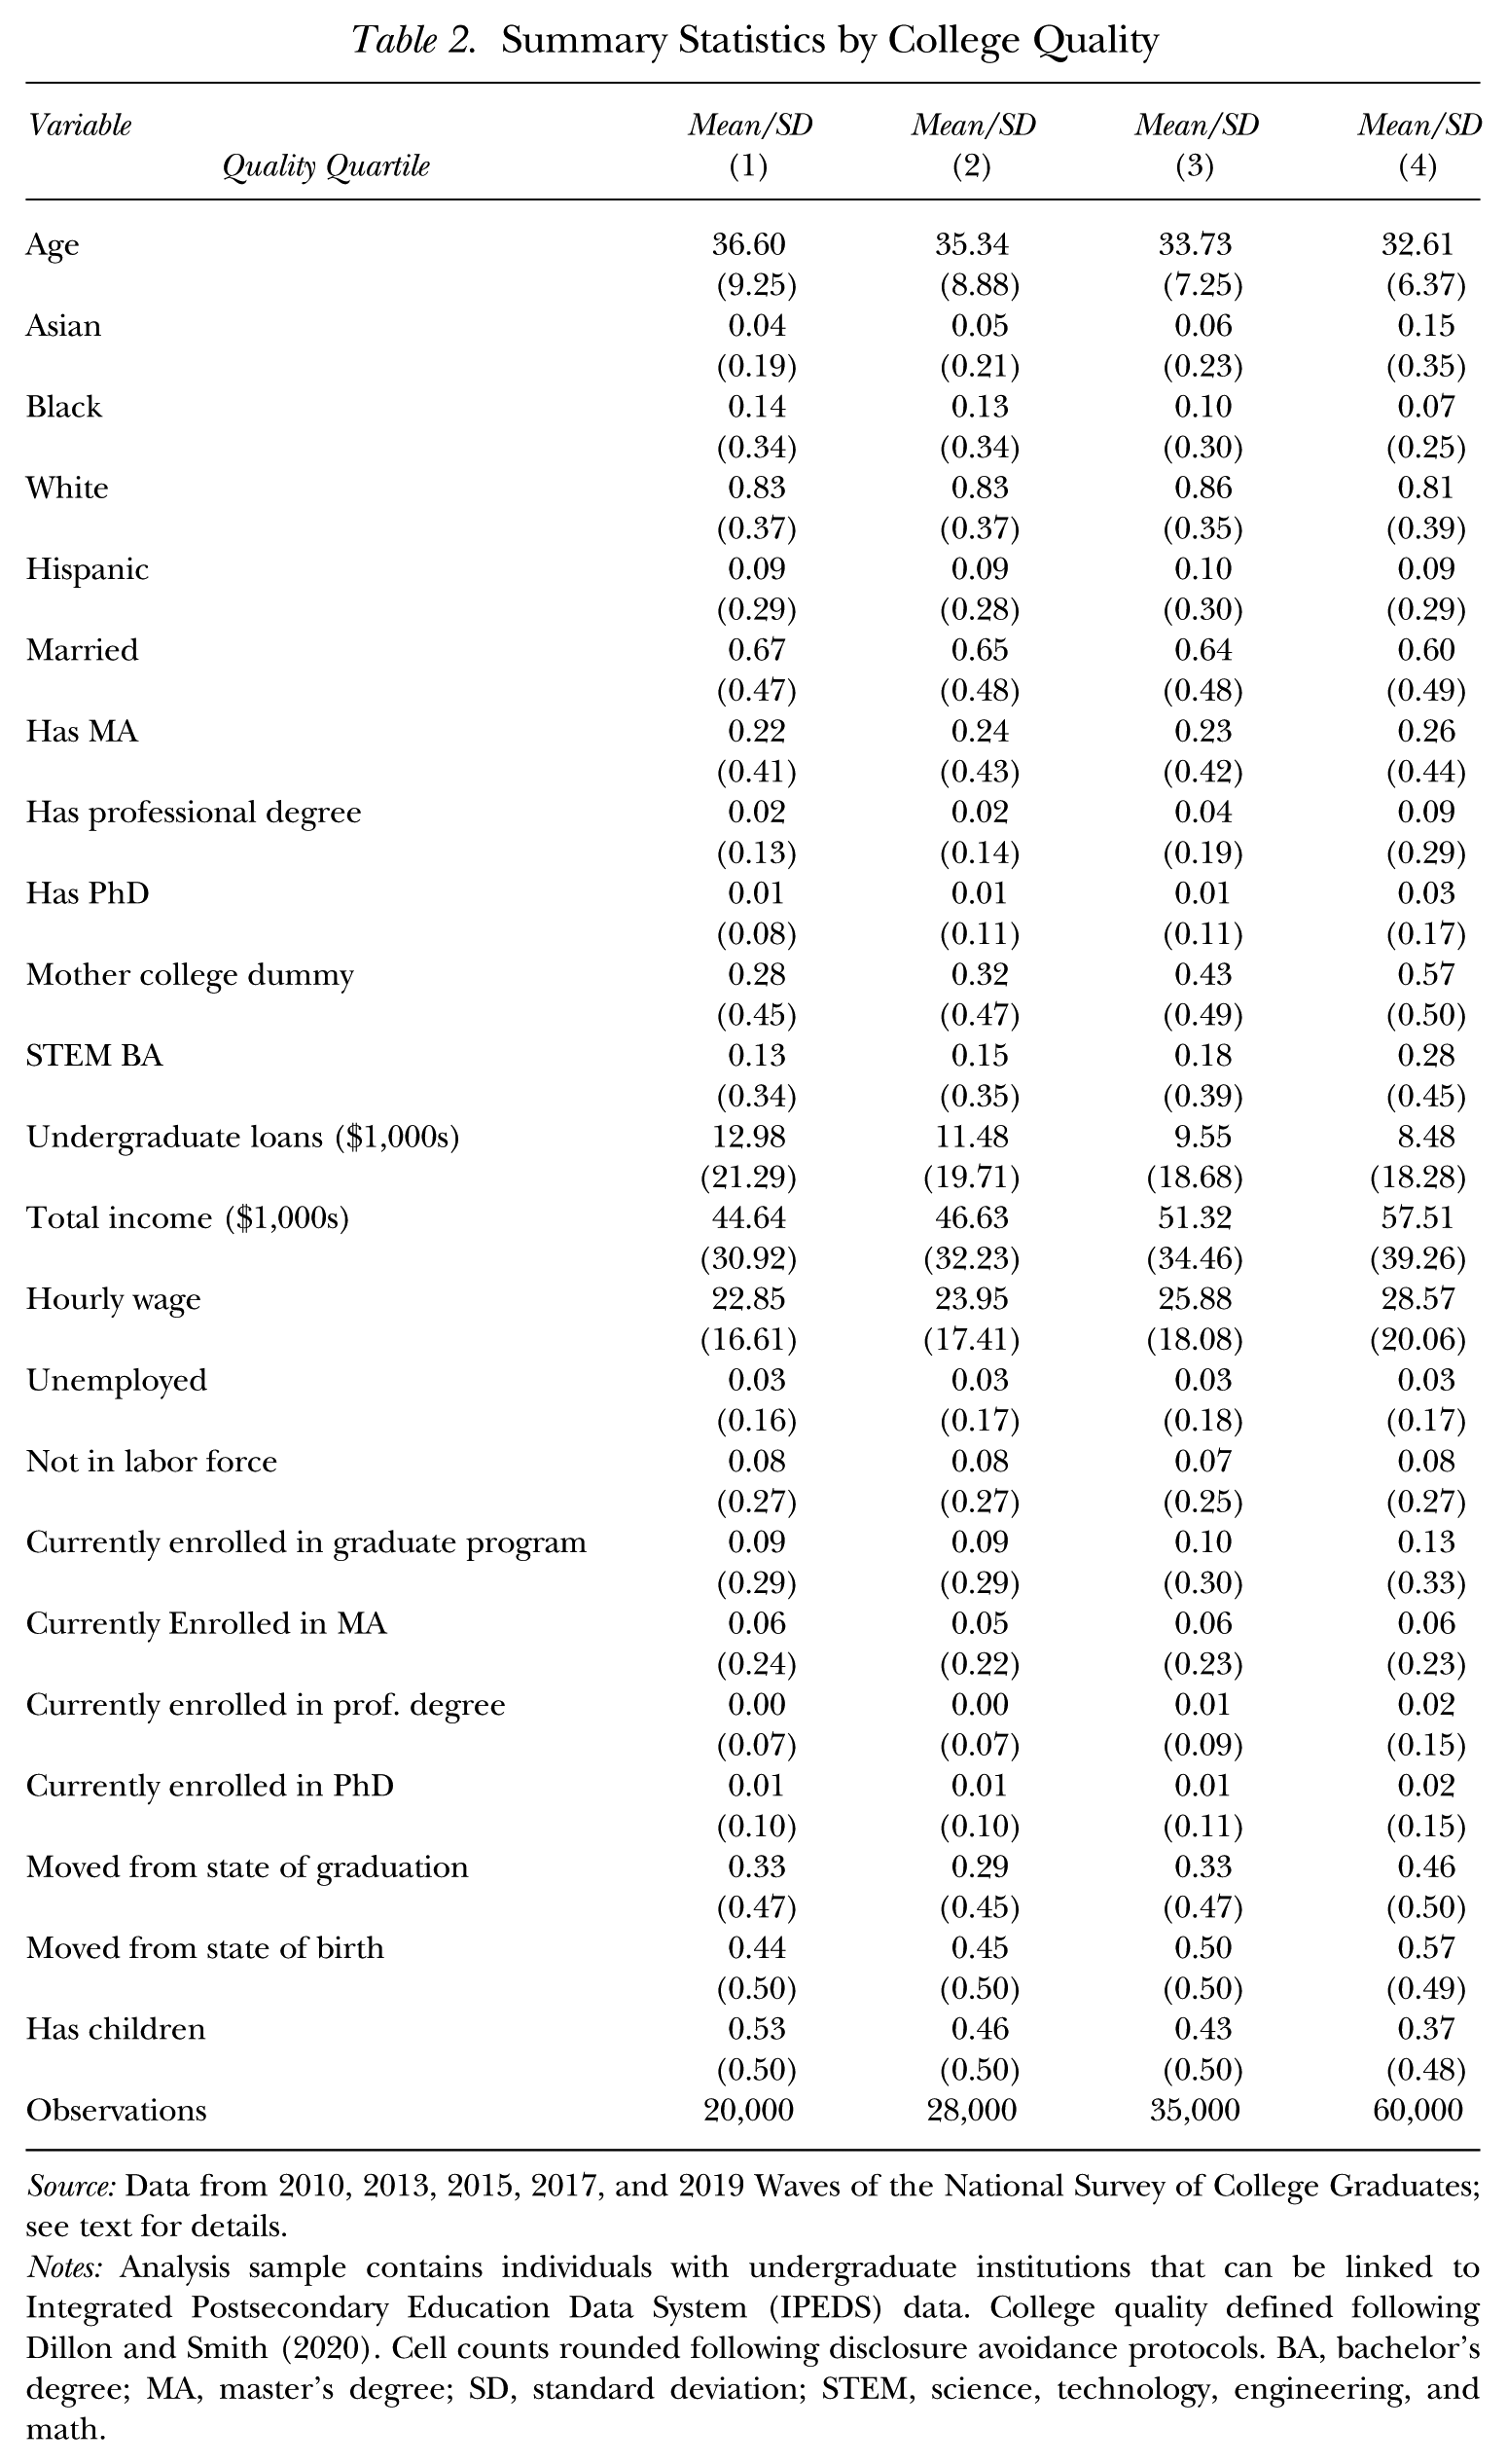
Table 2 presents summary statistics for the analysis sample, broken down by college quality quartile. 6 A few differences emerge. Demographically, the proportion of Asian students increases with college quality, especially for top-quartile graduates, while earnings, graduate degree attainment, maternal education, and likelihood of completing a STEM bachelor’s increase monotonically as we move up the quality distribution. The graduates of lower-quality colleges are also older on average, reflecting a higher share of them completing non-traditional college paths. Respondents in our sample are, on average, in their early-to-mid 30s, which means that the average effects we estimate in our specification will be capturing the effect of worse unemployment rates upon graduation after a moderate amount of time in the labor market. We will, however, conduct heterogeneity exercises by years of potential experience in an effort to better understand dynamic effects. Graduates of higher-quality colleges are also generally more likely to move away from their state of graduation and/or state of birth.
Summary Statistics by College Quality
Source: Data from 2010, 2013, 2015, 2017, and 2019 Waves of the National Survey of College Graduates; see text for details.
Notes: Analysis sample contains individuals with undergraduate institutions that can be linked to Integrated Postsecondary Education Data System (IPEDS) data. College quality defined following Dillon and Smith (2020). Cell counts rounded following disclosure avoidance protocols. BA, bachelor’s degree; MA, master’s degree; SD, standard deviation; STEM, science, technology, engineering, and math.
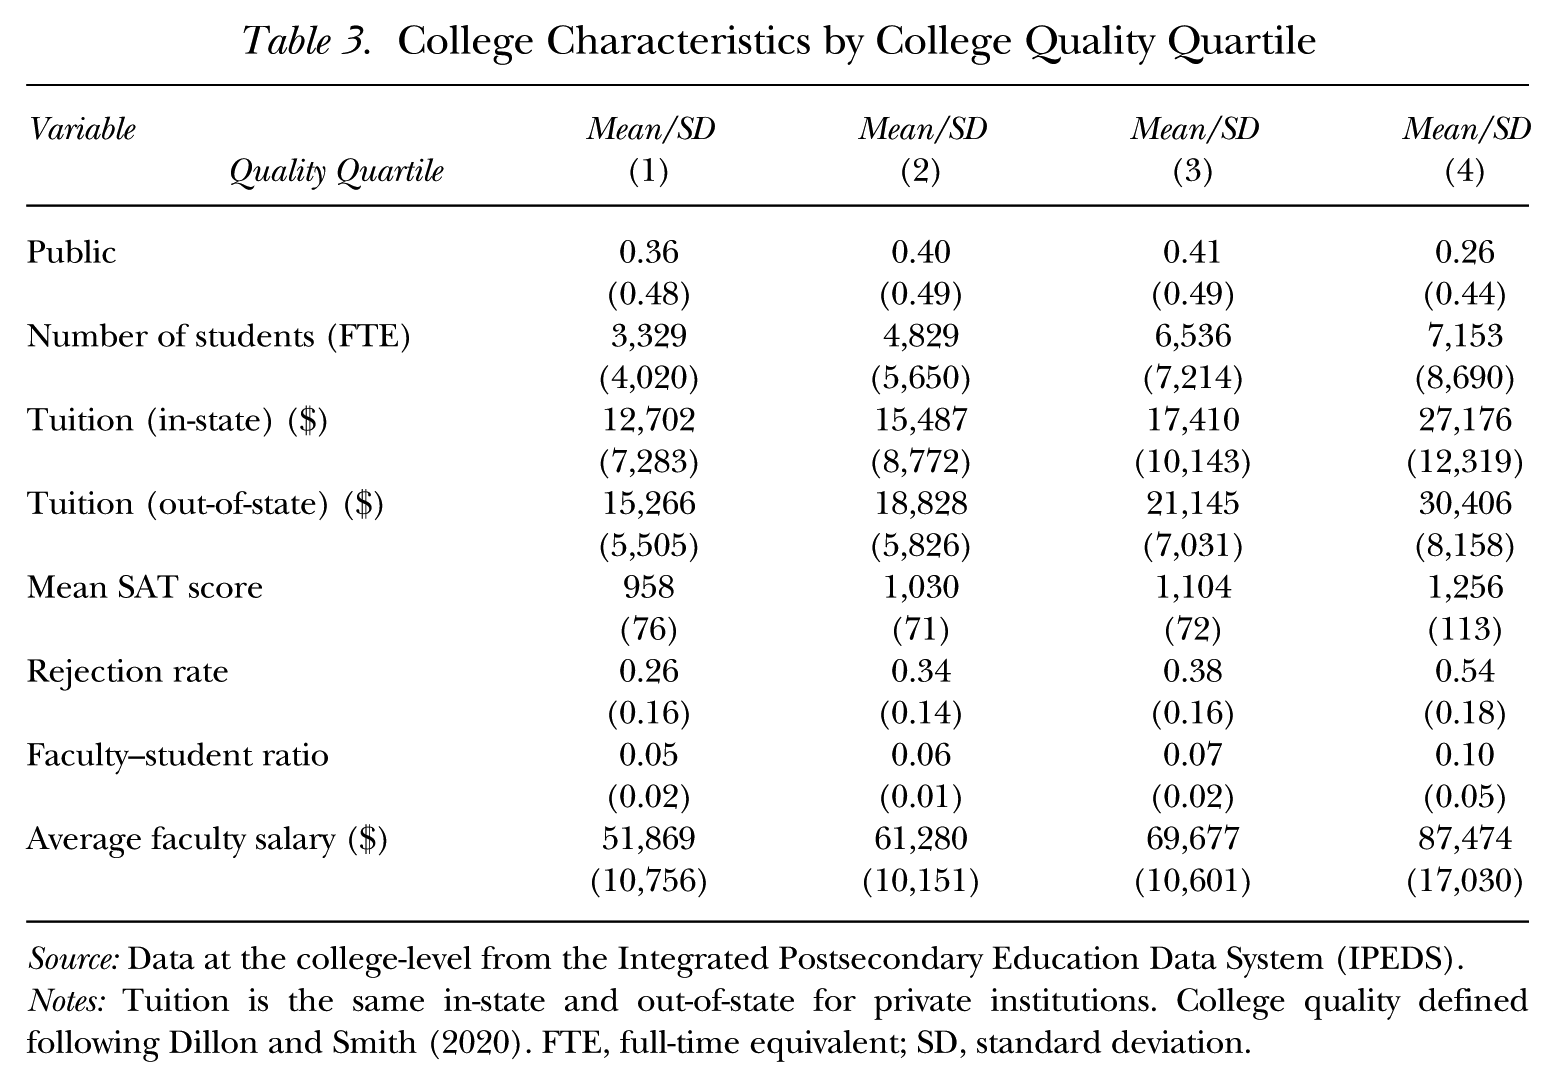
Because level values of our continuous quality measure are difficult to interpret on their own, Table 3 reports summary statistics of the colleges themselves over the quality distribution. Higher-quality colleges, on average, have larger student populations and higher tuition. The percentage of public colleges in each quality quartile is increasing over the bottom three quartiles but is lowest for the top quartile. Mechanically, each of the proxies of college quality (mean SAT scores, applicant rejection rate, faculty–student ratio, and average faculty salary) increase over the distribution. We find it notable that, for each of these proxies, the largest jump between quartiles occurs between the third and top quartiles.
College Characteristics by College Quality Quartile
Source: Data at the college-level from the Integrated Postsecondary Education Data System (IPEDS).
Notes: Tuition is the same in-state and out-of-state for private institutions. College quality defined following Dillon and Smith (2020). FTE, full-time equivalent; SD, standard deviation.
Empirical Strategy
To first understand the main effects of graduating into a worse labor market and graduating from a high-quality college, we estimate:

where Yistr is an outcome variable of interest for individual i who graduated in year t from a college in state s and was surveyed in year r. The specification includes survey year fixed effects ϕr to strip out macroeconomic trends, state of graduation fixed effects γs to control for differences in state means in the outcome variable, and cohort fixed effects θt to account for changes in outcomes common across all graduates of a particular year. The combination of the survey year and cohort fixed effects controls for years of potential experience since graduation. We also include a vector of individual characteristics Xi, which includes indicators for race, sex, ethnicity, and mother’s and father’s education level. The main variables of interest are Ust, the unemployment rate of the state s from which individual i graduated in year of their graduation t, and Qi, the quality of i’s college of graduation.
The coefficient α1 represents the effect of graduating into a labor market with a one percentage point higher unemployment rate. The identifying variation comes from individuals within a cohort graduating into different local labor market conditions depending on their state of graduation. This specification is in keeping with previous entries of the literature that have studied the scarring impacts of the recession, allowing us to gauge the face validity of our estimate of α1 by benchmarking it against other estimates in the literature. Meanwhile, individuals who graduate from a one standard deviation higher-quality college earn α2 dollars more, on average, which we will compare to other estimates of the returns to college quality. 7 We include an error term ϵistr and cluster our standard errors at the state of graduation by cohort level. 8
To assess heterogeneity in the effects of the recession over college quality, we next estimate the specification:

The parameter of interest α3 quantifies the extent to which the impacts of graduating into a worse labor market differed for individuals based on the quality of the college from which they graduated. A positive sign would imply that graduates from higher-quality colleges were harmed relatively less by graduating into a bad labor market than their peers from lower-quality colleges. Conversely, a negative sign would imply the college quality earnings premium is smaller during recessions than it is during good times. We also include the unemployment rate interacted with cohort fixed effects θt and individual controls, Ust
Because we do not have exogenous variation in college quality, we interpret our results as differences in the scarring effects of recessions between graduates of higher- and lower-quality colleges, but not necessarily the causal effect of attending a higher-quality college on scarring effects. We control for some of the selection into college quality by including the following individual characteristics in
A natural question is whether the state-level unemployment rate is the most relevant measure of college graduates’ labor market. In the Robustness section, we explore how our results are affected by using alternative unemployment rate measures. First, we use data from LinkedIn on where colleges’ graduates locate, collected by Conzelmann et al. (2022b), and find little difference in results from our baseline analysis using state-level unemployment rates (Conzelmann et al. 2022a). We also present results that use the national unemployment rate as the source of variation. An advantage of this analysis is that it focuses directly on the effects of graduating into the Great Recession as opposed to being located in local labor markets that were more or less affected by it; its limitation is that it prevents us from being able to include cohort fixed effects due to immediate collinearity issues. Still, the general conclusions from this analysis confirm our main results, shown in Tables A.2 and A.3.
Our primary outcomes of interest are earnings and labor force participation. In our main specification, we measure earnings in levels and winsorize at the 95th percentile to prevent the large right tail in earnings among college graduates from dominating our results. To measure labor force participation, we estimate linear probability models with the following indicator variables as outcomes: employed, unemployed, out of the labor force, and current enrollment in graduate school. We explore the sensitivity of our results under alternative functional forms and alternate earnings outcomes in the Robustness section and find that our main conclusions hold across a wide range of modeling choices (i.e., logs, hourly wages, winsorizing at the 99th percentile, inverse hyperbolic sine transformation, median regression).
Results
Baseline
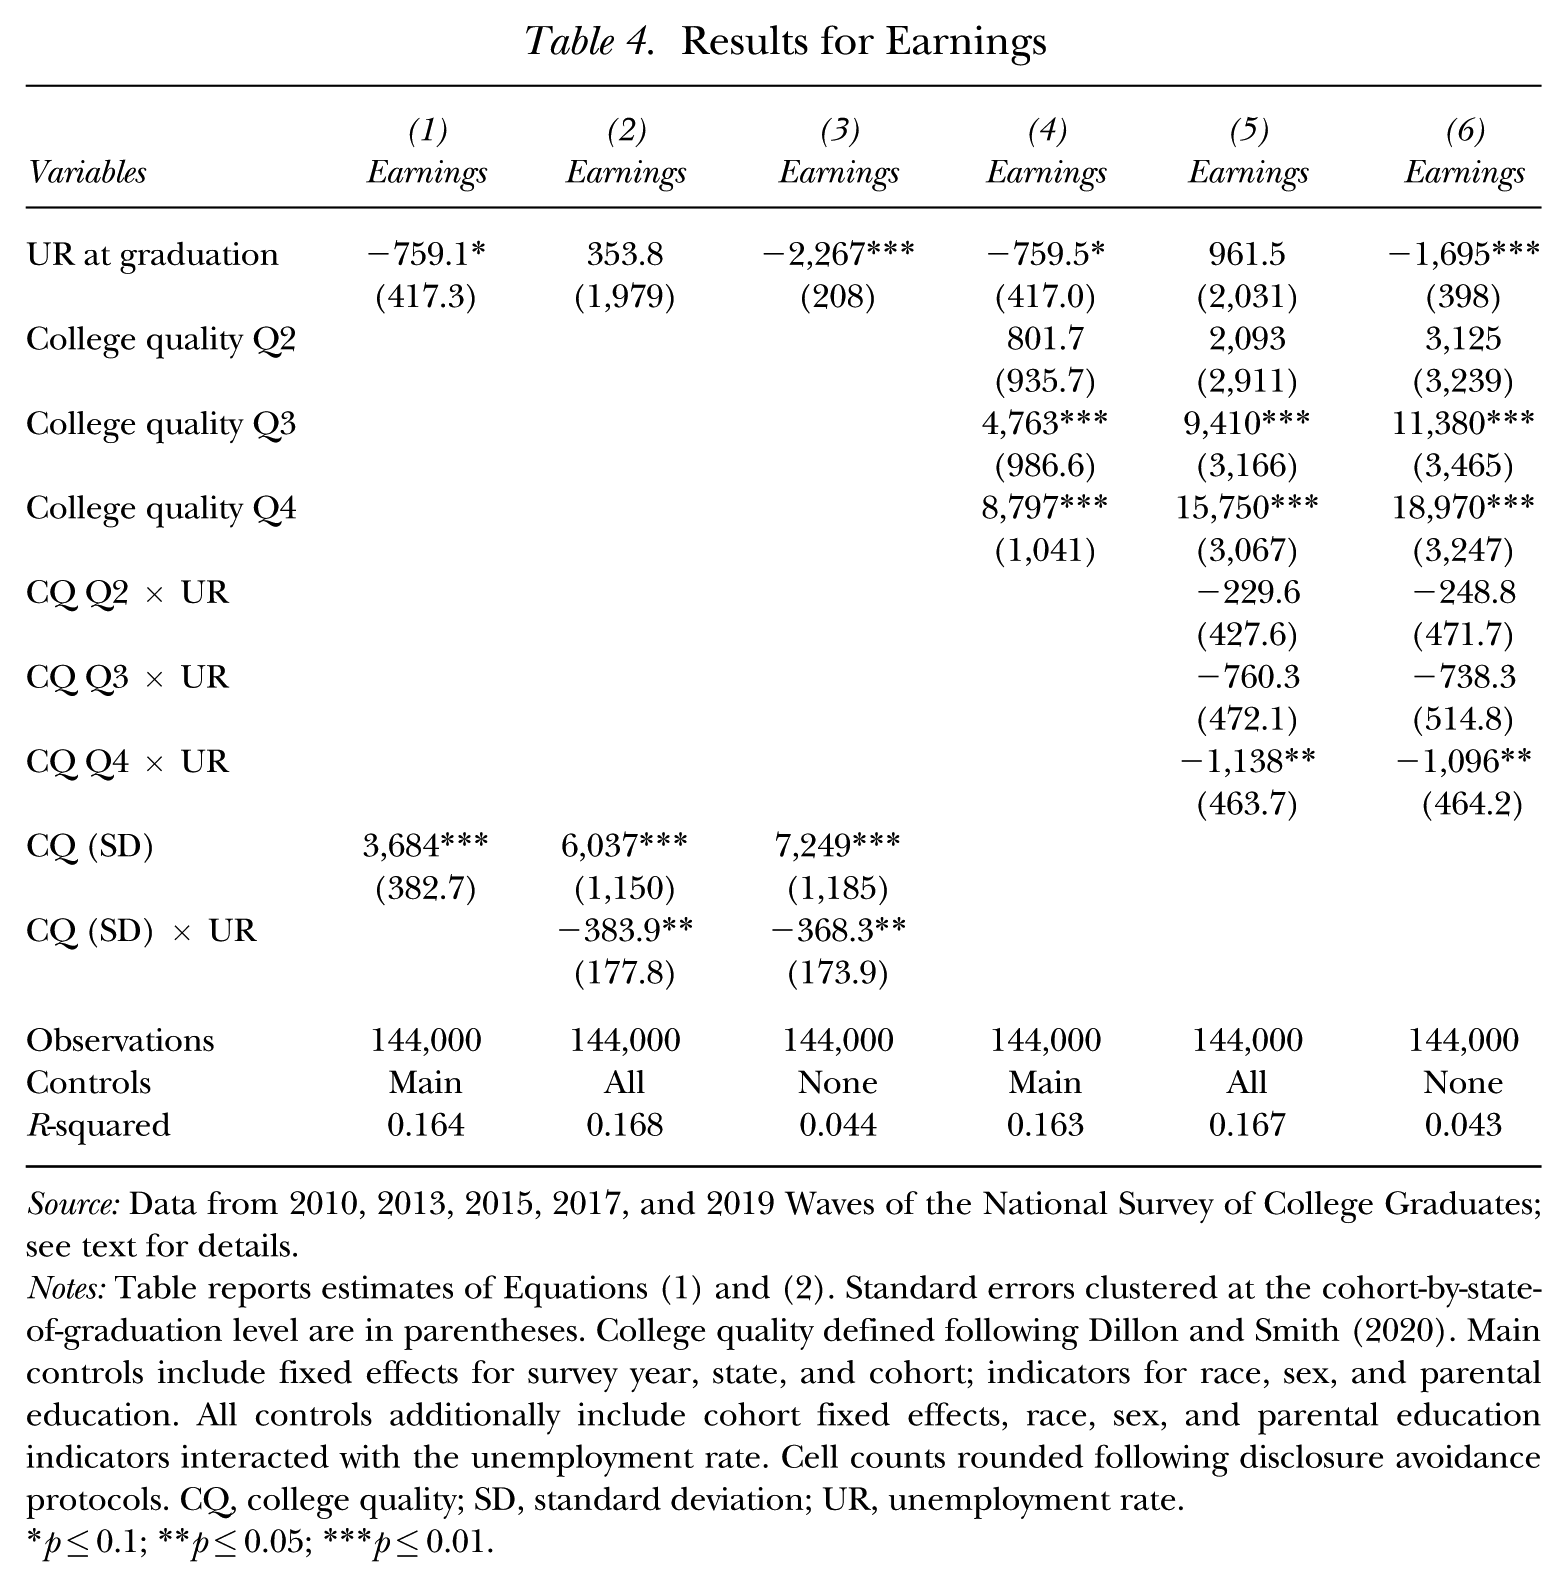
Table 4 shows our baseline results from estimating Equations (1) and (2), in which the outcome is annual earnings. We do not condition on labor force participation, so individuals with zero earnings are included. 11 The first column focuses on the separate effects of the unemployment rate and college quality on annual earnings. On average, we find that students who graduate from a one standard deviation higher-quality college earn approximately $3,700 more annually. This generally aligns with Dillon and Smith (2020), who found using the National Longitudinal Survey of Youth 1997 (NLSY-97) that a 30 percentile increase in college quality (the rough equivalent of our one standard deviation increase) for a middle-ability student increases earnings by approximately $4,400. The estimate of Ust implies that, holding our control variables constant, a one percentage point increase in the state unemployment rate upon graduation decreases annual earnings by approximately $759, which is consistent in magnitude with previous studies.
Results for Earnings
Source: Data from 2010, 2013, 2015, 2017, and 2019 Waves of the National Survey of College Graduates; see text for details.
Notes: Table reports estimates of Equations (1) and (2). Standard errors clustered at the cohort-by-state-of-graduation level are in parentheses. College quality defined following Dillon and Smith (2020). Main controls include fixed effects for survey year, state, and cohort; indicators for race, sex, and parental education. All controls additionally include cohort fixed effects, race, sex, and parental education indicators interacted with the unemployment rate. Cell counts rounded following disclosure avoidance protocols. CQ, college quality; SD, standard deviation; UR, unemployment rate.
p≤0.1; **p≤0.05; ***p≤0.01.
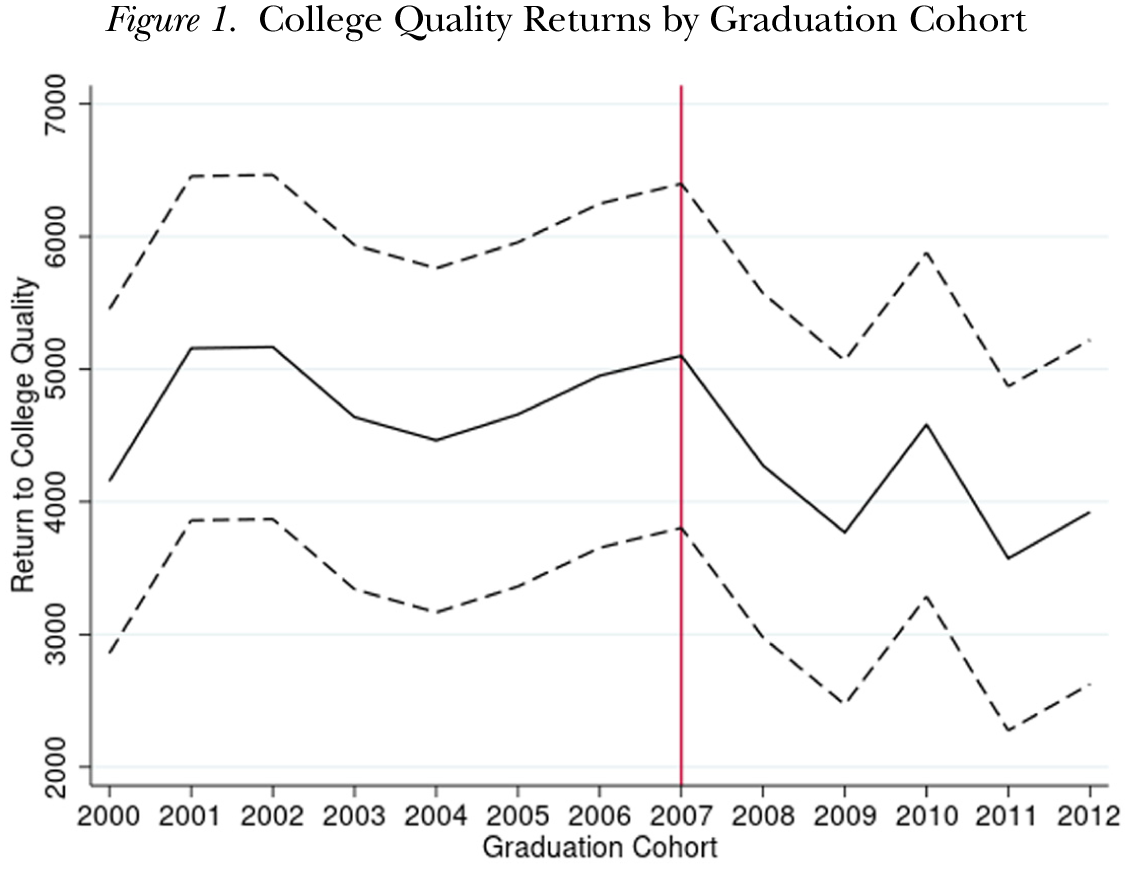
In the second column of Table 4, we additionally include an interaction term of the unemployment rate and college quality, which gives insight into how scarring effects vary with college quality. We find that a one percentage point increase in the unemployment rate shrinks the earnings advantage of a one standard deviation increase in quality by approximately $384, roughly 10% of the baseline college quality differences we find in the specification without the interaction. 12 This result may also be viewed graphically in Figure 1, in which we estimate earnings returns to an increase in college quality separately for each graduation cohort from 2000 to 2012: The returns hold roughly steady from the cohorts of 2000 to 2007 before appearing to drop in 2008 when the recession began. Despite the noise in the figure, the estimated return to college quality for the 2009, 2011, and 2012 cohorts are statistically significantly different from the 2007 cohort at the 10% level or less, and robustness tests we conduct later that pool cohort coefficients into pre- and post-2007 groups detect differences that are strongly significant, both statistically and substantively. In column (3), we repeat the specification from column (2) but omit all control variables. This column highlights that while the inclusion of the controls substantively affects estimates of the returns of college quality, they do little to the estimates of the impact of the interaction between college quality and local labor market conditions on earnings. 13
College Quality Returns by Graduation Cohort
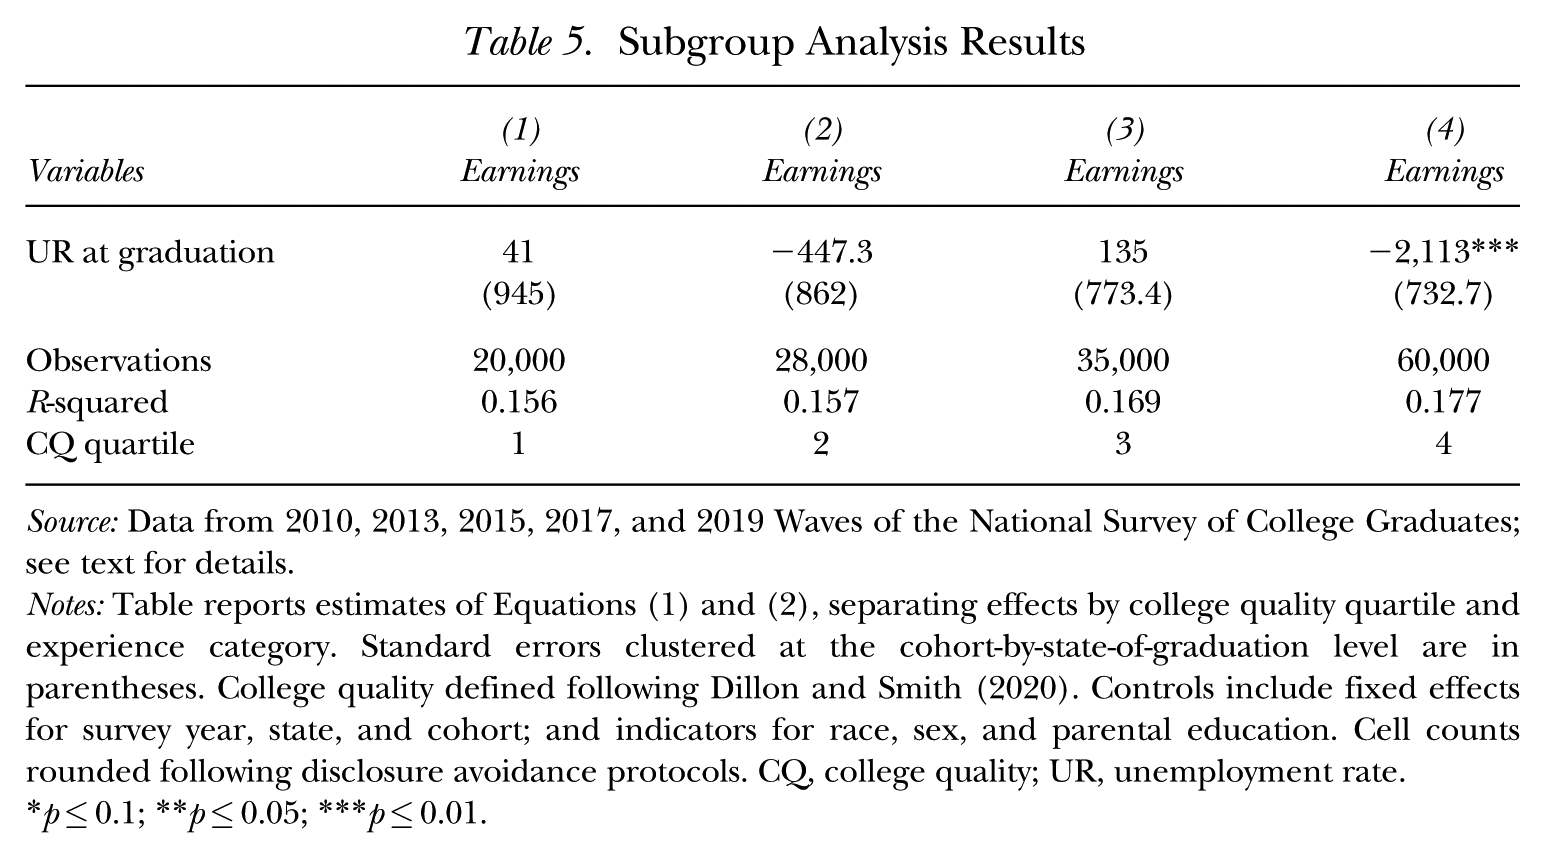
The fourth, fifth, and sixth columns of Table 4 use our second measure of college quality, in which we include indicators for each quartile of the enrollment-weighted college quality distribution. As we expected, column (4) shows that earnings are strongly increasing in college quality. This specification suggests that the college quality earnings differences are nonlinear—while moving from the first quartile to the second quartile increases annual earnings by about $800 (not statistically significant), moving from the second to third and from third to fourth quartile each increase earnings by approximately $4,000. The unemployment rate–college quality interaction terms align with our results from the continuous measure, showing that individuals who attended higher-quality colleges experienced a larger earnings penalty from graduating into a recession than those who attended lower-quality colleges. 14 Although not all coefficients are statistically different from each other in percentage terms, distinctions crystallize when we conduct a subgroup analysis. In Table 5, we break out these quality quartiles to completely and separately estimate the effect of graduating into a worse labor market by quality quartile. This analysis again reveals that most of the effect is coming through graduates at the top of the college distribution: Among individuals who graduate from a top-quartile college, those who are in a state with a one percentage point higher unemployment rate at graduation earn $2,113 less per year.
Subgroup Analysis Results
Source: Data from 2010, 2013, 2015, 2017, and 2019 Waves of the National Survey of College Graduates; see text for details.
Notes: Table reports estimates of Equations (1) and (2), separating effects by college quality quartile and experience category. Standard errors clustered at the cohort-by-state-of-graduation level are in parentheses. College quality defined following Dillon and Smith (2020). Controls include fixed effects for survey year, state, and cohort; and indicators for race, sex, and parental education. Cell counts rounded following disclosure avoidance protocols. CQ, college quality; UR, unemployment rate.
p≤0.1; **p≤0.05; ***p≤0.01.
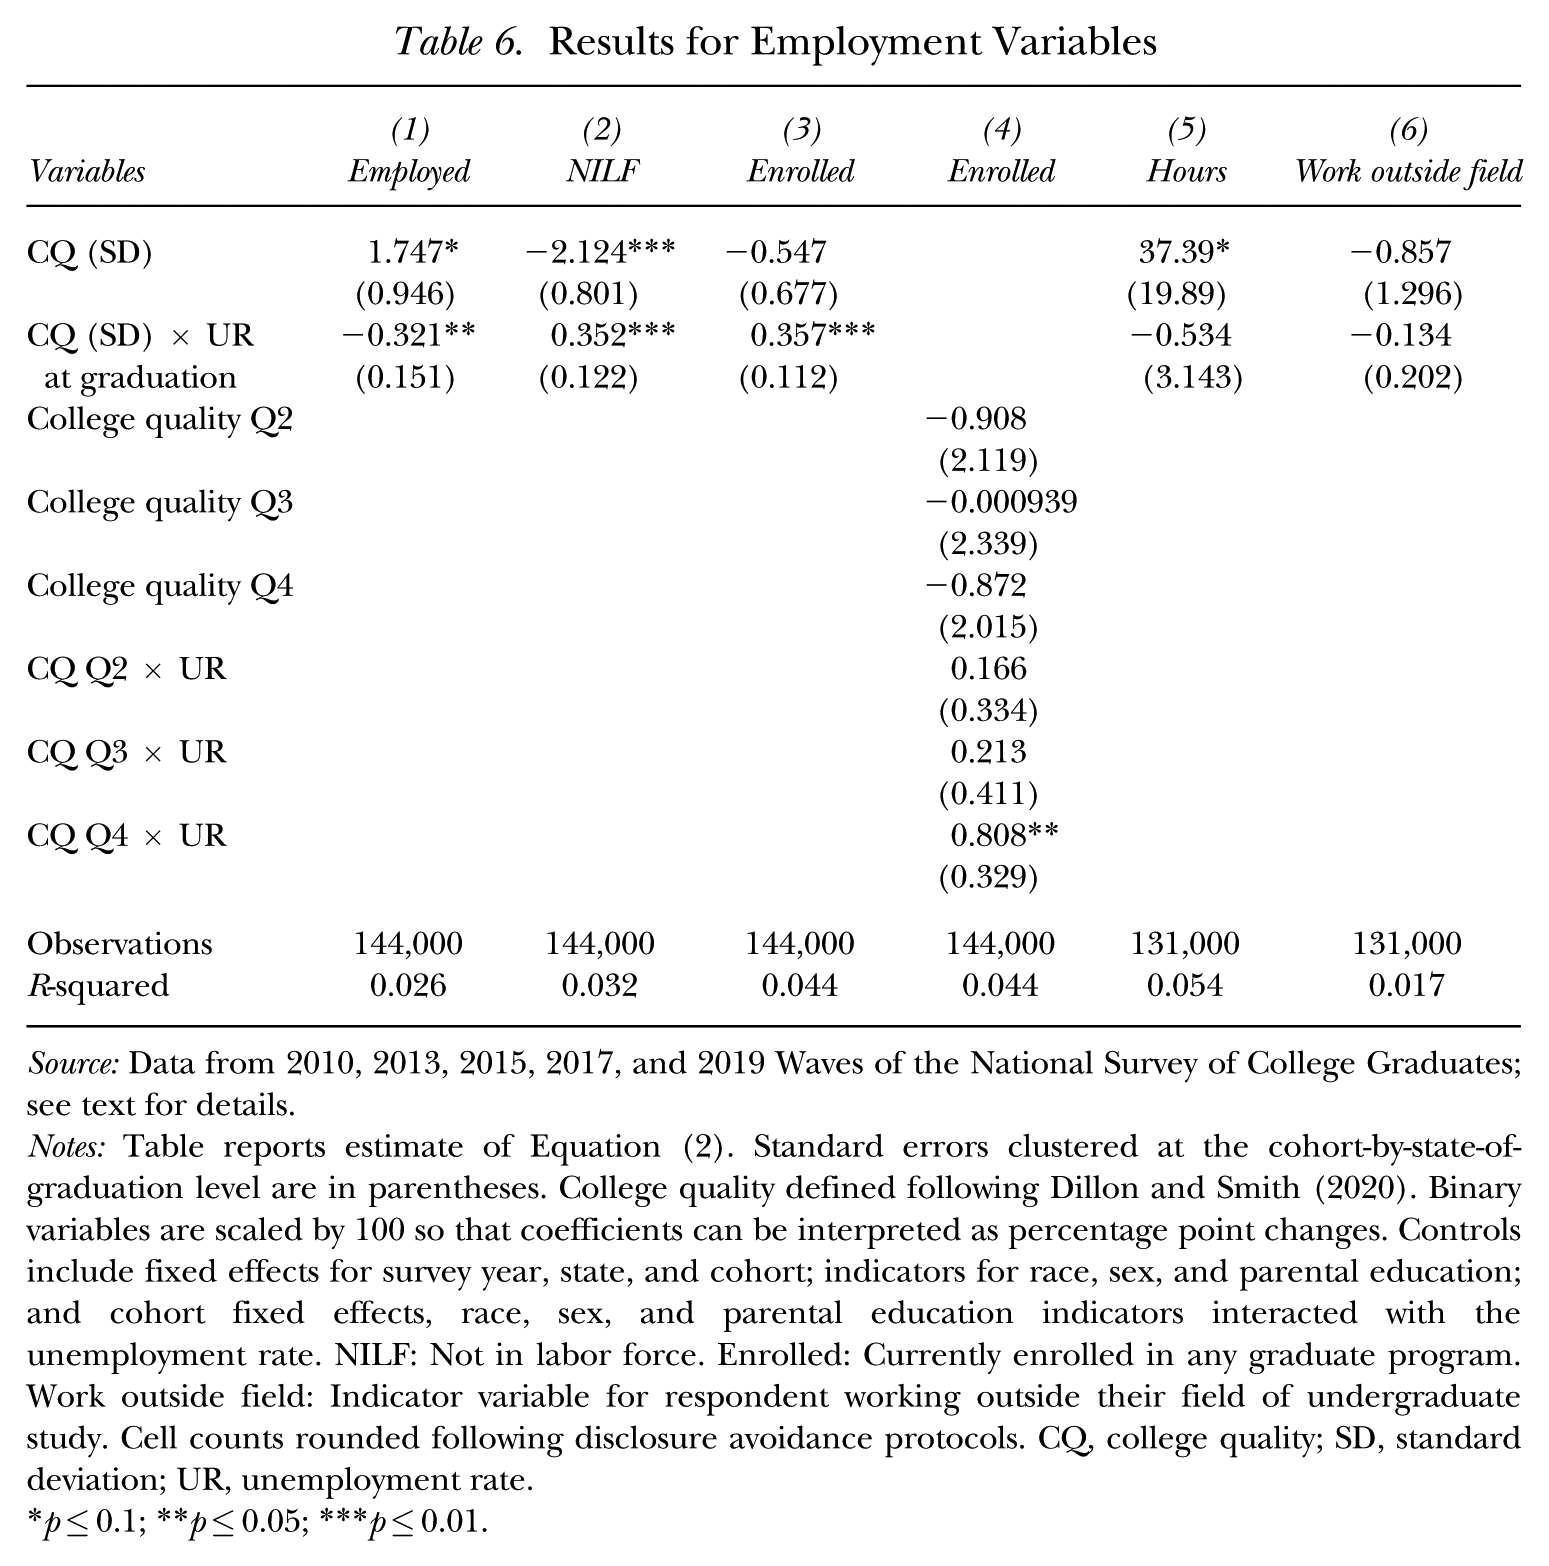
Table 6 shows our main results for labor force participation. Binary variables are scaled by 100 so that effects can be interpreted as percentage point changes. We see in column (1) that for employment during a downturn, the decrease in employment is larger for individuals who attended higher-quality colleges. When the state unemployment rate is one percentage point higher, individuals who attended a one standard deviation higher-quality college are 0.32 percentage points less likely to be employed. Column (2) shows that this outcome is driven by individuals dropping out of the labor force rather than shifting into unemployment. Column (3) uses “currently enrolled in graduate school” as an outcome and shows that graduating from college during an economic downturn increases the probability of being enrolled in graduate school, and this effect is amplified for students who have graduated from high-quality colleges. In fact, the increased probability of being currently enrolled is roughly equal to the decrease in labor force participation. 15 Column (4) breaks out the enrollment results by college quality quartile and shows that impacts are driven by top-quartile graduates.
Results for Employment Variables
Source: Data from 2010, 2013, 2015, 2017, and 2019 Waves of the National Survey of College Graduates; see text for details.
Notes: Table reports estimate of Equation (2). Standard errors clustered at the cohort-by-state-of-graduation level are in parentheses. College quality defined following Dillon and Smith (2020). Binary variables are scaled by 100 so that coefficients can be interpreted as percentage point changes. Controls include fixed effects for survey year, state, and cohort; indicators for race, sex, and parental education; and cohort fixed effects, race, sex, and parental education indicators interacted with the unemployment rate. NILF: Not in labor force. Enrolled: Currently enrolled in any graduate program. Work outside field: Indicator variable for respondent working outside their field of undergraduate study. Cell counts rounded following disclosure avoidance protocols. CQ, college quality; SD, standard deviation; UR, unemployment rate.
p≤0.1; **p≤0.05; ***p≤0.01.
For employed individuals, we additionally explore how the effect of graduating in a recession varies by college quality for their number of hours worked. Column (5) shows that, unlike the large extensive margin effects on labor force participation, the change in hours conditional on being employed does not vary much over the college quality distribution. We also do not find any evidence that, among the employed, the probability of working outside one’s field during a recession varies by college quality (see column (6)). 16
Mechanisms and Heterogeneity
Given the results from Oreopoulos et al. (2012) and Weinstein (2025) that found that individuals from more selective colleges fared better when graduating into adverse labor market conditions, the nature of the heterogeneity we find may be surprising. We next aim to unpack the mechanisms driving our results so as to justify them and better situate them in the previous literature.
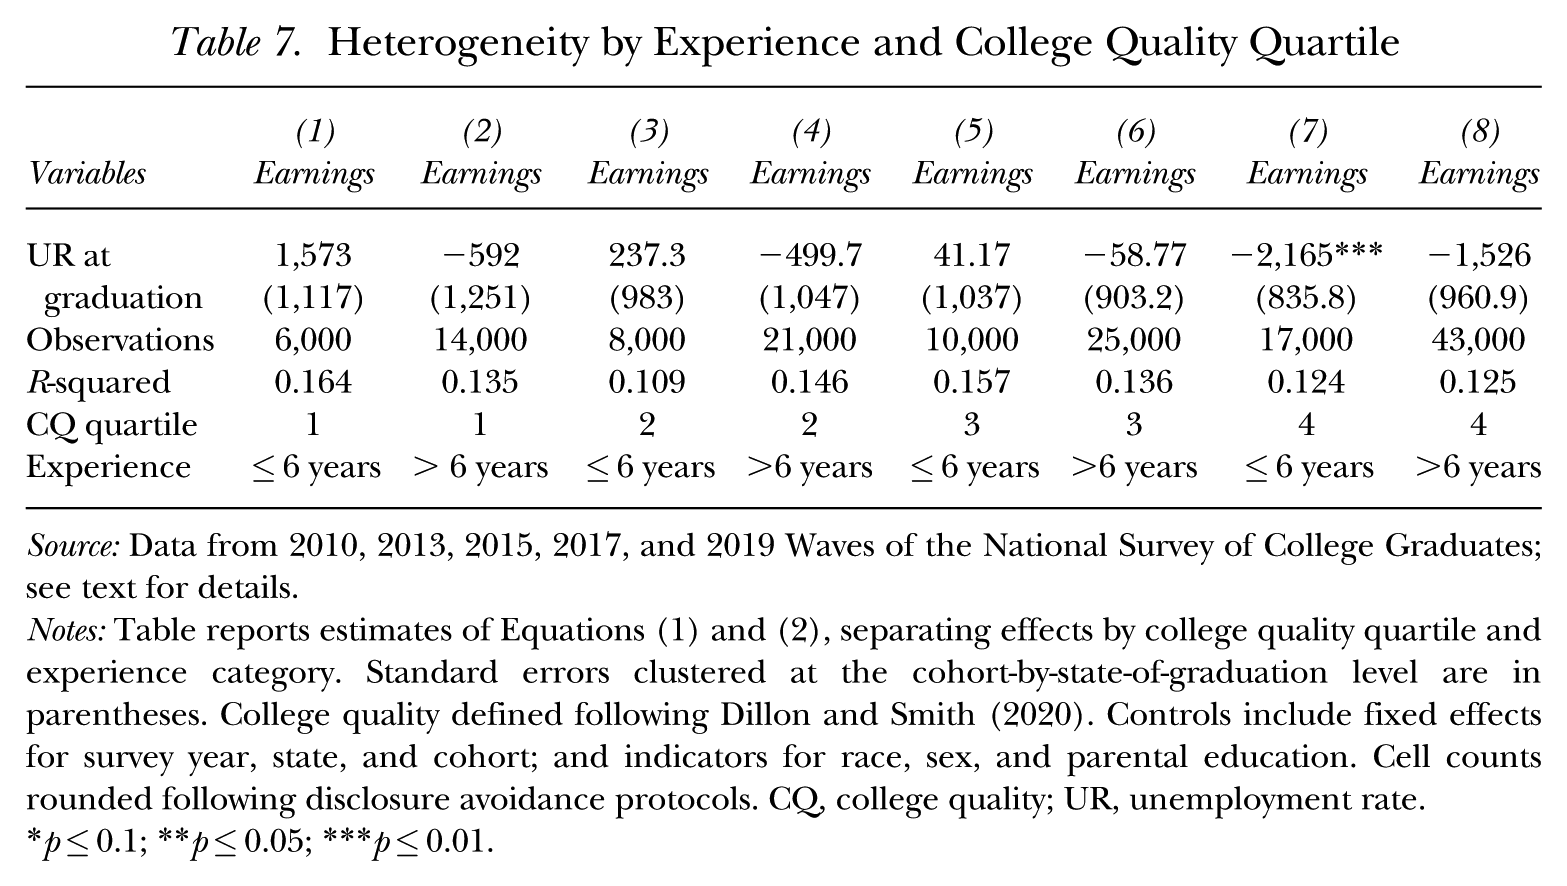
The results displayed in Table 6 suggest that substitution from labor force participation to graduate school enrollment may be an important driver of our earnings results. However, if graduates from high-quality colleges who enroll in graduate school earn higher returns from their graduate degrees upon completion, they may eventually end up out-earning their peers from lower-quality colleges who did not enroll in graduate school. 17 To begin probing this, we follow the literature in investigating to what extent our estimated scarring effects vary with (potential) labor market experience. 18 Relatively small sample sizes in the NSCG prevent us from having adequate power for fully flexible event-study-style analyses (Oreopoulos et al. 2012; Yagan 2019; Rinz 2022), so we instead group individuals based on whether they have more or less than six years of potential labor market experience before estimating the impacts of higher unemployment rates on earnings separately for each college quality quartile. The results of this exercise are shown in Table 7. Among top-quartile graduates, we find modest evidence that the scarring effects decrease over time, but the estimates are sufficiently noisy across the college quality distribution that non-attenuation cannot be statistically ruled out.
Heterogeneity by Experience and College Quality Quartile
Source: Data from 2010, 2013, 2015, 2017, and 2019 Waves of the National Survey of College Graduates; see text for details.
Notes: Table reports estimates of Equations (1) and (2), separating effects by college quality quartile and experience category. Standard errors clustered at the cohort-by-state-of-graduation level are in parentheses. College quality defined following Dillon and Smith (2020). Controls include fixed effects for survey year, state, and cohort; and indicators for race, sex, and parental education. Cell counts rounded following disclosure avoidance protocols. CQ, college quality; UR, unemployment rate.
p≤0.1; **p≤0.05; ***p≤0.01.
While the limited evidence of attenuation we find over this six-year boundary may be evidence that the scarring effects we find are unlikely to revert, it is important to acknowledge that six years remains a limited time window, especially given that it may be less time than it takes to finish particular graduate programs in the first place. 19 At the same time, potential rebounds in earnings may be limited by graduate program non-completion and depend crucially on what sort of programs individuals are enrolling in. These limitations call for further research in the future, when earnings have had more time to crystallize, as well as a deeper understanding of our graduate program enrollment results. Because satisfying the former demand is currently infeasible, we now turn to the latter by delving further into the graduate school enrollment results and investigating whether the higher enrollment we observe is leading to higher graduate degree attainment.
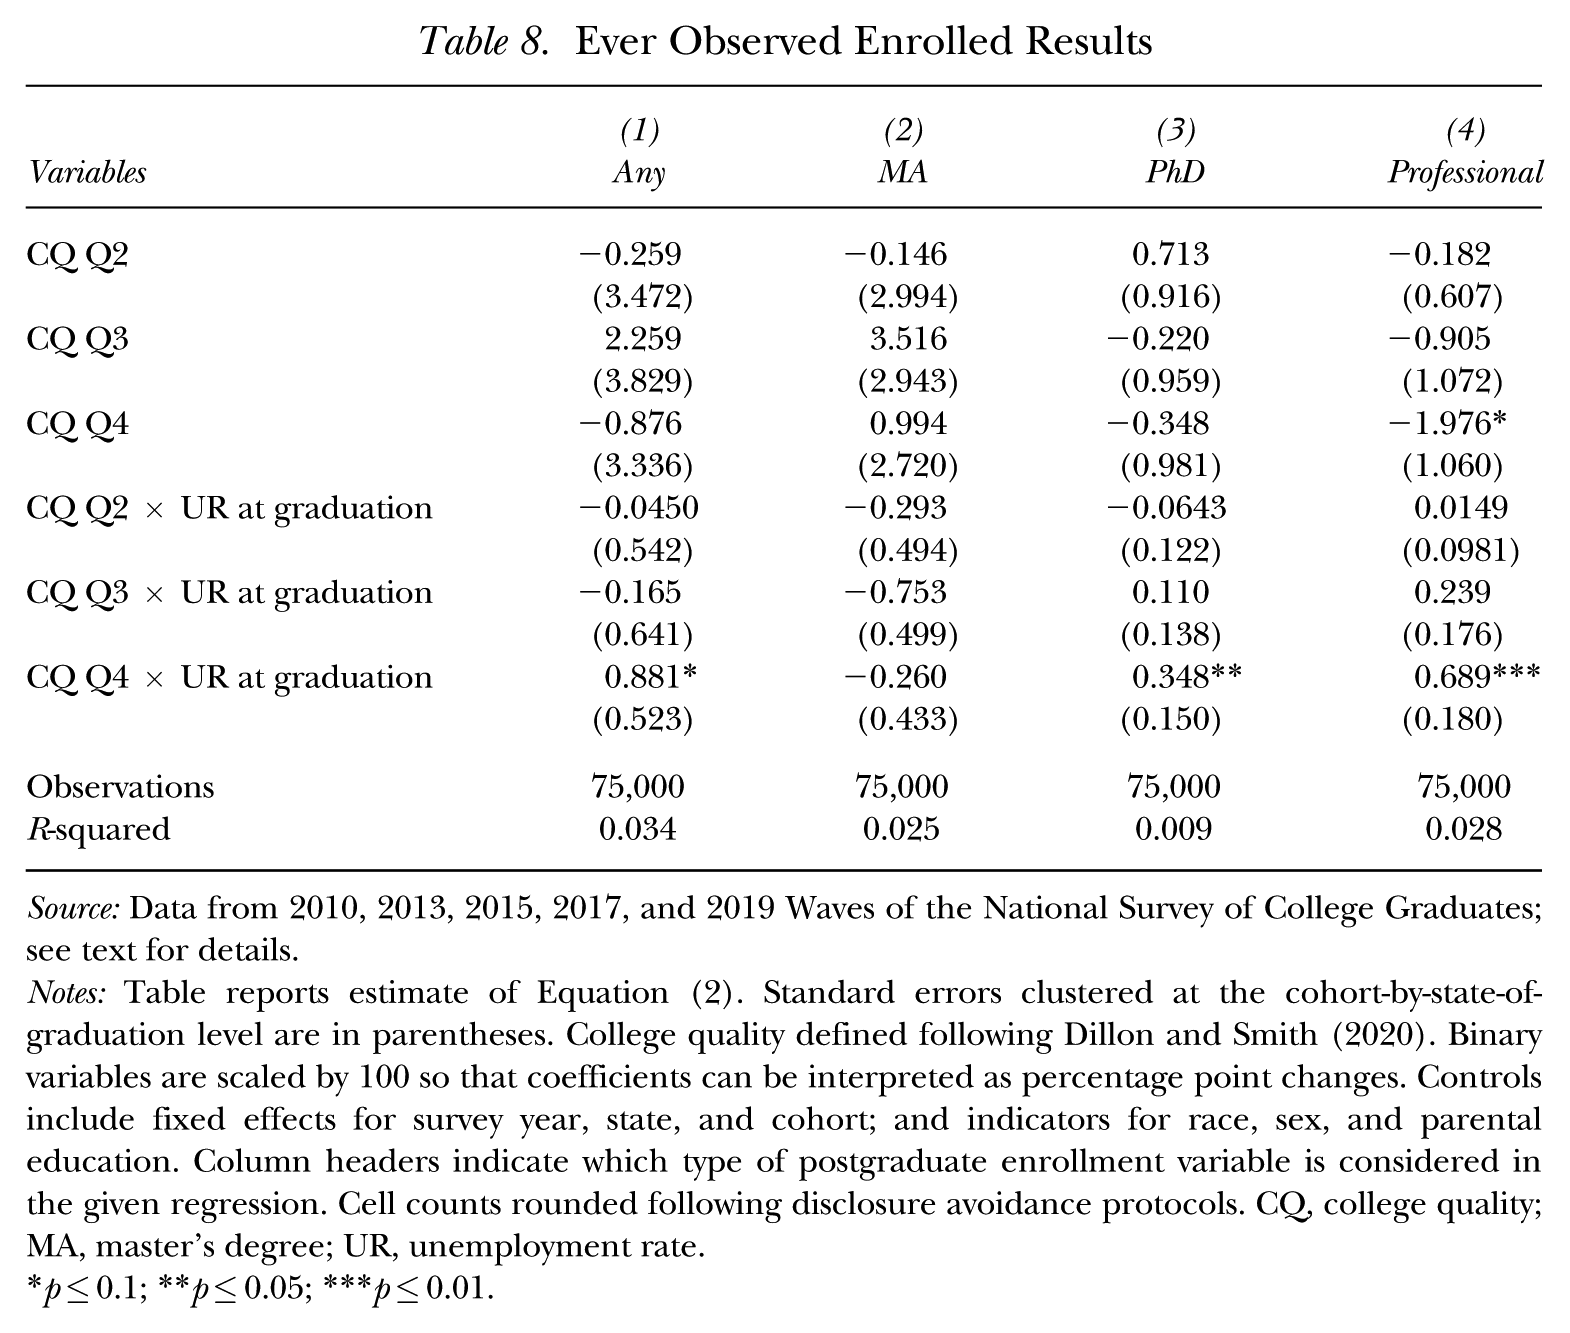
Table 6 shows results for whether respondents are “currently enrolled” in graduate school at the time that they are surveyed. For some graduates, we observe this measure multiple times, since the NSCG is a panel for some respondents. In results presented in Table 8, we include only one observation per person and define the outcome as “ever observed enrolled,” which takes a value of 1 if we observe respondents as currently enrolled at least once when responding to the survey. Note that this measure will not capture all graduate school enrollment, since some respondents may have been enrolled in graduate school before but not during the time they were surveyed. 20
Ever Observed Enrolled Results
Source: Data from 2010, 2013, 2015, 2017, and 2019 Waves of the National Survey of College Graduates; see text for details.
Notes: Table reports estimate of Equation (2). Standard errors clustered at the cohort-by-state-of-graduation level are in parentheses. College quality defined following Dillon and Smith (2020). Binary variables are scaled by 100 so that coefficients can be interpreted as percentage point changes. Controls include fixed effects for survey year, state, and cohort; and indicators for race, sex, and parental education. Column headers indicate which type of postgraduate enrollment variable is considered in the given regression. Cell counts rounded following disclosure avoidance protocols. CQ, college quality; MA, master’s degree; UR, unemployment rate.
p≤0.1; **p≤0.05; ***p≤0.01.
Table 8 shows the results for “ever observed enrolled” in any graduate school, as well as broken down results by degree type (master’s, PhD, or professional). We concentrate on the quartiles college quality measure, since the result from Table 6 showed that the interaction effect of the unemployment rate at graduation and college quality on being “currently enrolled” was driven by graduates from the top-quality quartile. The first column shows that relative to bottom-quality-quartile college graduates, graduates from the top-quality quartile who graduated into a labor market with a one percentage point higher unemployment rate were 0.88 percentage points more likely to have ever enrolled in any graduate program. This effect is driven by enrollment in PhD programs and professional programs (e.g., law school, medical school).
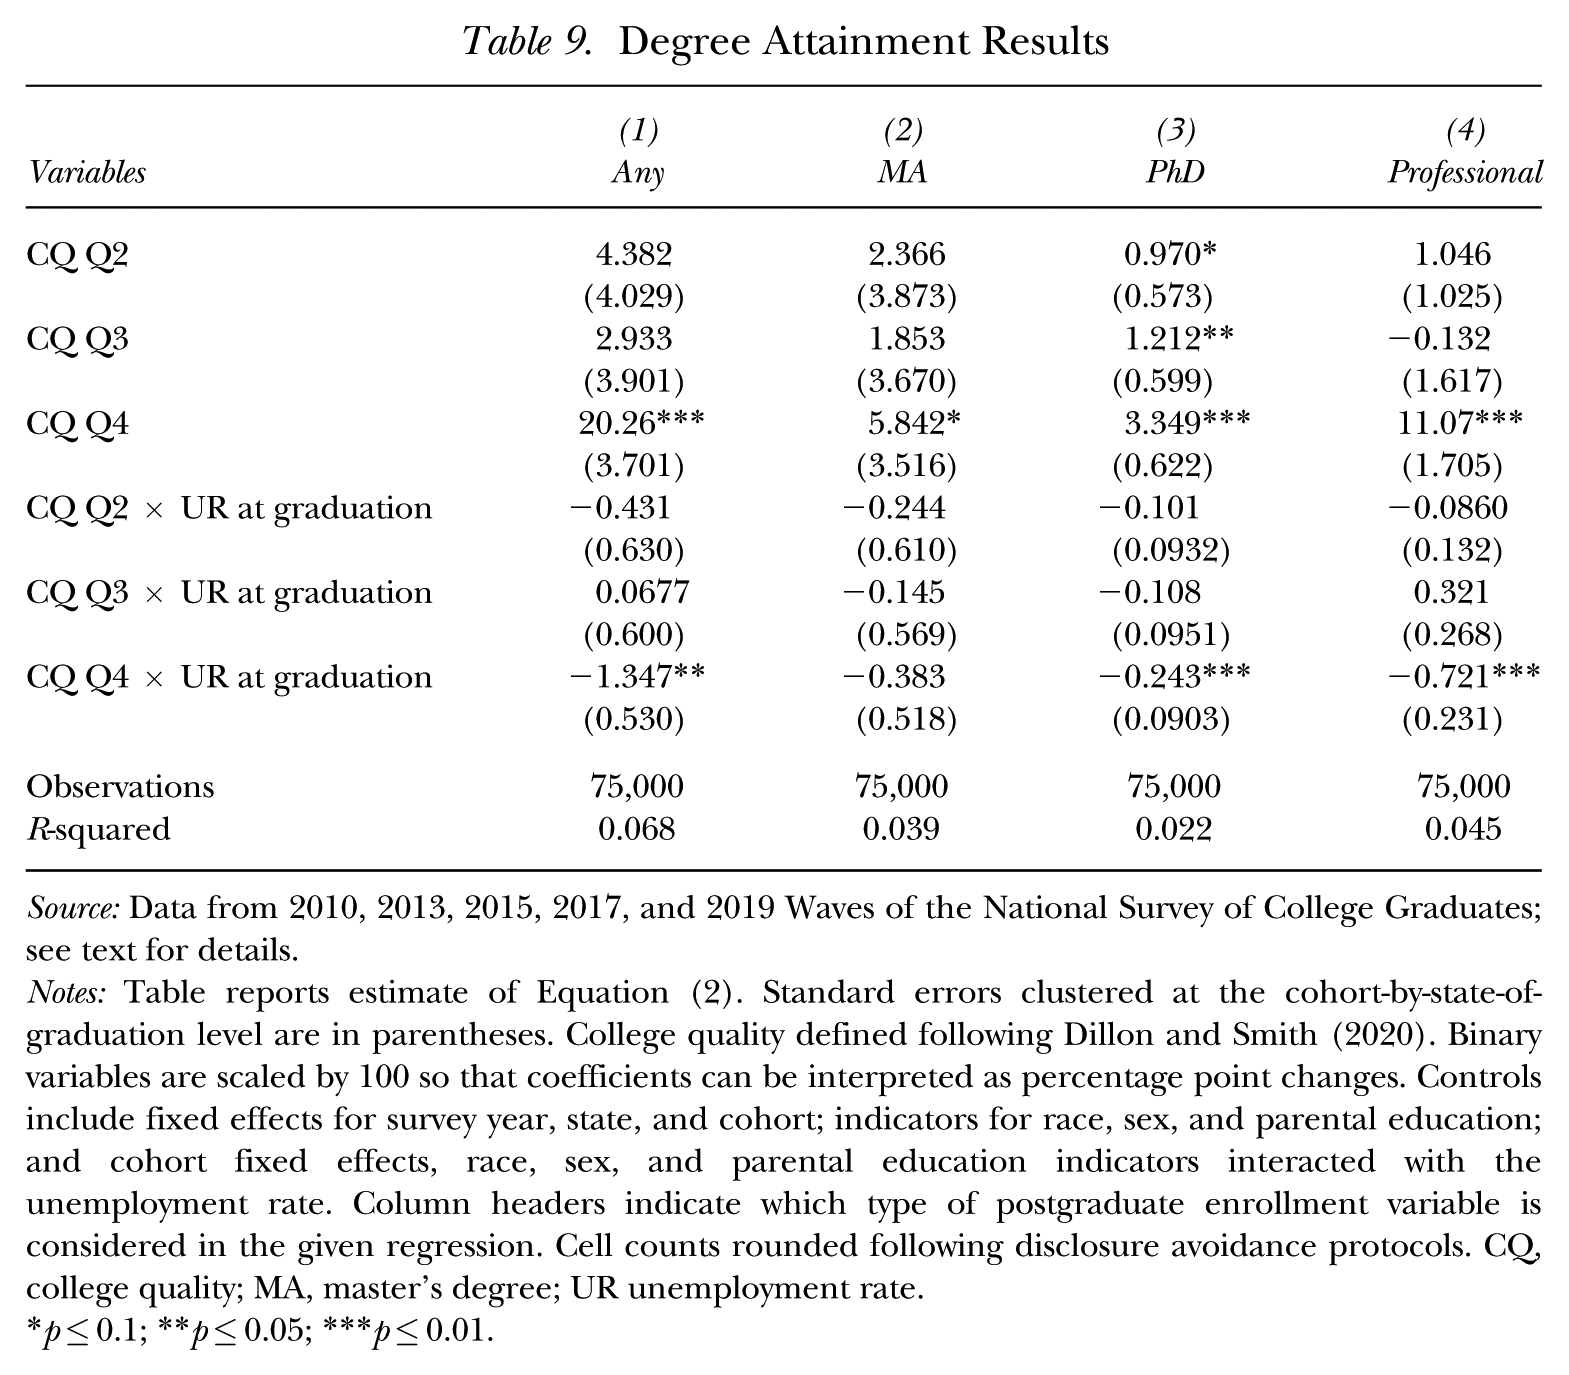
Next, we examine the effect of graduating in a recession on the probability of completing a graduate degree. In Table 9, we include one observation for each individual and estimate whether they hold any graduate degree by the last time we observe them (unconditional on us ever observing them as being enrolled). We find that relative to bottom-quality-quartile college graduates, although graduates from high-quality colleges are more likely to enroll in graduate school if they graduated into a worse labor market, they are less likely to hold a completed degree: Graduates from top-quartile colleges become 1.35 percentage points less likely to attain a graduate degree if they graduate into a labor market with a one percentage point larger unemployment rate. 21 These results suggest that the increased substitution toward graduate program enrollment during a downturn that is partially responsible for our baseline earnings results does not necessarily translate to graduate program completion. As such, this may make the earnings losses we document less likely to be reversed over time. 22 Since these results are not conditional on being observed as enrolled, they are likely a combination of negative selection of students into graduate school during a recession as well as an increased probability of dropout among students who would have pursued graduate school even absent the downturn. 23
Degree Attainment Results
Source: Data from 2010, 2013, 2015, 2017, and 2019 Waves of the National Survey of College Graduates; see text for details.
Notes: Table reports estimate of Equation (2). Standard errors clustered at the cohort-by-state-of-graduation level are in parentheses. College quality defined following Dillon and Smith (2020). Binary variables are scaled by 100 so that coefficients can be interpreted as percentage point changes. Controls include fixed effects for survey year, state, and cohort; indicators for race, sex, and parental education; and cohort fixed effects, race, sex, and parental education indicators interacted with the unemployment rate. Column headers indicate which type of postgraduate enrollment variable is considered in the given regression. Cell counts rounded following disclosure avoidance protocols. CQ, college quality; MA, master’s degree; UR unemployment rate.
p≤0.1; **p≤0.05; ***p≤0.01.
The second mechanism we uncover for our negative earnings effects is field of study. First, we show differences in major choice across colleges that vary systematically by college quality. Table A.9 shows the percentage of each college quality quartiles’ graduates who graduate with degrees in five broad major categories: STEM, social sciences, health, education, and business. Graduates from high-quality colleges are much more likely to major in STEM: 28% of graduates from the top quartile choose a STEM major, compared to just 13% of graduates from the bottom quartile. High-quality college graduates are also more likely to complete majors in the social sciences. Conversely, graduates from lower-quality colleges are more likely to major in health and business. They are also much more likely to major in education: Bottom-quartile graduates are more than three times as likely to major in education as top-quartile graduates. 24
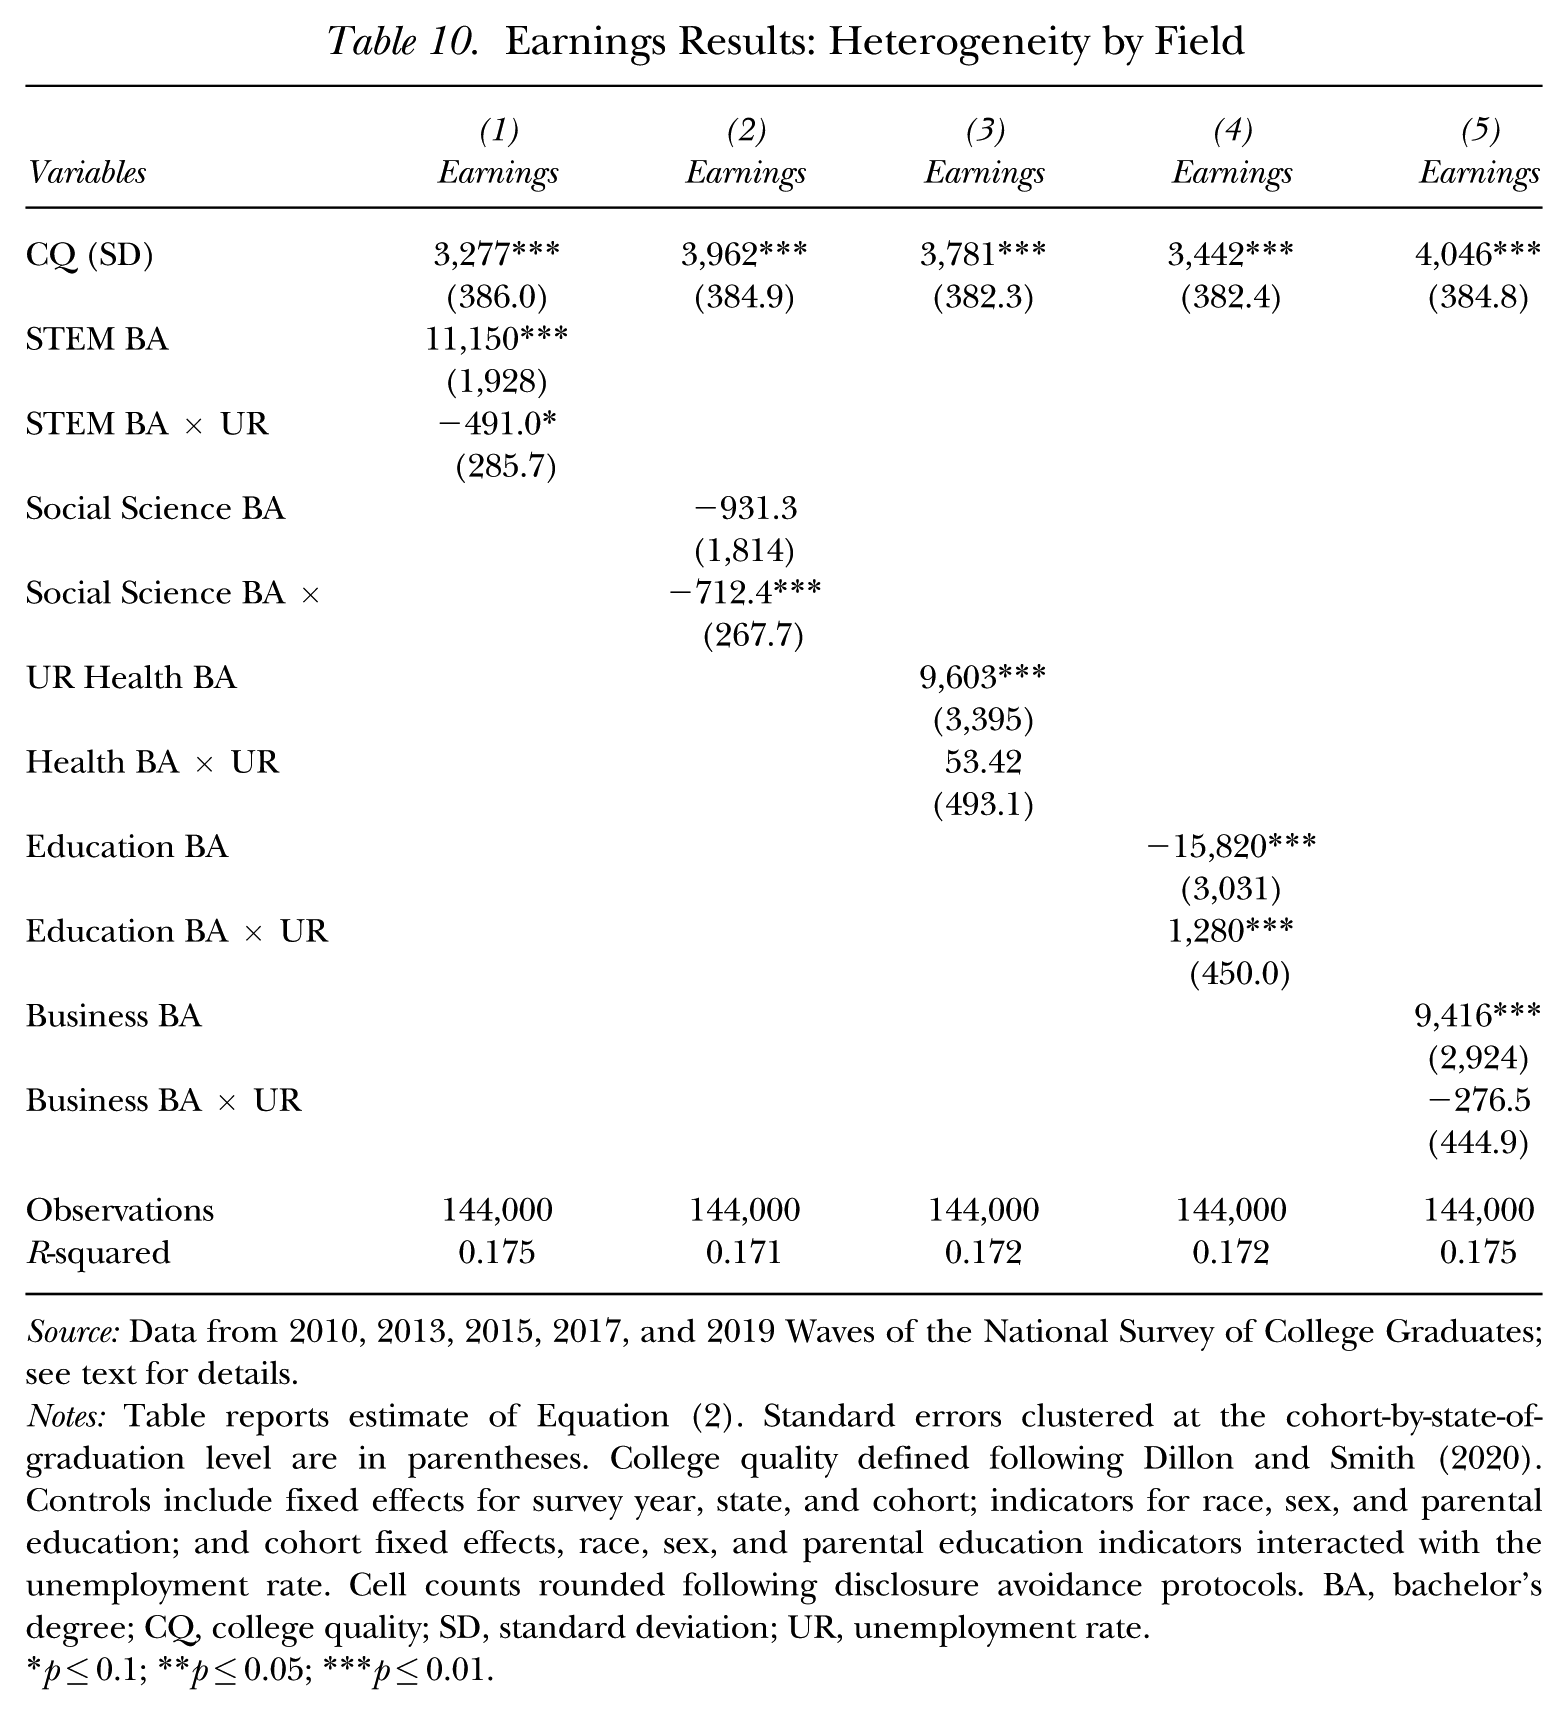
These differences in majors have implications for how graduates from different colleges will fare when graduating into a worse labor market, since labor demand for some majors is much more stable over the business cycle than others. In Table 10, we show how the returns to these majors vary with the unemployment rate that students face at graduation. In this specification, we do not include the interaction term of college quality with the unemployment rate but rather include an interaction term of the unemployment rate with each major group. 25 Table 10 shows that while the earnings of individuals who major in STEM and social sciences tend to decline when the unemployment rate is higher, individuals who major in education actually earn more if they graduated into a labor market with a higher unemployment rate. Thus, part of the reason we find stronger earnings losses from graduating into a recession among individuals who attended high-quality colleges is because graduates from high-quality colleges tend to major in subjects that are more sensitive to fluctuations in the business cycle.
Earnings Results: Heterogeneity by Field
Source: Data from 2010, 2013, 2015, 2017, and 2019 Waves of the National Survey of College Graduates; see text for details.
Notes: Table reports estimate of Equation (2). Standard errors clustered at the cohort-by-state-of-graduation level are in parentheses. College quality defined following Dillon and Smith (2020). Controls include fixed effects for survey year, state, and cohort; indicators for race, sex, and parental education; and cohort fixed effects, race, sex, and parental education indicators interacted with the unemployment rate. Cell counts rounded following disclosure avoidance protocols. BA, bachelor’s degree; CQ, college quality; SD, standard deviation; UR, unemployment rate.
p≤0.1; **p≤0.05; ***p≤0.01.
Finally, we investigate the interaction between college quality and economic conditions upon graduation on labor mobility. College graduates (particularly those from high-quality colleges) are highly geographically mobile, and this propensity to move for higher-paying jobs is an important recent driver of the college earnings premium (Diamond 2016). However, research has indicated that the Great Recession depressed labor mobility, which offers another potential mechanism behind our main results (Yagan 2014). Table A.10 probes this issue, and we find suggestive evidence that higher-quality college graduates are less likely to move out of the state of their college by the time they are observed when they graduate into a worse labor market. The effects appear to be stronger for men: Men from third- and fourth-quartile schools who experience a one percentage point higher unemployment rate upon graduation are each about two percentage points less likely to migrate, relative to men from bottom-quality-quartile colleges.
Taken together, our investigation points to several mechanisms behind our main result that earnings losses from recessions are relatively higher for graduates from higher-quality colleges. First, graduates from high-quality colleges substitute out of the labor force and into graduate school when they experience a worse labor market upon graduation. However, they are unlikely to complete these graduate degrees and are ultimately less likely to hold an advanced degree if they graduated into a recession. Second, graduates from lower-quality colleges tend to major in fields that are more resilient to recessions. Finally, graduating into a recession may decrease labor mobility for high-quality college graduates, especially for men.
Robustness
We conduct several exercises to assess the robustness of our results. First, we estimate specifications where we restrict the sample to individuals with only a bachelor’s degree (i.e., those who have not obtained and are not currently enrolled in any graduate school) or to those who are both in the labor force and not currently enrolled in any graduate school. We do not prefer these specifications since they condition on endogenous variables but still find them valuable in understanding how much of our main result is coming through labor force participation or graduate school enrollment. Results are presented in the first four columns of Table A.11. We find qualitatively similar results to our main findings, although the estimates are smaller and often not statistically significant.
The final two columns of Table A.11 address the question of what the most relevant labor market is for college graduates. To construct an alternate unemployment measure, we use “Grads on the Go” data, provided by Conzelmann et al. (2022b). For each college, they collected data from LinkedIn on where its graduates locate and provided the fraction of each college’s graduates that live in each state. We use this data to construct college-specific unemployment rates for each year by multiplying each state’s unemployment rate (in the relevant year of graduation) by the college’s share of graduates residing in that state. 26 Results are very similar to our baseline specification using state-level unemployment rates.
In Table A.12, we also experiment with measuring earnings in logs as well as log-plus-1 to avoid dropping zeros. We also include results in which we use hourly wages, measured as total earnings divided by hours worked in the previous year, as the dependent variables instead of annual earnings. For our main binary outcomes, we additionally present average marginal effects from probit models (rather than the baseline linear probability models) in Table A.13. We assess the sensitivity of our results to additional alternate earnings measures in Table A.14, such as winsorizing at the 99th percentile instead of 95th, using an inverse hyperbolic sine transformation, or conducting a median regression instead of least squares. In all cases our results hold qualitatively.
Because we measure the unemployment rate at the time of graduation, there may be some concerns that part of what we are capturing is individuals’ endogenous timing of graduation in response to the recession. It could be that college students choose to delay graduation a year to wait out a recession, and that their tendency to do so varies with college quality. We investigate this in two ways. First, we use the state unemployment rate when individuals are age 22, which should not be affected by students’ response to the recession. The results are shown in Table A.15. The first two columns replace the unemployment rate at graduation with the age 22 unemployment rate, and the third and fourth columns instrument for the graduation rate with the age 22 rate. Both are similar to our main results, and if anything, more negative for high-quality college grads. Second, we return to our baseline specification but use individuals’ age at graduation as an outcome, shown in Table A.16, but find little evidence of meaningful heterogeneity. We also estimate specifications that, in addition to including our main measure of the unemployment rate in the state of graduation, control for the unemployment rate in individuals’ birth state or in the year that they graduated from high school in Table A.17. Table A.18 down-weighs individuals who appear multiple times so that each person has equal weight. Neither test meaningfully impacts our results.
We also assess whether our results are sensitive to our measure of college quality by using each individual sub-index of college quality (faculty–student ratios, rejection rates, faculty salaries, and test scores) as our measure of college quality instead. The results of this exercise, shown in Table A.19, show that while the statistical significance varies (consistent with evidence from Black and Smith (2006) that suggests using a single proxy has more measurement error than an index of several proxies), the sign and magnitude do not meaningfully change relative to the baseline results when using any individual component.
Finally, we use coarser measures of time and recession severity to construct a 2 × 2 difference-in-difference setup to address potential lingering concerns about our baseline identification strategy. Our first difference is before/after the recession in 2008, and our second difference is based on the change in the state unemployment rate between 2007 and 2009, as in Yagan (2019). We characterize states as receiving a “bad shock” if the unemployment rate change is above the median. This is not our preferred specification because it does not take advantage of all of the variation in unemployment rates across states as our continuous measure does, but it aligns more closely with previous literature and gives additional evidence on how recession scarring varies with college quality. Table A.20 shows the results from this exercise. The first column shows that relative to bottom-quality-quartile graduates, individuals who graduated after the recession from a top-quartile college in a state with a bad recession shock earn approximately $6,000 less than those in a state with a less severe recession shock, after accounting for the earnings differences between these states before the recession. Including additional interactions for time period by college quality category does not meaningfully change the results of this exercise.
Comparison to Other Studies
We now take a more detailed look at explanations for differences in our results from two other studies that have considered how the effects of graduating into a recession vary across types of colleges. Oreopoulos et al. (2012) found that Canadian college students who graduated into a recession suffered smaller and less persistent earnings losses if they graduated from generally higher-earning majors and colleges. Several important differences between the setting and methods of Oreopoulos et al. (2012) and our work are worth highlighting.
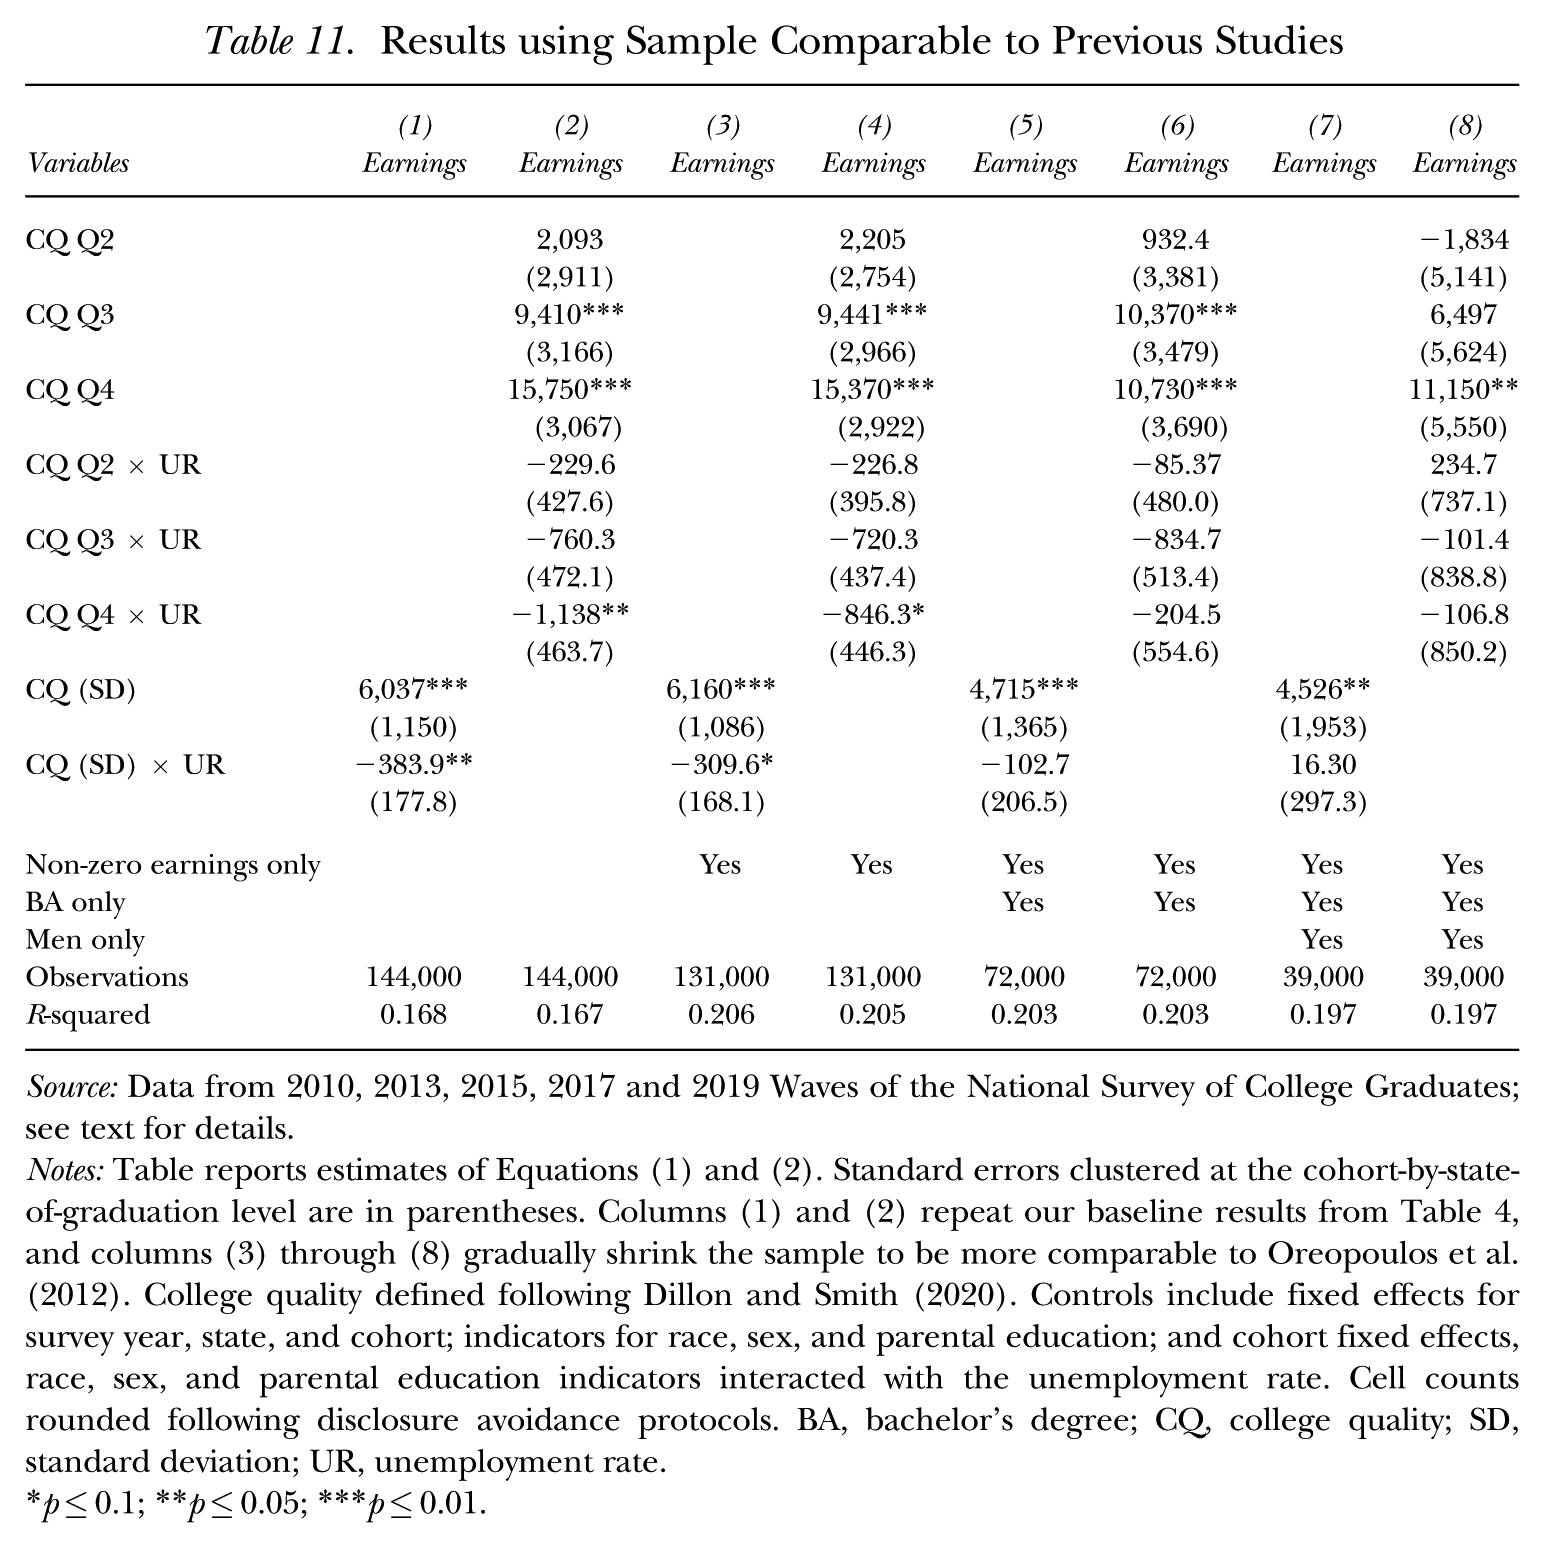
First, the samples differ. In addition to focusing on an earlier time period (graduates from 1976 to 1995 as opposed to 2000 to 2012) in a different country, the authors restrict their sample to only men with strictly positive earnings and no graduate degrees, thus missing any effects on women as well as considerably reducing the role that substitution from the labor force toward further education can play in their analysis. In Table 11, we conduct an exercise to restrict our sample comparably, gradually limiting the sample by removing individuals with zero earnings, then removing individuals with graduate degrees, then removing women. We find, in fact, that after these restrictions, our results resemble the estimates of Oreopoulos et al. (2012) more closely: As we move to a sample construction more in line with previous studies, we find the coefficients on our college quality and unemployment rate interaction terms decrease in magnitude and become both substantively and statistically insignificant by the time we arrive at the sample that includes only men with positive earnings and no graduate degrees (as reflected in columns (7) and (8)). This suggests that these sorts of sample construction decisions are qualitatively important in analyzing the scarring impacts of recessions. 27
Results using Sample Comparable to Previous Studies
Source: Data from 2010, 2013, 2015, 2017 and 2019 Waves of the National Survey of College Graduates; see text for details.
Notes: Table reports estimates of Equations (1) and (2). Standard errors clustered at the cohort-by-state-of-graduation level are in parentheses. Columns (1) and (2) repeat our baseline results from Table 4, and columns (3) through (8) gradually shrink the sample to be more comparable to Oreopoulos et al. (2012). College quality defined following Dillon and Smith (2020). Controls include fixed effects for survey year, state, and cohort; indicators for race, sex, and parental education; and cohort fixed effects, race, sex, and parental education indicators interacted with the unemployment rate. Cell counts rounded following disclosure avoidance protocols. BA, bachelor’s degree; CQ, college quality; SD, standard deviation; UR, unemployment rate.
p≤0.1; **p≤0.05; ***p≤0.01.
Second, Oreopoulos et al. (2012) combined their analyses of heterogeneity by college and heterogeneity by major by estimating individuals’ predicted earnings based on college attended, major, and years of study, and then estimated heterogeneity in the effects of graduating into a weaker labor market by these predicted earnings. Thus, they did not isolate differences solely by college quality, but rather found that individuals who both attend colleges with higher-earning graduates and pursue higher-earning majors suffer relatively less from graduating at a time when unemployment rates are high. Our analysis shows that college quality and major can have subtle interactions in their responsiveness to recessions that can be missed when combining them.
The setting in Weinstein (2025) is closer to ours, as he also used variation from the Great Recession in the United States. However, there are several methodological differences that lead to our opposing results. The first, and most important, is a difference in college quality/selectivity measures. Weinstein (2025) used Barron’s categories, which as noted above provide a high degree of detail at the top of the distribution but little variation in the middle and bottom of the distribution. The entirety of the top two categories that Weinstein used (Ivy Plus and Barron’s Tier 1 (Elite)), along with 95% of students in his third category (Barron’s Tier 2 (Highly Selective)) fall within our top-quality quartile. Meanwhile, his fourth category (Barron’s Tiers 3–5), which is used as the base category in his analysis, spans all four of our quality quartiles. 28 Thus, we make broader comparisons across the college quality distribution whereas Weinstein’s comparison is more akin to elite universities versus the rest of the distribution. In our view, this distinction allows our articles to be quite complementary to one another.
Second, we use distinct earnings measures. Our primary earnings measure is mean earnings in levels, which we choose to capture endogenous differences in labor force participation, while Weinstein’s main measure is the log of each college’s median income after restricting to positive earners, which may understate the role of substitution out of the labor force into graduate education in a similar manner to Oreopoulos et al. (2012). Third, the (implicit) weighting differs between our sample and Weinstein’s. After applying the NSCG’s sampling weights, our student-level data are nationally representative of bachelor’s degree holders, so our results represent the mean impact across all college graduates. Weinstein’s data are institution-level, so smaller universities carry more weight per student.
Since Weinstein used public-use mobility report card data, we are able to directly show how these three differences affect results. When we use Weinstein’s specification and data but change the college quality measure from Barron’s categories to our quartiles measure, use mean earnings as the outcome variable, and weight by institution size, we broadly replicate our results. Specifically, we replicate the following triple-difference event specification,
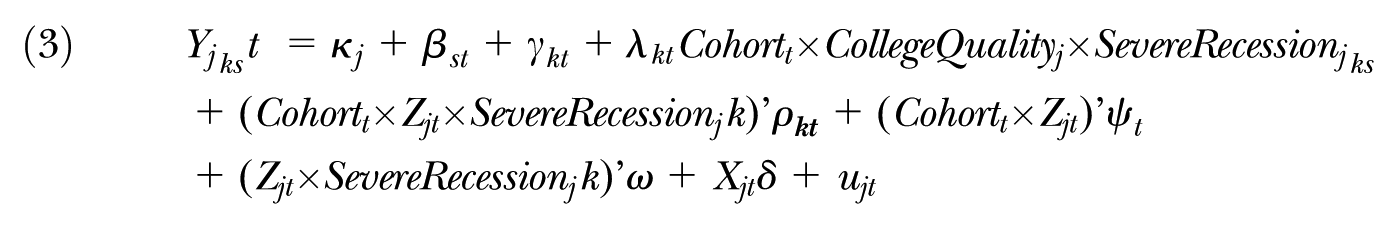
where Yjkst is income measured in 2014 for graduates of university j, in birth cohort t, where university j is in college quality group k and commuting zone (CZ) s. Further, κj are university fixed effects, βst are birth cohort-commuting zone fixed effects, and γkt are birth cohort-college quality group fixed effects. SevereRecessionjks is an indicator for college j being located in a commuting zone with an above-median change in the unemployment rate between 2007 and 2009. The terms Zjt and Xjt are university-level controls for fraction of female students, log of students in the cohort, and several parental income variables. This specification is exactly the same as Weinstein’s, except we have changed the outcome to mean earnings, changed the college quality measure to our quartiles measure, and weighted by institution size.
Figure 2 shows the results, where the bottom-quality quartile is the omitted category. Our main result, that earnings losses of graduating into a recession are concentrated among top-quartile college quality grades, can be seen in panel (c). It shows that, for birth cohorts who would have graduated after the Great Recession, the difference in mean incomes between graduates from the top-quality quartile and same-CZ bottom-quality quartile is an additional $5,000–8,000 lower in high-recession shock versus low-recession shock CZs relative to the 1983 (base, following Weinstein) cohort.
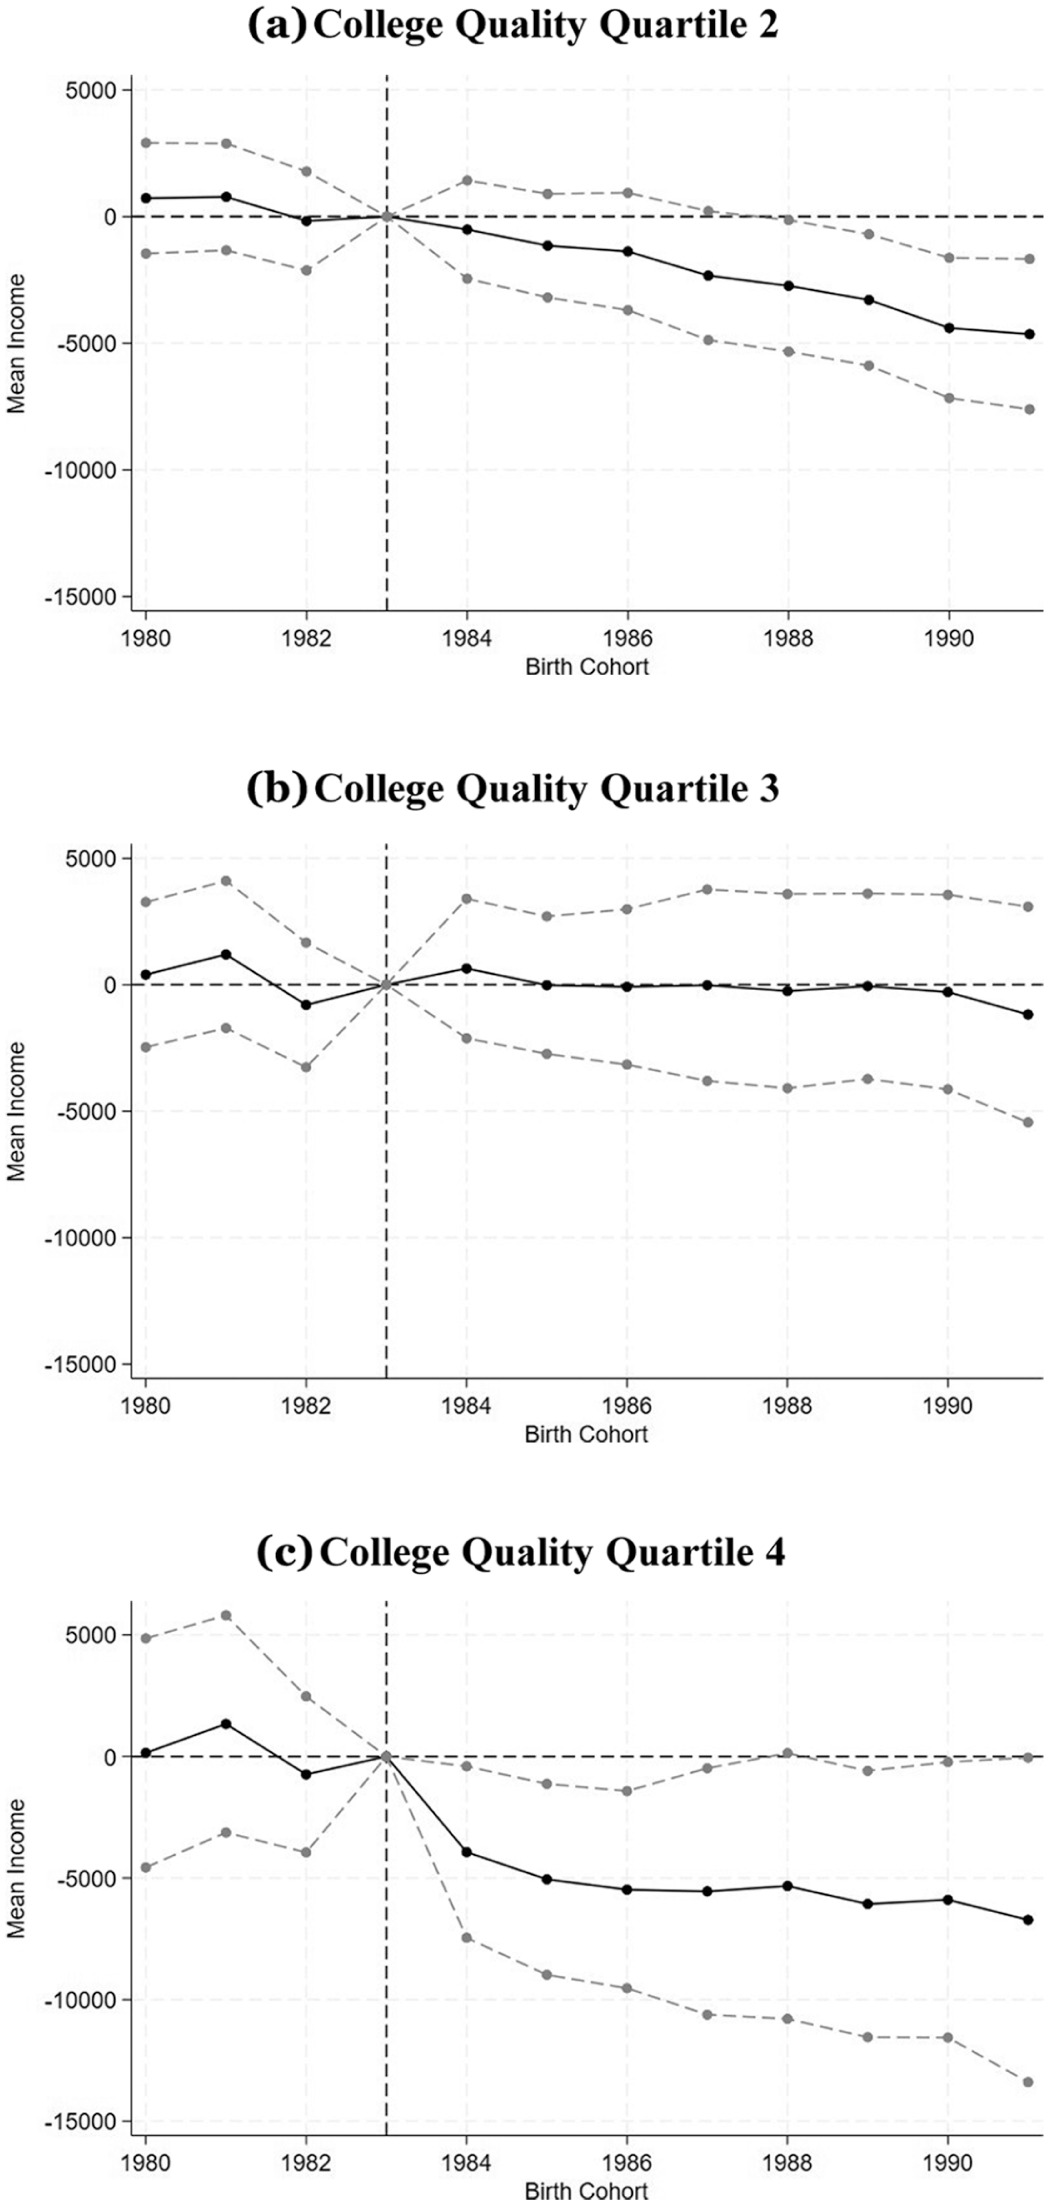
Recession Effects by College Quality, Relative to College Quality Quartile 1: Triple-Differences Model
While Figure 2 shows the results from making three changes (using our college quality measure instead of Barron’s; using mean earnings instead of log(median) earnings; weighting by institution size) at once, one may be interested in which changes make the biggest difference. In Figure A.1, we show that changing to mean earnings makes a moderate difference, changing to our college quality definition makes the largest difference, and weighting by institution size makes a minimal difference.
Conclusion
Graduating into a recession is associated with losses in earnings, but less is known about how these effects vary based on the college from which an individual graduated. We study how the effects of graduating into an economic downturn vary with college quality in the context of the Great Recession. Using restricted-use data from the National Survey of College Graduates, we find that graduation into worse economic conditions is associated with earnings losses that are concentrated among graduates from relatively high-quality colleges. We identify several mechanisms behind these results: First, graduates from high-quality colleges who graduate during a worse labor market are more likely to exit the labor force and enroll in graduate school. However, they are less likely to earn graduate degrees, implying increased levels of dropout both for marginal enrollees as well as those who would have enrolled absent the recession. Second, relative to lower-quality college graduates, graduates from high-quality colleges tend to major in fields that are more sensitive to business cycle fluctuations, so a recession affects the earnings of graduates from high-quality colleges more. Third, we find suggestive evidence that geographic mobility may decrease for students from high-quality colleges when they graduate in a downturn. These findings suggest that who stands to lose the most from graduating into a recession may be more subject to context than previously thought.
These findings also have implications for how the Great Recession impacted the economic mobility for those who graduated into it. The backgrounds of students varies considerably over the college quality distribution: More than 10% of students in bottom-quartile colleges had parents in the bottom quintile in the national income distribution, while the corresponding statistic for students in top-quartile colleges was less than 5%—further, the proportion of students in these colleges with parents in the top income percentile was 0.8% and 7.7%, respectively. 29 The heterogeneity we find points to a potential leveling of the playing field for individuals who graduated into the recession, at least among college graduates. At the same time, the finding that the graduates of higher-quality colleges are much more likely to respond to economic downturns by pursuing additional education leaves open the possibility that our findings may attenuate or even reverse in the future if students eventually complete their graduate degrees. Our findings of decreased graduate degree completion for high-quality college graduates suggest that policies aimed at decreasing graduate school dropout could be effective, but from an equity standpoint, policymakers may consider pairing them with interventions that also enable graduates from lower-quality colleges and less-affluent backgrounds to access and complete graduate degrees in response to downturns. Future investigations into how our earnings and graduate degree completion results evolve over time will be worthwhile to further inform policy.
Supplemental Material
sj-pdf-1-ilr-10.1177_00197939261426341 – Supplemental material for Who Scars the Easiest? College Quality and Earnings Losses from Graduating into a Recession
Supplemental material, sj-pdf-1-ilr-10.1177_00197939261426341 for Who Scars the Easiest? College Quality and Earnings Losses from Graduating into a Recession by Garrett Anstreicher and Lois Miller in ILR Review
Footnotes
Acknowledgements
The authors thank Ariel Binder, Michaela Dillon, Steve Hemelt, Jeff Smith, Kevin Stange, Chris Taber, and conference and seminar participants at AEFP, APPAM, SOLE, the Census Bureau, and the Federal Statistical Research Data Center conference for helpful feedback. They also thank Bob Thomas for help in applying for and using the data.
Author order was randomized using the American Economic Association author randomization tool (confirmation code sN5wqN5Zk5ZY).
This research was partially supported by the Summer Research Fellowship generously provided by the University of Wisconsin-Madison. Additionally, this material is based upon work supported by the National Science Foundation Graduate Research Fellowship Program under Grant No. DGE-1747503. Any opinions, findings, and conclusions or recommendations expressed in this material are those of the authors and do not necessarily reflect the views of the National Science Foundation. Support was also provided by the Graduate School and the Office of the Vice Chancellor for Research and Graduate Education at the University of Wisconsin-Madison with funding from the Wisconsin Alumni Research Foundation. Any views expressed are those of the authors and not those of the U.S. Census Bureau. Institutional support was provided by the University of South Carolina and the University of Nebraska-Lincoln. The Census Bureau’s Disclosure Review Board and Disclosure Avoidance Officers have reviewed this information product for unauthorized disclosure of confidential information and have approved the disclosure avoidance practices applied to this release. This research was performed at a Federal Statistical Research Data Center under FSRDC Project Number 2508 (CBDRB-FY21-P2508-R9066, CBDRB-FY22-P2508-R9486, CBDRB-FY23-P2508-R10520, CBDRB-FY23-P2508-R11545, and CBDRB-FY25-P2508-R12459).
1
2
By contrast, a few other papers have found limited scope for college quality to increase earnings—see Dale and Krueger (2002, 2014) and ![]() .
.
3
For some respondents, we observe multiple earnings measures over time, since the NSCG has a panel component. Unfortunately, the small number of repeat respondents does not allow for us to take advantage of this panel nature. The inclusion of multiple observations per person does not change our main conclusions, as we cluster standard errors at the state-by-cohort level and find similar results when re-weighting the sample such that each person has equal weight.
4
We default to using SAT scores because of superior coverage across universities compared to ACT scores. If an institution does not report SAT scores but does report ACT scores, we convert the ACT scores to their SAT equivalent before proceeding.
5
6
Because quality quartiles are created before individuals in our sample are merged to them, the number of individuals in each quartile need not be the same and indeed are not due to higher-quality colleges exhibiting substantially higher graduation rates. Note also that Census regulations on rounding sample sizes means that the total sample size implied by the table may differ slightly from reported sample sizes in other tables.
7
One standard deviation is roughly equivalent to a 30 percentile increase in the college quality distribution.
8
We have experimented with other levels of clustering and found that our results are minimally sensitive to them.
9
Interacting cohort fixed effects with the local unemployment rate in particular serves a similar role to including state-by-cohort fixed effects, which itself is impossible due to collinearity with Ust.
10
We also consider alternate specifications that add additional college major fixed effects; see Table A.1 in the Online Appendix. (Hereafter, numbering for ![]() is prefaced with an “A.”)
is prefaced with an “A.”)
11
We view including zero earnings so as to capture extensive-margin labor force participation effects as especially important given that much of our identifying variation comes from the Great Recession, which featured rising mean wages despite a collapse in employment (![]() ). Nonetheless, we later demonstrate that our results qualitatively hold in specifications that exclude individuals with zero earnings.
). Nonetheless, we later demonstrate that our results qualitatively hold in specifications that exclude individuals with zero earnings.
12
The coefficient on the unemployment rate is not immediately interpretable because of our inclusion of cohort-by-unemployment rate interactions as controls.
13
This specification also gives us a cleaner interpretation of the main effect of the unemployment rate, since we have dropped all controls and cohort interactions with the unemployment rate, and it shows that the impact of graduating in a state with a higher unemployment rate is substantively and statistically significantly negative. Given that our main interest is in the interaction term, in most specifications going forward we include all control variables but suppress reporting of the un-interacted Ust coefficients for clarity.
14
Column (6) shows that, once again, the interaction terms are not meaningfully affected by the exclusion of controls.
15
This does not necessarily mean that individuals are directly substituting employment and enrollment, since some students may be simultaneously enrolled and working. So, in ![]() , we consider the four mutually exclusive combinations of working and enrollment and indeed find that most of the movement is out of “working, not enrolled” and into “not working, enrolled,” although we observe modest statistically insignificant increases in “working, enrolled” and “not working, not enrolled.”
, we consider the four mutually exclusive combinations of working and enrollment and indeed find that most of the movement is out of “working, not enrolled” and into “not working, enrolled,” although we observe modest statistically insignificant increases in “working, enrolled” and “not working, not enrolled.”
16
The NSCG includes a question asking respondents, “To what extent was your work on your principal job related to your highest degree?” Possible responses are: “closely related,”“somewhat related,” and “not related.” We count responses of “not related” as working outside one’s field.
17
18
We proxy for labor market experience with years of potential experience; that is, the difference between graduation cohort and current year. Note also that we do not define individuals enrolled in graduate programs as necessarily being in or out of the labor force due to the prevalence of individuals who pursue graduate degrees part-time while still maintaining some degree of labor force attachment.
19
To say nothing of common post-graduate arrangements that further delay gains in earnings, such as postdoctoral or resident positions.
20
Because of this data limitation, we code this variable to take a value of zero for respondents who hold a graduate degree but completed it before the first time they are surveyed. We prefer this measure since we have no way of knowing if an individual enrolled in graduate school and dropped out before being surveyed. Thus, we would be introducing bias by counting an individual who we observe with a graduate degree (but not enrolled) as “ever enrolled” but not counting an individual who enrolled and dropped out before we observe them.
21
This magnitude is small relative to the overall effect of coming from a top-quartile college on graduate degree attainment, which is 13 percentage points on average relative to bottom-quartile college-quality graduates. See ![]() , which drops the interactions with the unemployment rate, to give interpretable college quality coefficients.
, which drops the interactions with the unemployment rate, to give interpretable college quality coefficients.
22
23
24
These differences in shares of students in each major may be the result of demand-side factors (e.g., higher-ability and more STEM-inclined students selecting into higher-quality colleges) or supply-side factors (e.g., higher-quality colleges having more STEM offerings), but our empirical strategy does not allow us to disentangle them.
25
We still include the main effect of college quality to capture averages differences in earnings across colleges.
26
The timing of the college’s shares in each location is slightly misaligned with the timing of our sample: The LinkedIn data use graduates from 2010 to 2015.
27
It is worth acknowledging that ![]() assessed the robustness of their results to expanding their sample to include workers with graduate degrees and to limiting the sample to workers with positive earnings in every year and found little change from their main results in either case. However, the importance and prevalence of graduate degrees increased considerably between the 1980s and 2000s, which provides another potential explanation for why substitution out of the labor force into graduate education plays a larger role in our analysis.
assessed the robustness of their results to expanding their sample to include workers with graduate degrees and to limiting the sample to workers with positive earnings in every year and found little change from their main results in either case. However, the importance and prevalence of graduate degrees increased considerably between the 1980s and 2000s, which provides another potential explanation for why substitution out of the labor force into graduate education plays a larger role in our analysis.
28
Specifically, 29% of students in Barron’s Tiers 3–5 fall in our bottom quality quartile, while 32, 30, and 8% fall in our second, third, and top quartiles, respectively.