
Abstract
The authors analyze self-selection and sorting of emigrants from Finland, using full-population administrative data. Their analysis focuses on employed Finnish citizens aged 25 to 54 years, who had no immigrant background. Findings show that emigrants are more educated, have higher earnings, and are more likely to have worked as managers or professionals when compared to those who did not emigrate (the stayers). These findings hold for short-term and long-term emigrants. Emigrant self-selection in terms of residual earnings is U-shaped, which holds when adding occupational controls, as well as when married and unmarried men and women are studied separately. Results also show strong evidence of sorting: Men who emigrate outside Nordic countries are considerably better educated, have higher earnings, and are more likely to have worked as managers or professionals than men who emigrate to other Nordic countries. Also, language is important: Swedish-speaking Finns are much more likely to emigrate to other Nordic countries than Finnish speakers.
In a seminal contribution, Borjas (1987) presented migration decision as an extension of Roy’s (1951) model of occupational self-selection: Individuals differ in their productive capacities (or skills) and countries differ in the returns to skills. If skills are largely transferable and returns to skills in the potential destination country are higher (lower) than in the origin country, then migrants tend to come predominantly from the upper (lower) parts of the skill distribution. Subsequent literature has highlighted the importance of migration costs. Chiquiar and Hanson (2005) showed that the migrants from more unequal countries may be self-selected from lower, upper, or intermediate parts of the skill distribution when migration costs are negatively correlated with skills. Grogger and Hanson (2011) presented a model in which migration cost has two components: a fixed monetary cost and a component that may increase or decrease with skills. Their model explained two stylized patterns of global migration flows: positive selection (migrants are generally more educated than non-migrants) and positive sorting (more-educated migrants tend to choose destinations that offer higher returns to skills). Adserà and Pytliková (2015) have shown that migration rates are higher between countries whose languages are more similar. This finding can reflect lower migration costs and better transferability of human capital.
What is the role of occupation, marriage, and language in emigration decision and migrant self-selection? To answer this question, we use full-population administrative data from Finland. First, we analyze self-selection and sorting of emigrants in terms of education, occupation, earnings, and residual earnings, and examine whether outcomes differ between migration spells lasting one to five years and those lasting more than five years. An analysis of residual earnings sheds light on the otherwise elusive unobserved abilities. We also decompose overall migrant self-selection separately for men and women into components that can be explained by education, other demographic characteristics such as age and family situation, occupation, and unobservable abilities measured by residuals from Mincerian wage regressions. Given that managers and professionals play a disproportionate role in knowledge-based economies, their emigration decisions are of special interest to governments and to firms evaluating their future recruitment potential. Second, we analyze how gender differences in emigrant self-selection vary according to marital status, to shed light on differential self-selection and sorting between men and women. Third, to shed light on the role of non-monetary migration costs and skill transferability we compare migrant self-selection and sorting of emigrants to Nordic and non-Nordic destinations between Finnish speakers and Swedish speakers. Thanks to shared language, it is much easier for Swedish speakers to emigrate to other Nordic countries. Finland is uniquely suited to analyze the role of language in migrant self-selection at the individual level. It has an established Swedish-speaking minority for whom migrating especially to Sweden, but also to other Nordic countries, is much easier as they can continue using their mother tongue at work and in everyday life. As other Nordic countries are culturally and historically close to Finland, we analyze emigration into other Nordic countries and to the rest of the world separately also for Finnish speakers.
We restrict our analysis to Finnish citizens with no immigrant background because return decisions of previous migrants differ qualitatively. When analyzing self-selection with respect to earnings or residual earnings, we restrict the analysis to prime working-age individuals who were at least 25 and at most 54 years old, and who were registered as employed for 12 months during the year. We also required their main type of activity to have been being employed and dropped individuals who were classified as entrepreneurs. We made this decision because taxable income of entrepreneurs, owing to its tendency to fluctuate, is a noisier measure of earnings potential than is the same measure for employees. We do, however, also show results that include entrepreneurs.
Data
Our main data source is the FOLK-modules, a high-quality, registry-based, full-population research data set provided and maintained by Statistics Finland. The modules include rich information on socioeconomic characteristics of the population residing permanently in Finland. The data also have information on emigration and eventual return migration events, including information on the date of migration and the destination country. 1 We restrict our analysis to individuals who are of Finnish origin and are born in Finland. 2 For this study, an emigrant is an individual in (any of the cross sections of) our data set who emigrates from Finland in the given calendar year and stays abroad for at least 365 days. The rest of the observations are defined as non-migrants. Because we are working in a full-population panel setting, most individuals are included in the data multiple times. As the variable for the number of months an individual has been employed during the year is only available from 1997 onward, we restrict our analysis to emigration events taking place in 1998 or later. Furthermore, we restrict the analysis to emigration events starting at latest in 2015 to be able to observe separately migrants who have stayed abroad at least five years, with our return migration data continuing until the end of 2020.
Figure 1, panel A, shows emigration from Finland from 1997 to 2014 for the whole population and for the prime working-age group (ages 25 to 54), and panel B depicts the emigration rate by age for men and women separately. Young adults are most likely to emigrate, and among them, women are more likely to emigrate than men. A possible reason for the difference could be that women are more likely to study or work as au pairs abroad.
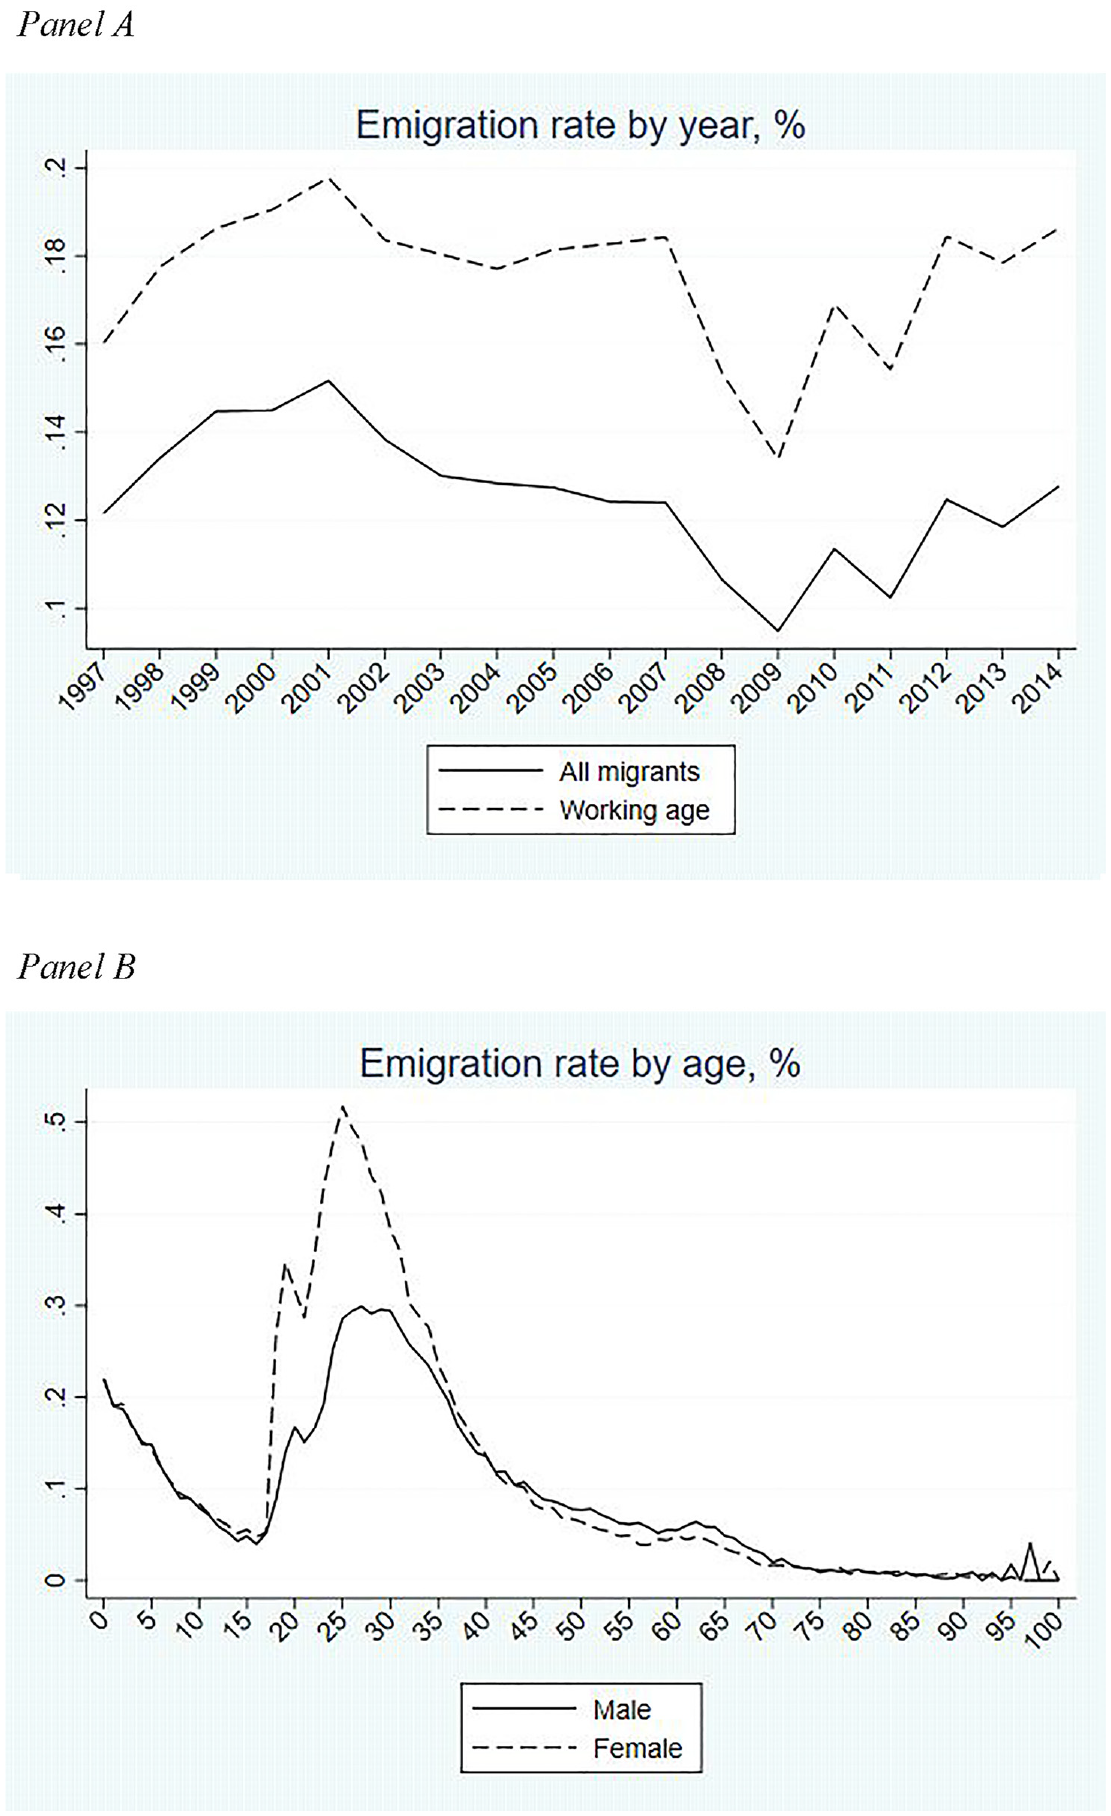
Emigration Rates by Year and by Age
Figure 2, panel A, depicts the number of emigrants by level of educational attainment. Most of those who emigrated have higher education. Figure 2, panel B, depicts emigration rates by educational attainment. The emigration rate is highest for those with a doctoral degree, followed by those with a master’s degree or a high school degree only. The high emigration propensity for those with a high school degree is likely explained by those with a high school degree migrating to study abroad. In addition, the Finnish registry data do not include all degrees that are attained abroad, so some individuals who have high school as their highest attained education in the data may have a higher degree from a foreign educational institution. Online Appendix Figures A1.1–A1.3 present emigration rates separately by age groups and show that those with a doctoral degree are most mobile within those aged 25 to 30, 31 to 40, and 41 to 54. (Hereafter, numbering for all Online Appendix Figures and Tables is prefaced with an “A.”)
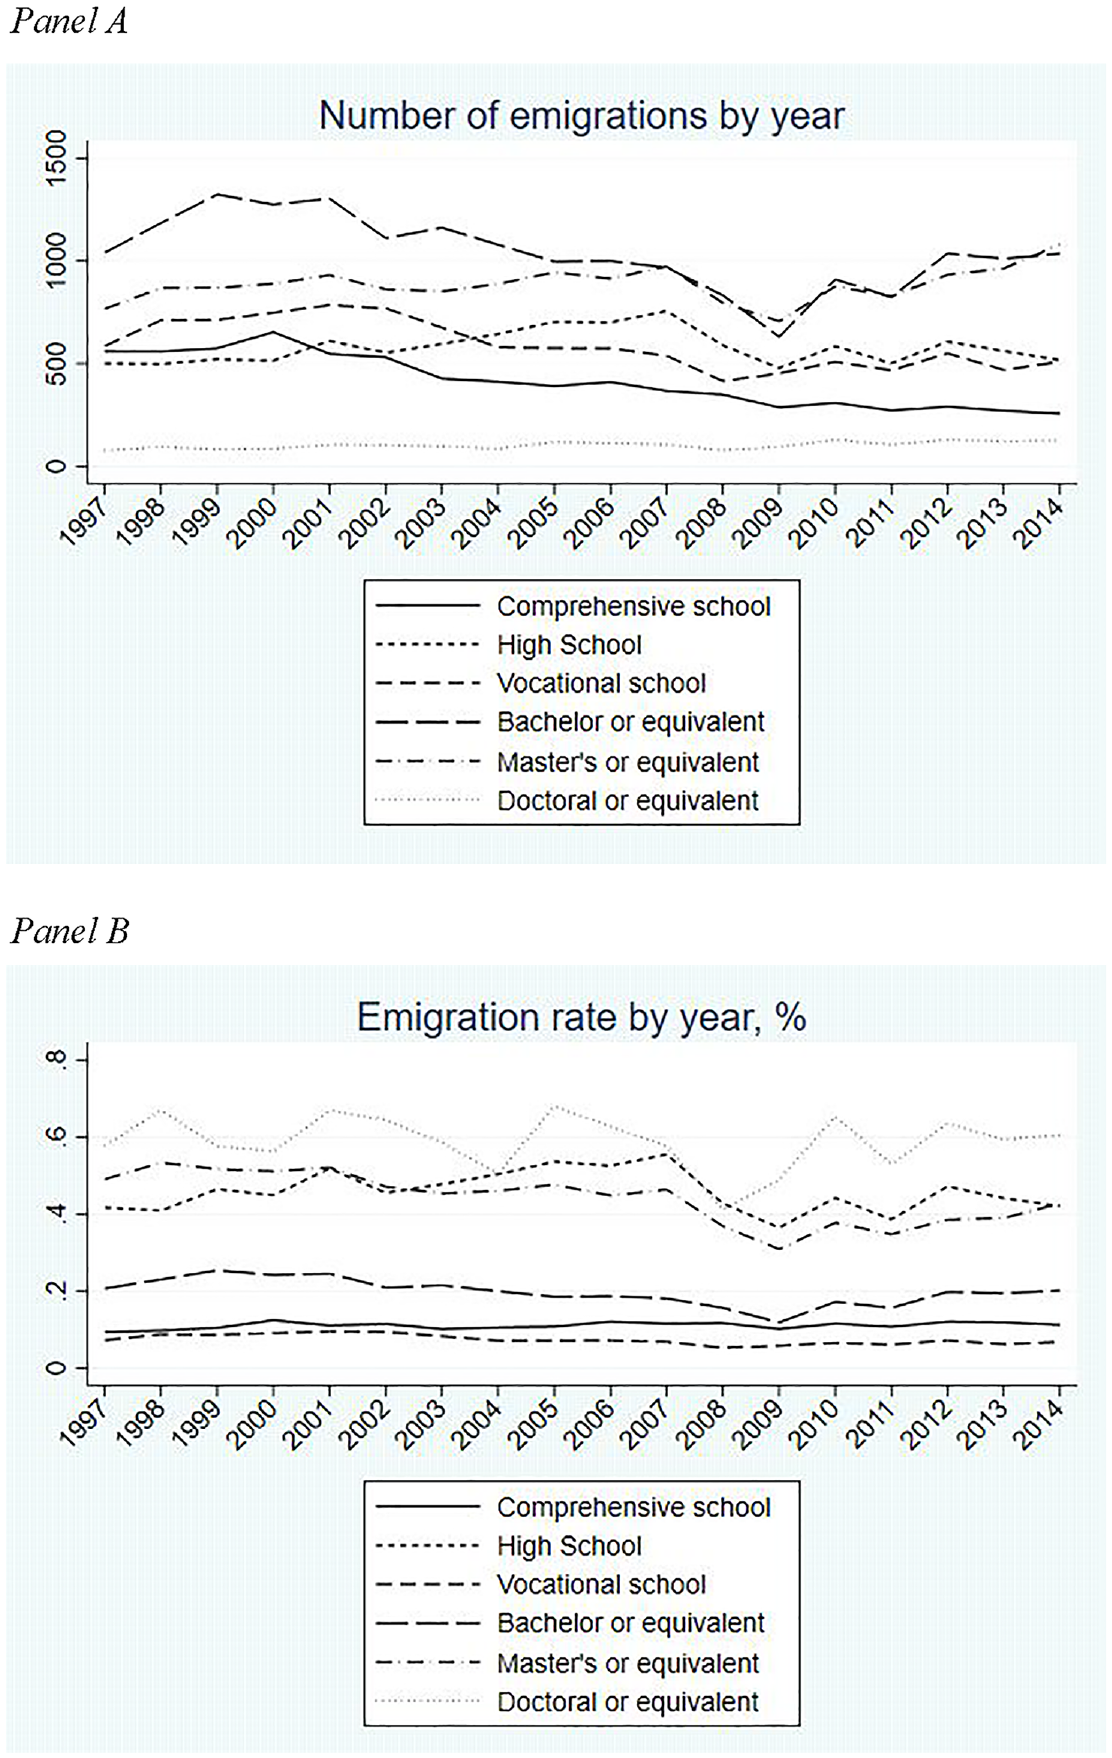
Emigration Flows and Emigration Rates by Educational Attainment
Figure A2.1 shows that almost 60% of migrants who reside abroad for a minimum of one year end up staying there for at least five years. Figure A2.2 presents the percentage of emigrants who stay abroad for at least five years according to the duration of the spell. Almost 80% of these long-term migrants are still abroad after 10 years. When we restrict our self-selection analyses to migration spells of five years or more, we are essentially studying migration that is mostly permanent.
Self-Selection in Pre-migration Earnings and Observable Characteristics
In this section we present empirical evidence on the self-selection of emigrants from Finland in terms of educational attainment, occupation, and standardized earnings from the year before emigration. We also analyze how emigration differs between single and married individuals and between Finnish speakers and Swedish speakers to other Nordic countries in which the national language is either Swedish or closely related to it, as well as to non-Nordic destinations for which we expect migration costs to not depend much on the mother tongue. Bleakley and Chin (2004) have already shown in the US context that childhood immigrants from non-English-speaking countries who arrived in the Unites States at a younger age have higher earnings as adults, while age at arrival is less important for immigrants from English-speaking countries. The intuition is that younger children learn languages more easily, giving those arriving at a younger age an advantage in education and labor markets. In line with this thinking, Adserà and Pytliková (2015) have shown that migration rates are higher between countries that share the same language, as well as between countries with closely related languages. A shared or closely related language makes labor market and social integration easier, thereby increasing returns to skills and reducing migration costs. Therefore, we expect that Swedish speakers are considerably more likely to emigrate to other Nordic countries than are Finnish speakers. Because Swedish (a Germanic language) is more closely related to languages also in all main destinations outside Nordic countries than is Finnish (a Finno-Ugric language), the results by Adserà and Pytliková (2015) suggest that the overall emigration rate of Swedish speakers is likely to be higher than that of Finnish speakers. Previous literature, however, does not address how we should expect self-selection to other Nordic countries to differ across the skill distribution between Finnish speakers and Swedish speakers (Grogger and Hanson 2011). If sharing the same language reduces migration costs predominantly for the low-skilled, for example because learning a different language is more costly for them, it could result in less positive self-selection of Swedish-speaking migrants. However, sharing the same language also improves the cross-border transferability of human capital, which could especially benefit the high-skilled. In that case, self-selection among those migrating to other Nordic countries could be more positive among Swedish speakers.
We further aim to limit the self-selection analysis to individuals who worked full time and have likely completed their studies, as the observed annual income of part-time workers may not be indicative of their true earnings potential. Therefore, we restrict the analysis to prime working-age individuals who were registered as employed for 12 months during the year they were included in the data. We also require that the included individuals have been employed and drop from the main analysis individuals whose socioeconomic group was either entrepreneurs or farmers and forestry entrepreneurs, as well as individuals with a missing socioeconomic group; we include self-employed in an analysis in the Online Appendix. The income variable in the subsequent analysis is total earned income. We drop individuals whose income is missing or zero. After all the other data restrictions were imposed, only 0.03% of the observations had zero incomes.
To focus on migration that is permanent in nature, we concentrate in the main text on observations with emigration spells that last at least five years and present results for shorter spells in the Online Appendix. We restrict the analysis to the cross section of individuals between 25 and 54 years of age who were employed, defined separately for each year from 1997 to 2014. Table 1 reports summary statistics of the obtained sample. The panel contains person-year observations for 11,131,055 male and 10,931,896 female non-migrants and 5,447 male and 5,306 female migrants covering the years 1997 to 2014. By construction, these migrants are individuals who resided in Finland in the year for which self-selection is analyzed and emigrated in the subsequent year (between 1998 and 2015) and did not return to Finland within five years. These individuals are included as non-migrants in the years prior to the year in which they are included as persons emigrating in the following year, provided they satisfied the age and employment conditions. As Table 1 shows, the Finnish emigrants, both men and women, are younger than the non-migrants. Despite the age difference, the emigrants’ annual earnings were on average higher in the year prior to emigration than those of the stayers.
Summary Statistics
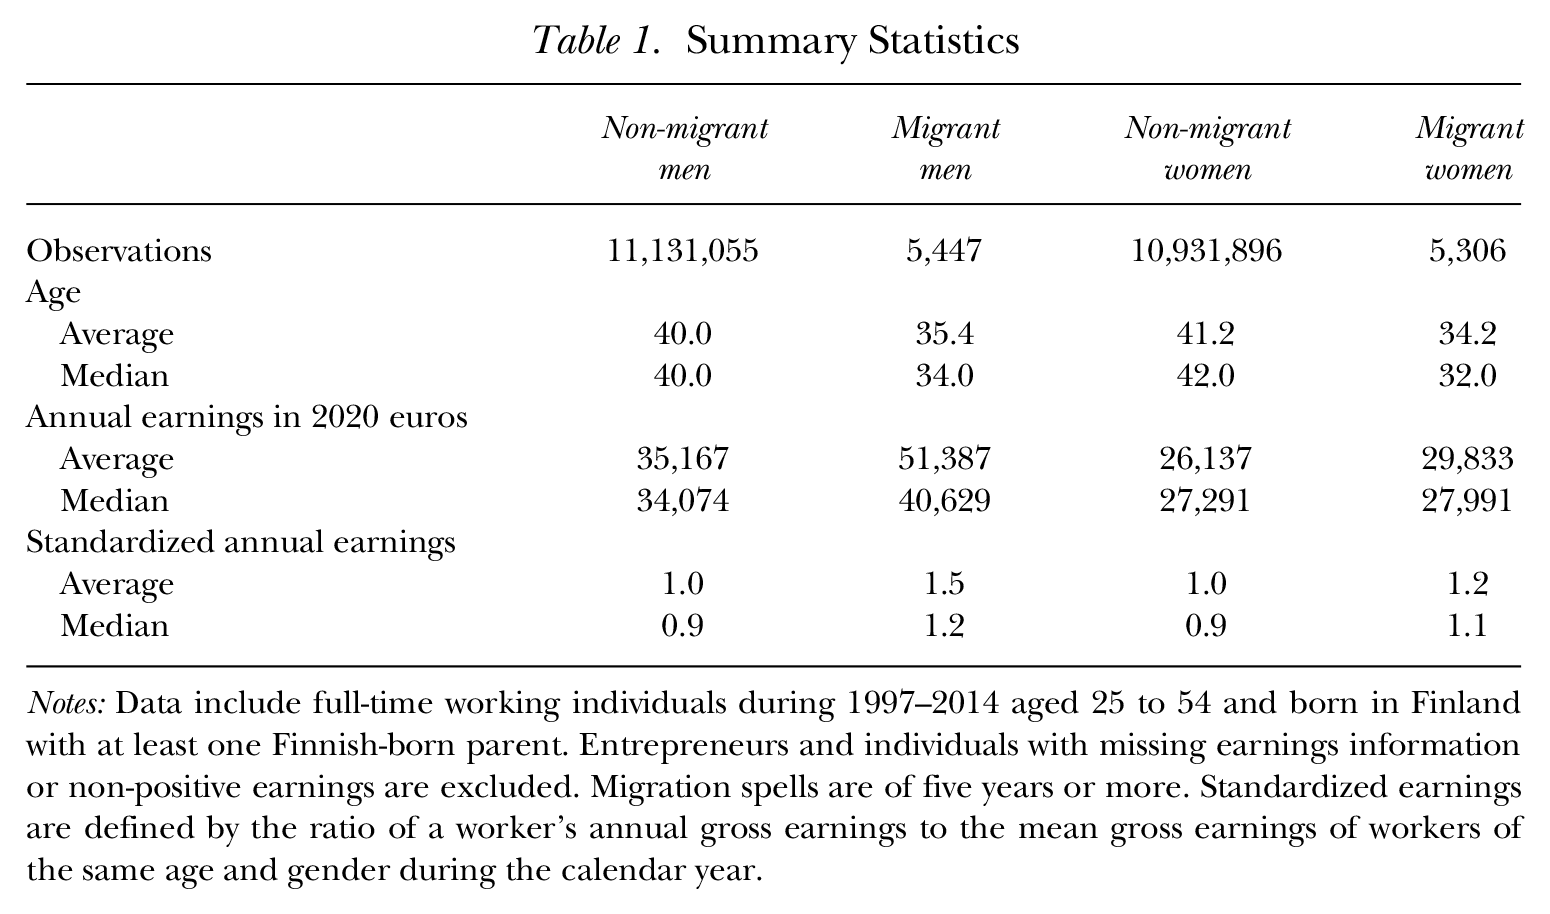
Notes: Data include full-time working individuals during 1997–2014 aged 25 to 54 and born in Finland with at least one Finnish-born parent. Entrepreneurs and individuals with missing earnings information or non-positive earnings are excluded. Migration spells are of five years or more. Standardized earnings are defined by the ratio of a worker’s annual gross earnings to the mean gross earnings of workers of the same age and gender during the calendar year.
To adjust for age, gender, and year effects, we construct a measure of “standardized earnings” following Borjas, Kauppinen, and Poutvaara (2019). Standardized earnings are defined by the ratio of a worker’s annual gross earnings to the mean gross earnings of workers of the same age and gender during the same calendar year. 3 Table 1 shows that those who emigrate earn more than non-migrants in terms of standardized earnings in the year before they emigrated.
Table A1 reports the number of emigrants moving to various destinations. The most popular destination for both men and women is Sweden, followed by the United States, Germany, and the United Kingdom for men and the United Kingdom, the United States, and Germany for women. These four countries account for 53% of the total emigrations in our sample.
Table 2 presents the highest education level attained by migrants and non-migrants, conditional upon migrants staying abroad for at least five years. Migrants tend to have higher educational qualifications than the non-migrants, for both men and women. The share of those with a master’s degree or equivalent, or a PhD or equivalent, is 13% for men who stay in Finland, whereas the share is 30% for men who migrate to other Nordic countries and 48% for men who migrate to non-Nordic destinations. For women, the share of migrants to non-Nordic destinations who hold a master’s degree or higher is 38%, whereas corresponding shares for non-migrants and migrants to other Nordic countries are 14% and 31%. Correspondingly, shares of those with vocational schooling and comprehensive schooling degrees are significantly lower among migrants than among non-migrants. Having a high school degree as the highest educational qualification is common among migrants to all destinations. This finding can be partly explained by those with high school degrees migrating to study abroad. Note, too, that some educational degrees that are attained abroad are not observed in the registry data. Hence, it is possible that some of the migrants who are registered as having only a high school degree may hold higher educational degrees from abroad. Short-term migrants, much like long-term migrants, are positively self-selected in terms of their education (Table A2).
Education Levels of Non-Migrants and Long-Term Migrants
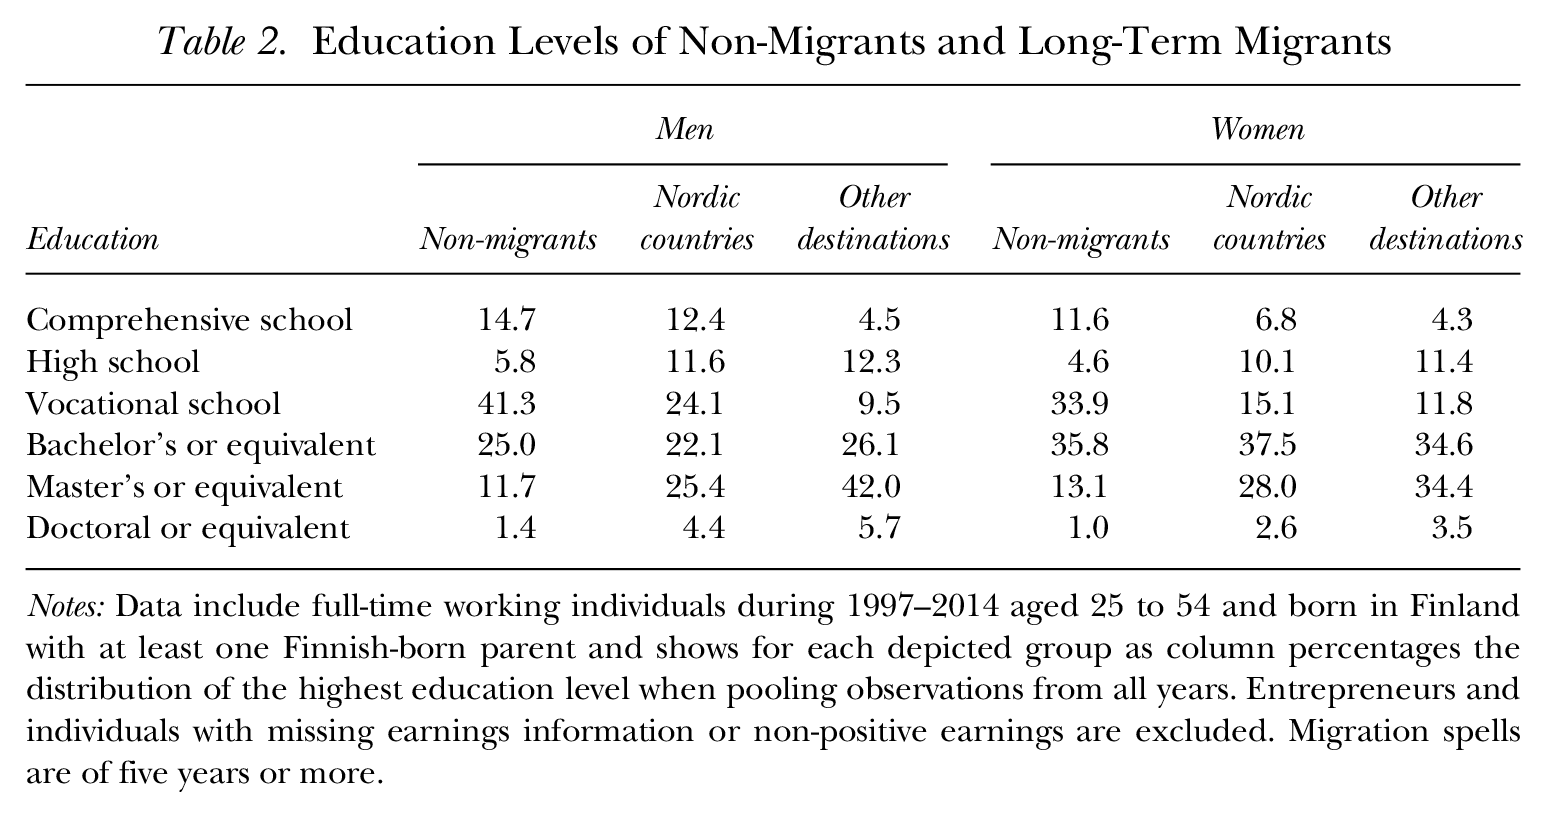
Notes: Data include full-time working individuals during 1997–2014 aged 25 to 54 and born in Finland with at least one Finnish-born parent and shows for each depicted group as column percentages the distribution of the highest education level when pooling observations from all years. Entrepreneurs and individuals with missing earnings information or non-positive earnings are excluded. Migration spells are of five years or more.
We also analyze self-selection and sorting of emigrants according to their occupation. This detail links our article to Patt, Ruhose, Wiederhold, and Flores (2021), which analyzed the role of occupation for self-selection among Mexican migrants to the United States. The authors found that migrants have higher manual skills and lower cognitive skills than non-migrants. 4 Table 3 shows 1-digit occupational classifications of non-migrants, migrants to other Nordic countries, and migrants to other destinations. We find that among both men and women, managers and professionals are significantly more likely to emigrate. We also find strong sorting between Nordic and non-Nordic destinations among men: Managers and professionals form 27% of non-migrants, 47% of migrants to Nordic countries, and 66% of migrants to non-Nordic destinations. Among women, managers and professionals form 26% of non-migrants, 41% of migrants to Nordic countries, and 45% of migrants to non-Nordic destinations. Correspondingly, service and sales workers, manual workers in industry, and workers in elementary occupations are considerably less likely to emigrate. Managers and professionals are also significantly more likely to emigrate for stays between one and five years (Table A3). The main difference is that short-term emigrants to other Nordic countries are somewhat more likely to be managers or professionals than are long-term migrants, while differences in the share of managers and professionals migrating outside Nordic countries are small between short-term and long-term migrants.
Broad Occupational Groups of Non-Migrants and Long-Term Migrants
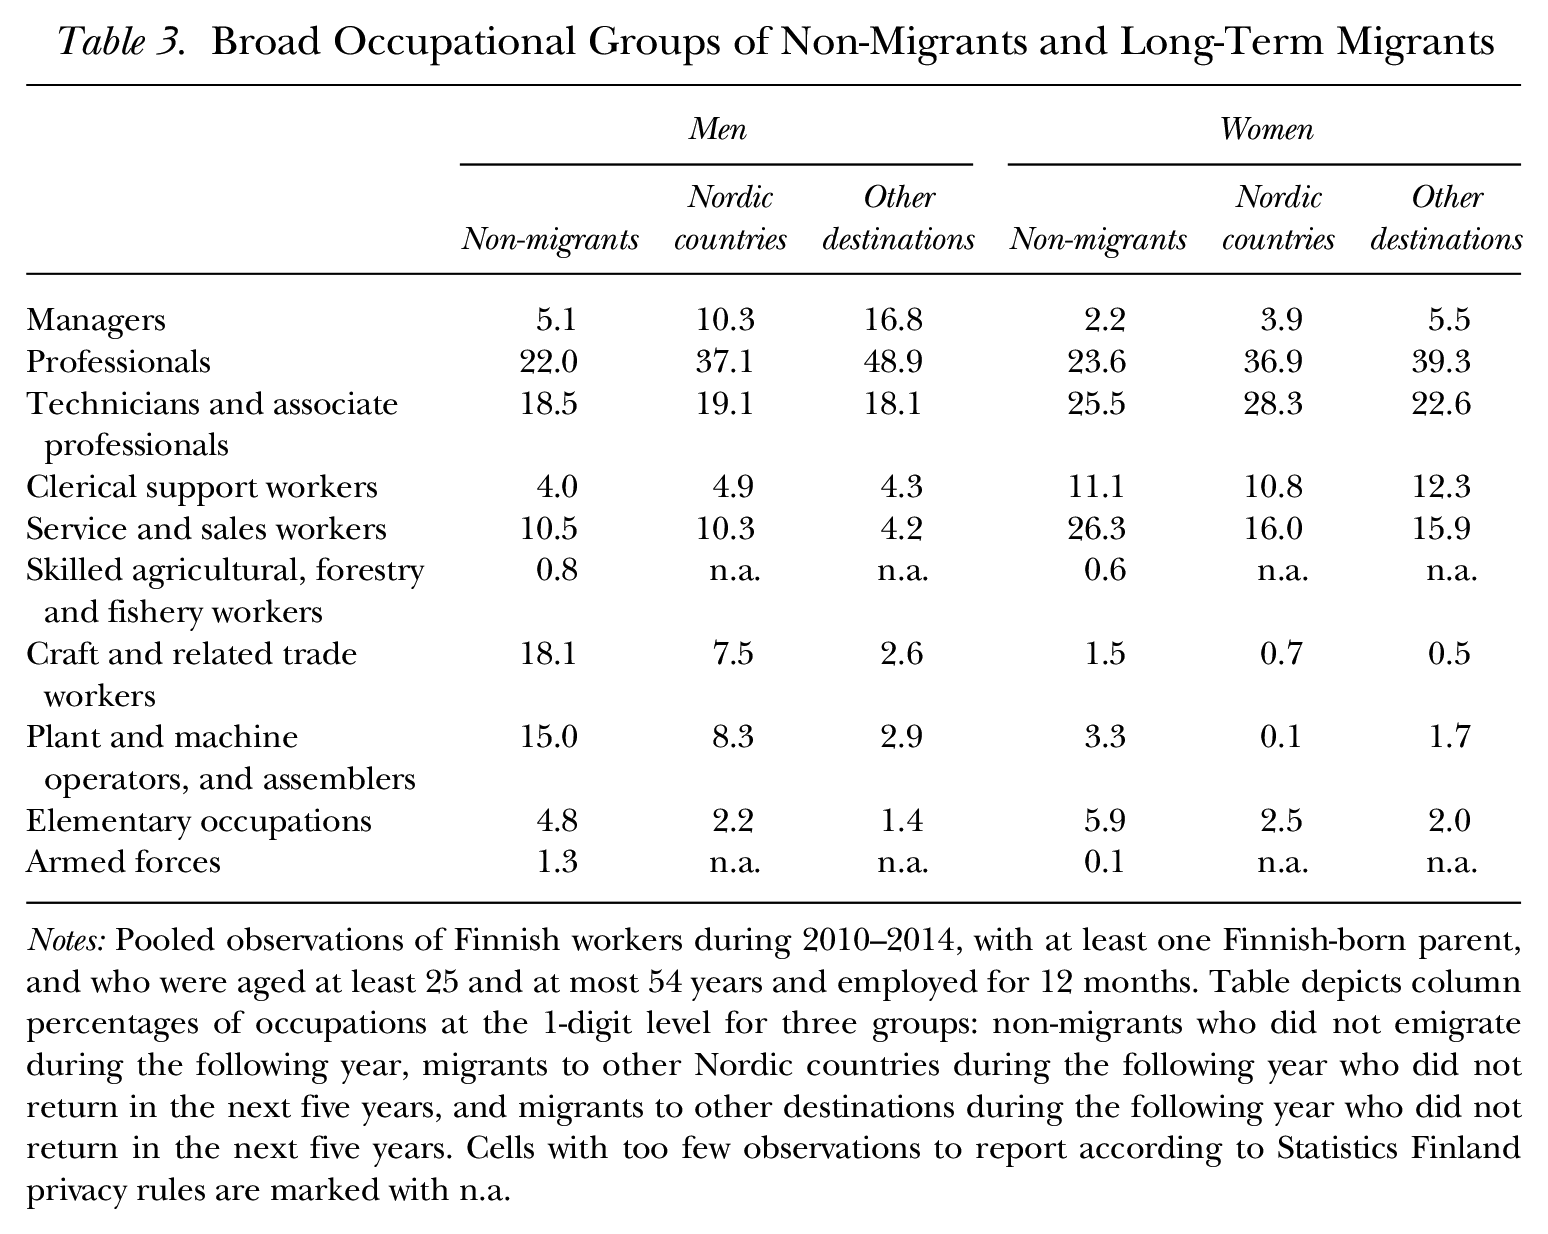
Notes: Pooled observations of Finnish workers during 2010–2014, with at least one Finnish-born parent, and who were aged at least 25 and at most 54 years and employed for 12 months. Table depicts column percentages of occupations at the 1-digit level for three groups: non-migrants who did not emigrate during the following year, migrants to other Nordic countries during the following year who did not return in the next five years, and migrants to other destinations during the following year who did not return in the next five years. Cells with too few observations to report according to Statistics Finland privacy rules are marked with n.a.
We also checked the occupational distribution using 2-digit occupational codes. Migrant self-selection is especially pronounced for science and engineering professionals (in the population depicted in Table A4, this group includes 8% of non-migrant men and 2% of non-migrant women, compared to 18% of men and 7% of women migrating to non-Nordic destinations), business and administration professionals (4% of non-migrant men and 5% of non-migrant women, compared to 11% of men and 12% of women migrating to non-Nordic destinations), and information and communications technology professionals (4% of non-migrant men and 1% of non-migrant women, compared to 11% of men and 3% of women migrating to non-Nordic destinations). Science and engineering professionals are an even higher fraction of men emigrating for one to five years, suggesting that a significant part of their emigration is brain circulation rather than brain drain (Table A5). Emigration rates among associate professionals and technicians are considerably lower (Tables A4 and A5).
Table 4 presents the logit estimates for the probability of emigration by gender. The regressions confirm that for both men and women, those with higher education are more likely to emigrate. Furthermore, findings show that those with children are less likely to emigrate. Both these patterns are similar to that Borjas et al. (2019) found for Denmark. In terms of family situation, an interesting difference emerges. Borjas et al. (2019) found that marriage reduces the probability of emigration for both men and women. Our estimates suggest that in Finland, married women are less likely to emigrate, but married men are more likely to emigrate than single men when other controls are also included. In the subsequent analysis, we dig deeper into how self-selection differs between married and single men and women. In the population analyzed in Table 4, emigration rates are 0.057 for unmarried men, 0.071 for unmarried women, 0.042 for married men, and 0.031 for married women. Therefore, even though the estimated effect of being married is to increase emigration among men, ceteris paribus, the emigration rate among married men is still lower than among unmarried men. Differences between comparing average emigration rates without controls and regression estimates can be explained by collinearity between marriage and other controls associated with differential mobility, such as age and education.
Logit Estimates of the Probability of Long-Term Emigration, by Gender
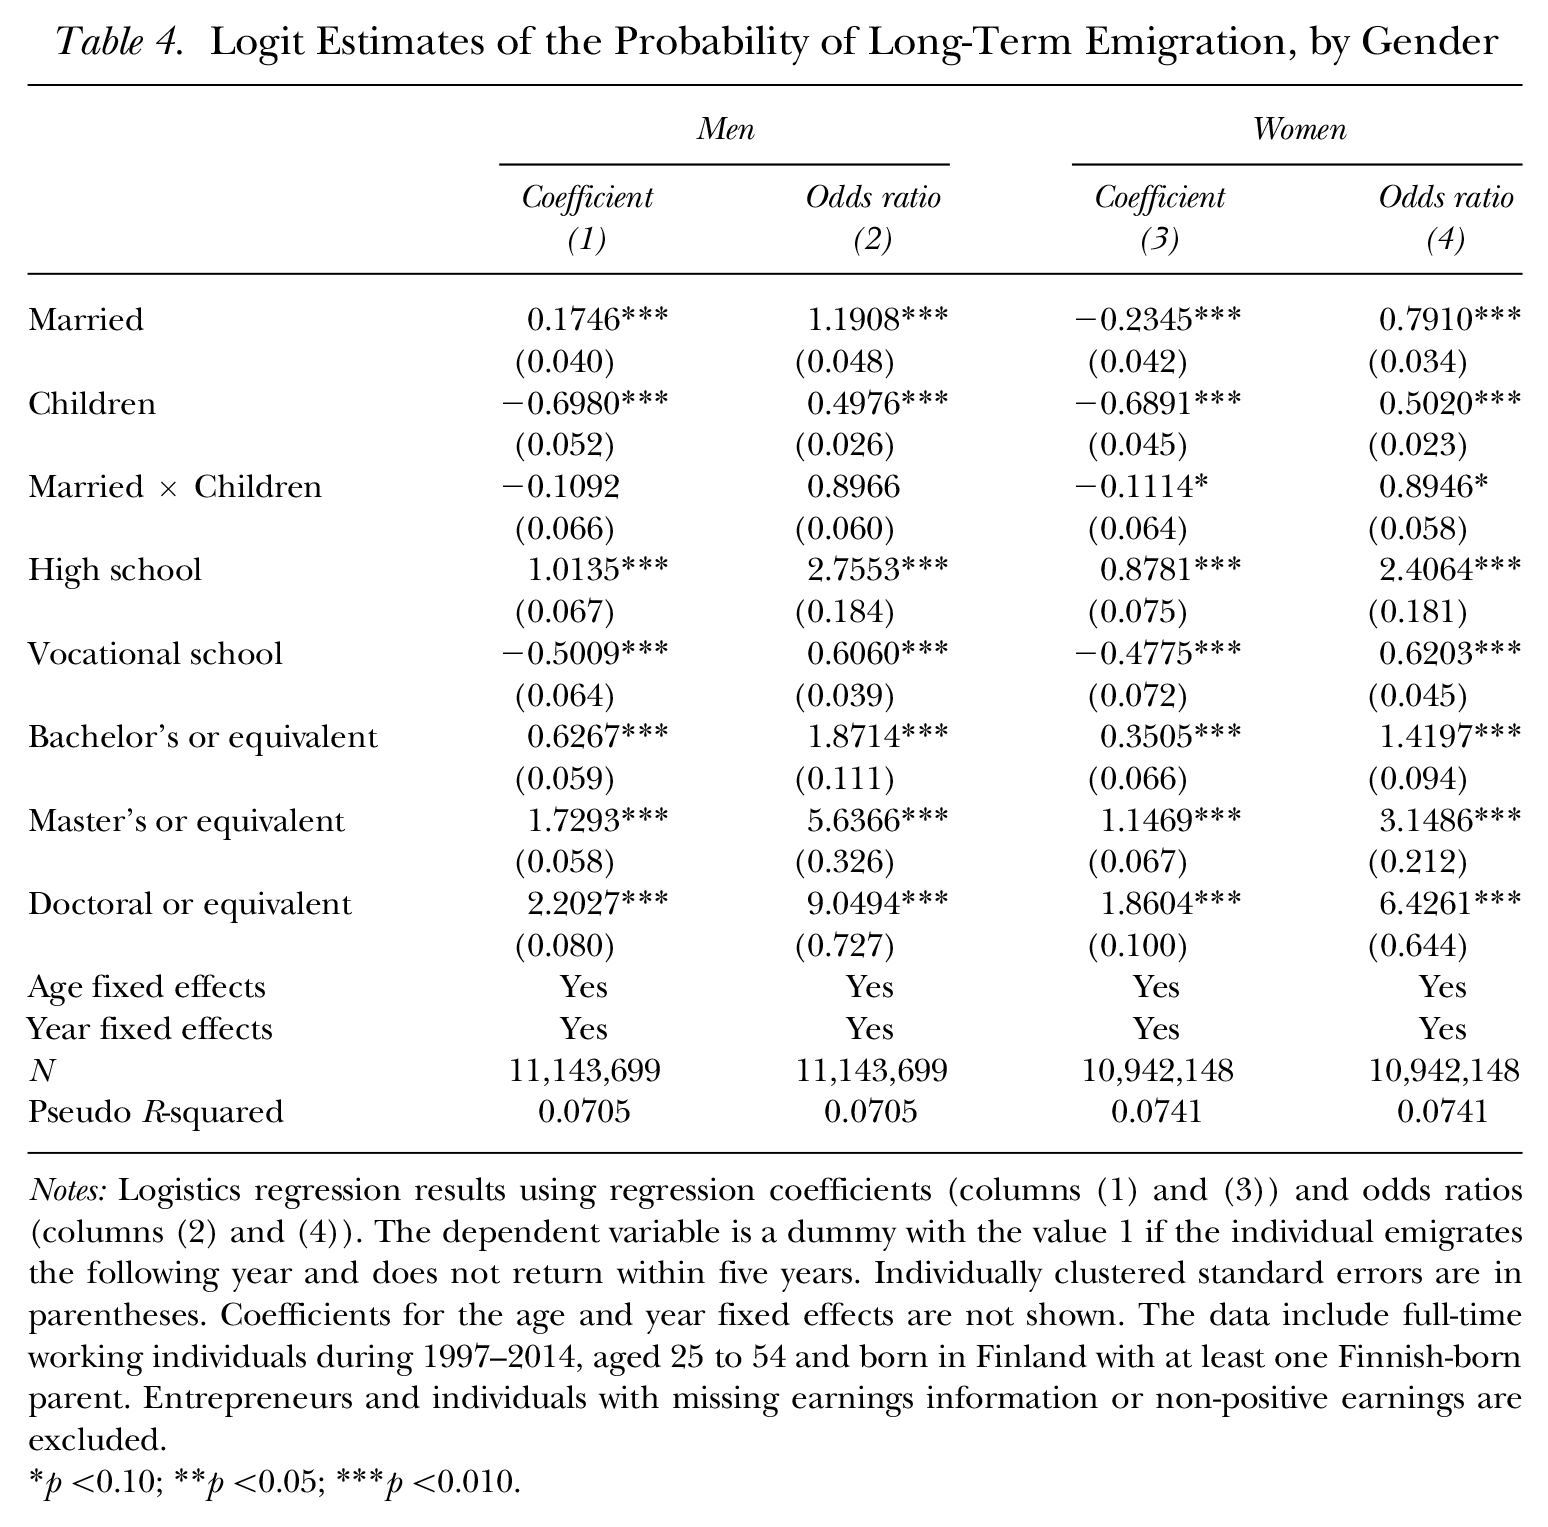
Notes: Logistics regression results using regression coefficients (columns (1) and (3)) and odds ratios (columns (2) and (4)). The dependent variable is a dummy with the value 1 if the individual emigrates the following year and does not return within five years. Individually clustered standard errors are in parentheses. Coefficients for the age and year fixed effects are not shown. The data include full-time working individuals during 1997–2014, aged 25 to 54 and born in Finland with at least one Finnish-born parent. Entrepreneurs and individuals with missing earnings information or non-positive earnings are excluded.
p <0.10; **p <0.05; ***p <0.010.
Table A6 shows that if we control for education and log of standardized earnings simultaneously, self-selection with respect to university education remains positive, and is strongest for those with doctoral or master’s degree. Once education is controlled for, men are positively self-selected with respect to log standardized income, whereas women are negatively self-selected, even though women who emigrate have higher standardized earnings (as shown in Table 1). A potential explanation for this is the co-location problem that couples face in deciding whether to migrate (Mincer 1978). Munk, Nikolka, and Poutvaara (2022) showed that couples that emigrate from Denmark emigrate much more often for male partner’s work than for female partner’s work, which might explain weaker self-selection with respect to women’s earnings.
Tables A7–A10 show that the probability of emigration is higher for those with university education as well as for managers and professionals when education and occupation are included as predictors of emigration at the same time. Therefore, education plays an independent effect, in addition to its effect through occupation.
In the analyses so far, we have concentrated on wage earners. Migration of the self-employed or entrepreneurs is also of interest, however, even though using their labor earnings as a proxy for skills is problematic. To see how internationally mobile self-employed workers are and how the status as self-employed is associated with migration decisions, we include individuals whose occupational status based on the main employment relationship is self-employed (excluding farmers and forestry entrepreneurs) in the data. Our data comprise 2,365,933 individual-year observations with self-employment as the main employment relationship, which makes up for almost 10% of the sample in which they are included. The average emigration rate of the self-employed is 0.06%, slightly less than 0.10% for the wage earners. We estimate logit regressions corresponding to those presented in Table 4, using a dummy for self-employment status, and present the results in Table A11. Despite the smaller emigration rates for the self-employed, self-employment status is associated with a greater likelihood of emigration after controlling for age, education, and marital and family status among both men and women. One reason for this is that the self-employed often have less higher education than wage earners, and higher education is associated with higher propensity to migrate. Correspondingly, having comprehensive or vocational education as the highest attained education level is more general for the self-employed. The self-employed are also slightly older on average than wage earners, while in regressions the effect of age on migration propensity is concave and negative from age 30 onward for both men and women.
The descriptive comparisons already suggest a positive selection of migrants. Differences in conditional averages could still hide substantial differences between the underlying probability distributions, so we proceed to compare cumulative distributions of standardized earnings between migrants and non-migrants. We also present kernel density estimates of the earnings density functions.
Figure 3 illustrates the cumulative earnings distributions by gender (male and female) for non-migrants, migrants to the Nordic countries, and migrants to non-Nordic countries. The values of the standardized earnings are truncated at −2 and 2 to make the graphs more tractable. 5 Men who emigrate are strongly positively self-selected in terms of their standardized earnings. Men who emigrate outside Nordic countries have higher standardized earnings than men who emigrate to other Nordic countries, a finding in line with migrant sorting predicted by Grogger and Hanson (2011). For women, selection and sorting patterns are weaker.
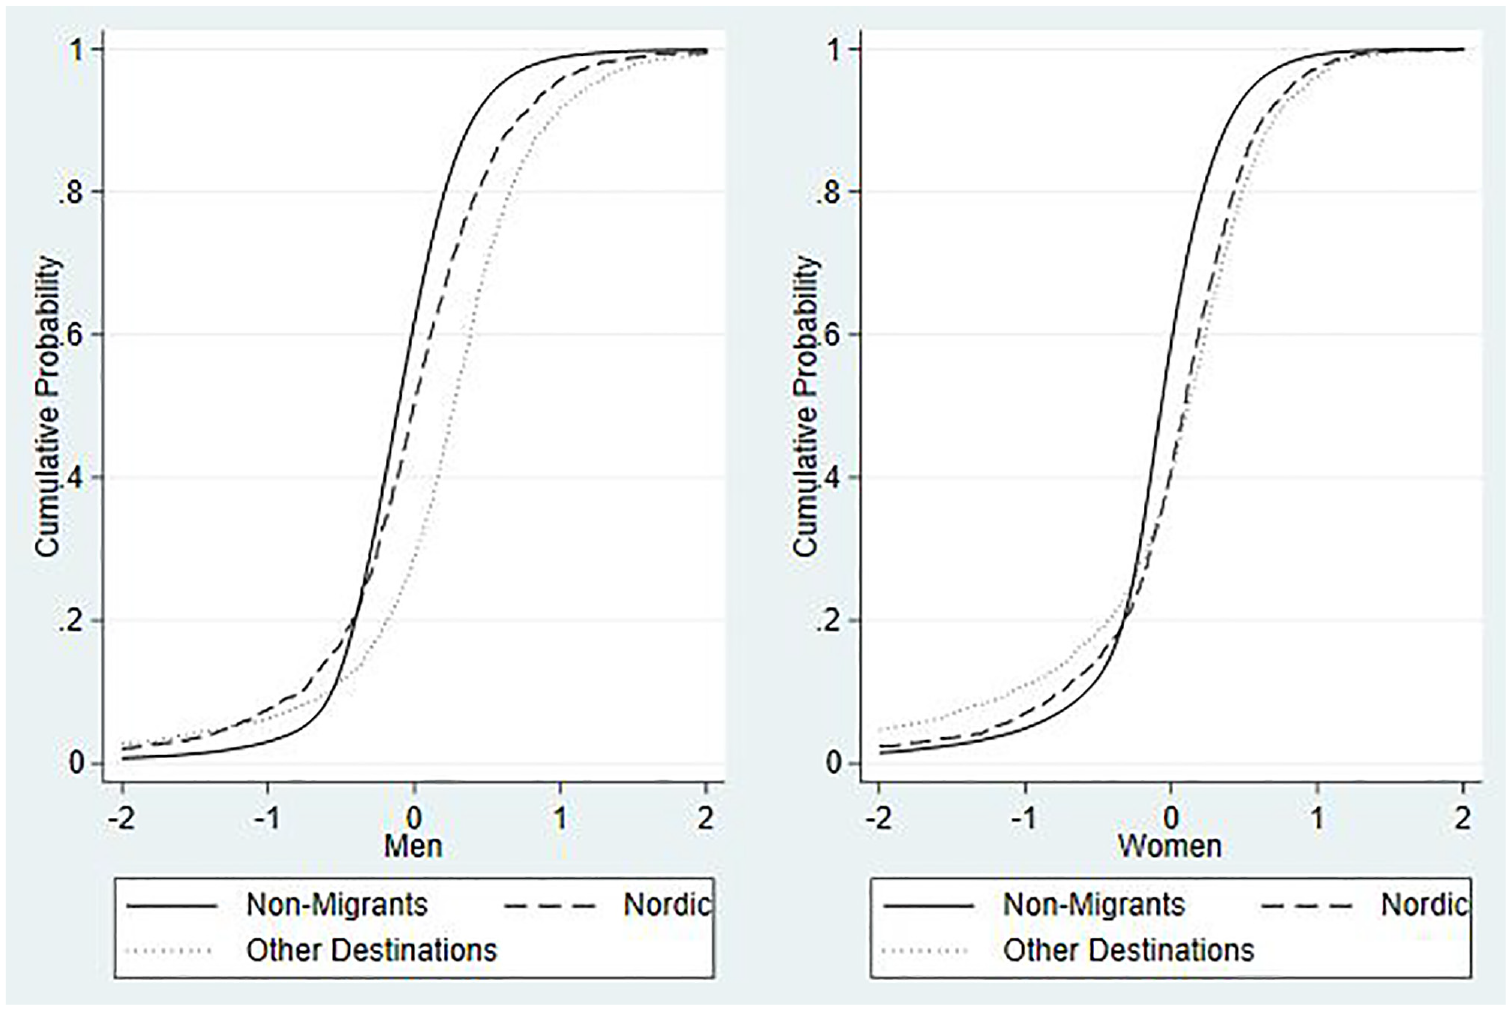
Cumulative Distribution Functions of Standardized Earnings
Figure A3 presents kernel estimates of the density functions of the logarithm of standardized pre-emigration earnings for men and women. 6 The density functions reveal that male migrants with higher earnings tend to sort themselves outside Nordic countries, while earnings distributions of female migrants to Nordic countries and outside Nordic countries are quite similar.
The weaker selection to other Nordic countries than to the rest of the world among men can be explained by the relatively low rate of return to skills in Nordic countries, as well as by lower migration costs. Several reasons suggest why migration costs to other Nordic countries can be expected to be lower than to the rest of the world. First, all Nordic countries share cultural proximity that makes migration between them easier. Second, Sweden and Norway share a border with Finland, and geographical proximity lowers both migration costs and costs of maintaining contacts with Finland after migration. Third, Finland and Sweden have strong historic ties and large numbers of Finnish immigrants settled in Sweden before our period of analysis, providing a network for subsequent migrants. Such a network could reduce migration costs especially for those with less education, as shown by McKenzie and Rapoport (2010) in the context of migration from Mexico to the United States. Fourth, Finland has a Swedish-speaking minority of about 5% for whom migrating to Sweden is easy. Further, Swedish is also recognized as an official language in Finland, and it is mandatory to learn Swedish in schools. This context might also make migration to Sweden easier for the Finnish-speaking majority.
Figure 4, panel A, presents emigration rates by decile of log standardized income for men and panel B does so for women. We find a U-shaped pattern, with the emigration rate being highest in the top decile, followed by the second highest and the lowest decile. A possible explanation for this is that at the upper part of the earnings distribution, migrants tend to be positively self-selected in terms of their transferable skills, while at the lowest decile of the earnings distribution there exists a considerable share of migrants with a bad job match.
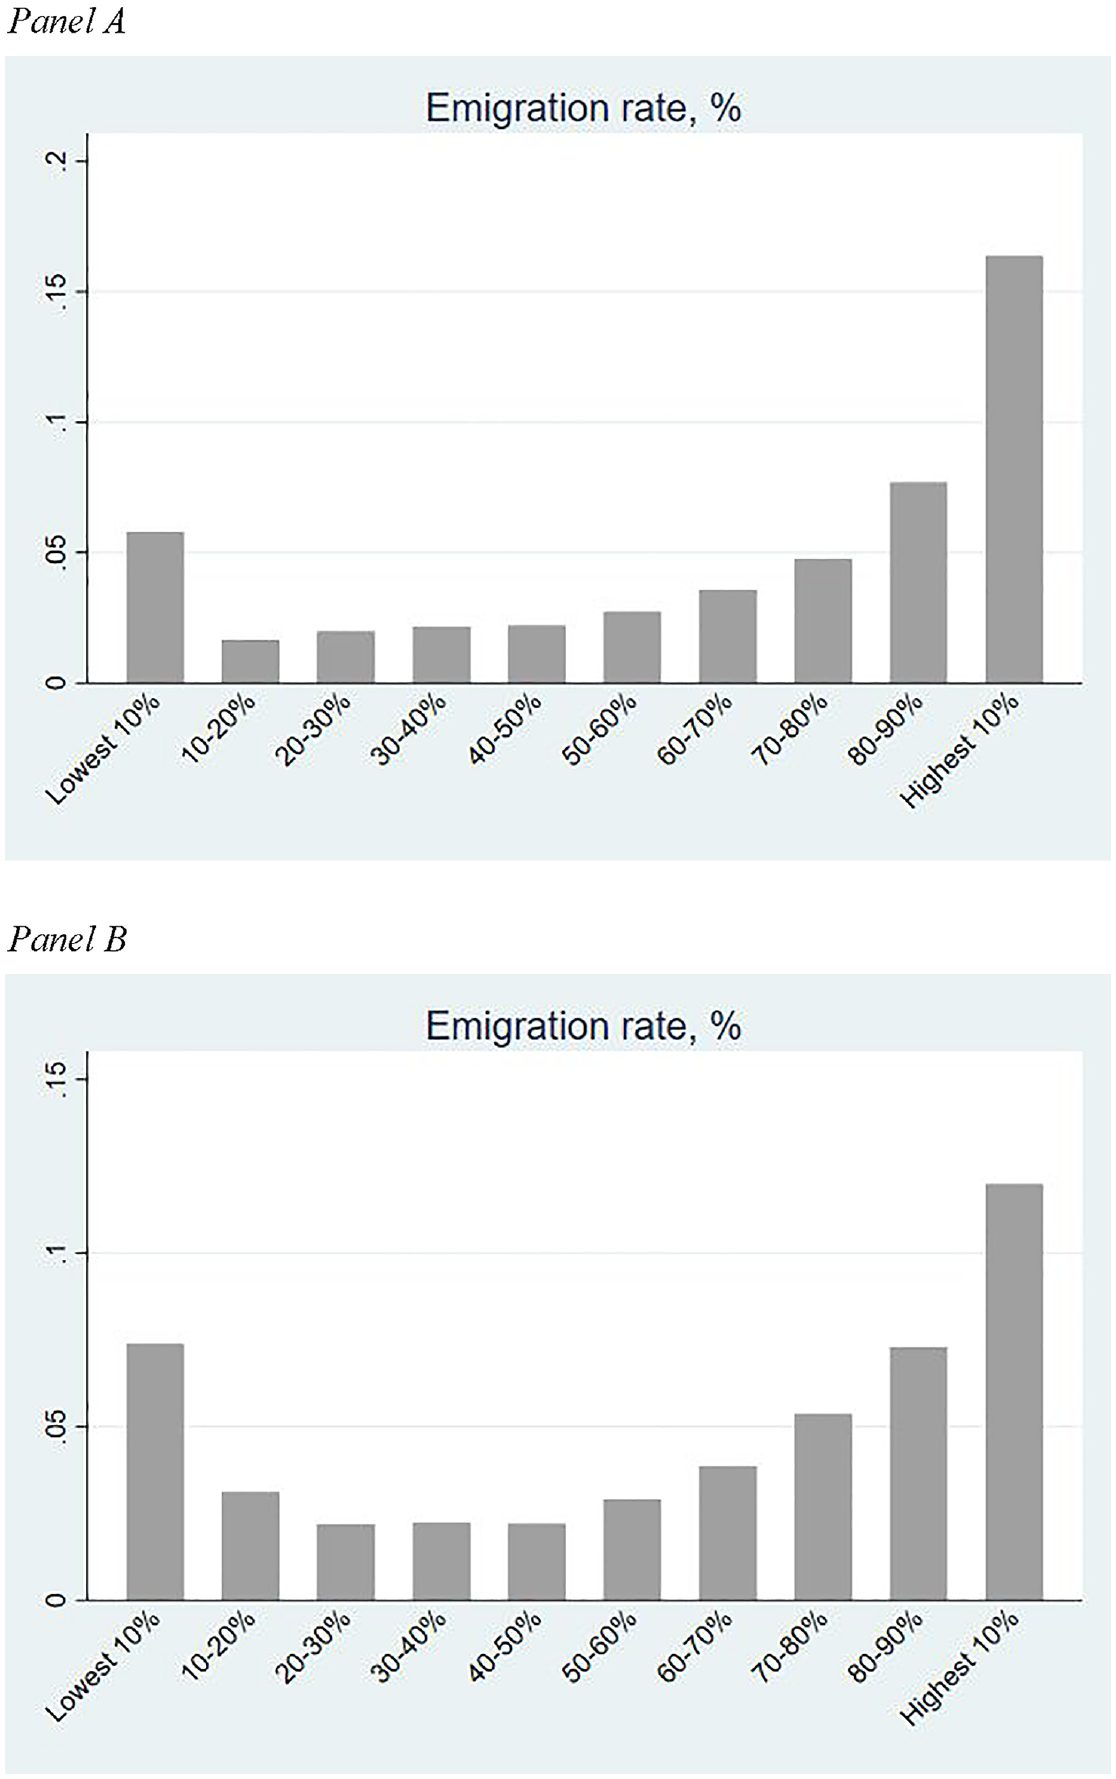
Emigration Rates by Decile of Log Standardized Income, for Men and for Women
Figure 3 showed that women who emigrate have higher average standardized earnings than women who do not emigrate, but we observe no clear sorting pattern between women migrating to other Nordic countries and to other destinations. This finding could reflect a lower gender wage gap in Nordic countries making these countries relatively more attractive for highly educated women, as well as both partners in dual-earner couples more easily finding employment corresponding to their qualifications in Nordic countries.
We also analyzed migrants’ self-selection separately according to family status. Figure 5, panel A, shows that self-selection patterns of unmarried and married men are qualitatively similar. Figure 5, panel B, shows that married women with high standardized earnings have considerably lower emigration rates than married men with high standardized earnings. This finding could reflect many couples switching to a male breadwinner model when migrating to a country where pursuing dual careers is more difficult. If the female partner has relatively low earnings already before emigration, such a switch is less costly in terms of lost female earnings. 7
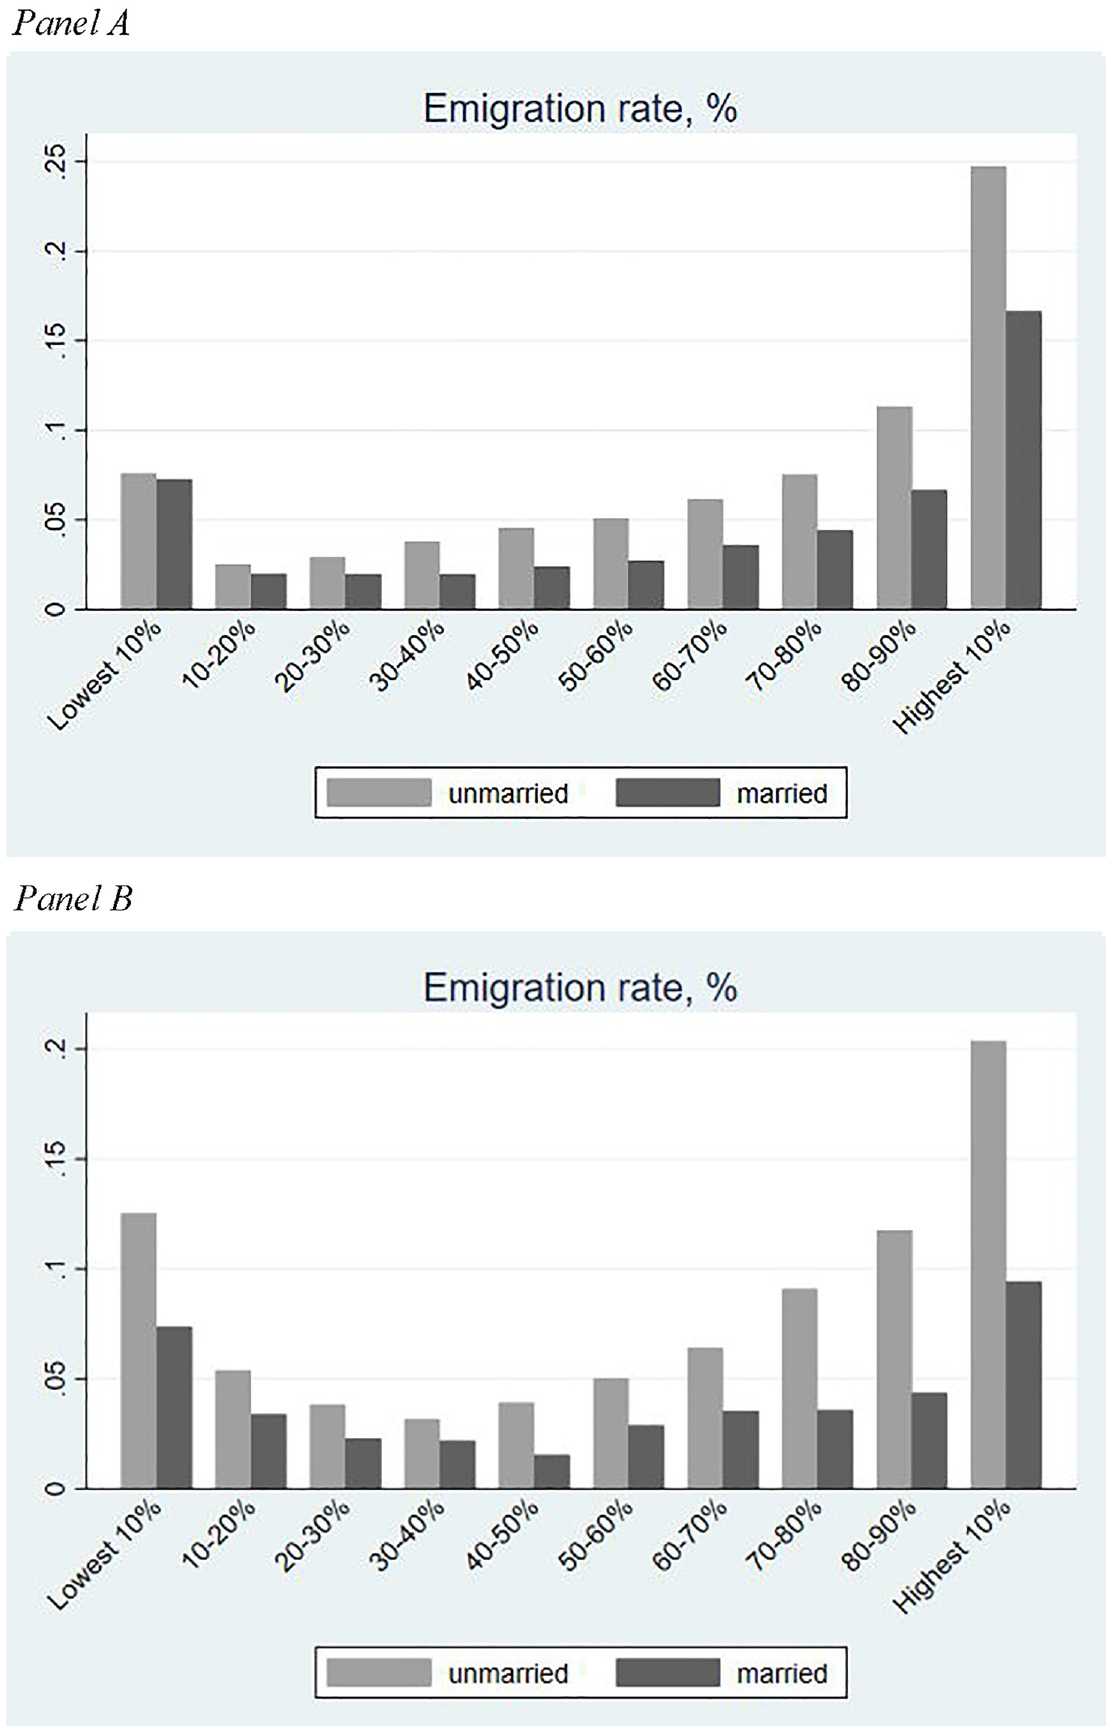
Emigration Rates by Decile of Log Standardized Income According to Marital Status, for Men and for Women
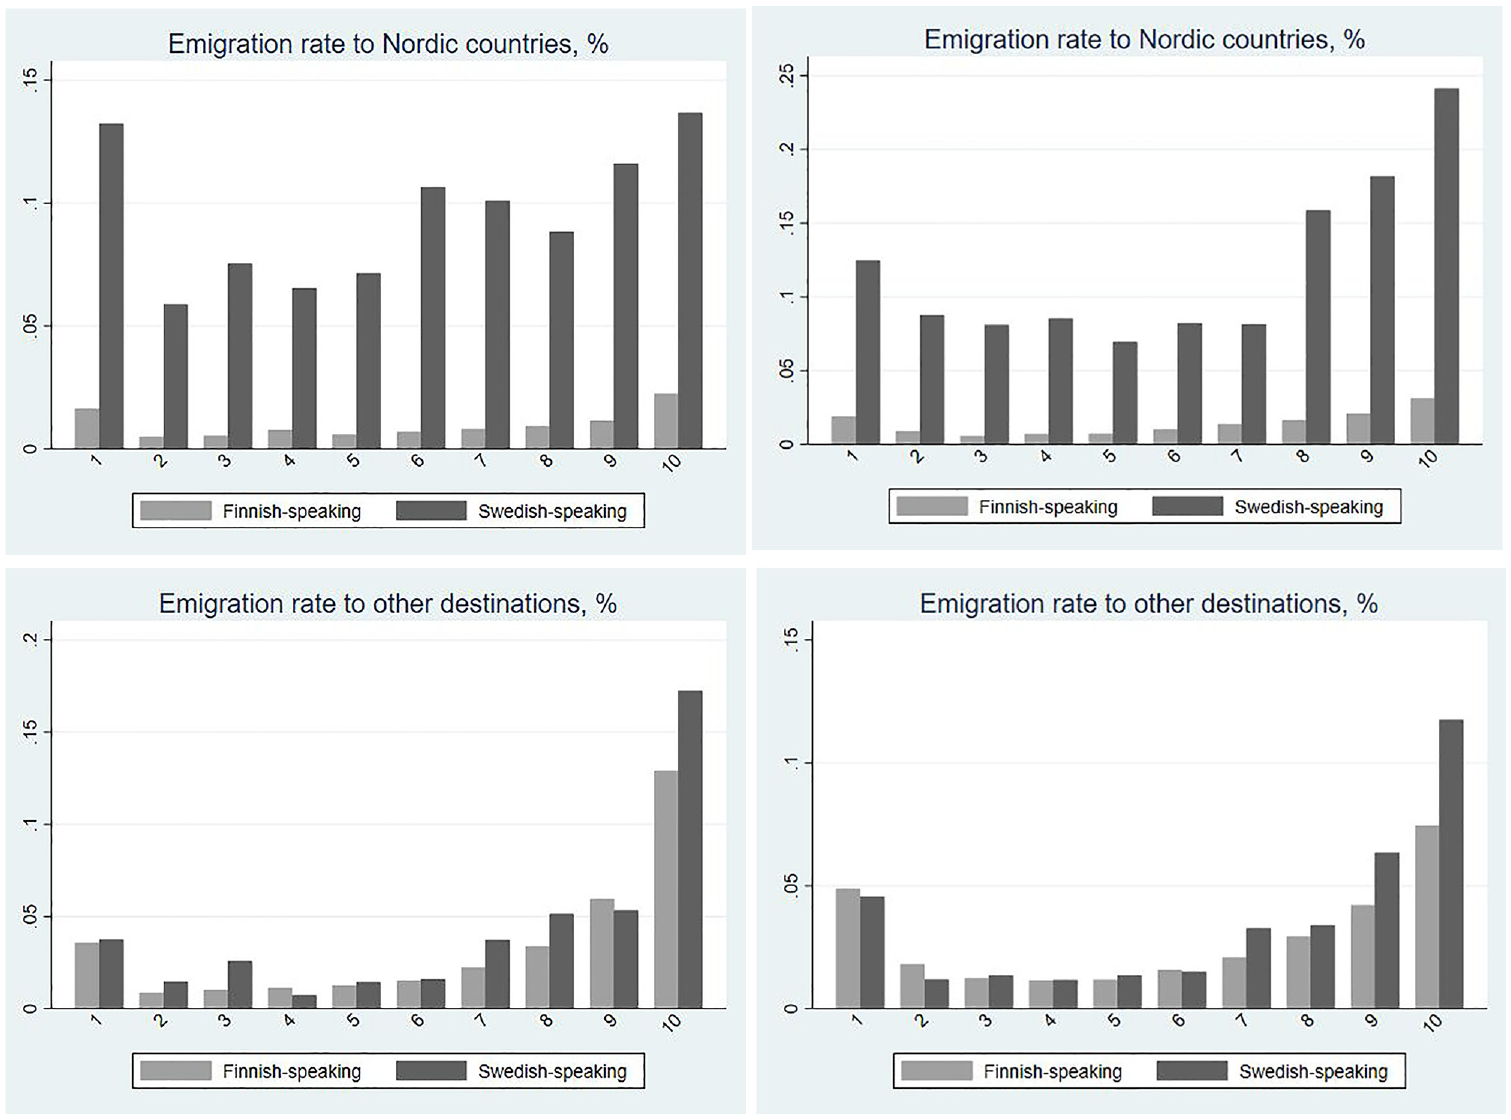
To shed light on the importance of shared language in migration decisions, we analyzed separately emigration from Finland among the Finnish-speaking majority and the Swedish-speaking minority to other Nordic countries in which the official language is either Swedish or closely related to it (Danish, Norwegian, Icelandic), and to the rest of the world. The left-hand panels in Figure 6 show men’s emigration rates by deciles of standardized earnings to other Nordic countries and the rest of the world, and the right-hand panels show the corresponding rates for women. Among both genders, average emigration rates to other Nordic countries are several times higher among Swedish speakers. Among men, the average emigration rate to other Nordic countries is 0.098 (0.010) among Swedish speakers (Finnish speakers). Among women, the corresponding rates are 0.122 and 0.014. Higher emigration rates to other Nordic countries do not come at the expense of fewer emigrants to the rest of the world: Those rates are generally quite similar across income deciles, apart from being somewhat higher for Swedish speakers in the top decile for men and in the top-two deciles for women. The results on the importance of shared language are in line with previous country-level evidence presented by Adserà and Pytliková (2015) and extend it by comparing self-selection in terms of education, occupation, and standardized earnings between linguistically closer and more distant destinations from one country of origin with diverse linguistic groups.
Emigration Rates by Decile of Log Standardized Income According to Mother Tongue and Destination
To put our results into perspective, Adserà and Pytliková (2015) found that immigration flows to an Organisation for Economic Co-operation and Development (OECD) country with the same first official language as opposed to one with the most distant language are approximately 20% higher with a large set of socioeconomic and genetic distance controls as well as time and country dummies. Much larger differences in emigration rates for different linguistic groups from Finland could reflect free mobility from Finland not only to other Nordic countries but also to all non-Nordic EU countries. With free mobility between various destinations and relatively small differences in physical distances, the effects of linguistic proximity could become more pronounced. Differences in migration flows to OECD countries from the rest of the world reflect not only differences in linguistic proximity but also differences in immigration restrictions and liquidity constraints.
Even though we find significant-level differences in emigration to other Nordic countries between Finnish speakers and Swedish speakers, the qualitative pattern of self-selection with respect to earnings deciles is similar: Emigration rates are broadly U-shaped in earnings deciles for both Finnish speakers and Swedish speakers, although the pattern among Swedish speakers is less smooth, reflecting their smaller number. This result suggests that shared language increases the attractiveness of migration similarly across the skill distribution, at least in our setting. In terms of the Borjas (1987) model, this result could arise if shared language reduces time-equivalent migration costs, benefiting potential migrants similarly across the skill distribution. An alternative mechanism would be a proportional increase in earnings across the skill distribution, thanks to the productivity boost from shared language. In the framework by Grogger and Hanson (2011), our findings are consistent with shared language reducing fixed cost of migration similarly for everyone.
Finally, we analyzed self-selection and sorting of those who emigrate for one to five years. In terms of the distribution of standardized earnings, differences between short-term migrants to other Nordic countries and non-Nordic destinations are also quite small for men (Figure A4). The self-selection pattern with respect to earnings deciles is again U-shaped, but the rate with respect to highest decile is considerably higher than with respect to the lowest decile (Figures A5.1 and A5.2). This differs from the finding by Borjas and Bratsberg (1996) that selective return migration would accentuate self-selection patterns.
Self-Selection in Unobserved Characteristics
In the previous section we showed how migrants are self-selected in terms of education and pre-migration earnings after adjusting for age and year effects, and how these patterns differ between married and unmarried individuals and between Finnish speakers and Swedish speakers. In this section, we examine self-selection in terms of the component of earnings that is associated with characteristics that are not observed. We adjust for differences in educational attainment and other observable variables between migrants and non-migrants by running Mincerian earnings regressions and study self-selection in terms of earnings regression residuals. 8 The residuals reflect the part of earnings that is uncorrelated with the observed measures of skill. The decomposition depends on the characteristics that are observed and can be included as regressors in the earnings regression model. As the set of characteristics depends on the data set at hand, the selection is somewhat arbitrary, and the results depend on the choice of control variables.
Previous literature on emigrant self-selection in terms of residual earnings has reached contrasting results. Fernández-Huertas Moraga (2011) and Kaestner and Malamud (2014) found negative self-selection of Mexican migrants to the United States in terms of residual earnings and Borjas et al. (2019) found positive self-selection of Danish emigrants, which are in line with predictions from Borjas (1987). Gould and Moav (2016), by contrast, found an inverse U-shape pattern among Israeli men.
We begin our analysis with a specification that follows Borjas et al. (2019) as closely as possible, after which we extend the analysis to include occupational categories. Borjas et al. (2019) argued that selection in terms of unobserved characteristics indicates how important the quality of job match is relative to the skill component that is internationally transferable. A pure random matching model would suggest that correlation of residuals related to match quality between potential jobs in the origin and destination would be zero. This assumption would lead to negative selection in the residual earnings as only workers with a bad job match (corresponding to a negative residual) would find it optimal to emigrate. An alternative perspective is that the residual earnings primarily reflect the unobserved skills, which are easily transferable across countries. If this is the case and the returns to unobserved skills are higher in the destination country, emigrants would be positively self-selected in terms of unobservable characteristics (measured by residuals). Therefore, whether migrants from a country with smaller income differences are positively or negatively self-selected in terms of residuals would shed light on whether the residual earnings primarily reflect unobserved job match quality or unobserved abilities. If returns to unobserved skills are lower in the destination country, then migrants would be negatively self-selected even if the unobserved skills are highly transferable. In that case, negative self-selection in residual earnings from a country with higher returns to skills to a destination country with lower returns is insufficient to conclude that this is because of unobserved job match quality.
Table A12.1 reports the Mincerian wage regressions used to calculate the residuals. The sample includes the whole population of prime-aged full-time workers pooled over the years between 1997 and 2014. The estimation equations include age and year fixed effects, dummies for educational attainment, and dummies for being married and having children. Standard errors are clustered at the individual level and the model is estimated separately for men and women.
Figure A6 presents the cumulative distributions and Figure A7 the Kernel densities of earnings regression residuals by gender for those who stay in Finland the following year, migrants to other Nordic countries, and migrants to non-Nordic countries. The values are truncated at −2 and 2, a range that covers most of the population. Emigrants from Finland are not as strongly positively self-selected with respect to residuals as the emigrants from Denmark that Borjas et al. (2019) analyzed. Instead, cumulative distribution functions cross each other, so that migrants are more likely to have either absolute large negative or absolute large positive residual earnings compared to non-migrants. Men migrating outside Nordic countries are also more strongly positively self-selected in terms of residual earnings than are men migrating to other Nordic countries, while women migrating outside Nordic countries are more likely to have negative values of residual earnings compared to women migrating to other Nordic countries.
Figure 7, panel A, aggregates self-selection patterns into emigration rates by deciles of residual earnings for men, and panel B does so for women. We find a strong U-shaped pattern, with highest emigration rates in the lowest and highest decile of residual earnings. This result suggests that bad job matches may be an important motivation to emigrate with low residual earnings, whereas higher returns to unobserved abilities abroad are likely to play an important role with high residual earnings.
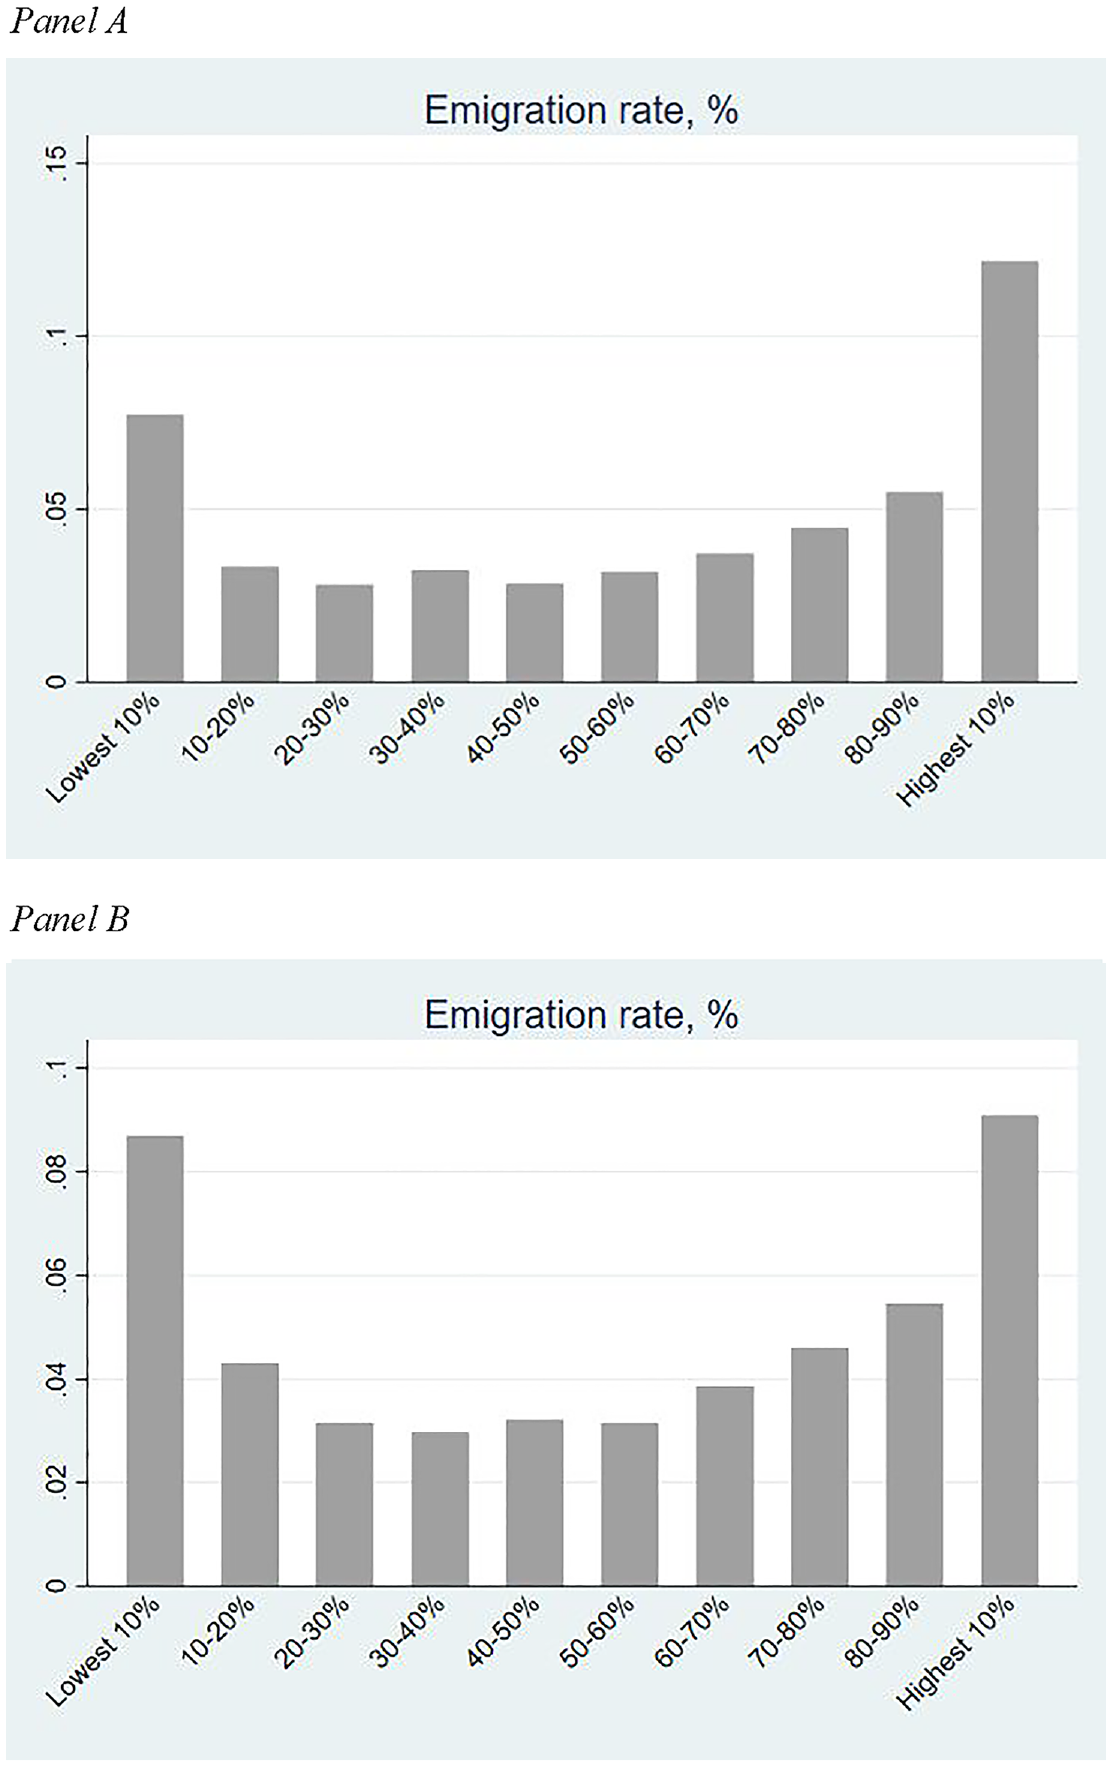
Emigration Rates by Decile of Earnings Regression Residuals, for Men and for Women
Turning to the role of family considerations, Figures A8.1 and A8.2 show that emigration rates by deciles of residual income exhibit a U-shape for both unmarried and married men and women. Among men, emigration rates are slightly higher (lower) among married than unmarried men in the highest (lowest) decile of residual earnings. Emigration rates of unmarried women are higher than those of married women in every decile of residual earnings.
We next extend our analysis to control for occupational classification. We restrict the analysis to emigration from years 2011 to 2015 to analyze self-selection based on characteristics for the years 2010 to 2014. This restriction is needed as there had been changes in occupational classification between 2009 and 2010. Table A12.2 presents wage regressions for men, first without educational and occupational controls, then with educational controls, and 1-digit and 2-digit occupational controls that are used in the calculation of these residuals. Table A12.3 presents corresponding regressions for women. Figure A9 presents the cumulative distributions of wage residuals for male and female migrants moving to other Nordic countries, non-Nordic countries, and for those who stayed in Finland the following year when controlling for occupation at the 1-digit level. Qualitative results are similar to those shown in Figure A6, though sorting across Nordic and non-Nordic destinations is weaker for men once we control for occupation. These patterns remain the same after controlling for occupations at the 2-digit level (Figure A10). The U-shaped self-selection pattern in terms of deciles of residual earnings also prevails after controlling for occupations (Figures A11.1–A12.2).
Borjas et al. (2019) also estimated which fraction of emigrant self-selection from Denmark in terms of standardized earnings can be explained by observed characteristics, and which fraction by unobserved characteristics. To do so, they followed Chiquiar and Hanson (2005) and calculated the predicted counterfactual wage distribution of emigrants. The counterfactual earnings distribution for migrants is estimated by weighting the data for non-migrants so that the distribution of observable characteristics mimics that for the migrants. The weights are based on logit models explaining migration decisions with observed individual characteristics. 9 They then compared the estimated distribution to the actual pre-migration earnings distributions for migrants and non-migrants. The difference between the density for non-migrants and the counterfactual density reflects the part of self-selection that is attributable to observed characteristics whereas the difference between the counterfactual and actual densities for migrants reflects the part of selection attributable to individual characteristics that are not included in the logit model. In addition to presenting Kernel densities, Borjas et al. (2019) quantified the differences by comparing the averages of the actual and counterfactual distributions. Deducting the average standardized earnings of non-migrants from the average standardized counterfactual earnings of migrants and dividing the difference by the actual difference in standardized earnings between migrants and non-migrants tells us what fraction of migrant self-selection, in terms of standardized earnings, observable characteristics can explain. It turned out that observed characteristics could explain only 30% of the self-selection of male emigrants, and about half of the self-selection of female migrants. We follow the same process for self-selection of Finnish emigrants, but we calculate the share of self-selection explained by observable characteristics in steps and also add occupational controls.
Figure 8 presents log standardized earnings of migrants and non-migrants, as well as four predicted counterfactual wage distributions of migrants, each of which is based on a different logit model explaining migration decisions: model 1 controls only for age, marital status, and having children; model 2 controls also for education; and models 3 and 4 add indicators for occupational group at the 1-digit and 2-digit level, respectively. In addition, all models include a vector of year fixed effects. The regression results are reported in Tables A7 to A10 for regression coefficients from logit regressions and odds ratios, separately by gender.
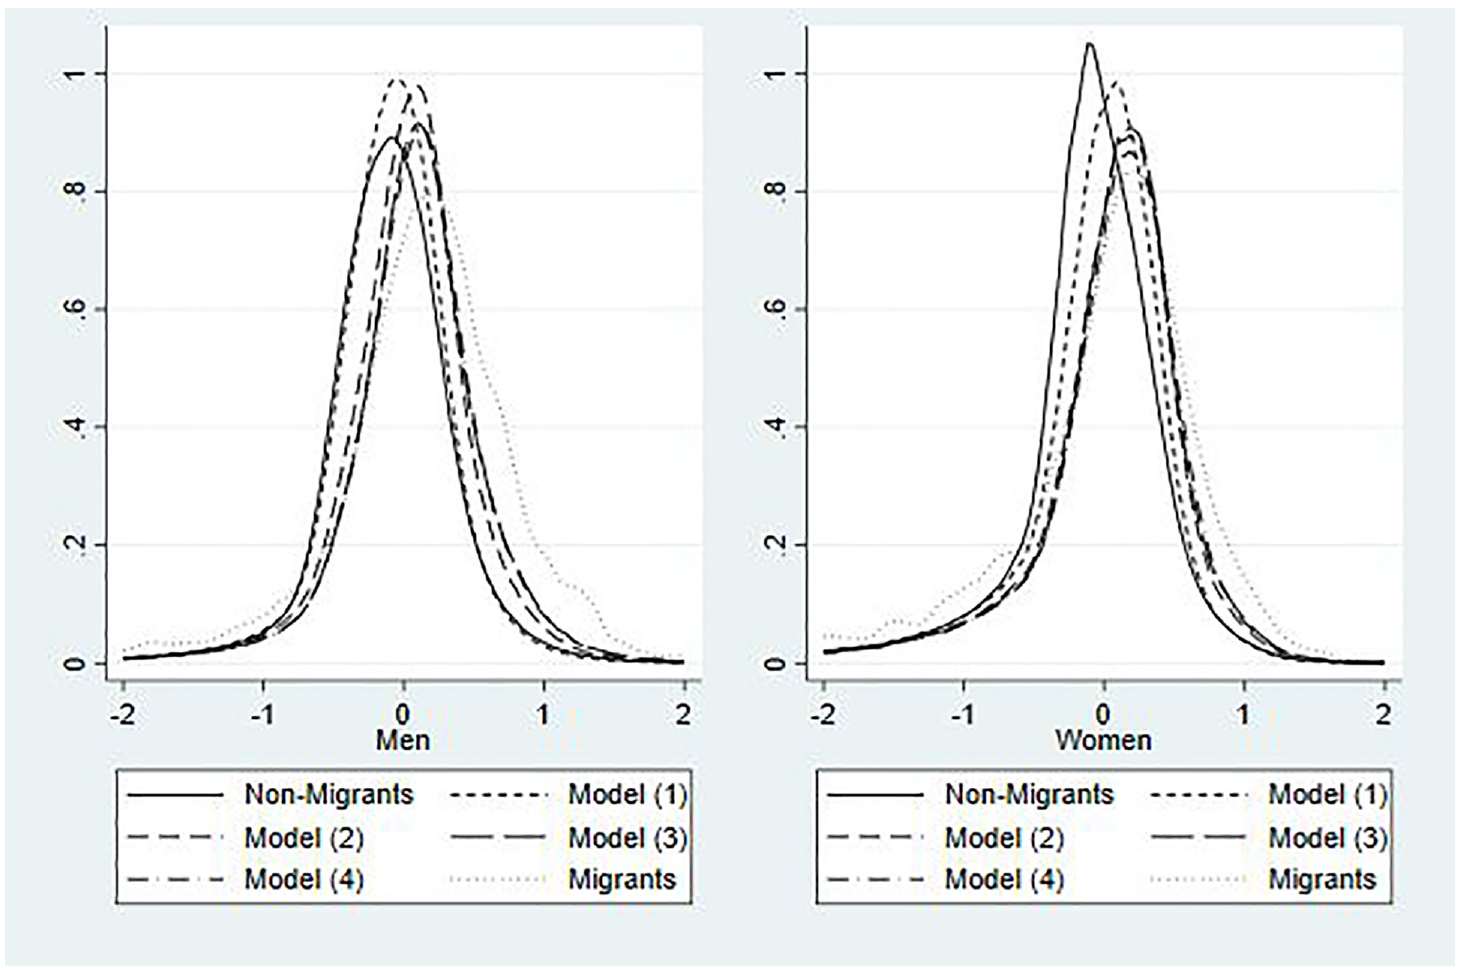
Counterfactual and Actual Densities of Log Standardized Earnings
Table 5 presents actual and counterfactual differences between the average log standardized earnings of migrants and non-migrants, and shows what fraction of migrant self-selection various observable characteristics included in models 1 to 4 can explain, separately for men and women.
Actual and Counterfactual Differences between the Average Log Standardized Earnings of Long-Term Migrants and Non-Migrants
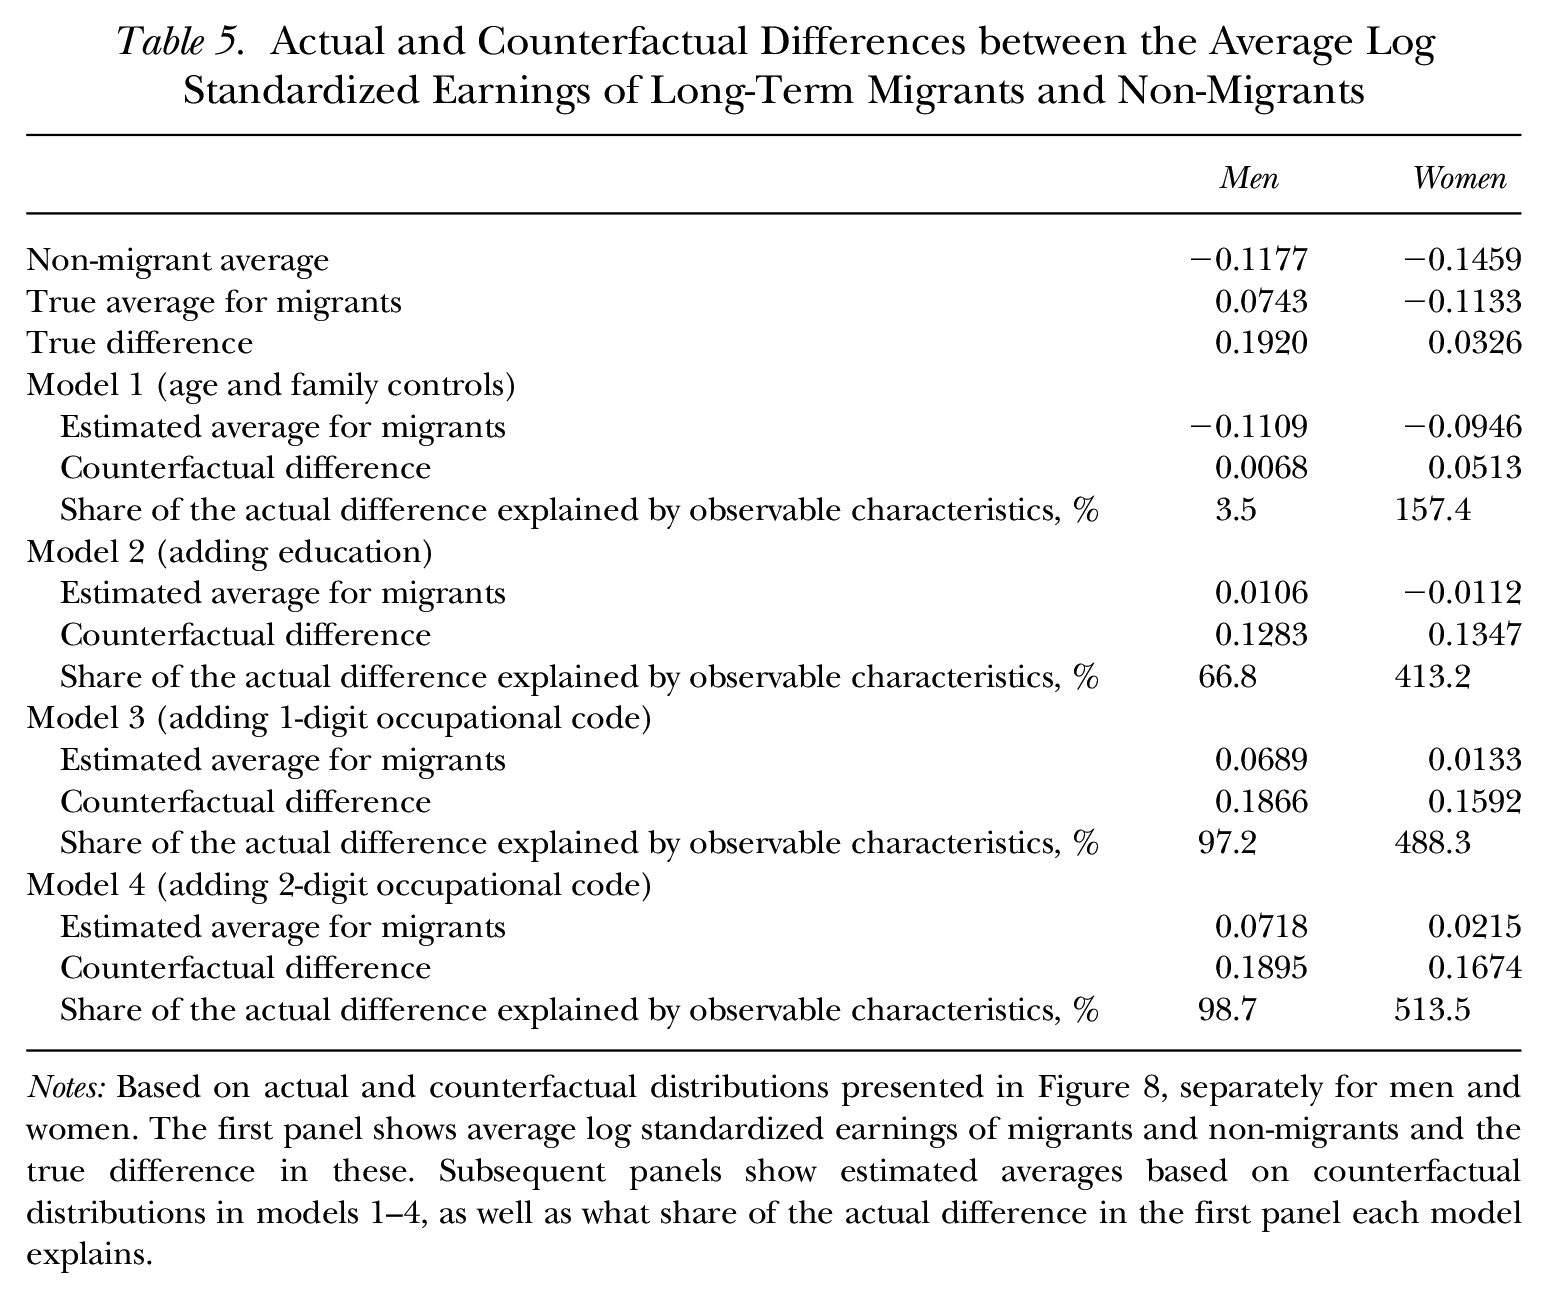
Notes: Based on actual and counterfactual distributions presented in Figure 8, separately for men and women. The first panel shows average log standardized earnings of migrants and non-migrants and the true difference in these. Subsequent panels show estimated averages based on counterfactual distributions in models 1–4, as well as what share of the actual difference in the first panel each model explains.
We find major gender difference in the share of actual difference in log standardized earnings explained by observable characteristics. The model that includes only age and family controls explains less than 4% of average earnings difference between migrants and non-migrants for men. For women, controlling for age and family explains 157% of the actual difference, suggesting that female emigrants earned less than expected based on their age and family situation only. Adding controls for education helps to explain 67% of actual difference in earnings for men, and more than 400% for women. Adding controls for occupation at the 1-digit level boosts the share of explained difference between migrants and non-migrants for men to 97% and controls at the 2-digit level to 99%. Therefore, adding occupational controls helps to explain almost all of the self-selection that remained unexplained in Borjas et al. (2019). For women, the share of variation explained with occupational controls is approximately five times the actual difference. This outcome could reflect women with a low-paying job match either searching for a better job match abroad or being more likely to emigrate for family reasons. To further investigate whether the findings for women could be explained by family-related migration, we ran corresponding analyses including only unmarried women who have no children. For them, all other models except the one without occupational or educational controls overestimated the difference between migrants’ and stayers’ earnings, but less so than for women in general. The model without education explained 84% of the difference, whereas shares explained by the model with education and models with 1-digit and 2-digit occupational controls were 191%, 223%, and 238%, respectively.
The self-selection pattern with respect to residual earnings is U-shaped for both married and unmarried men and women, with differences in emigration rates being considerably higher for unmarried women. While the emigration rate of unmarried men and women is quite similar in the highest decile of residual earnings, the emigration rate of married men is more than twice the emigration rate of married women in the top decile. These patterns are in line with couple migration being more responsive to the male partner’s job opportunities, with single men and women responding more similarly.
As for language, self-selection patterns of both Finnish speakers and Swedish speakers are broadly U-shaped in terms of residual earnings (Figure A13.). The emigration rates of Swedish speakers to other Nordic countries are higher than those of Finnish speakers in all residual earnings deciles. Emigration rates do not differ much by mother tongue when it comes to emigration outside Nordic countries, although emigration rates of Swedish speakers are higher especially in the highest residual earnings decile. This situation could arise because of smaller linguistic distance between Swedish and English and German (as well as to other Indo-European languages) giving Swedish speakers an advantage especially in communication-intensive jobs at the top of the earnings distribution, such as managers.
Finally, we also analyzed self-selection with respect to residual earnings for stays abroad lasting one to five years (Figures A14.1 and A14.2). Emigration rates again follow a U-shaped pattern, with those in the top decile being considerably more likely to emigrate than those in the lowest decile for men, and somewhat more likely for women.
Conclusion
In this article, we analyzed migrant self-selection and sorting in terms of education, occupation, earnings, and residual earnings, as well as how self-selection and sorting differ between married and single individuals and between Finnish speakers and Swedish speakers and between longer stays (five or more years) and shorter stays (one to five years). We included an analysis of self-selection in terms of occupations, using in some specifications 1-digit or 2-digit occupational classifications, in addition to education and demographic controls. We analyzed only Finns without an immigrant background, because for those with an immigrant background, emigration from Finland might correspond to returning to their home country, or the country from which their parents came.
We find that emigrants from Finland are strongly positively self-selected in terms of education and earnings, and more likely to be employed as managers or professionals before emigrating. These patterns hold for both men and women and for both long and short stays. Generally, positive self-selection is stronger among men, especially when analyzing married individuals. Furthermore, we find evidence of a clear sorting pattern with respect to education in line with what Grogger and Hanson (2011) predicted. More-educated migrants tend to choose destinations offering higher returns to skills, which corresponds to non-Nordic countries, while less-educated migrants are more likely to migrate to other Nordic countries, which are culturally and geographically closer and have relatively small income differences in international comparison, just as Finland does. We also found that male migrants to non-Nordic countries are more strongly positively self-selected with respect to their earnings and residual earnings, after controlling for age and education. For female migrants, the difference between Nordic and non-Nordic destinations is considerably weaker. We also report a remarkable difference between destinations of Finns belonging to the Finnish-speaking majority and the Swedish-speaking minority. The latter have a considerably higher emigration rate to other Nordic countries. This finding testifies about the importance of language, as the main destination for them is Sweden. Notably, self-selection patterns with respect to standardized earnings and residual earnings, to other Nordic countries and to the rest of the world, exhibit a U-shape for both a Finnish-speaking majority and a Swedish-speaking minority. Therefore, shared language boosts emigration across skill distribution.
To shed more light on the gender differences in self-selection and sorting, we separately analyzed self-selection of unmarried and married individuals. Self-selection patterns of married and unmarried men are qualitatively similar, though considerably more married women with low standardized earnings emigrate. This finding could reflect women migrating more often because of partner or other family considerations, as documented by Munk et al. (2022) for emigration from Denmark. Married and unmarried men and women exhibit a U-shaped pattern with respect to deciles of standardized earnings and residual earnings, with the emigration rates of men being higher in the top decile, and the difference between married and unmarried individuals being stronger for women.
In addition to analyzing how self-selection with respect to earnings and residual earnings differs between married and unmarried individuals by gender and between Finnish speakers and Swedish speakers, our main contribution to the previous literature is analyzing self-selection with respect to occupation, and to what extent self-selection with respect to earnings can be explained by education, occupation, and marital status. While age and family controls explain only 4% of men’s self-selection with respect to earnings, female migrants earned less than expected based on their age and family situation. This reverses the pattern without family controls when women are positively self-selected. Controlling for education increases the share of variation explained to 67% among men and to more than 400% among women.
Supplemental Material
sj-pdf-1-ilr-10.1177_00197939241300066 – Supplemental material for Decomposing Migrant Self-Selection: Education, Occupation, and Unobserved Abilities
Supplemental material, sj-pdf-1-ilr-10.1177_00197939241300066 for Decomposing Migrant Self-Selection: Education, Occupation, and Unobserved Abilities by Ilpo Kauppinen and Panu Poutvaara in ILR Review
Footnotes
Acknowledgements
We are grateful to the participants at the IZA Annual Migration Meeting 2022 for valuable comments and to Padmaja Kadambi for excellent research assistance.
This article is part of a set of papers from a Festschrift honoring George Borjas.
For general questions as well as for information regarding the data and/or computer programs, please contact the corresponding author, Panu Poutvaara, at
1
According to Finnish law, everyone who lives in Finland must notify the authorities if they move permanently into a new home or if their temporary stay at another address is longer than three months. People are obliged to inform the authorities if they move abroad or move to Finland from abroad. In each case, the notification has to be submitted within a week of the move. It is technically but not legally possible to migrate without registering, but we expect the share of people migrating without registration to be small, as those who do not register emigration are obliged to pay taxes additionally on their income earned abroad. Consequently, especially those earning high income have a strong incentive to register their emigration. Return migration should also be registered, as one needs to be registered in Finland to be covered by the Finnish social insurance and public health care. Also, information on residence is needed when receiving earned income or capital income in Finland.
2
Statistics Finland defines a person to have a “Finnish background” if at least one of the parents was born in Finland. In practice, those who are of Finnish background and are born in the country also hold a citizenship.
3
Both migrants and stayers, as well as shorter-term migrants, are included in these calculations.
4
The Roy-Borjas model has also been tested under historical contexts. Abramitzky, Boustan, and Eriksson (2012) found that emigrants from urban areas in Norway to the United States during the age of mass migration (1850–1913) were negatively self-selected, in line with the Borjas (1987) prediction. Wegge (2002) concluded that emigrants from 19th-century Hesse-Cassel were positively self-selected in terms of skills, but negatively self-selected in terms of financial wealth. ![]() analyzed how migrants from Italy to the United States between 1907 and 1925 were self-selected in terms of their height. They found evidence of negative self-selection at the national level, but positive self-selection at the local level.
analyzed how migrants from Italy to the United States between 1907 and 1925 were self-selected in terms of their height. They found evidence of negative self-selection at the national level, but positive self-selection at the local level.
5
The shares of observations below the lower and above the upper truncation points are small. As the Finnish data do not have a reliable way to measure working full time, the data include individuals with very low incomes. This makes the left tail of the earnings distributions long. The share of the population that falls under the value −2 is 1.06% of observations. Values above the value 2 represent only about 0.05% of the observations.
6
Following Leibbrandt, Levinsohn, and McCrary (2005), Fernández-Huertas Moraga (2011), and ![]() , we use Silverman’s reference bandwidth multiplied by 0.75 to prevent over-smoothing. The same bandwidth is also used in all reported density estimates.
, we use Silverman’s reference bandwidth multiplied by 0.75 to prevent over-smoothing. The same bandwidth is also used in all reported density estimates.
7
Being a tied mover can be associated with significant income losses. Burke and Miller (2018) found that military relocations in the United States coincide with 14% lower spousal earnings in the year of the move, and 4–5 percentage points higher probability of having no earnings in the year of the move. Moving abroad could be even costlier in terms of a tied mover’s job opportunities. ![]() surveyed couples that emigrated from Denmark and found that female labor force participation in dual-earner couples dropped to 54% immediately after migration. In addition, 61% of female partners in dual-earner couples emigrated mainly for reasons related to their partner or family, but only 8% of male respondents did the same.
surveyed couples that emigrated from Denmark and found that female labor force participation in dual-earner couples dropped to 54% immediately after migration. In addition, 61% of female partners in dual-earner couples emigrated mainly for reasons related to their partner or family, but only 8% of male respondents did the same.
8
In the earnings regressions, we use non-standardized annual earnings as the dependent variable. We include age and year fixed effects and run the regressions separately for men and women.
References
Supplementary Material
Please find the following supplemental material available below.
For Open Access articles published under a Creative Commons License, all supplemental material carries the same license as the article it is associated with.
For non-Open Access articles published, all supplemental material carries a non-exclusive license, and permission requests for re-use of supplemental material or any part of supplemental material shall be sent directly to the copyright owner as specified in the copyright notice associated with the article.