
Abstract
Most minimum wage studies are identified on small, plentiful, mostly expected wage changes, spread out over time. A recent set of changes have instead been large, rapid, and unexpected, following the “Fight for $15” movement. Alberta is the first North American province, state, or territory to have this $15 minimum wage, with an unexpectedly large increase (47%) occurring over a short time horizon (3 years). The employment effects of this policy are estimated using a synthetic control approach on Labour Force Survey data. Similar to the existing literature, workers moved up the wage distribution, increment by increment, but with a higher distributional reach. Employment losses occurred at similar elasticities, but with large level changes, mostly among younger workers. Newer to the literature, regional employment losses were found in four of the five non-urban economic regions, but not in Alberta’s two main cities, showing the significance and nuance of regional heterogeneity.
Most empirical studies that populate the vast minimum wage literature are identified on a large number of small changes to the minimum wage. 1 The reason for this is that most minimum wage policy changes have been relatively small in magnitude, resulting from either being frequently increased nominally by stepwise legislation, or by having a formula in place, with minimum wage increases automatically tied to inflation through changes in prices and/or earnings. As such, these small changes have also mostly been anticipated over a set period of time, often occurring annually.
By contrast, a recent set of minimum wage changes were instead large in magnitude, with most being motivated by the concept of a nominal $15 minimum wage, despite historical levels well below that mark and significant heterogeneity existing across jurisdictions. The onus for these new types of minimum wage changes originated at the city level in 2012, as the “Fight for $15” movement among fast food workers in New York City. Although it would take those NYC workers an additional six to seven years to reach their goal, this idea quickly spread to other US cities, such as San Francisco and Seattle. 2
Over time, these relatively large minimum wage changes have also become more plentiful and more expansive in their geographic reach. In our case of interest, Alberta became the first province, state, or territory in North America to reach a $15 minimum wage on October 1, 2018. 3 This path was set in place in 2015, when Alberta’s general minimum wage began its 47% increase from $10.20, through four annual increments of $1.00 in 2015, $1.00 in 2016, $1.40 in 2017, and $1.40 in 2018, all happening on October 1st of their respective years. Prior to Alberta’s policy, minimum wages of such a nominal level were relegated to only two US cities.
Many provinces, states, and territories have since followed Alberta in setting a $15 minimum wage or higher, including Nunavut in 2020; British Columbia and the Northwest Territories in 2021; California, Ontario, and Yukon in 2022; and Connecticut, Manitoba, Massachusetts, Newfoundland and Labrador, Nova Scotia, Prince Edward Island, Quebec, and Washington in 2023. Several $15 minimum wage or higher policies are still to come: Maryland, New Jersey, New York, and Saskatchewan in 2024; Delaware, Illinois, and Rhode Island in 2025; and Florida, Hawaii, and Virginia in 2026.
And this geographic reach is ever increasing, beyond provinces, states, and territories, to the national level. The United States first proposed to raise its federal rate by more than double, from $7.25 to $15.00 by mid-2025, possibly affecting the pay of more than 27 million workers, as part of its Raise the Wage Act of 2021 released on January 26, 2021 (Congressional Budget Office 2021). However, Canada was the first to actually raise its minimum wage to the $15 level for more than 26,000 federal workers on December 29, 2021, as part of its Budget 2021 (Department of Finance Canada 2021). The United States then closely followed Canada’s policy by enacting a $15 minimum wage for only its federal contractors on March 30, 2022.
These new types of policies, with their relatively large minimum wage increases over an ever-expanding geographic reach, prompt two main research questions. First, do these new types of large minimum wage changes produce results that are similar to or different from the existing literature, such as with respect to the affected groups, their employment elasticities and level changes, and the distributional reach? Second, how are these results similar or different in terms of the expanding geographical reach of the policies, with one common minimum wage level being applied to a host of heterogeneous regions?
In this article, we evaluate the impacts of Alberta’s $15 minimum wage policy on employment by applying a synthetic control approach on aggregate Labour Force Survey data cut by wages, ages, and places. Comparatively speaking, the only other studies on similar large minimum wage changes are for Seattle and several other US cities (Reich, Allegretto, and Godoey 2017; Nadler, Allegretto, Godoey, and Reich 2019; and Jardim et al. 2022, which also used synthetic control techniques). These three studies are the closest comparisons to our own, although ours is currently the only study for a state, province, or territory.
The only other studies of large minimum wage changes, which are also quite recent but not within North America, include Kreiner, Reck, and Skov (2020) with a similar magnitude of a 40% change for youth in Denmark, and Gregory and Zierahn (2022) for construction workers in Germany. Therefore, the Alberta case in the current study will serve as the first large minimum wage change for North America, beyond the city level, given that its policy was in place years before the next set of similarly large minimum wage changes at the provincial, state, territorial, and national levels. The Alberta case may also stand out as unique by having occurred during a period of lower inflation, whereas the next set of large changes began during a period of higher inflation.
Policies, Data, and Methods
Provincial Minimum Wage Policies
Following 44 consecutive years (1971–2015) of conservative party rule (under the Progressive Conservative Association), the New Democratic Party (NDP) formed Alberta’s only one-term government (2015–2019). Prior to the NDP, Alberta had followed a formula-based minimum wage. As of September 1, 2011, the minimum wage formula was based equally on changes to annual average weekly earnings (AWE) and changes to the consumer price index (CPI). The NDP government scrapped this formulaic approach in 2015, as part of their election platform (Alberta NDP 2015), with the goal of moving the $10.20 minimum wage to a $15 level by 2018. When Alberta returned to conservative rule in 2019 (under the United Conservative Party), the minimum wage was kept at the $15 level, where it remains in 2023.
According to Neumark et al. (2014: 610, emphasis added), “the identification of minimum wage effects requires both a sufficiently sharp focus on potentially affected workers and the construction of a valid counterfactual control group for what would have happened absent increases in the minimum wage.” For the “valid counterfactual control group,” a similar or “twin” province of Alberta exists with Saskatchewan, its neighbor on its eastern side, which had the same formula-based minimum wage as Alberta but kept it through 2019. As discussed in Nadler et al. (2019), the ideal untreated comparison units should follow the same minimum wage policy as Alberta would have followed in the absence of its $15 policy.
The provinces of Alberta and Saskatchewan have many similarities. Despite Saskatchewan having a little over a quarter of the population of Alberta, they are two of the youngest provinces in Canada, with median ages of 38.1 (AB) and 37.9 (SK) in 2021, compared to a national median age of 41.1. Saskatchewan’s economy is equally reliant on agriculture and the energy extraction industry, being the second largest producer of both cattle and oil, behind only Alberta. Most important, Saskatchewan introduced its formulaic minimum wage approach in 2010, with its first increase in 2011. As of 2014, its minimum wage formula was based equally on changes to AWE and CPI for the previous year, with all changes occurring on October 1st, the same as Alberta. For these reasons, Saskatchewan will be used as the main comparison in the analysis.
Two other provinces can be used for comparison, British Columbia and Ontario, based on choosing to replace their formulaic wage increases with their own $15 minimum wage policies, albeit at a much later date. British Columbia, Alberta’s other neighboring province on its western side with a similar population size, had a minimum wage indexed to inflation from at least 2015, but they also scrapped their formula later in 2018 to set up their own path to $15 (in fact $15.20) on June 1, 2021. Like Saskatchewan, British Columbia will also be used in our analysis, but unlike Saskatchewan, this neighboring province will be used only in the robustness checks.
Ontario is also a province of interest, as its minimum wage was indexed to inflation in 2014, but retroactively done to 2010. As a result, there was one large increase in 2014, and then smaller annual changes, until the formula was scrapped in 2018. Ontario was also on a $15 minimum wage path, with the largest one-time nominal increase of $2.60, from $11.40 to $14.00, on January 1, 2018, but it was paused there. It then increased to $14.25 and to $14.35 on October 1st of 2020 and 2021, respectively, and then to $15.50 in October 2022. That said, Ontario has a much larger population than Alberta and a dissimilar economy. Therefore, Ontario is not used in any part of our analysis, nor are any of the other remaining provinces east of Alberta, given differences in population sizes, industrial composition, and unemployment rates.
Figure 1 shows the minimum wage trends for this select set of Canadian provinces from 2008 to 2020. The minimum wage in Alberta (AB) increased from $10.20 to $11.20 in 2015 Q4, to $12.20 in 2016 Q4, to $13.60 in 2017 Q4, and to $15.00 in 2018 Q4 (all happening on October 1st of their respective years), while Saskatchewan (SK) continued to display an automatically increasing minimum wage according to its formula, similar to what Alberta had prior to its $15 policy. The two other notable provinces appear between these extremes, as both British Columbia (BC) and Ontario (ON) show sporadic periods of large minimum wage increases, especially toward the end of the period.
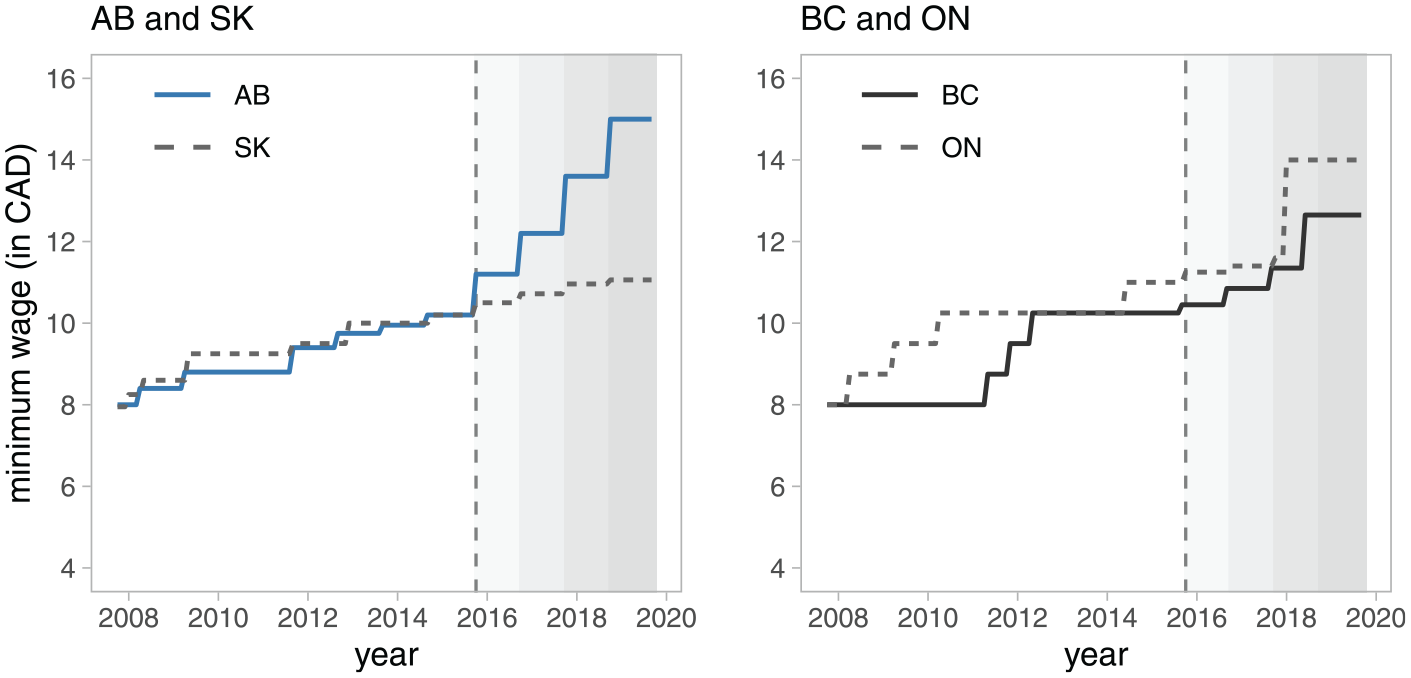
Minimum Wages over Time in Select Provinces: Alberta (AB), Saskatchewan (SK), British Columbia (BC), and Ontario (ON)
Labour Force Survey Data
For the “sufficiently sharp focus on potentially affected workers” (again from Neumark et al. 2014: 610), the order of our data “cuts” follows our article’s subtitle: “by wages, ages, and places.” As such, we obtained monthly employment data by age, region, and wage level from the Labour Force Survey (LFS) of Statistics Canada. The aggregate LFS data by age and region are publicly available from Statistics Canada, using Table 14-10-0287-01 (formerly CANSIM 282-0087) for age, which is seasonally adjusted, and Table 14-10-0293-01 (formerly CANSIM 282-0122) for region, with a three-month moving average. The wage bin cuts of the LFS data came through a request to Statistics Canada from the Government of Alberta, for the production of a report of the Minimum Wage Expert Panel, which began in August 2019, concluded in February 2020, and was publicly released in March 2023 (Marchand et al. 2023). 4
Our wage and age data cuts are used to tie our findings to the broader minimum wage literature. For wages, we divide employment into wage bins based on the stepwise set of minimum wage increases over the duration of Alberta’s policy: those earning less than $10.20, between $10.20 and $11.20, $11.20 to $12.20, $12.20 to $13.60, $13.60 to $15.00, $15.00 to $20.00, and above $20.00. These wage bins are used both as a source of variation and as an outcome of interest. Our wage bin approach is similar to Jales (2018) and Cengiz, Dube, Lindner, and Zipperer (2019). We would expect, a priori, that workers will move up the wage bins as the minimum wage is incrementally increased, but workers in the wage bins above $15 are expected to be largely unaffected.
For ages, we isolate our youngest possible age group, aged 15 to 24, which contains teenagers (15–19), who are most likely to be affected by such a policy, and young adults (20–24), who are second most likely to be affected. These groups are compared to those aged 25 and older. Cengiz, Dube, Lindner, and Zentler-Munro (2022) found “age” to be the strongest predictor of being an affected worker of a minimum wage policy. A priori, we would expect younger workers to show some negative employment effects after the minimum wage increases, but older workers instead act as a placebo, with no expected employment effect.
Our places cut of the data, namely by economic regions, serves as our greater contribution to the literature. For places, we divide Alberta (and its neighboring provinces of Saskatchewan and British Columbia) into economic regions, of which there are seven in Alberta, with two urban and five non-urban areas to consider. Cengiz et al. (2022) found “rural” (i.e., non-urban) to be the fifth most important predictor of being an affected worker of a minimum wage policy. Mostly lower priced, non-urban areas are expected to show some negative employment effects after the minimum wage increases. Given their higher price and wage levels, however, urban areas are seen as placebos, a priori.
Again, the purpose of our data cuts is to tie our findings to the broader minimum wage literature and then to add our unique contribution to it. That said, other possible data cuts are equally worthy of exploration, such as immigrant status, industry, or occupation. While our cuts of age and place follow the first and fifth best predictors of being affected by minimum wages from Cengiz et al. (2022), education, gender, and marital status are the second, third, and fourth best predictors, with Hispanic, race, and veteran status as the sixth, seventh, and eighth best predictors, respectively.
Synthetic Control Methods
A synthetic control approach is used for our identification strategy to form the counterfactual of what would have happened in Alberta without this policy, given the fact that only Alberta with the policy is actually observed. The reasons for this approach are laid out by Abadie, Diamond, and Hainmueller (2010) and Abadie (2021), who state the improvements over the other techniques applied in the literature. To our knowledge, at least nine other applications of synthetic controls are on minimum wage policies, namely Sabia, Burkhauser, and Hansen (2012), Neumark et al. (2014), Dube and Zipperer (2015), Allegretto et al. (2017), Neumark and Wascher (2017), Reich et al. (2017), Nadler et al. (2019), Jardim et al. (2022), and Powell (2022).
Separate synthetic controls are constructed for employment across different wage bins, age groups, and economic regions in Alberta. Our goal is to assess the impact of the minimum wage increases on employment for each of these groups using aggregate data. For each treated Alberta unit, we construct a separate synthetic control based on the following model. Consider
In this article, we adopt the Bayesian Structural Time Series (BSTS) approach of Varian (2014) and Brodersen et al. (2015) and define the synthetic control model as:
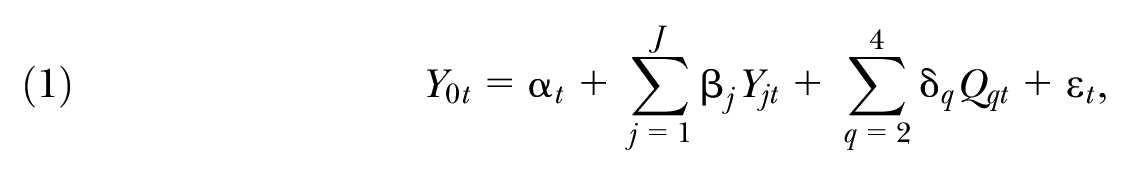

where
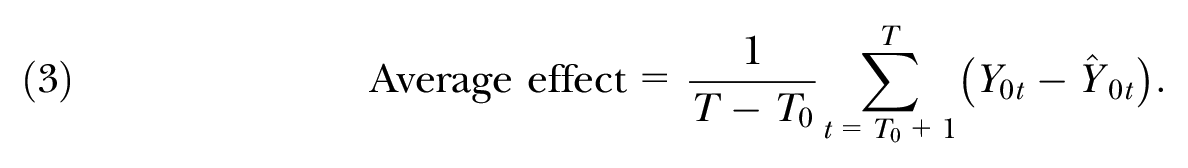
To construct the synthetic controls, we need to identify relevant untreated control units (the donor pool) and decide how to determine the regression coefficients (
In particular, we need to identify labor markets unexposed to large minimum wage increases, but that were exposed to Alberta’s general labor market trends, such as its labor demand being tied to energy prices (see, e.g., Marchand 2012, 2015, 2020). 5 In this article, we primarily use Saskatchewan as the control province, based on its contiguity and economic fundamentals (similar to Card and Krueger 1994), and in combination with the BSTS model, to select the subsets of workers in the donor pool that provide the best match for each treated Alberta unit. Finally, by using the BSTS approach of Brodersen et al. (2015), we are choosing to match pre-intervention outcomes, rather than a summary of covariates, such as sector composition (due to oil price shocks) and demographics (due to the minimum wage).
For our main results, the set of untreated units (
To prevent over-fitting, we rely on regularized priors on the regression coefficients (see Brodersen et al. 2015). All our models are estimated using quarterly averages for the pre-intervention sample, from the fourth quarter (Q4) of 2007 to the third quarter (Q3) of 2015 (i.e., eight years). The policy is evaluated in the post-intervention sample, from the fourth quarter (Q4) of 2015 to the third quarter (Q3) of 2019 (i.e., four years). For each synthetic control, we report the variable importance plots, which show how important each untreated unit is in the model. In each case, the Gibbs sampler is run 1,000 times.
Employment Effects of a $15 Minimum Wage
By Wages: Workers Moved Up Bins
Our first cut of the Labour Force Survey data by wages is our first attempt to answer our first main research question: Do these new types of policies, with large minimum wage increases, offer results that are similar to or different from the existing literature? Previous studies have focused on employment movements in and out of wage bins near, but typically exactly at or above, the targeted minimum wage of the policy, such as Jales (2018) for Brazil and Cengiz et al. (2019) for the United States. In our wage cut, we want to know if workers moved up the wage bins for each incremental minimum wage increase and how far the reach of the $15 policy was on the lower end of the wage distribution.
For our study, we first show the movement in employment between wage bins through each annual increment involved in Alberta’s $15 minimum wage policy. As the minimum wage increases each year, workers in the applicable wage bin should have departed the previously existing lower wage bin and entered the higher wage bin immediately above it, having received an hourly wage raise. Once again, the series of wage bins that correspond with the 2015 to 2018 increases in the minimum wage in Alberta are from $10.20 to $11.20 on October 1, 2015; from $11.20 to $12.20 on October 1, 2016; from $12.20 to $13.60 on October 1, 2017; and from $13.60 to $15.00 on October 1, 2018.
We show this effect in the simplest way in Figure 2, by looking at employment in two aggregate wage bins: the $11.20 and below bin, shown in the top panel, and a mixture of the $11.20 to $13.60 bins, shown in the bottom panel. Employment in the $11.20 and below bin should decrease as soon as that $11.20 increment is hit. However, the middle two incremental bins, from $11.20 to $13.60, should show an employment increase and then decrease accordingly. In both cases, employment series for actual Alberta (with the policy) and synthetic Alberta (counterfactual without the policy) behave similarly up to the policy, until just before the first minimum wage increase to $11.20 occurs. 6
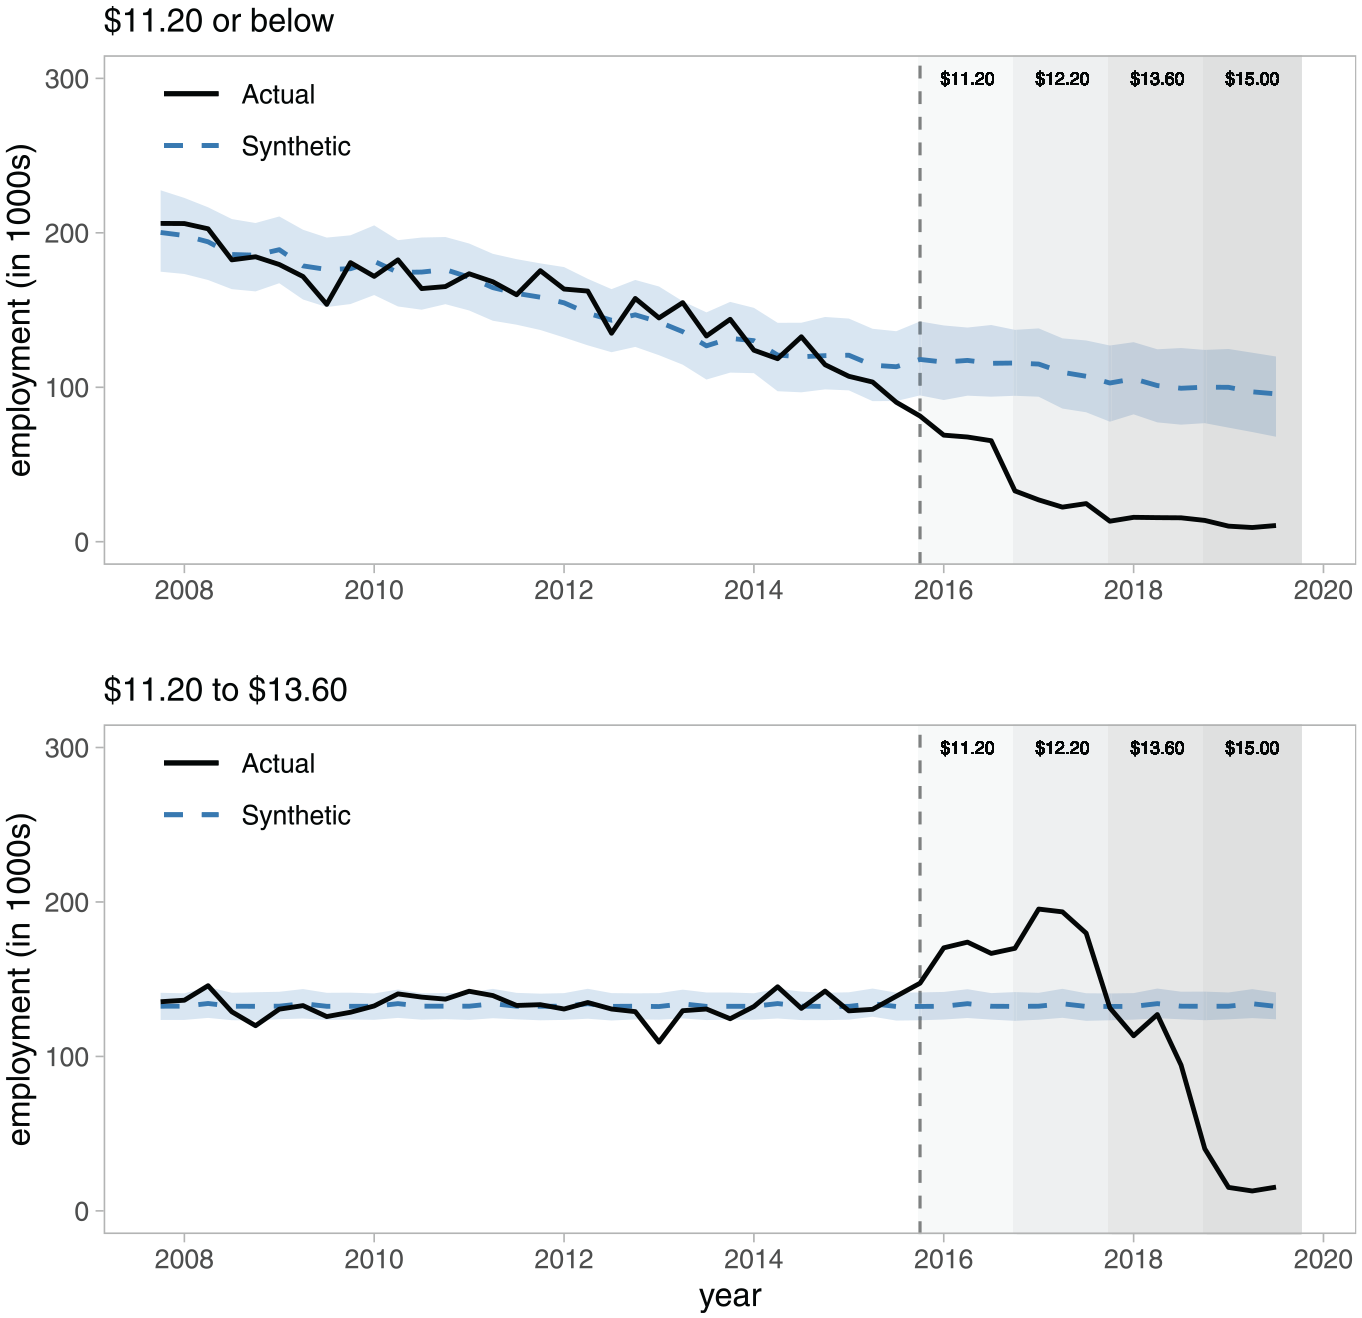
Employment Effects of Alberta’s $15 Minimum Wage by Wage Bins
After October 2015, the trend lines in Figure 2 begin to diverge significantly, as expected. In the case of the $11.20 and below bin, actual employment levels are below that of the synthetic control almost immediately, as workers start moving out of this wage bin, reducing employment in the bin toward zero. In the case of the $11.20 to $13.60 bin, the actual employment level at first moves above that of the synthetic control, as more workers suddenly appear in these middle wage bins during the first two minimum wage increases. But, as the minimum wage increased to $13.60, and then higher to $15.00, most workers then moved out of those wage bins, again reducing employment toward zero. Although we show only the middle bin results for brevity, we also did this analysis separately for each incremental wage bin (see Figure A.2.1 of the Online Appendix).
As for how far the reach of the $15 policy was on the lower end of the wage distribution, we turn to the descriptive statistics for each wage bin laid out in Table 1. The employment level and share of employment for each wage bin are shown for October 2014, before the policy, in the top panel, and for October 2018, after the policy was fully in place, in the bottom panel. Initially, in October 2014, by adding up the employment shares in the top panel, from the $10.20 or less bin, through the $13.60 to $15.00 bin, the reach of the $15 minimum wage policy was just past the 15th percentile (15.86) of the wage distribution. This percentile is remarkably high for Canada, given that Campolieti (2015) previously found a lower distributional reach of the 5th percentile for men and the 10th percentile for women. For US results, however, it is within range, as Autor, Manning, and Smith (2016) found impacts as high as the 10th percentile for men and the 25th percentile for women.
Employment Descriptive Statistics by Wage Bins
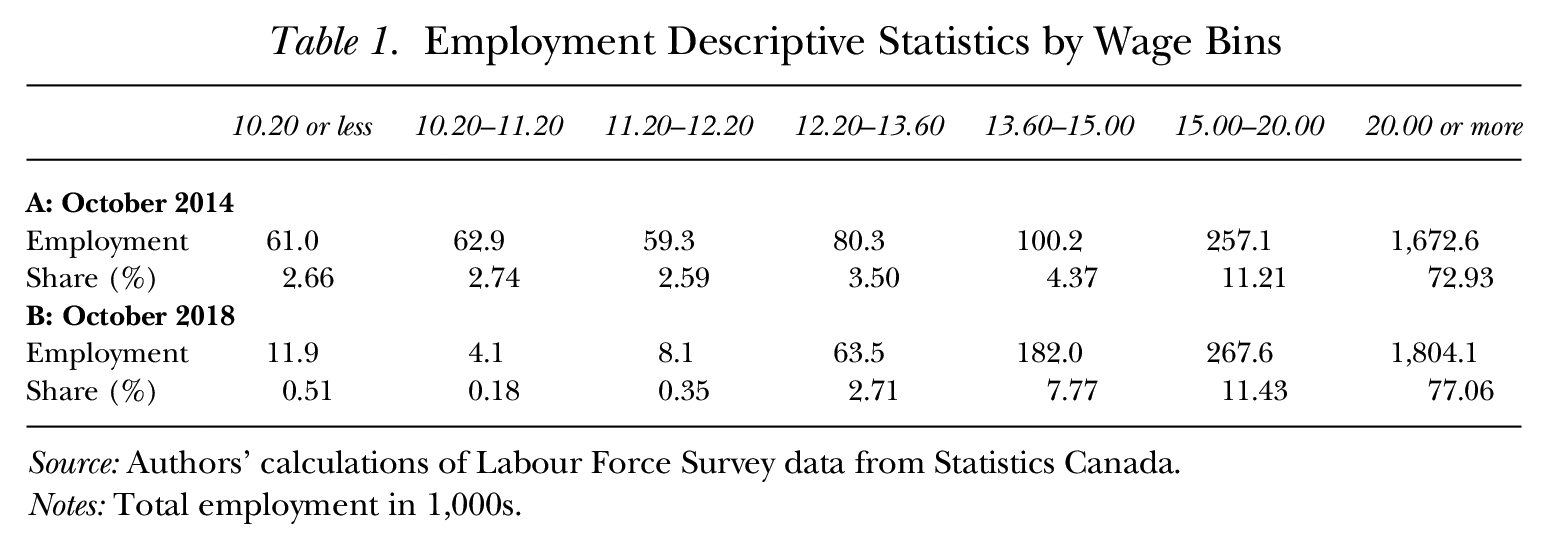
Source: Authors’ calculations of Labour Force Survey data from Statistics Canada.
Notes: Total employment in 1,000s.
By Ages: Youth Lost Employment
Our second cut of the LFS data by ages continues to answer the first main research question: Do these new types of large minimum wage changes offer results that are similar to or different from the mostly small changes in the existing literature? Cengiz et al. (2022) showed age to be the strongest predictor of being affected by a minimum wage policy, and the minimum wage literature points to negative, but relatively small, employment effects resulting from minimum wage increases, typically for teenagers and younger adults. 7 In this age cut, we want to know whether the affected age groups align with the previous literature, how our employment elasticities and level changes relate to that of the previous literature, and whether any potential job loss from this policy was predictable.
The sign and significance of the employment effects of Alberta’s $15 policy are displayed by age group in Figure 3. The top panel shows the actual and synthetic employment levels for individuals aged 25 years and older, which behave similarly over our sample, with no significant job losses for older individuals due to the minimum wage increases. The bottom panel displays the employment of younger individuals aged 15 to 24. In this case, the actual and synthetic series behave similarly through September 2016, so no job losses occur from the first minimum wage increase to $11.20. After the second increase to $12.20 in October 2016, however, the employment series diverge, with the actual employment level statistically below that of the synthetic control until the end of our sample, reflecting job losses only for younger workers.
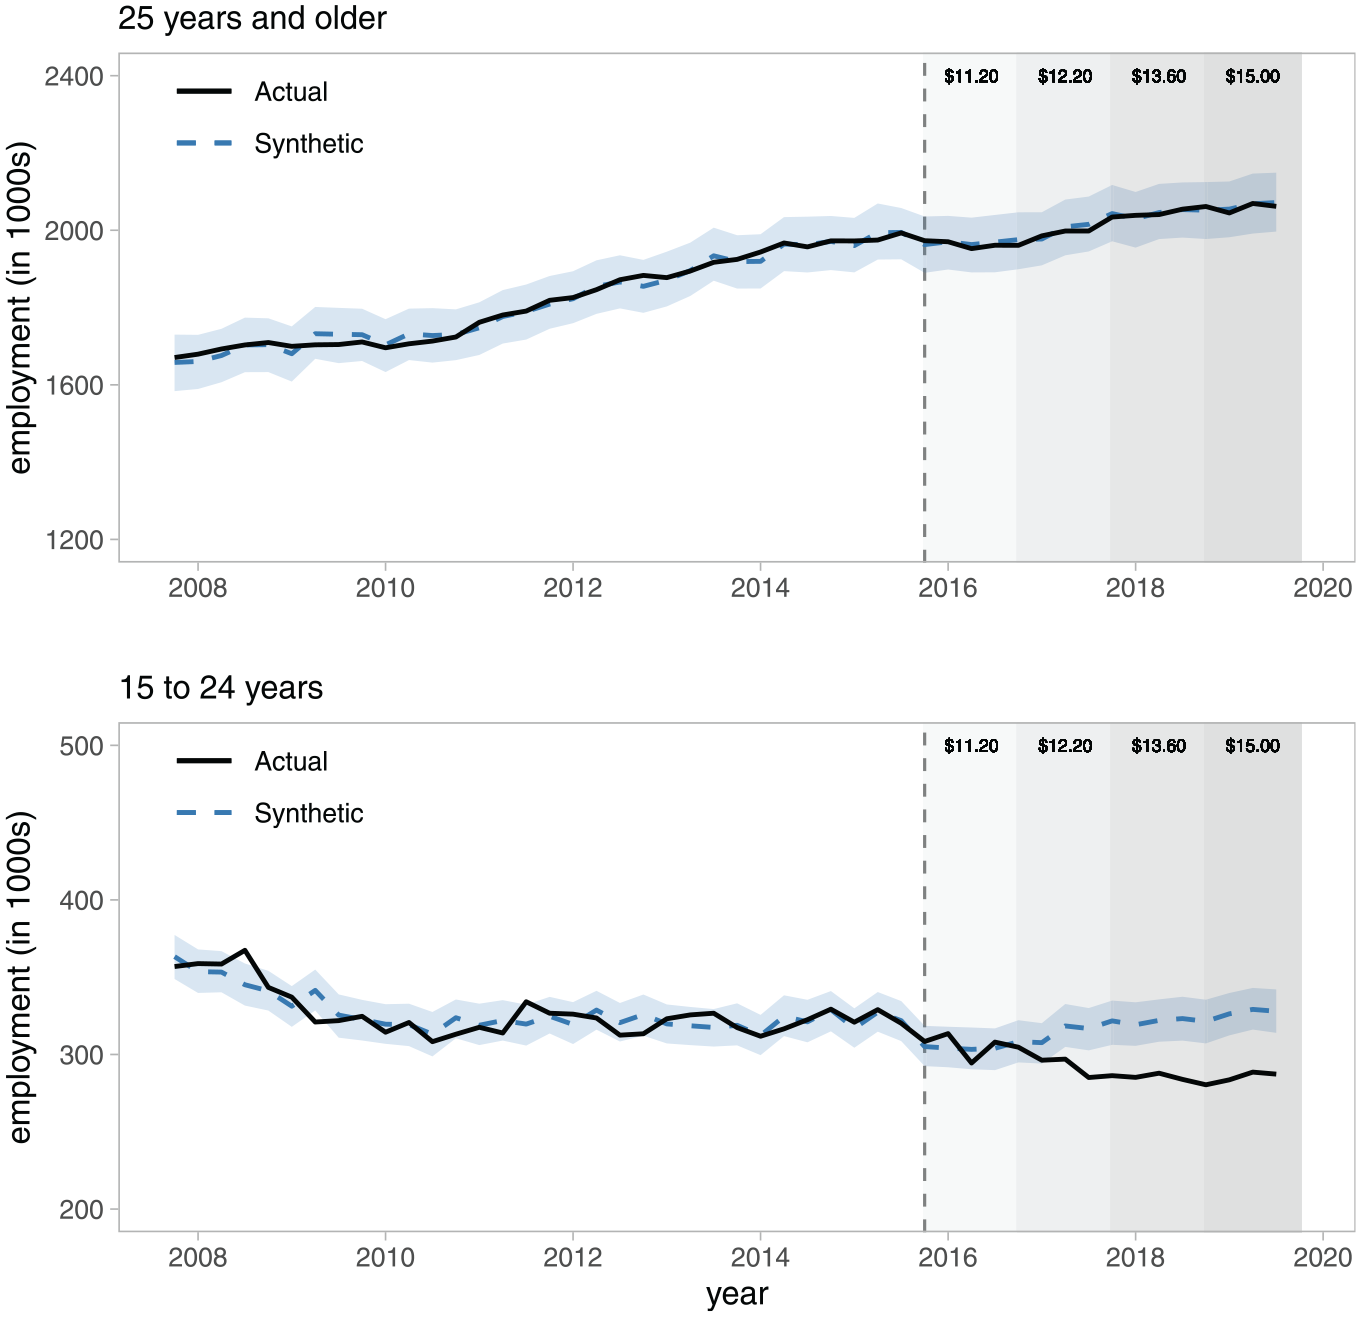
Employment Effects of Alberta’s $15 Minimum Wage by Age Groups
Most often in the literature, the size of the employment effect of a minimum wage policy takes the form of an elasticity between the changes in the real minimum wage and youth employment. The often-quoted US elasticity estimates of −0.1 to −0.3 (Brown et al. 1982) imply that a 10% increase in the real minimum wage reduces the affected employment by 1 to 3%, but Brown (1999) then put that number closer to the lower bound of −0.1. For Canada, these elasticity estimates are typically larger than for the United States, ranging from −0.17 to −0.75 (Marchand 2017), with a recent meta-analysis of Canadian studies finding an elasticity of approximately −0.27 (Campolieti 2020). Back-of-the-envelope employment-level predictions using these previous elasticities for British Columbia (Green 2015) and Alberta (Marchand 2017), which had similarly sized labor forces, suggested employment losses of around 25,000 young workers from their proposed $15 minimum wage policies.
The magnitude of the employment effects of Alberta’s policy are summarized by age group in Table 2. The top panel reports the posterior mean treatment effect, its standard deviation, and the posterior tail-probability of no effect. 8 As expected, we again find no evidence of employment losses for older workers. By comparison, we find a significant employment loss for younger individuals of 7%, relative to their third quarter 2015 employment level. This finding implies an employment elasticity of −0.15 and an average employment-level loss of 23,012 jobs for younger individuals attributed to the minimum wage increases. We additionally find similar employment effects for teenagers, aged 15 to 19, and younger adults, aged 20 to 24, when analyzed separately (see Figure A.3.1 of the Online Appendix), while the literature typically shows larger effects for teens.
Employment Effects of Alberta’s $15 Minimum Wage by Age Groups
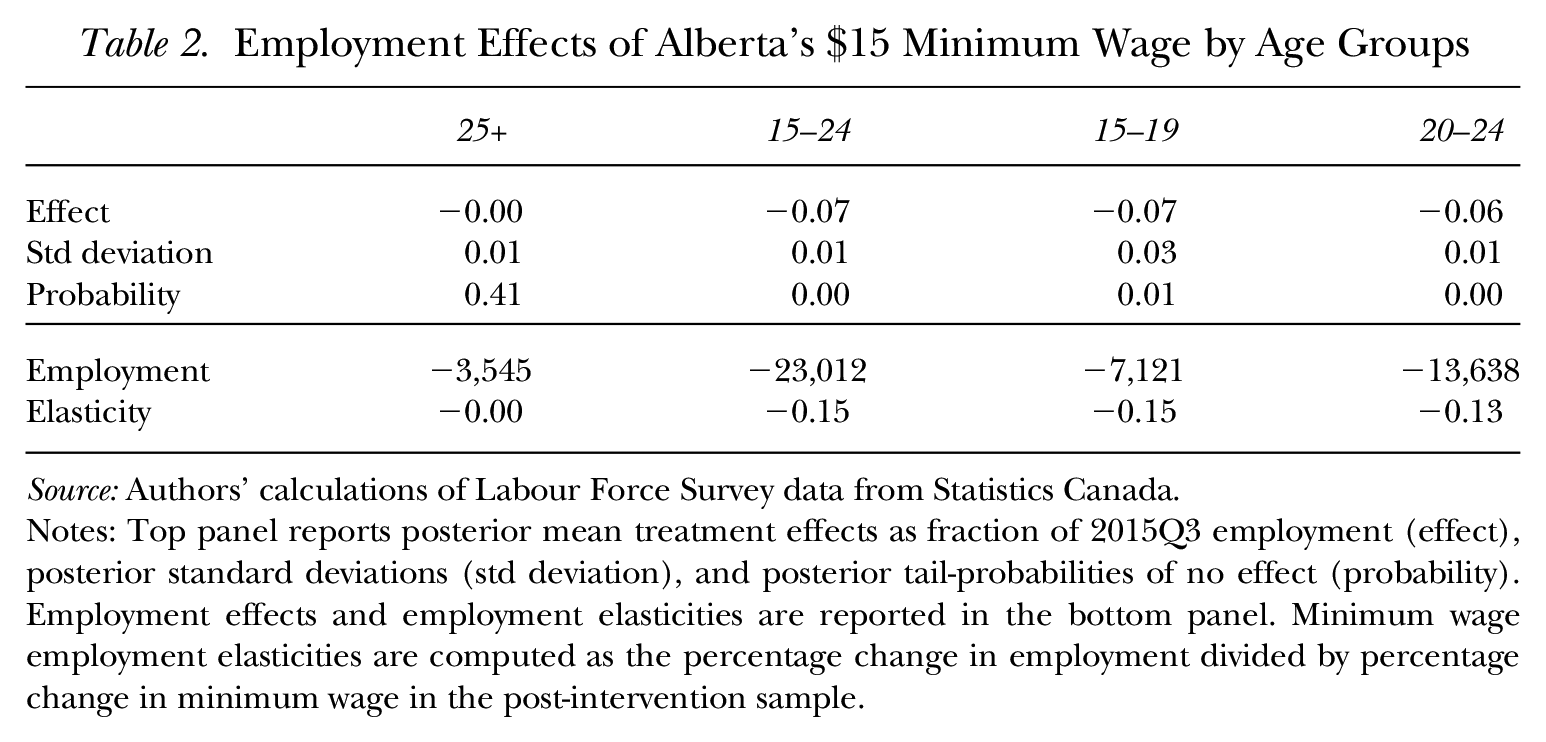
Source: Authors’ calculations of Labour Force Survey data from Statistics Canada.
Notes: Top panel reports posterior mean treatment effects as fraction of 2015Q3 employment (effect), posterior standard deviations (std deviation), and posterior tail-probabilities of no effect (probability). Employment effects and employment elasticities are reported in the bottom panel. Minimum wage employment elasticities are computed as the percentage change in employment divided by percentage change in minimum wage in the post-intervention sample.
Could these employment changes from the minimum wage have been predicted ahead of time? The minimum-to-median wage ratio, also known as the Kaitz index, offers some insight as to where these negative employment effects may become significant. Fortin (2010) suggested that employment loss from a minimum wage begins to occur with a pre-reform Kaitz index above 45% in the context of the Canadian province of Quebec, and Cengiz et al. (2019) recently showed US evidence that this pre-reform threshold may be as high as 60%. Gregory and Zierahn (2022) reported a post-reform Kaitz index close to 100% for a particular large minimum wage increase among construction workers in Germany.
The average, median, and minimum wage rates, as well as the Kaitz indices, are shown by age group for Alberta and Saskatchewan in Table 3. In October 2014, the year before Alberta’s $15 minimum wage policy, the nominal minimum wage in both provinces was $10.20, and the Kaitz index was approximately 40% for older workers (aged 25–64). This ratio for younger workers (15–24) was already higher than 60% in both provinces at that time. By October 2018, when Alberta’s $15 minimum wage was fully in place, the nominal minimum wage in Saskatchewan was only $11.06. As a result, the minimum-to-median wage ratio in Alberta increased to more than 50% for prime-age (25–54) and older (55–64) workers, and it increased to as high as 92% for young workers. By contrast, the Kaitz indices remained mostly unchanged in Saskatchewan in the post-intervention sample.
Wage Descriptive Statistics by Province and Age
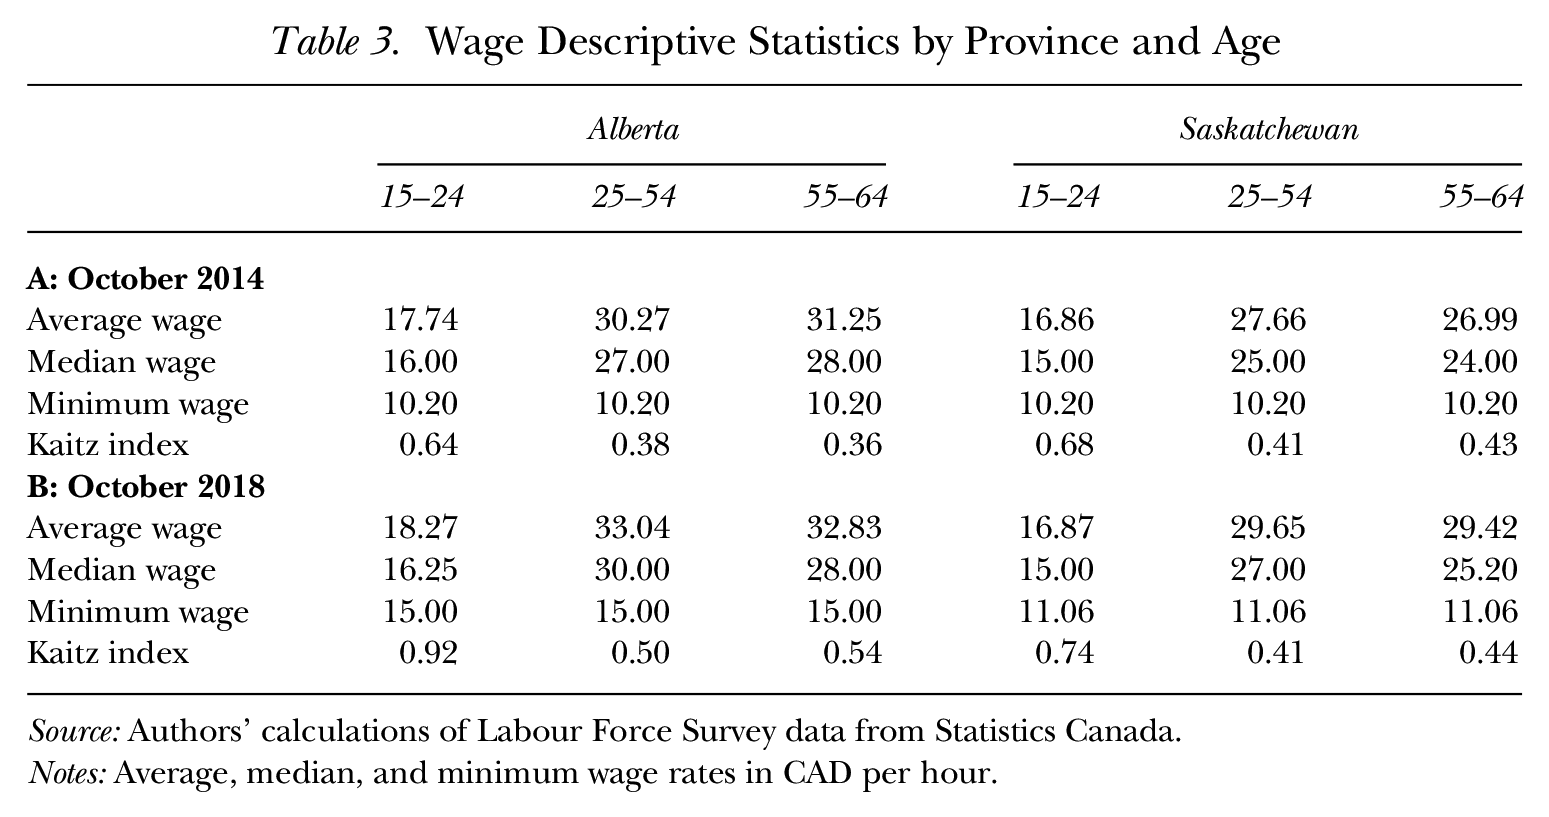
Source: Authors’ calculations of Labour Force Survey data from Statistics Canada.
Notes: Average, median, and minimum wage rates in CAD per hour.
By Places: Non-Urban Areas Lost Employment
Our third and final cut of the LFS data is by place. While all three cuts help answer the first research question, the place cut also helps to specifically answer our second main research question: How are these results similar or different in terms of the expanding geographical reach of the policies? This inquiry follows the suggestion for a more local approach to measuring minimum wage effects (Thompson 2009; Dube, Lester, and Reich 2010), and the finding of “rural” (i.e., non-urban) as the fifth most important predictor of being an affected worker by a minimum wage (Cengiz et al. 2022). 9 In this place cut, we begin with a comparison of urban and non-urban employment changes, in light of the previous literature and our age results, and then include more nuance by showing cross-tabulations of place and age, breakouts for each Alberta economic region, and the Kaitz indices by region.
When one common minimum wage level is applied to a host of heterogeneous regions, large urban areas might better absorb the employment impacts of significant minimum wage increases, compared to non-urban areas, given their higher price and wage levels. New York State’s geographic rollout of its $15 minimum wage followed this logic, from New York City, to its suburbs, and then on to the rest of the state. This logic also relates to recent studies on market concentration, population density, and minimum wages (see, e.g., Azar et al. 2023).
The sign and significance of the employment effects from Alberta’s $15 policy are presented by region type in Figure 4. 10 The top panel shows the urban regions, where the actual and synthetic employment series behave similarly until the end of our sample. As a result, we do not observe significant job losses due to the minimum wage in urban areas, as predicted. For the non-urban regions (reflected in the bottom panel), the actual and synthetic series behave similarly until September 2015, when the first minimum wage increase to $11.20 was implemented. After October 2015, these series diverge, and the actual employment levels are below those of the synthetic control, displaying significant job loss in non-urban areas, again as predicted.
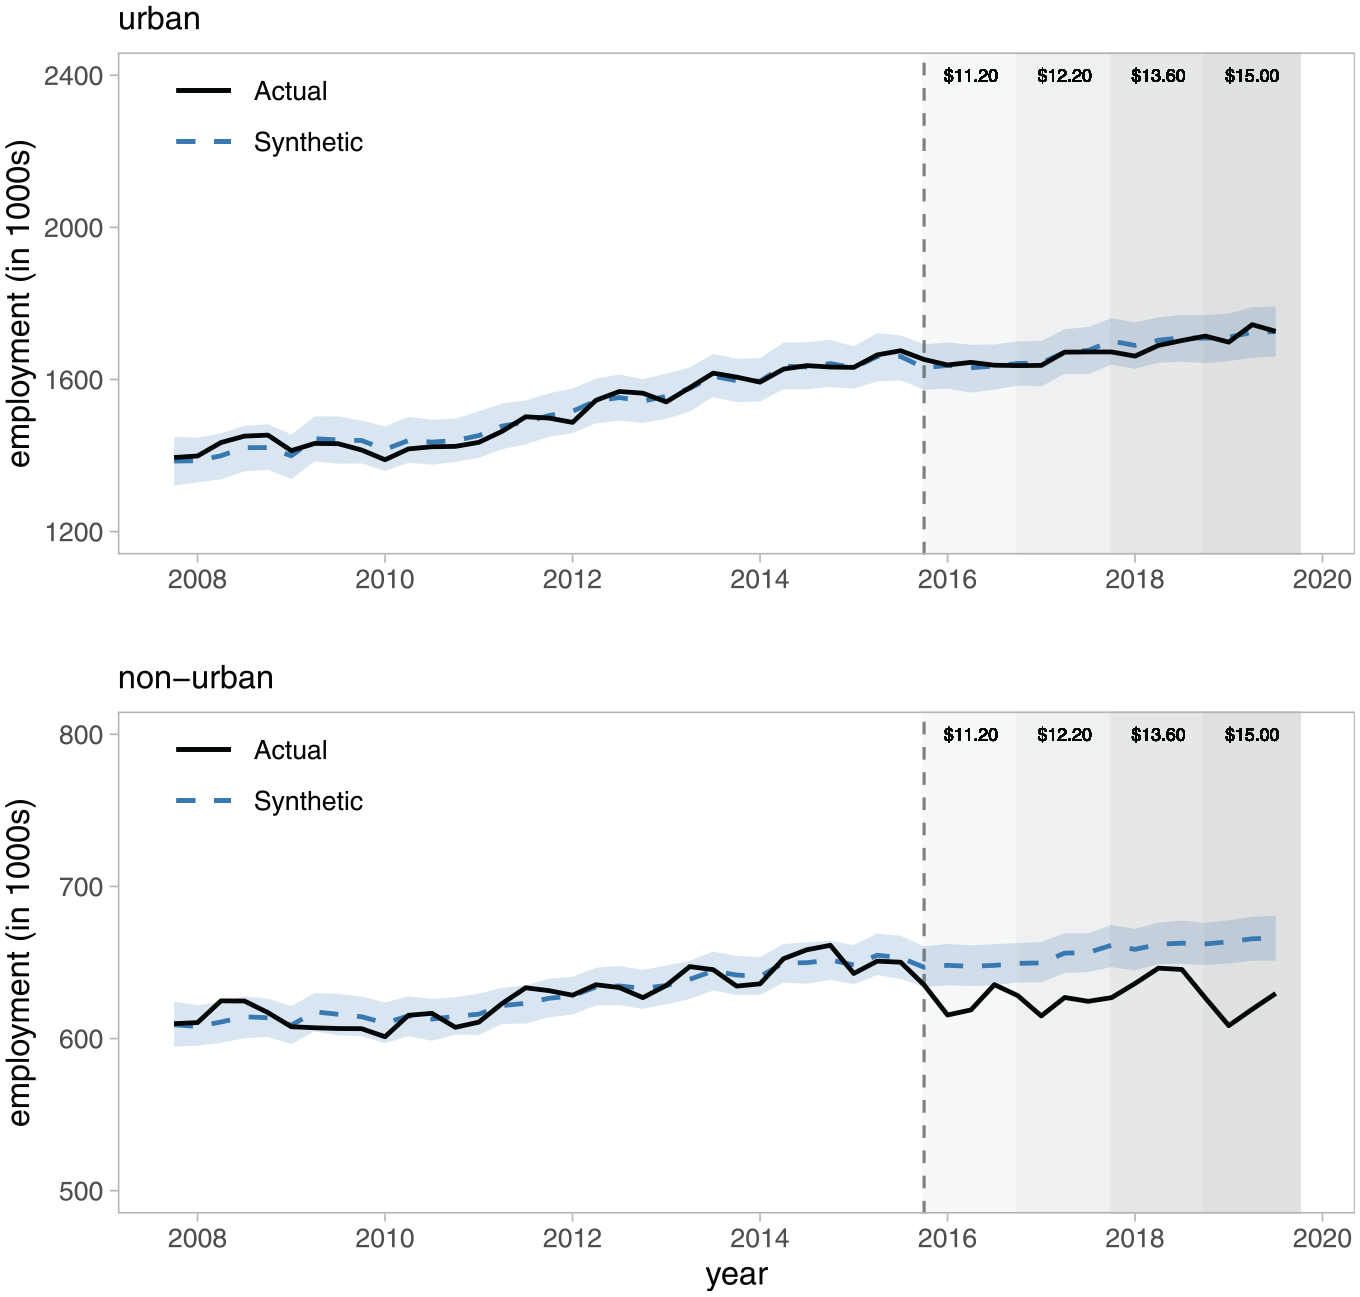
Employment Effects of Alberta’s $15 Minimum Wage by Economic Regions
The magnitude of the employment effects of Alberta’s policy are summarized by place and age in Table 4, again reporting the posterior mean treatment effect, its standard deviation, and the posterior tail-probability of no effect. As expected, we find no evidence of employment losses for urban workers. By contrast, we find a significant loss of employment of 4% for non-urban workers, relative to their third quarter 2015 employment level, implying an employment elasticity of −0.09 and an average loss of 29,136 jobs for this group. Our results for older workers (aged 25+) in non-urban areas are similar, as we again find a significant loss of employment of 4%. However, we find no evidence of employment loss for older workers in urban areas. But, we find a significant loss of employment of 8% for younger workers (aged 15–24) for both urban and non-urban workers (see Figures A.4.1 and A.4.2 of the Online Appendix).
Employment Effects of Alberta’s $15 Minimum Wage by Place and Age
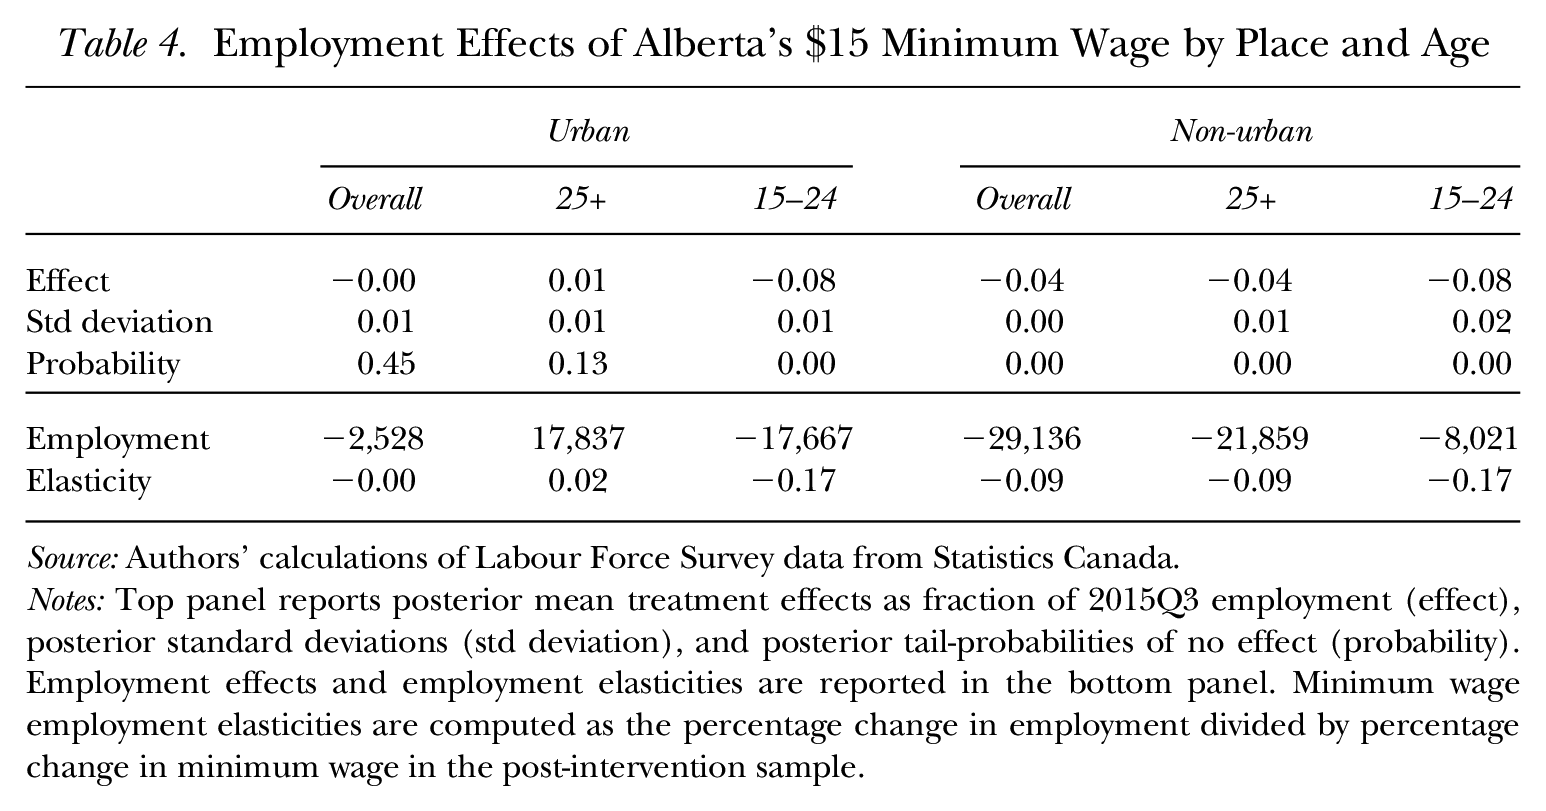
Source: Authors’ calculations of Labour Force Survey data from Statistics Canada.
Notes: Top panel reports posterior mean treatment effects as fraction of 2015Q3 employment (effect), posterior standard deviations (std deviation), and posterior tail-probabilities of no effect (probability). Employment effects and employment elasticities are reported in the bottom panel. Minimum wage employment elasticities are computed as the percentage change in employment divided by percentage change in minimum wage in the post-intervention sample.
As the reach of these large minimum wage changes expands outward in geography, from the local city or municipality to the state, province, or territory, and then even to the nation, more and more heterogeneity will exist in the price and wage levels across the locations covered by such a policy. Whereas previous research has mainly analyzed small changes in the minimum wage using a wider geography, more recent examples have instead examined large changes in a smaller geography, such as Seattle (see Reich et al. 2017; Jardim et al. 2022). While the Seattle studies allowed us to see how a city policy compares to no change in policy for the rest of the state, they do not allow for a regional analysis of a policy spread out across several regions within a state, province, or territory, as provided by our Alberta example.
The province of Alberta can be divided into seven economic regions within the LFS data: two urban regions (Calgary, R2; and Edmonton, R4) and five non-urban regions (Banff, Jasper, and Rocky Mountain House, R1; Camrose and Drumheller, R3; Lethbridge, R5; Red Deer, R6; Wood Buffalo and Cold Lake, R7). 11 The results, summarized in Table 5, show no significant employment losses in either major city of Calgary (R2) or Edmonton (R4), consistent with our results for urban workers. But four of our five non-urban regions exhibited significant employment losses ranging from 5 to 7%, with elasticities between −0.11 and −0.15, remarkably similar to our results based on age. 12 That said, the non-urban area of Lethbridge (R5) showed a small employment gain of 2%, although it was not statistically significant.
Employment Effects of Alberta’s $15 Minimum Wage by Economic Regions
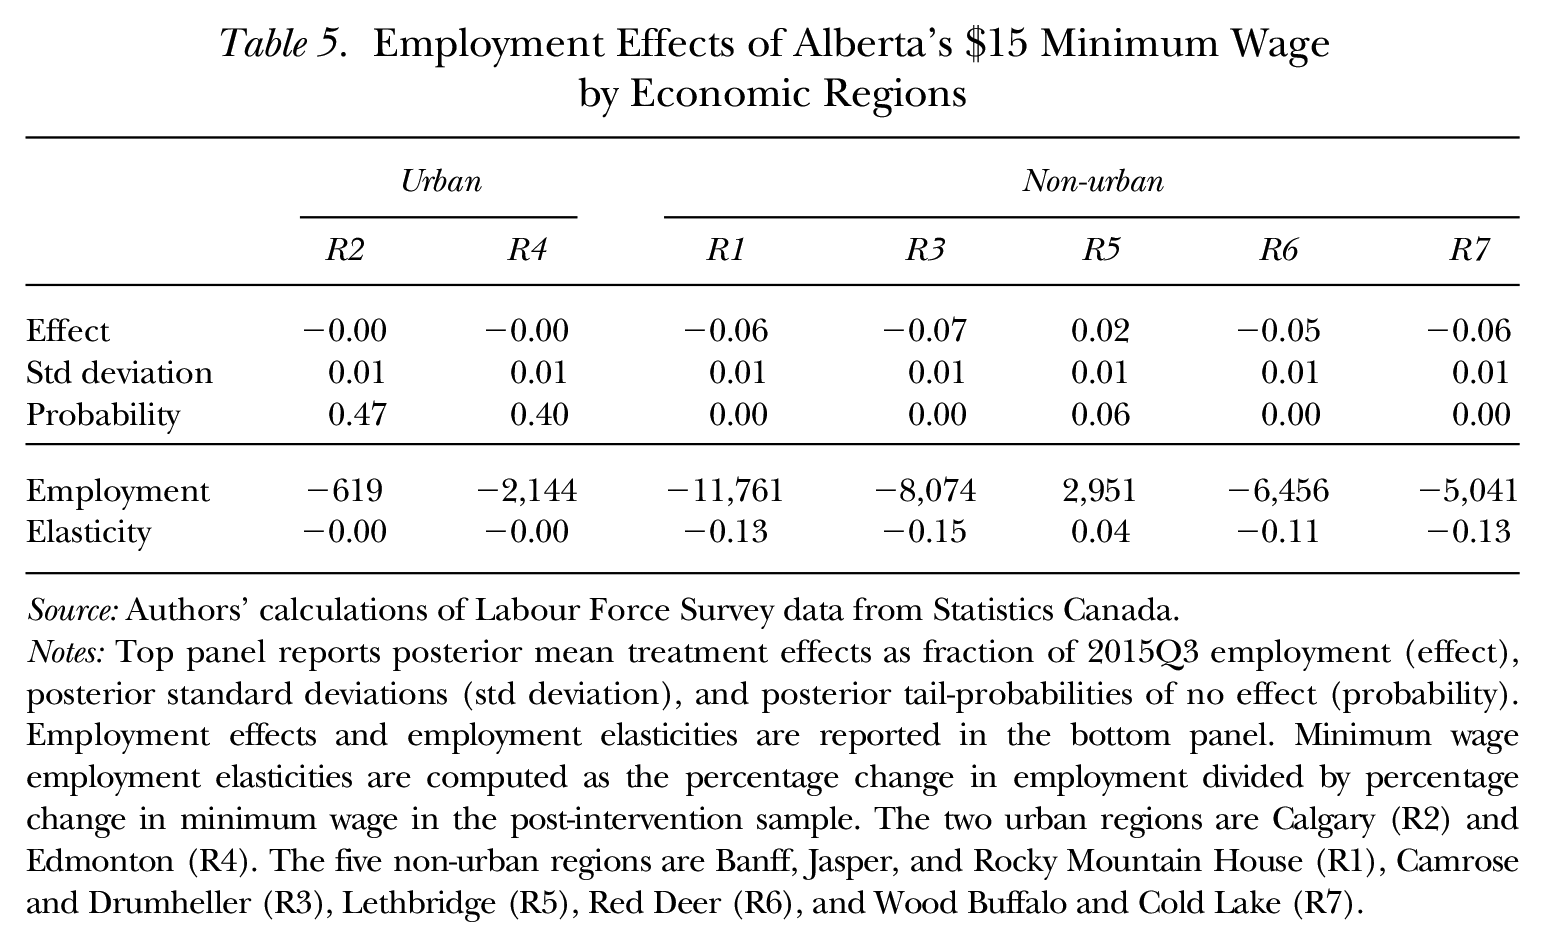
Source: Authors’ calculations of Labour Force Survey data from Statistics Canada.
Notes: Top panel reports posterior mean treatment effects as fraction of 2015Q3 employment (effect), posterior standard deviations (std deviation), and posterior tail-probabilities of no effect (probability). Employment effects and employment elasticities are reported in the bottom panel. Minimum wage employment elasticities are computed as the percentage change in employment divided by percentage change in minimum wage in the post-intervention sample. The two urban regions are Calgary (R2) and Edmonton (R4). The five non-urban regions are Banff, Jasper, and Rocky Mountain House (R1), Camrose and Drumheller (R3), Lethbridge (R5), Red Deer (R6), and Wood Buffalo and Cold Lake (R7).
Again, one way to anticipate the relative employment impacts of a minimum wage policy across different geographies is to use the ratio of the minimum-to-median wage for each area, or the Kaitz index. Table 6 presents the average, median, and minimum wage rates, as well as Kaitz indices, for each of Alberta’s seven economic regions. While the average wage of the Wood Buffalo and Cold Lake region ($34.61) was higher than the main cities of Calgary ($30.96) and Edmonton ($30.97) in 2018, primarily because of the presence of energy extraction in that area, the average wage of the two urban regions was above those of the other four non-urban ones (at $30.48, $27.60, $27.68, and $28.91). The pre-reform Kaitz index was approximately 40% in all seven economic regions in October 2014. By October 2018, however, the post-reform Kaitz index in Alberta’s urban regions increased to more than 50%, while this ratio increased to 60% or above in three of the five non-urban regions.
Wage Descriptive Statistics by Economic Regions
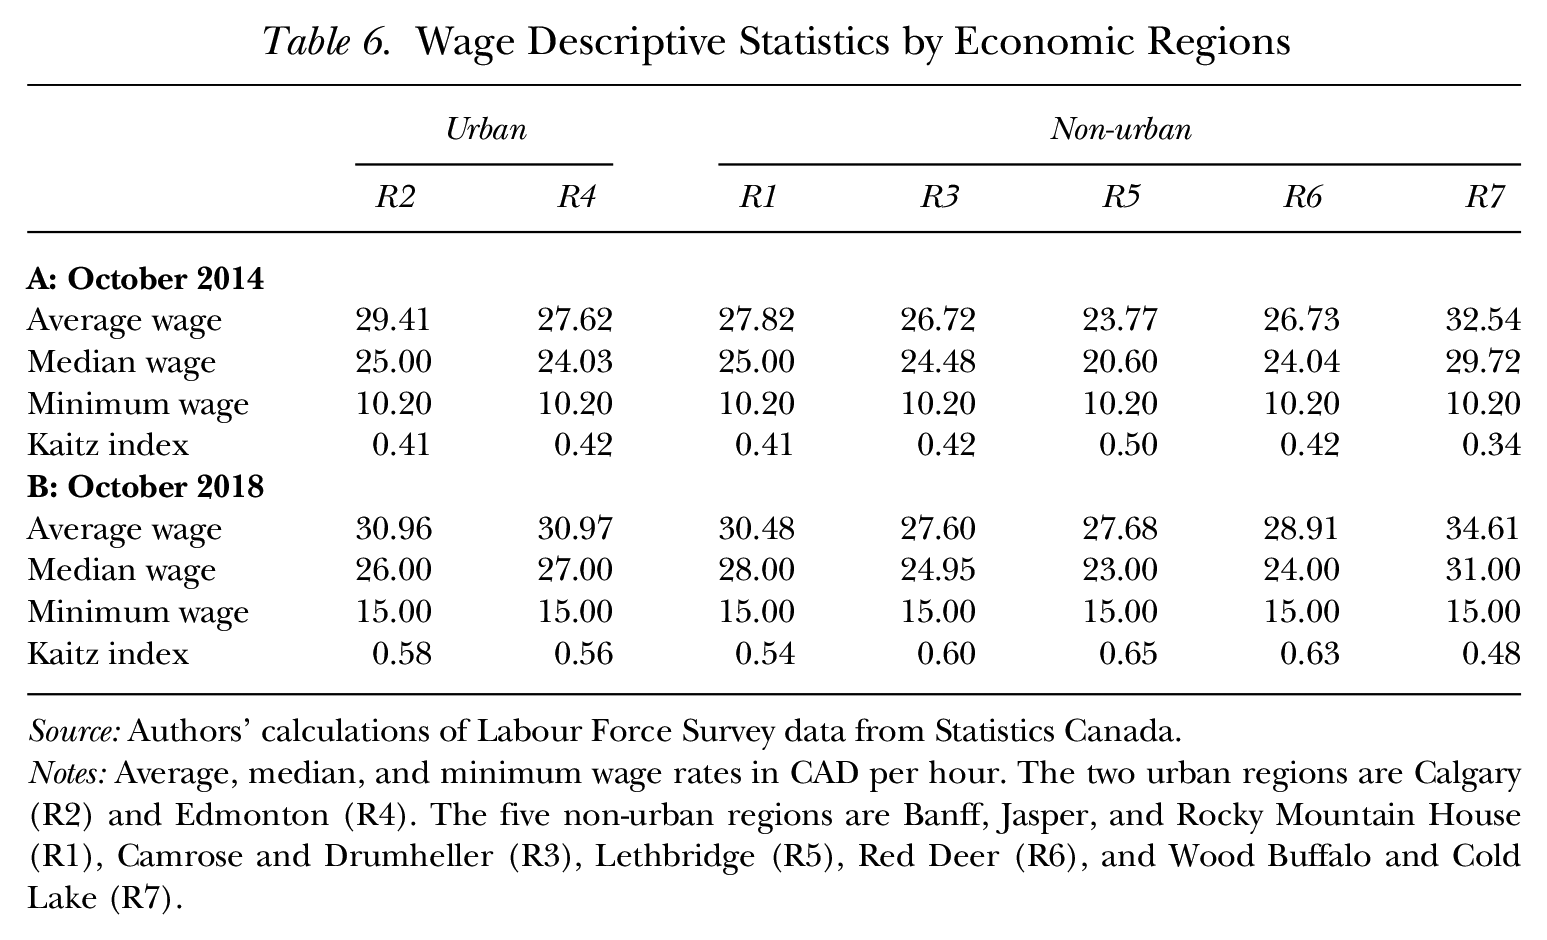
Source: Authors’ calculations of Labour Force Survey data from Statistics Canada.
Notes: Average, median, and minimum wage rates in CAD per hour. The two urban regions are Calgary (R2) and Edmonton (R4). The five non-urban regions are Banff, Jasper, and Rocky Mountain House (R1), Camrose and Drumheller (R3), Lethbridge (R5), Red Deer (R6), and Wood Buffalo and Cold Lake (R7).
Robustness
Altogether, our estimates have been remarkably consistent across our three cuts of data. That said, we aim to be as transparent as possible in the application of our synthetic control approach and with how robust our results are to multiple specifications of those controls. We do so by following the various suggested ways of doing robustness checks by Samartsidis et al. (2019) and Abadie (2021).
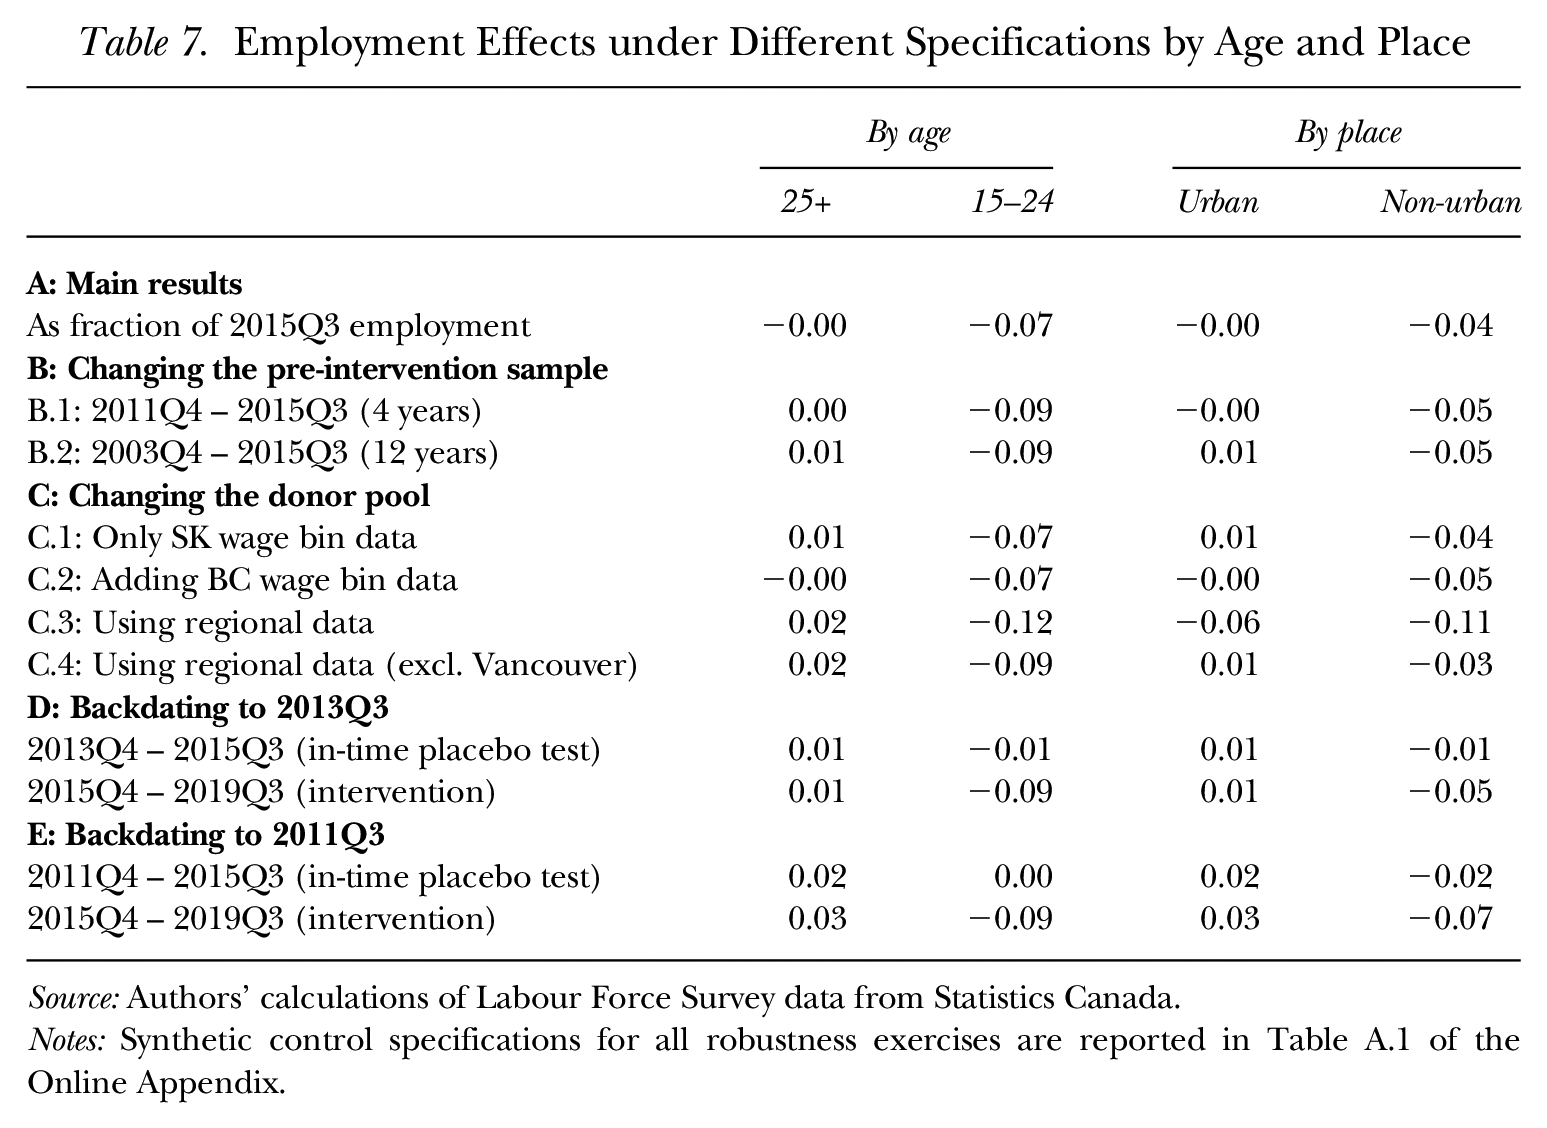
First, we use a different time horizon in estimating the models, as shown in panel B of Table 7 (and Figures B.1.1 to B.2.4 of the Online Appendix). Our main results, shown in panel A, use an eight-year sample (2007Q4–2015Q3) of pre-intervention data. We now report the results obtained using four years (2011Q4–2015Q3) and twelve years (2003Q4–2015Q3). In both cases, the results are consistent, as we find a significant loss of employment, with a slightly higher 9% loss for young workers and 5% for non-urban workers. We again find no evidence of employment losses for older workers or urban workers.
Employment Effects under Different Specifications by Age and Place
Source: Authors’ calculations of Labour Force Survey data from Statistics Canada.
Notes: Synthetic control specifications for all robustness exercises are reported in Table A.1 of the Online Appendix.
Second, we alter the selection of untreated units used to construct the synthetic controls, as shown in panel C of Table 7 (and Figures C.1.1 to C.4.4 of the Online Appendix). We make the following changes to the donor pool: 1) drop Alberta employment data and use only Saskatchewan data; 2) add British Columbia employment data sliced by wage bins, just like the Saskatchewan data; 3) slice British Columbia and Saskatchewan employment data by economic regions instead of wage bins; and 4) slice British Columbia and Saskatchewan employment data by economic regions, but exclude the Vancouver economic region as there is no equivalently large Alberta city. In this case, we find that the results are sensitive to the choice of controls. Nevertheless, our main results are the most conservative estimates we obtain.
Third, we backdate the timing of the intervention by two years (to 2013Q3) and four years (to 2011Q3), as shown in panels D and E of Table 7 (and Figures D.1.1 to E.1.4 of the Online Appendix). As discussed in Abadie, Diamond, and Hainmueller (2015) and Abadie (2021), this step is, effectively, an in-time placebo test, meaning we should not find effects prior to the actual intervention date. These results show small and insignificant employment losses in the periods immediately before the intervention. After the intervention, we find employment losses that are similar to those reported above. However, the precision of our results deteriorates when the intervention is backdated by longer periods.
Overall, our robustness results reported in Table 7 (and in the Online Appendix) suggest that any potential job loss was almost entirely experienced by younger Albertans, with a loss of employment estimated to be between 7 and 13%, relative to the third quarter 2015 employment level for this group. Similarly, our results suggest a loss of employment estimated to be between 3 and 13% for the non-urban group, relative to its third quarter 2015 employment level. Finally, the in-time placebo tests show minimal effects on employment by age group or economic region.
Conclusion
The minimum wage literature comprises estimates identified over small, plentiful, and expected changes to the minimum wage that are spread out over time. A recent set of minimum wage policies have instead been large in magnitude, unexpected to many, relatively quick in their rollout, and typically focused around a nominal level of $15, regardless of country, currency, or the initial price and wage levels. As the first province, state, or territory in North America to have a $15 minimum wage, Alberta became the “First to $15” on October 1, 2018. Resulting from a sudden and unexpected change in government, policymakers scrapped the previous minimum wage formula, based evenly on annual growth in earnings and prices, for a large nominal increase of 47% through four incremental increases over a three-year duration.
To say anything normative about these new types of minimum wage policies, we must first be able to say something positive through empirical investigation. To do this, our study examined the impacts of Alberta’s $15 minimum wage policy on employment using synthetic control methods applied to aggregate Labour Force Survey data from Statistics Canada. For our counterfactual, we primarily compare Alberta, with its new and unexpected policy, to its neighboring province of Saskatchewan, with its automatic and formula-based minimum wage, similar to Alberta’s previous policy. As highlighted by the subtitle of the article, our evidence falls into three distinct cuts of employment outcomes, by wages, ages, and places, with the first two cuts tying into the broader literature and the third cut serving as a more unique contribution.
Our first main research question was whether these new types of policies, containing large minimum wage increases, offer results that are similar to or different from the existing literature, which was based on the previous smaller minimum wage increases. Perhaps surprisingly, the new evidence shares many similarities with the old evidence. To start, a significant number of workers moved up the wage distribution, according to each incremental increase, as the raised minimum wage is no longer allowing employment in those lower bins, validating our method. That said, not all of the workers from the lower wage bins made appearances in the higher wage bins during these movements. Employment losses were found among young workers and outside of urban areas, which were in part predictable based on their initial Kaitz indices. But those losses also came with the same implied employment elasticities reported in the earlier literature, between −0.10 and −0.15.
There were differences, however, between our evidence for this large minimum wage increase for Alberta and that of the smaller minimum wage increases of the literature. First, the distributional reach of this policy was unsurprisingly higher, up to the 15th percentile, than that of the Canadian literature, previously ranging from the 5th to 10th percentiles. Second, although the employment elasticities were the same, the employment-level losses were larger for the new policy, because the same elasticity multiplied by a larger minimum wage change will mechanically result in larger level changes. Third, the employment effect was consistent across teens (aged 15–19) and slightly older workers (20–24), which is not always the case in the literature. Last, although affected groups were predictable, not all were tested, and predictions based on the Kaitz index were consistent, but did not always hold.
Our second main research question was whether our results are similar or different in terms of the expanding geographic reach of the policy, as one wage is being applied to places with dissimilar price levels. This question is a relatively new contribution. When the impacts are examined by region, employment losses were found for four of the five non-urban regions, whereas employment losses in the two urban areas were insignificant. As stated above, the magnitudes and elasticities are remarkably consistent in terms of affected ages and places. Therefore, we find geography to be as equally important as age as a factor for determining the affected individuals of a minimum wage policy. When mixing place and age, youth losses and older employment gains almost equally offset each other in urban areas. And once again, the Kaitz index showed where employment losses would occur, with some exceptions.
The main takeaways from Alberta’s policy are that the employment effects, which were negative and significant, were found only among the young, who were more likely to be employed at lower wages, and within non-urban regions, with their lower relative price and wage levels. But despite how large, rapid, and unexpected the increases were, the employment elasticities were almost exactly in line with the literature. In addition, heterogeneity matters when applying one wage level to a variety of places, but some nuance also occurs, and not all predictions hold. As more of these large minimum wage changes, to and above the nominal $15 minimum wage threshold, are introduced while expanding their geographic reach to the next set of US states, Canadian provinces and territories, and possibly throughout all of Canada and the United States, the Alberta case can serve as an example of what might be, albeit having happened during a time of lower inflation. The more heterogeneous the localities within that future geographic policy reach, however, the more nuance and uncertainty will be introduced.
Supplemental Material
sj-pdf-1-ilr-10.1177_00197939231213064 – Supplemental material for First to $15: Alberta’s Minimum Wage Policy on Employment by Wages, Ages, and Places
Supplemental material, sj-pdf-1-ilr-10.1177_00197939231213064 for First to $15: Alberta’s Minimum Wage Policy on Employment by Wages, Ages, and Places by Sebastian Fossati and Joseph Marchand in ILR Review
Footnotes
Acknowledgements
We thank Hugo Jales for helpful comments.
This research was supported by funding from the Canada First Research Excellence Fund as part of the University of Alberta’s Future Energy Systems research initiative. Although the research and analysis are based on data from Statistics Canada, the opinions expressed do not represent the views of Statistics Canada.
Corresponding author Joseph Marchand may be reached at
1
The minimum wage literature has so many studies at present that even its literature reviews have become numerous (for example, Brown, Gilroy, and Kohen 1982; Card and Krueger 1994, 1995; Brown 1999; Neumark and Wascher 2007, 2008; Neumark, Salas, and Wascher 2014; Allegretto, Dube, Reich, and Zipperer 2017; Neumark and Wascher 2017; Dube 2019; and most recently, ![]() ).
).
2
3
Given currency differences, $15 CAD is not exactly equivalent to $15 USD. On October 1, 2018, $15 CAD was equivalent to $11.71 USD, based on the daily exchange rate of 0.7804. However, when the policy was first proposed in April 2015, the value of $15 CAD was $12.15 USD, based on the monthly exchange rate of 0.8102.
4
While the aggregate version of the wage bin cuts is not publicly available, these can be aggregated using the publicly available micro data.
5
Although an examination of oil price shocks and minimum wages is beyond the scope of our work, several studies have previously looked at the cyclical effects of minimum wages by analyzing their employment effects during recessions (Sabia 2014, 2015; ![]() ).
).
6
For the $11.20 and below bin, our model identifies Saskatchewan employment for the $10.20 or less wage bin and the $20.00 or more wage bin, as well as Alberta employment for the $20.00 or more wage bin, as the untreated units with the largest posterior probabilities of appearing in the synthetic control regression. By contrast, for the $11.20 to $13.60 bin, the synthetic control is constructed using the local-level term and quarterly seasonal dummy variables. See ![]() .
.
7
Again, for various reviews of the minimum wage literature, see Brown et al. (1982), Card and Krueger (1994, 1995), Brown (1999), Neumark and Wascher (2007, 2008), Neumark et al. (2014), Allegretto et al. (2017), Neumark and Wascher (2017), Dube (2019), and most recently, ![]() .
.
8
For young individuals, our model identifies Saskatchewan employment for the $10.20 or less wage bin, and Alberta employment for the $20.00 or more wage bin, as the untreated units with the largest posterior probabilities of appearing in the synthetic control regression. By contrast, for older individuals, the only untreated unit that appears in the regression is Alberta employment for the $20.00 or more wage bin. See ![]() .
.
9
The border approach, made popular by ![]() , cannot be used for Canadian studies of the minimum wage, because Canada has fewer provinces and territories (13) than the number of US states (50), a smaller population than the US (of roughly 11.5%), and fewer local labor markets or notable populated areas along its borders. One large urban area, Ottawa and Gatineau, between Ontario and Quebec, is the most notable example, whereas Lloydminster (roughly 30,000 in population) is likely the best example along the Alberta–Saskatchewan border.
, cannot be used for Canadian studies of the minimum wage, because Canada has fewer provinces and territories (13) than the number of US states (50), a smaller population than the US (of roughly 11.5%), and fewer local labor markets or notable populated areas along its borders. One large urban area, Ottawa and Gatineau, between Ontario and Quebec, is the most notable example, whereas Lloydminster (roughly 30,000 in population) is likely the best example along the Alberta–Saskatchewan border.
10
For the urban regions, our model mainly identifies Alberta employment for the $20.00 or more wage bin as the untreated unit with the largest posterior probability of appearing in the synthetic control regression. For the non-urban regions, our model identifies Saskatchewan employment for the $10.20 or less wage bin, the $12.20 to $13.60 wage bin, and the $20.00 or more wage bin, as well as Alberta employment for the $20.00 or more wage bin, as the untreated units with the largest posterior probabilities. See ![]() .
.
11
In using LFS economic regions rather than Census divisions, we offer a more aggregated approach than other previous local labor market analyses for Western Canada (Marchand 2012, 2015, ![]() ).
).
12
Four months (June, July, August, and September of 2016) of the data are missing employment observations due to the Fort McMurray wildfire in the Wood Buffalo and Cold Lake Economic Region. These observations are given imputed values by averaging from the May 2016 value of 9.5 to the October 2016 value of 9.1.
References
Supplementary Material
Please find the following supplemental material available below.
For Open Access articles published under a Creative Commons License, all supplemental material carries the same license as the article it is associated with.
For non-Open Access articles published, all supplemental material carries a non-exclusive license, and permission requests for re-use of supplemental material or any part of supplemental material shall be sent directly to the copyright owner as specified in the copyright notice associated with the article.