
Abstract
The authors present the first evidence on the consequences of the new statutory minimum wage in Germany, which was implemented on January 1, 2015. Using the IAB Establishment Panel, they identify employment effects from variation in the extent that establishments are affected by the minimum wage. A difference-in-differences estimation reveals an increase in average wages between 3.8% and 6.3% and an employment loss by approximately 1.7% in establishments affected by the minimum wage. These estimates imply a labor demand elasticity with respect to wages ranging between −0.2 and −0.4. The authors also observe a transitory reduction of the working hours in the first year after the introduction and that the employment effect seems mostly driven by a reduction in hires rather than by an increase in layoffs.
Internationally, minimum wages are on the rise. In the United States, local authorities have approved city-specific minimum wages in San Francisco, Los Angeles, and Seattle, as well as new state-specific minimum wages in California and New York that raise local minimum wages to $15 per hour. Additionally, in the United Kingdom, the former conservative chancellor George Osborne announced the introduction of a new National Living Wage, which is an increase of the national minimum hourly wage from £6.50 to £9 by 2020 for all employees age 25 and above (BBC 2015).
We analyze the employment effects of the new German minimum wage, which was introduced on January 1, 2015, and initially required an hourly wage of at least €8.50. This new statutory minimum wage is the first statutory minimum wage in Germany, where only a few sector-specific minimum wages have previously existed. Traditionally, employers’ associations and unions collectively bargained over wages in their respective sectors. After collective bargaining coverage steadily decreased over the last two decades and wage inequality increased, the Grand Coalition agreed to introduce a new minimum wage. The new minimum wage is certainly the most important labor market legislation in Germany since the Hartz reforms in the early 2000s, which fully reformed the unemployment insurance. Therefore, there is a high degree of political and public interest in the minimum wage, and there is a need for a careful independent evaluation of the policy reform. We propose to fill the gap with this study.
Concerning the new German minimum wage, disemployment effects are likely for several reasons. The minimum wage legislation is very comprehensive, as it allows only a small number of existing sectoral minimum wages to undercut the minimum wage until the end of 2016. There are also few exemptions 1 on the employees’ side, allowing little scope for evasion strategies. 2 Additionally, a large fraction of employers are affected by the minimum wage both in terms of the extensive margin (incidence of affected establishments) and the intensive margin (the fraction of employees within affected establishments who are below the minimum) (Bellmann, Bossler, Gerner, and Hübler 2015).
We use the IAB Establishment Panel, a large-scale establishment-level panel data set that is managed by the Institute for Employment Research (IAB) that allows employment effects to be detected even if they are small. Using this data, we provide the first causal evidence of the effects of the new minimum wage in Germany. Other complementary studies have used regionally aggregated data to estimate the effects of the minimum wage on employment (Caliendo et al. 2018; Garloff 2019). Whereas Caliendo et al. (2018) quantified the disemployment effect of the law to be approximately 140,000 jobs, Garloff (2019) observed an effect between zero and 40,000 jobs. In contrast to these studies, we are able to identify employment effects even if they occur within regions, that is, when highly affected plants located in high-wage regions have to reduce employment. Moreover, we can relate our employment effect to minimum-wage-induced wage effects to calculate a labor demand elasticity, and we are able to analyze other establishment-level outcomes, such as contracted working hours and establishment closures.
We use a difference-in-differences strategy, with the treatment group defined as establishments that had at least one employee paid below the new minimum wage in 2014 before the minimum wage took effect and the control group defined as those establishments that paid wages above the new minimum wage in 2014. Card and Krueger also used this strategy in their well-known New Jersey minimum wage study in which they not only compared firms in New Jersey and Pennsylvania but also compared across low- and high-wage firms within New Jersey (Card and Krueger 1994). There are advantages and disadvantages with our strategy. An advantage is that we are able to utilize detailed data on establishment-level outcomes and cleanly discern treatment status. A disadvantage is that we cannot clearly identify wage and employment effects that exclude spillover effects. We address the concern of spillovers, however, with data that were especially collected for these purposes.
Minimum wages can cause wage spillovers by increasing the wages of workers with an hourly wage already above the required minimum of €8.50. Positive spillovers are mostly explained by the employees’ demand to preserve the existing wage-productivity differentials (Aretz, Arntz, and Gregory 2013; Dittrich, Knabe, and Leipold 2014). Our data allow us to differentiate between establishments that increased the wages of workers whose initial wages were already above €8.50 per hour and establishments that cut extra payments. We can exclude establishments with such spillovers from the control group to construct a counterfactual that is more likely unaffected by wage spillovers.
Finally, minimum wages can cause reallocation across establishments to the extent that employment moves from low- to high-wage establishments. In this case, we would be overstating the disemployment effects by comparing across firms, even though the underlying overall effects on employment may be zero. Our data include a self-reported question on such indirect channels of the minimum wage, which allows us to exclude the respective firms from the control group.
Literature Review Concerning Minimum Wages in Germany
Before the 2015 introduction of the new statutory minimum wage in Germany, minimum wages existed in specific sectors only. 3 Such sector-specific minimum wages have been introduced, for example, in the construction sector, for electricians, roofers, and painters. A number of projects evaluated these minimum wages: König and Möller (2009) were the first to analyze the employment effects in the construction sector. Comparing treated and untreated workers of the same sector, they observed sizable effects on wages but only slightly negative effects on the employment retention in eastern Germany. Berge and Frings (2019) revisited the construction sector, exploiting regional variation for the empirical identification and largely corroborating the results of König and Möller (2009).
Frings (2013) studied minimum wages for painters and electricians but compared treated firms with firms of unrelated control sectors that developed similarly with respect to the parallel trends assumption. The results showed no effects on full-time employment in either of the two minimum wage sectors. Boockmann, Krumm, Neumann, and Rattenhuber (2013) also studied the minimum wage for electricians, which was introduced in 1997, abolished in 2003, and reintroduced in 2007, providing extensive variation over time. Although the minimum wage effect on wages was consistent and positive across these events, they did not detect any employment effects.
Finally, Aretz et al. (2013) analyzed the minimum wage introduction in the roofing sector. Although the effect on employment in western Germany was barely significant, they presented quite sizeable disemployment effects in eastern Germany. Similar to the conclusions reached in the studies on the construction sector, they devoted this regional heterogeneity to the emphasized bite 4 of the minimum wage in eastern Germany. Hence, this regional distinction seems an important heterogeneity that we address later in our empirical estimations concerning the new statutory minimum wage.
A potential criticism of the sector-specific minimum wage literature is the endogeneity of the decisions to introduce such minimum wages. Because sector-specific minimum wages need approval from employer associations, it is likely that these minimum wage introductions were to some extent endogenous for protective reasons (Bachmann, Bauer, and Frings 2014). Moreover, it is likely that at least one of the decisive groups (unions, employer associations, or the federal ministry) would have opposed the respective sector-specific minimum wages if negative effects were foreseeable. By contrast, the introduction of the new statutory minimum wage, which we analyze here, was grounded purely on political arguments without the consent from employer associations. Moreover, the economic development was not foreseeable when the minimum wage introduction was decided in the course of the general election at the end of 2013.
Data
The data set of our empirical analysis is the IAB Establishment Panel, a large annual survey on firm policies and personnel developments in Germany. The IAB Establishment Panel comprises approximately 15,000 establishment observations. The survey’s gross population comprises all establishments located in Germany with at least one regular employee that is subject to compulsory social security contributions. The sample selection is representative of different industries, German states (“Bundesländer”), and establishment size categories. The interviews are conducted face-to-face by professional interviewers, ensuring a high data quality and a yearly continuation response rate of 83%. In a comprehensive comparison of plants participating in the survey with the full administrative population, Bossler, Geis, and Stegmaier (2018) demonstrated that the survey sample was not selective in observable characteristics. More comprehensive data descriptions of the IAB Establishment Panel can be found in Fischer, Janik, Müller, and Schmucker (2009) and Ellguth, Kohaut, and Möller (2014).
To analyze the effects of the minimum wage introduction, we included an additional module of questions with the 2014 and 2015 waves of the IAB Establishment Panel. In 2014, the year before the minimum wage came into effect, we included questions that collected information on the bite of the minimum wage. The survey covers information on the extensive bite by asking whether the respective establishment has at least one employee with an hourly wage below €8.50. Further, it includes information on the number of currently (in 2014) affected employees with an hourly wage below €8.50, which we use to construct a fraction of the affected employees. We refer to this fraction as the intensive margin bite or the intensive treatment. Furthermore, the 2014 questionnaire includes a question asking whether wages were already adjusted in anticipation of the minimum wage introduction within the last 12 months, which is the time horizon of the public debate on the minimum wage introduction. We use this latter information to refine the definition of the treatment and control groups as described in the next section.
A unique identifier allows tracking establishments over time if the respective establishments continue to participate in the survey. This detail allows us to track the outcome variables back and forth while using the 2014 bite of the minimum wage to distinguish between treated and control establishments. This yields an unbalanced panel of establishments that existed and participated in the 2014 survey. 5
Treatment Assignment
We distinguish between a treatment group that comprises establishments affected by the minimum wage and an unaffected control group. We define the group of treated establishments in two alternative ways. First, we define them based on the extensive margin bite, including in the treatment group all establishments with at least one employee with an hourly wage below €8.50 in 2014. Second, we define the treated establishments based on the intensive margin bite, including establishments by their fraction of employees with an hourly wage below €8.50 in 2014. This latter definition yields the same treatment and control groups but weights the treated establishments by the fraction of affected employees.
Establishments that adjusted wages in anticipation of the minimum wage introduction present a major issue for the exact differentiation between treated and control establishments. If an employer adjusted wages before the 2014 survey information was collected, the fraction of affected employees is already contaminated, and the true bite is not revealed. To construct internally valid and sharp treatment and control groups, we exclude these establishments from the analysis sample. Because this concerns approximately 9% of the sample, we rerun our baseline regression by adding a separate treatment effect for these anticipating establishments in Online Appendix A, which does not affect our conclusions. 6
Another major issue for defining treatment and control groups is the establishment-level exemption from the minimum wage, which allows existing sectoral minimum wages and collective bargaining agreements to undercut the minimum wage until the end of 2016. In the IAB Establishment Panel 2015, employers are asked directly whether this exemption applies to their respective establishment, and we exclude these plants from the treatment group. Only 0.5% of the establishments, however, report that this exemption applies.
The final and probably most critical concern for the definition of an unaffected control group is the spillover effects that can occur along the wage distribution if wages above the direct domain of the minimum wage are adjusted, or across establishments if establishments are indirectly affected due to changing conditions of the product or the labor market. The survey includes questions on both sources of spillovers, allowing us to estimate effects using a refined control group that excludes these kinds of spillovers in a major robustness check.
Table 1 shows descriptive figures from the analysis sample as of 2014, which is prior to the minimum wage introduction when the treatment is assigned to establishments. We observe 13,453 establishments in our sample, of which 1,599 (11.9%) are affected by the minimum wage (column (2)). The remaining 11,854 establishments are control establishments in the baseline sample (column (3)). 7 The average establishment size shows a median employment of 17 employees in the control establishments and 16 employees in the treated establishments. The mean establishment size indicates a few positive outliers in the control group, which are not influential toward our results. Using projection weights, the sample represents 1.9 million establishments and 32.5 million employees in Germany. Most important, as we estimate treatment effects on the treated establishments, the treatment group represents 180,000 establishments and 3.1 million employees. The treatment measure shows that in total, 4.4% of all employees earned an hourly wage below €8.50 in 2014 and that a relatively large fraction (37.8%) of employees within the treated establishments were affected by the new minimum wage. Moreover, the outcome variables of interest, that is, logarithmic (henceforth: log) wages and log employment, are on average lower in the treatment group than in the control group.
Analysis Sample Description
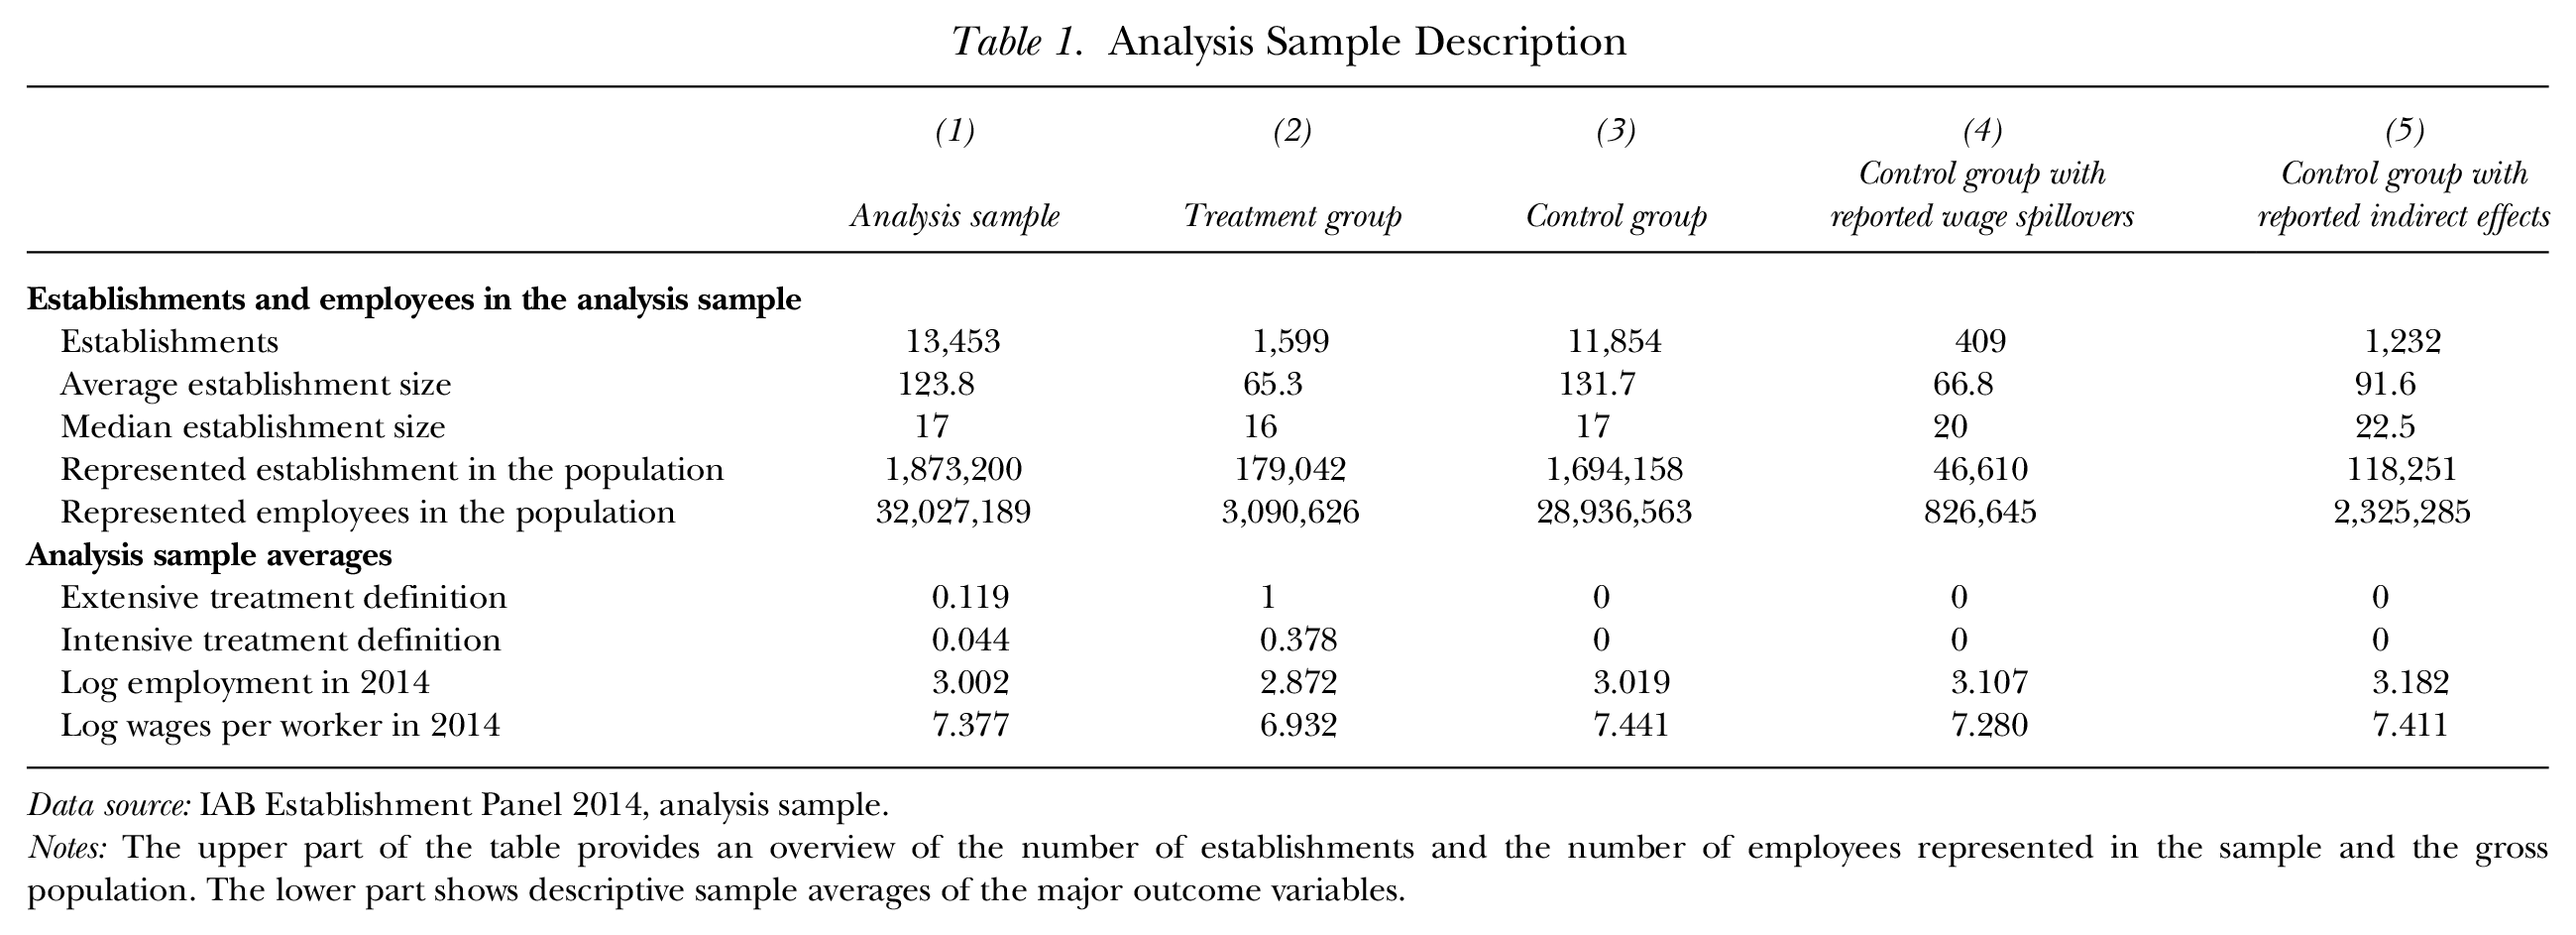
Data source: IAB Establishment Panel 2014, analysis sample.
Notes: The upper part of the table provides an overview of the number of establishments and the number of employees represented in the sample and the gross population. The lower part shows descriptive sample averages of the major outcome variables.
Finally, Table 1 presents the subgroups of the control establishments that are excluded in the robustness checks, as these are indirectly affected by the minimum wage. Column (4) describes establishments that reported having conducted wage spillovers (wage increases, wage cuts, or cuts of extra payments) and column (5) describes establishments that reported being affected indirectly by the labor market or by output markets.
Graphical Analysis
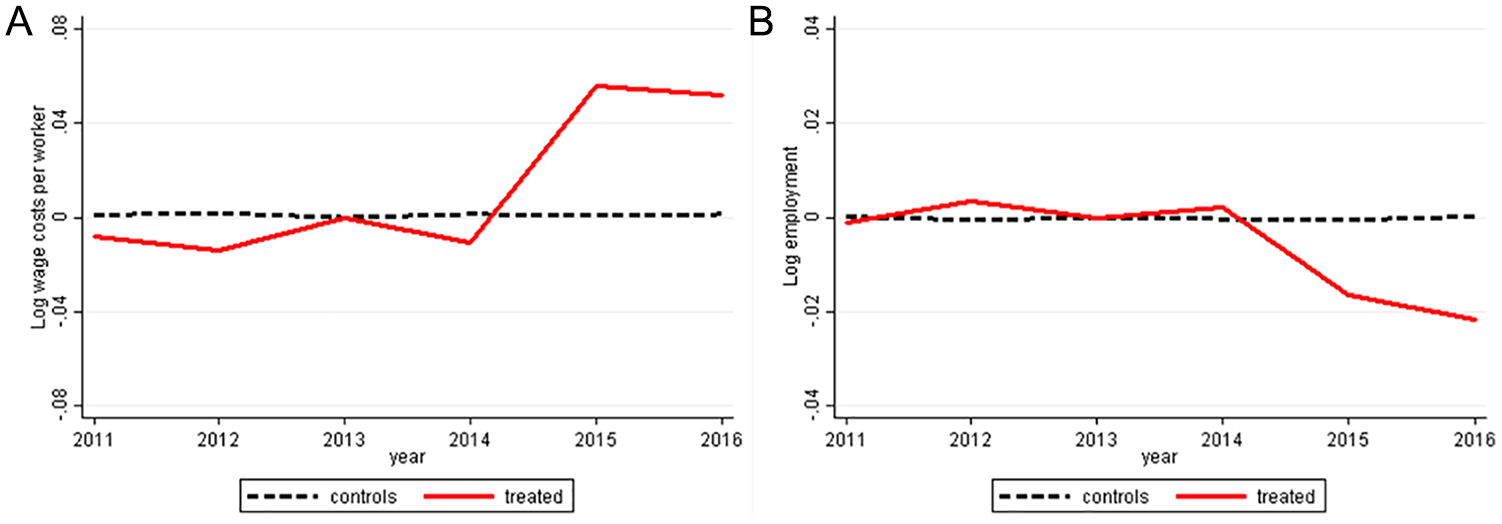
Before presenting our econometric analysis, we illustrate the time series of average wages and employment by treatment status. This rather descriptive graphical analysis allows for a first visual inspection of potential treatment effects, and more important, it allows an inspection of the parallel trends assumption, which is crucial for difference-in-differences analyses.
Figure 1 displays the time series of the two outcome variables. We center the time series on the respective groups’ 2013 values, which is before the minimum wage introduction was announced, making anticipation effects unlikely (Bossler 2017). The lines in panel A show that the log wages per worker evolve somewhat weaker in treated establishments than they do in the control group ahead of the minimum wage intervention in 2015 but also after the intervention in 2016. We address this difference in trends right after presenting the baseline estimates. Nevertheless, the treatment and the control groups’ average wages are on a positive trend, reflecting increasing nominal wages. In 2015, wages rise at the treated establishments, indicating that the minimum wage effectively increased wages per worker. Panel B displays log employment for the treatment and the control group. Both groups of establishments are on similar employment trends ahead of the minimum wage introduction. In 2015, treated establishments show a small negative deviation from the trend, which evolves in 2016, suggesting a small negative employment effect.
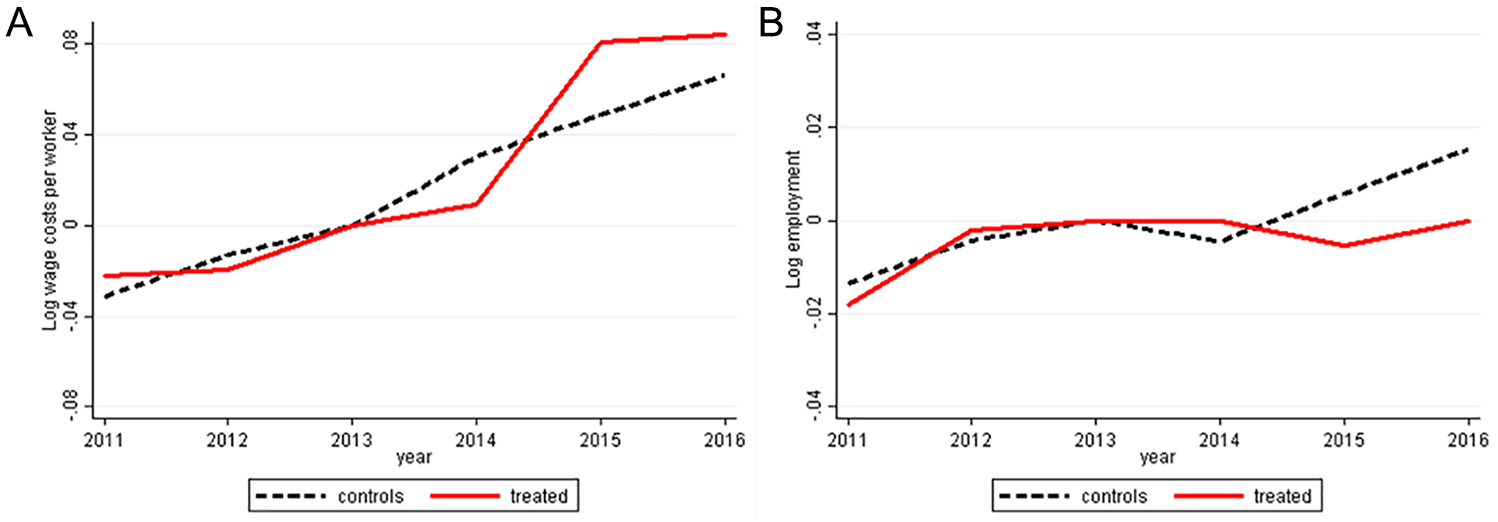
Wage and Employment Time Series by Treatment Status
Econometric Analysis
In the econometric analysis, we estimate reduced form treatment effects of the minimum wage introduction on average wages and employment. Furthermore, we are interested in the labor demand elasticity of a minimum wage–induced wage increase. We uncover this elasticity by estimating instrumental variable (IV) regressions in which the minimum wage effect on log wages per worker serves as the first-stage regression. Note that the size of this derived labor demand elasticity should not be compared with direct policy elasticities that relate employment changes to percentage changes of the minimum wage. These direct elasticities are typically much smaller in the very same setting simply because a change of the minimum wage does not necessarily result in an equivalent one-to-one change in wages (Harasztosi and Lindner 2019).
We start with estimating the reduced form effect on the log wages per worker, that is, the first-stage regression, using the difference-in-differences specification

where
In a second step, we estimate the same reduced form difference-in-differences specification on log employment as the outcome variable of interest:

where
To estimate an implied labor demand elasticity, we want to identify the effect of

Wages and Employment
Table 2 displays the baseline results, including the effects on wages and employment, as well as the elasticity estimates. Panel A presents the effects from the extensive margin treatment assignment, where the minimum wage effect on wages per worker at treated establishments is approximately 3.8%. This finding demonstrates that the minimum wage introduction was binding. The treatment effect on employment is −0.017 log points, implying an employment reduction of approximately 1.7% at treated establishments. A closer inspection of the data as well as the graphical analysis shows that the negative treatment effect is driven by the fact that control establishments increased employment by approximately 1.7%, whereas the treated establishments held their employment merely constant. The regression-based placebo estimates, for which the treatment period is artificially assigned to 2014, are small. Although the placebo is slightly negative when we look at wages, this can reflect a weaker time trend, which we address in a robustness check by adding treatment-group-specific trends. The elasticity estimate in column (3) is about −0.4 and implies that a 1% wage increase due to the minimum wage causes an employment reduction by approximately 0.4%. 9
Wage Effects, Employment Effects, and Employment Elasticities
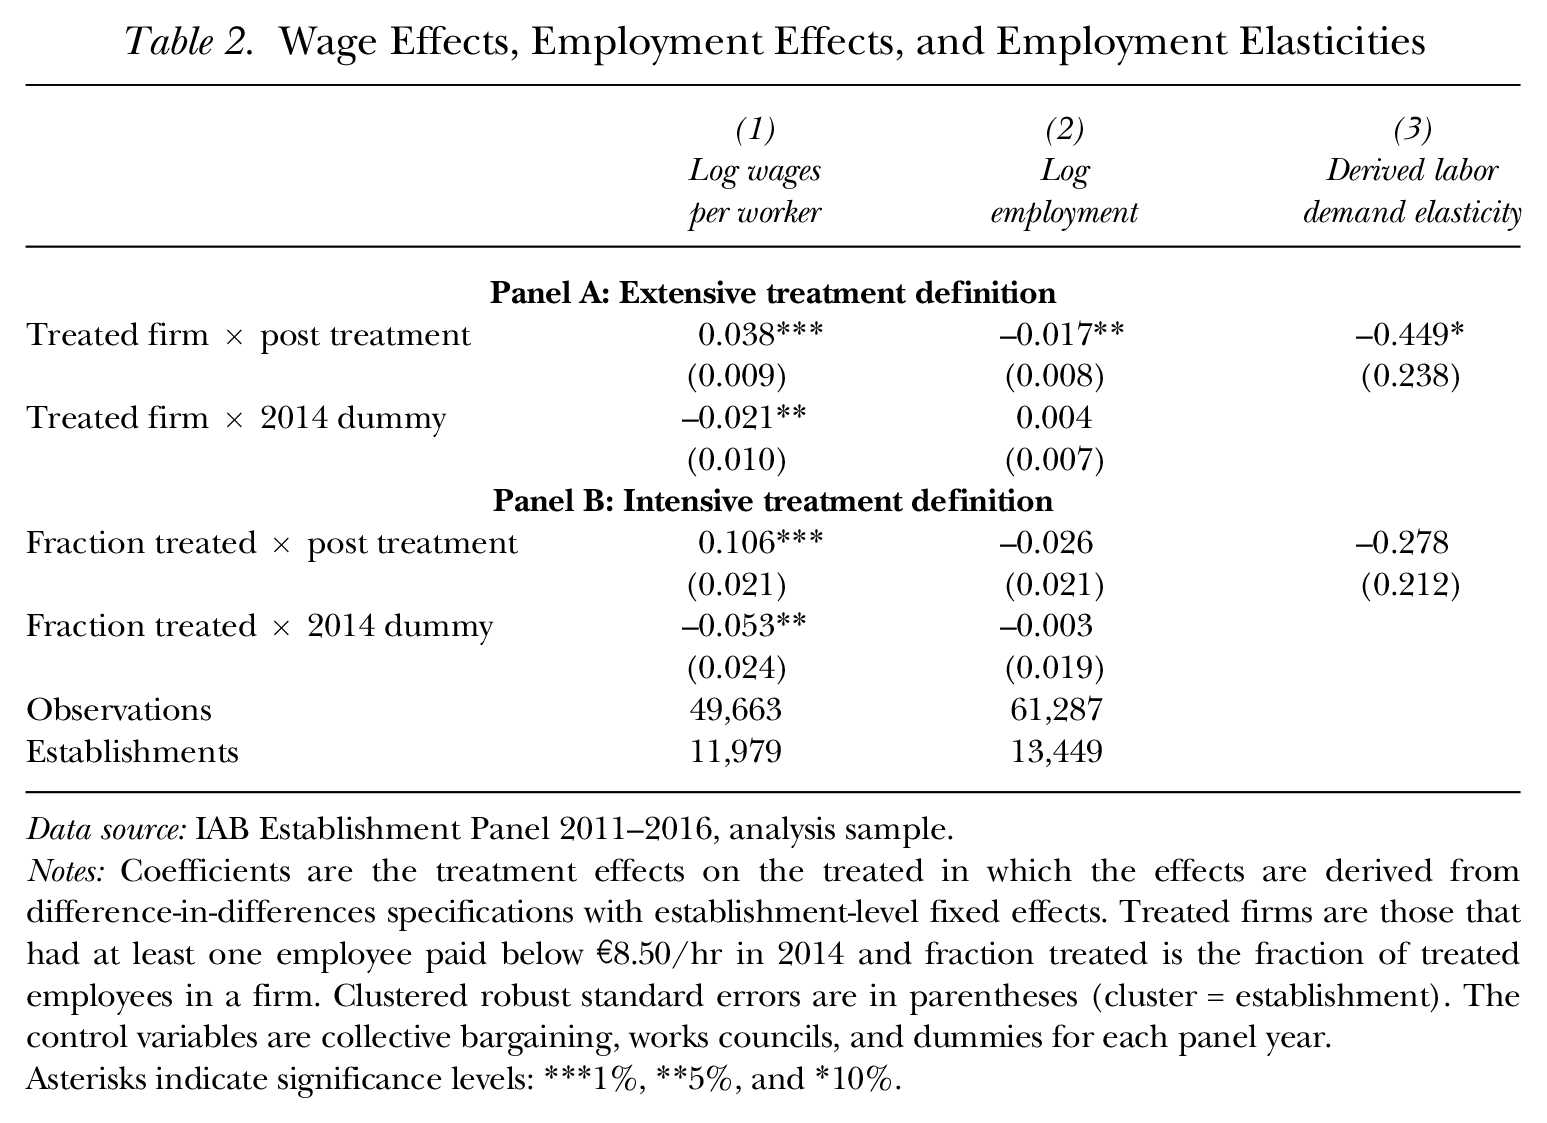
Data source: IAB Establishment Panel 2011–2016, analysis sample.
Notes: Coefficients are the treatment effects on the treated in which the effects are derived from difference-in-differences specifications with establishment-level fixed effects. Treated firms are those that had at least one employee paid below €8.50/hr in 2014 and fraction treated is the fraction of treated employees in a firm. Clustered robust standard errors are in parentheses (cluster = establishment). The control variables are collective bargaining, works councils, and dummies for each panel year.
Asterisks indicate significance levels: ***1%, **5%, and *10%.
The results in panel B of Table 2 are treatment effects on a group defined by the intensity of the bite, that is, the fraction of affected employees within the treated plants. Given that the fraction of affected employees within the treated plants is approximately 0.37, the treatment variable is roughly one-third of the dummy treatment, and hence the effects should be about three times the effect size of panel A. The treatment effect on wages per worker is 10.5% and on employment –2.6% but insignificantly different from zero. Both regression-based placebo tests, which estimate an effect for 2014 when the minimum wage was not yet introduced, are small. The labor demand elasticity with respect to the minimum wage-induced wage increase is about −0.3.
The insignificance of the effect of the treated fraction may be attributable to a nonlinearity of the treatment effect. To detect potential nonlinearities, Table 3 displays treatment effects for five separate treatment intensities, in which the slightly treated plants employ only 1 to 20% treated workers and at the most severely treated plants, more than 80% of the workers were initially paid below the minimum wage threshold. Concerning the effect on wages (column (1)), we observe a significant positive effect for the three groups of the most severely treated plants, that is, all plants of which more than 40% of the workers are treated. Even though the employment effect also seems to increase by treatment intensity, the most severely affected establishments, in which 81 to 100% of the employees are treated, do not show a negative employment effect. This nonlinearity in the employment effect also explains the large variation of the intensity treatment of Table 2 and why it fails to detect significant disemployment effects in panel B.
Varying Treatment Intensities and Establishment Closure
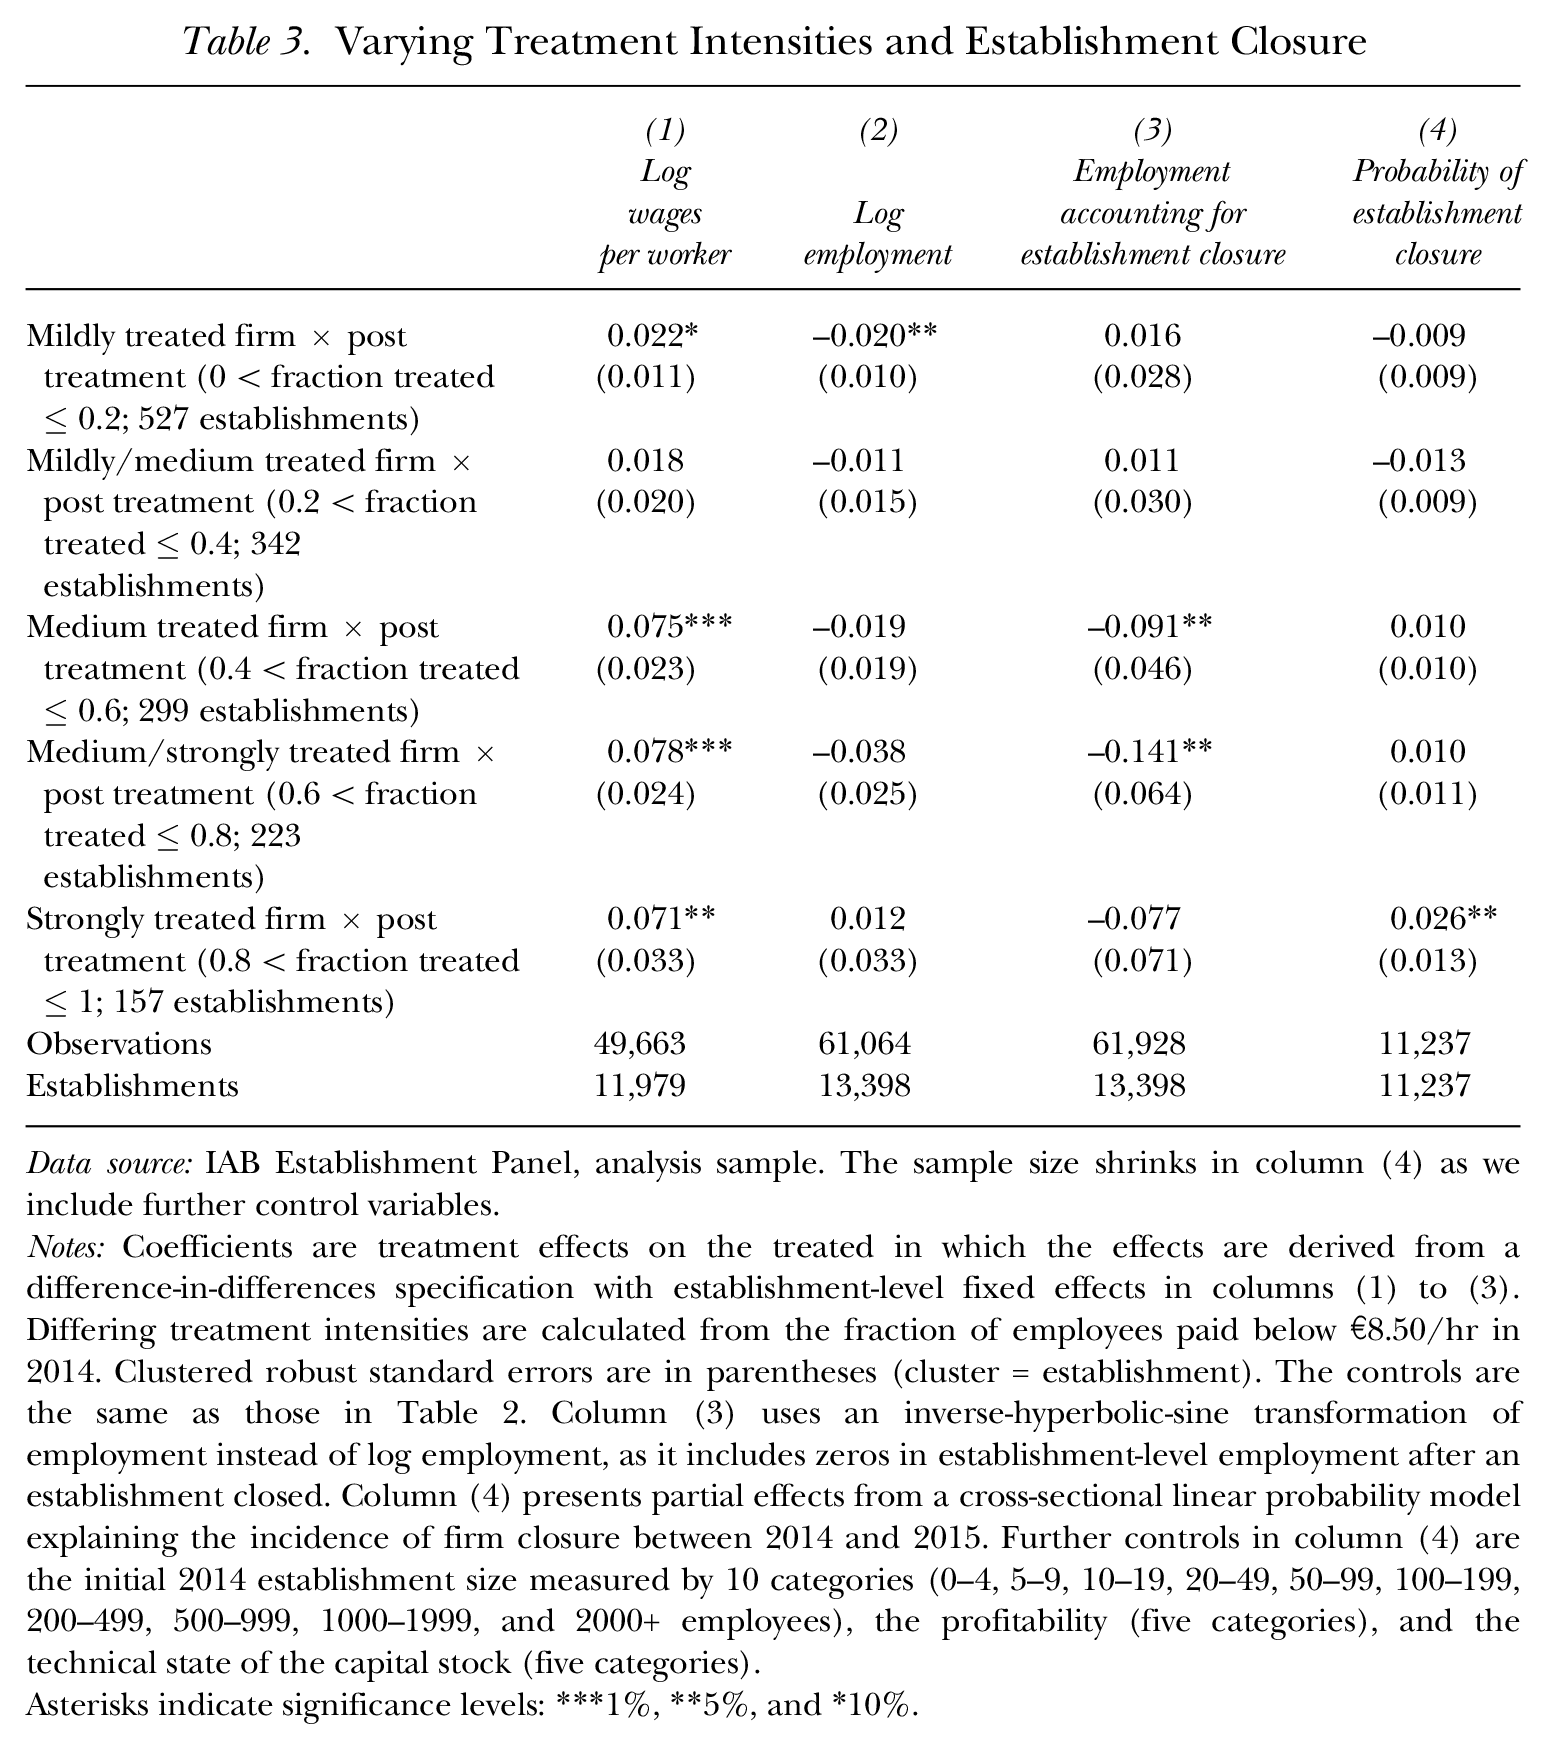
Data source: IAB Establishment Panel, analysis sample. The sample size shrinks in column (4) as we include further control variables.
Notes: Coefficients are treatment effects on the treated in which the effects are derived from a difference-in-differences specification with establishment-level fixed effects in columns (1) to (3). Differing treatment intensities are calculated from the fraction of employees paid below €8.50/hr in 2014. Clustered robust standard errors are in parentheses (cluster = establishment). The controls are the same as those in Table 2. Column (3) uses an inverse-hyperbolic-sine transformation of employment instead of log employment, as it includes zeros in establishment-level employment after an establishment closed. Column (4) presents partial effects from a cross-sectional linear probability model explaining the incidence of firm closure between 2014 and 2015. Further controls in column (4) are the initial 2014 establishment size measured by 10 categories (0–4, 5–9, 10–19, 20–49, 50–99, 100–199, 200–499, 500–999, 1000–1999, and 2000+ employees), the profitability (five categories), and the technical state of the capital stock (five categories).
Asterisks indicate significance levels: ***1%, **5%, and *10%.
At first glance, this result may seem odd. Why did the most severely affected plants not adjust employment? A closer inspection of the data allows us to provide an intuitive explanation that this may be attributable to higher rates of establishment closure. Whereas the survey itself includes only information on surviving establishments, the surveying institute TNS Infratest Sozialforschung collected some basic information on the reasons for survey nonresponse in 2015. We use this information to distinguish plant closures from panel continuation and other sources of nonresponse and insert zero plant-level employment for closing establishments. Note that the logarithm of zero is not defined, and hence we use the inverse-hyperbolic-sine transformation in column (3) of Table 3. Although this transformation closely resembles the logarithmic transformation, coefficients should not be interpreted as percentage effects. 10 Nevertheless, the respective coefficients shrink for the only slightly treated plants and increase for the most severely treated group of establishments. The effect of this latter group is still not statistically significant, but the estimated coefficients follow the wage effect of column (1) more closely, and hence indicate disemployment effects whenever wage effects are particularly emphasized.
We additionally explain the probability of closure in a separate regression, again using our sample of plants that existed in 2014. Given that we do not observe closures among these plants pretreatment, that is, until 2014, we are limited to a cross-sectional regression in column (4) of Table 3. To increase comparability, we add controls for the initial establishment size, the initial profitability, and the initial technological state of the capital stock to increase comparability. The estimates point to an increased likelihood of closure among the most severely treated plants only. This result again suggests that closures could be a channel that explains the absence of employment effects among the respective group of surviving plants in column (2).
Typical Contracted Working Hours
In addition to examining changes in wages and employment, we analyze hours of work as an additional adjustment channel. Theoretically, hours of work might fall because of work sharing (Couch and Wittenburg 2001), which implies that a reduced volume of work is shared among the workforce affected by the minimum wage. Similar to the work-sharing argument, the manipulation of hours of work could be a channel of noncompliance. This is the case if working hours are reduced to increase hourly wages, while unpaid overtime may be used in compensation. Unfortunately, we cannot identify unpaid overtime hours in our data. Therefore, we cannot distinguish between the two suggested channels of a working hours reduction.
The empirical evidence of a working hours effect is divided, as is the literature on employment effects. For the seminal case study comparison of the New Jersey and Pennsylvania minimum wages, Michl (2000) argued that a negative working hours adjustment could be an explanation for diverging employment effects. Moreover, Neumark, Schweitzer, and Wascher (2004), as well as Couch and Wittenburg (2001), found a negative hours adjustment from the US state-level data. At the same time, Zavodny (2000) did not find effects from the microdata of teens. For the UK minimum wage, Stewart and Swaffield (2008) detected a negative effect on hours of low-wage workers, while Connolly and Gregory (2002) did not find a negative change for female workers who are usually subject to frequent working hours’ adjustments.
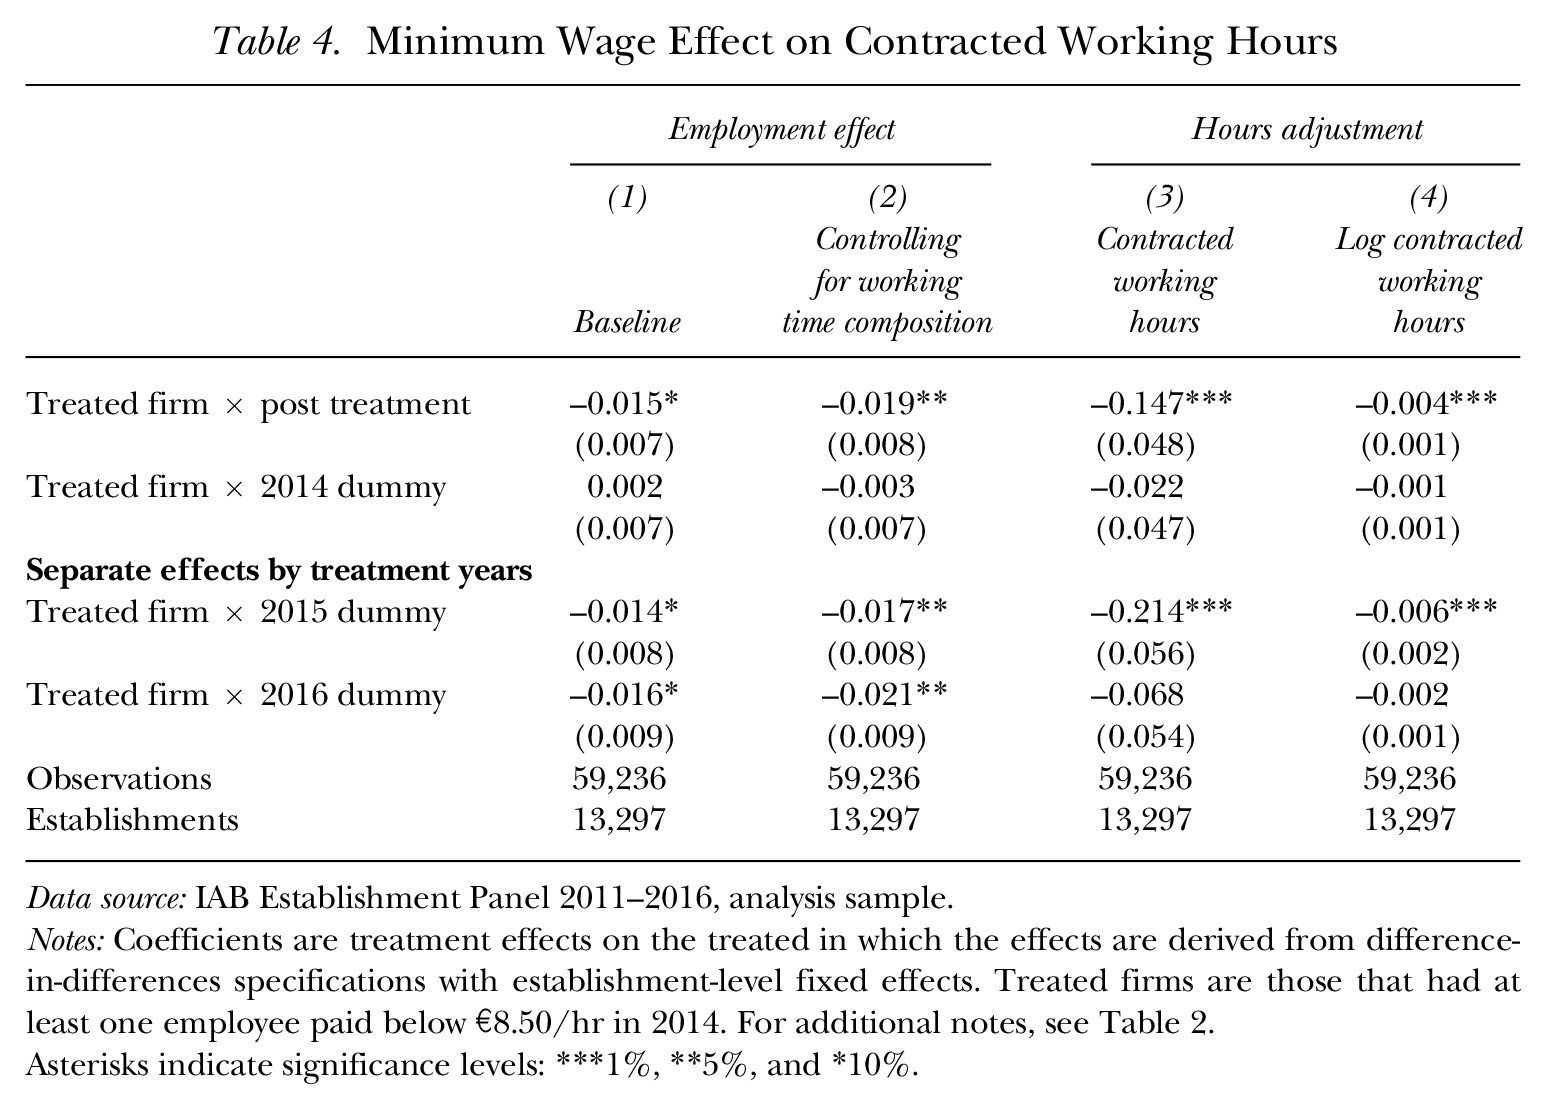
In Table 4, we first replicate the baseline employment effect, using a slightly reduced sample for which we have information on the typical contracted working hours included in the IAB Establishment Panel. Additional to the results in Table 2, we present separate treatment effects for 2015 and 2016, which show that the employment effect slightly increases over time. When we control for the composition of part-time and full-time employment, the employment effect identifies a change in firm-level employment when the composition is held constant. The result of this exercise shows a slightly larger disemployment effect in column (2), suggesting a supplementary minimum wage effect on working time.
Minimum Wage Effect on Contracted Working Hours
Data source: IAB Establishment Panel 2011–2016, analysis sample.
Notes: Coefficients are treatment effects on the treated in which the effects are derived from difference-in-differences specifications with establishment-level fixed effects. Treated firms are those that had at least one employee paid below €8.50/hr in 2014. For additional notes, see Table 2.
Asterisks indicate significance levels: ***1%, **5%, and *10%.
Looking at typically contracted working hours, the estimates in columns (3) and (4) of Table 4 show a reduction at the establishment level by 0.15 hours per week, which corresponds to a 0.4% decrease in typical contracted working hours. This effect is much larger in 2015 compared with 2016. Whereas the weekly working hours decreased by 0.22 hours in 2015, this treatment effect reduced to −0.06 hours in 2016. The transitory characteristic of the treatment effect mirrors the increasing disemployment effect, suggesting that firms adjusted hours more easily in the short run. However, this effect on hours is shifted to a slightly larger employment adjustment after two years.
Employment Turnover
Whereas the early literature on minimum wages focused exclusively on changes in employment levels, recently the analysis of labor flows has become more prominent. Most of the literature shows that minimum wages reduce turnover: Looking at Portuguese data, Portugal and Cardoso (2006) analyzed the short-run effects of a sharp minimum wage increase and found evidence for reduced hires and reduced separations. Comparing provinces in Canada, Brochu and Green (2013) also showed that minimum wages cause decreased hiring and separation rates resulting in reduced labor turnover. In line with these results, Dube, Lester, and Reich (2016), as well as Gittings and Schmutte (2016), showed a robust reduction in labor flows following minimum wage increases in the United States.
Although treatment effects on hires and layoffs are inconclusive because of the large variation and specific data limitations, 11 the data allow us to use some additional descriptive information that we collected in the 2015 wave of the IAB Establishment Panel. In the survey, employers were asked about adjustment measures in response to the minimum wage. Two of these measures capture employment adjustments directly: Employers were asked if the minimum wage caused them to be more cautious when making hiring decisions and if it caused them to lay off workers. The survey allows for three outcome categories: 1) carried out, 2) intended, and 3) not relevant. We included the second category to capture socially desirable responses of employers who dislike the minimum wage but have not yet adjusted employment. Of course, these responses do not allow for causal conclusions, but we use them to assess the relative importance of the two adjustment channels.
The descriptive averages are displayed in Table 5. Approximately 10.1% of the affected employers report that they have been cautious in hiring new workers, and 4.4% report that they have laid off workers. The relative importance of these two adjustment channels suggests that hires are the dominant channel for employment adjustments. From a theoretical perspective, the dominance of the hiring channel seems very plausible. Because layoffs are associated with substantial costs, cautious hiring decisions should be preferred by most employers, especially in Germany, which is attested by the relatively protective labor legislation in the country.
Reported Adjustment Channels Concerning Hires and Layoffs
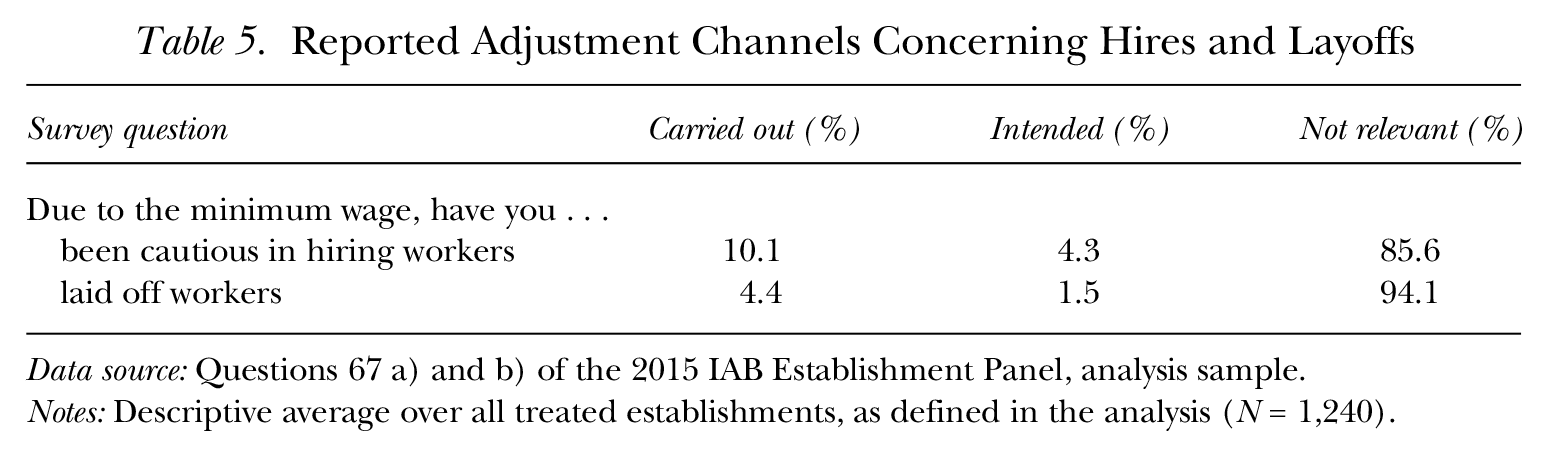
Data source: Questions 67 a) and b) of the 2015 IAB Establishment Panel, analysis sample.
Notes: Descriptive average over all treated establishments, as defined in the analysis (N = 1,240).
Robustness Checks and Heterogeneities
Modeling Treatment-Specific Trends
We first test the robustness of the employment effect by controlling for an additional treatment group and time-specific heterogeneity. Following Allegretto, Dube, and Reich (2011), Neumark, Salas, and Wascher (2014), and Addison, Blackburn, and Cotti (2015), we include a treatment-group-specific time trend (

As illustrated in Figure 2, the trend-adjusted time series yield fairly parallel trends ahead of the minimum wage introduction for log wages in panel A and for log employment in panel B. In Table 6, we control for a treatment-group-specific trend in the regression specification. As suggested by the graphs, the regression-based placebo tests yield small and insignificant estimates, supporting the validity of this identification strategy. The treatment effect on average wages increases to approximately 6.3% at treated establishments. When we consider log employment, the effect is robust and yields an influence on treated establishment’s employment of approximately 2.2%. The labor demand elasticity implied by these reduced form treatment effects is about −0.35. 12
Trend-Adjusted Time Series by Treatment Status
Minimum Wage Effects Controlling for Treatment-Group-Specific Trends
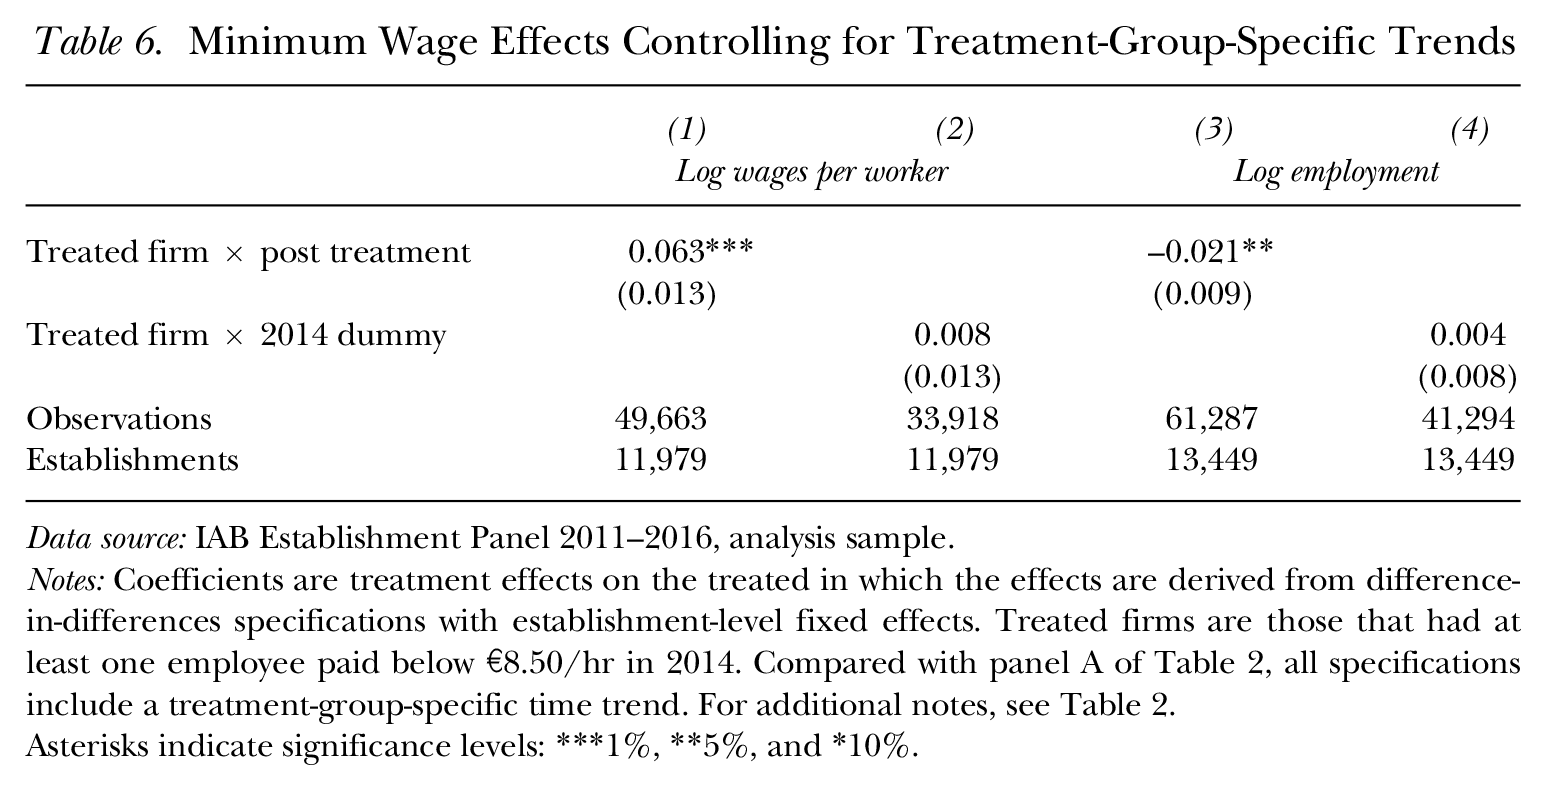
Data source: IAB Establishment Panel 2011–2016, analysis sample.
Notes: Coefficients are treatment effects on the treated in which the effects are derived from difference-in-differences specifications with establishment-level fixed effects. Treated firms are those that had at least one employee paid below €8.50/hr in 2014. Compared with panel A of Table 2, all specifications include a treatment-group-specific time trend. For additional notes, see Table 2.
Asterisks indicate significance levels: ***1%, **5%, and *10%.
Effect of Heterogeneities for Eastern and Western Germany
In the literature on sectoral minimum wages in Germany, most studies find somewhat larger employment effects in eastern Germany (Aretz et al. 2013; Berge and Frings 2019). These studies attribute the relatively larger effects in the East to a larger bite of the respective minimum wages. Two dimensions of a larger bite in the East are possible. First, more establishments may be affected by the minimum wage. Second, treated establishments in the East may show a stronger wage effect. To check for the first dimension, Figure 3 illustrates the bite across German states. Panel A shows that the number of treated establishments is relatively larger in the East than in the West. However, the treatment intensity among affected establishments, which is illustrated in panel B, shows only a modest difference between the East and the West. From this second map, it is not a priori clear that the wage effect on the treated establishments is larger in the East.
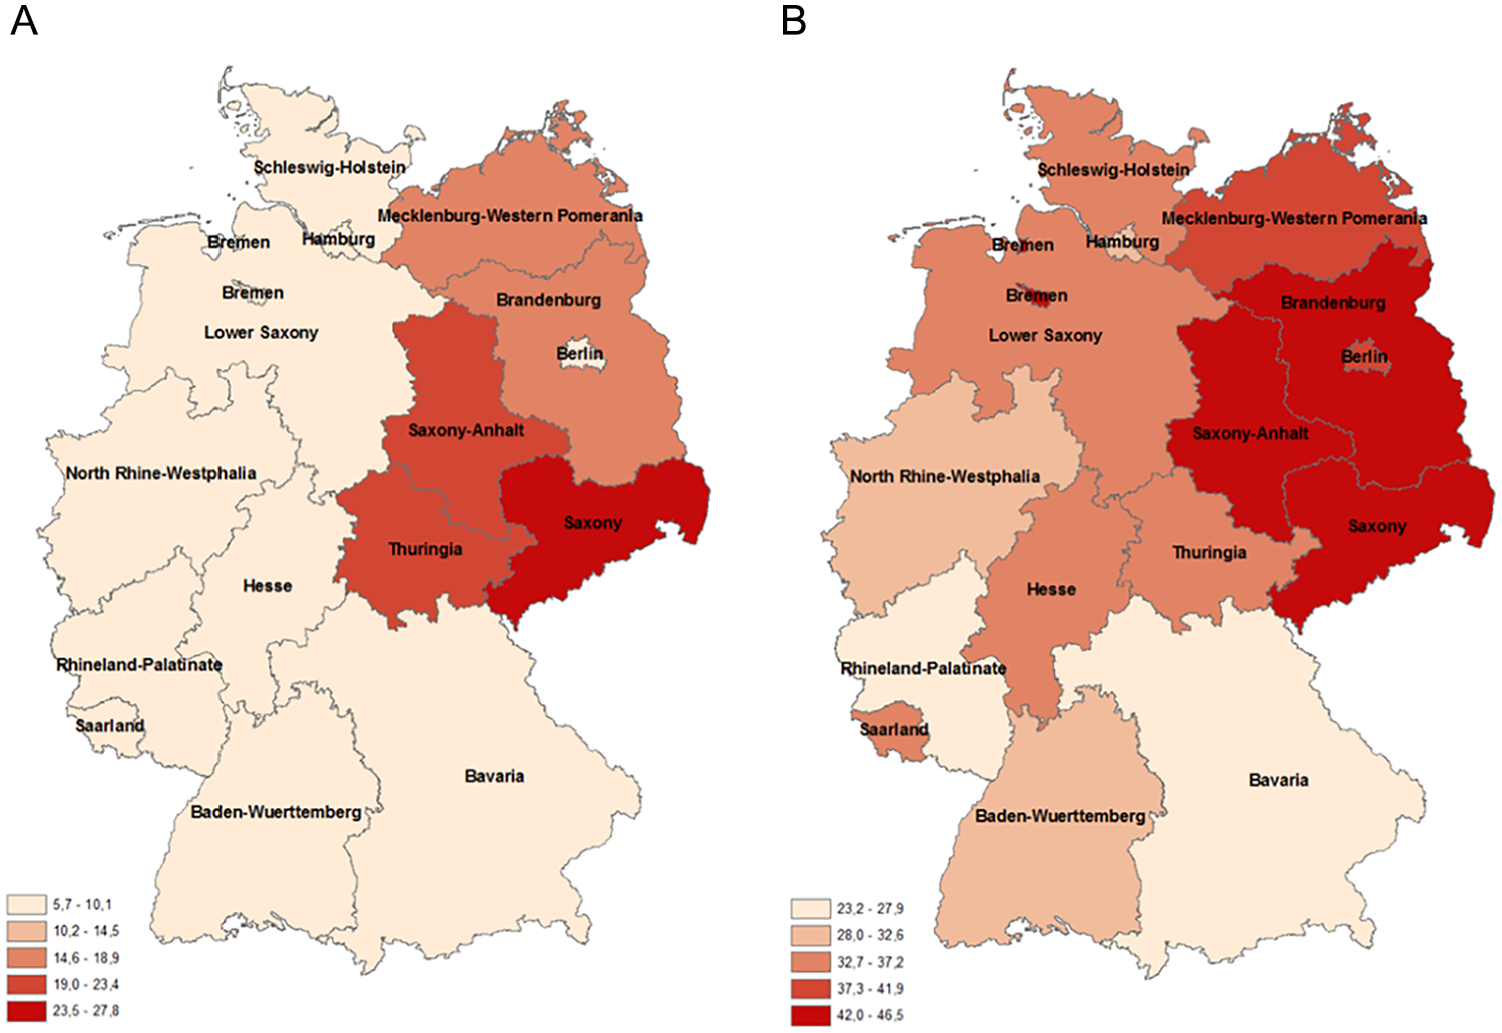
Bite of the Minimum Wage across Germany
We estimate heterogeneities for eastern and western Germany by adding the respective treatment effect interaction to our difference-in-differences specification:
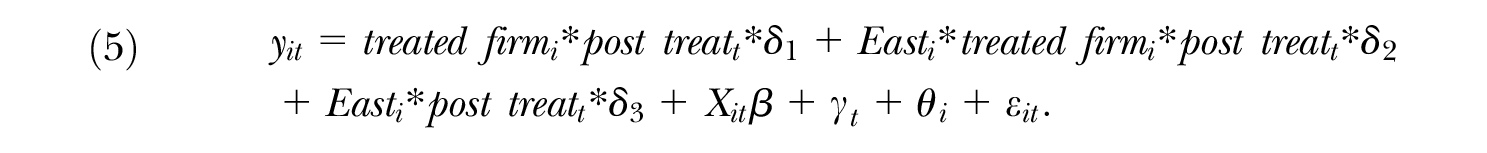
We calculate the treatment effects from linear combinations of the interaction effects, that is,
To check whether a stronger wage effect helps to explain stronger employment effects in the East, we estimate treatment effect heterogeneities not only on employment but also on wages. The results in Table 7 display a wage effect of 5.6 log points in the East and 2.3 log points in the West. Based on this larger minimum wage–induced wage increase, we expect a somewhat larger employment effect in the East. In line with this prediction, Table 7 shows that the employment effect in eastern Germany is negative and 2.6 log points in size, whereas the effect in the West is virtually zero. The wage and the employment effect differences between eastern and western Germany are significant at the 10% level.
Effect Heterogeneities for Eastern and Western Germany
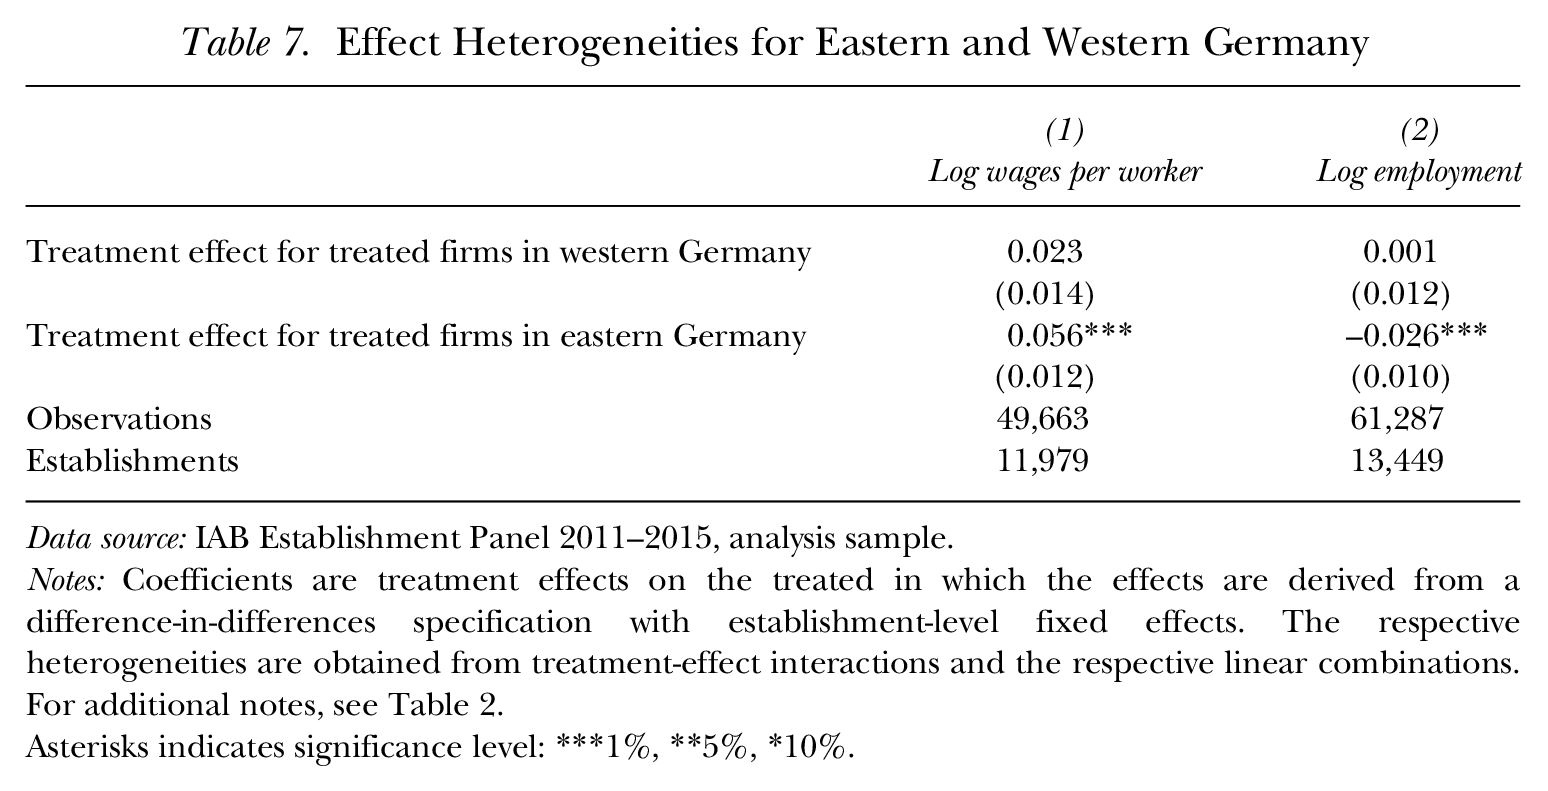
Data source: IAB Establishment Panel 2011–2015, analysis sample.
Notes: Coefficients are treatment effects on the treated in which the effects are derived from a difference-in-differences specification with establishment-level fixed effects. The respective heterogeneities are obtained from treatment-effect interactions and the respective linear combinations. For additional notes, see Table 2.
Asterisks indicates significance level: ***1%, **5%, *10%.
Spillovers and Reallocation
An important discussion in the literature on minimum wages concerns spillovers and reallocation effects, which both imply effects of the minimum wage wherein the legislation is not meant to play a role. Such effects can occur in the wage distribution if the legislation causes spillovers to wage levels for which the minimum wage is nonbinding (Aretz et al. 2013; Dittrich et al. 2014; Autor, Manning, and Smith 2016). Spillover effects may also emerge through the product or labor market if minimum wages affect the respective markets’ conditions, for example, by changing prices (Aaronson 2001). If employers pass through higher wage costs on product prices, competitors may benefit from a relative advantage allowing them to expand employment. This employment expansion would constitute a reallocation of labor, which may compensate for the employment loss at treated plants. Potential price increases do not automatically result in a compensating employment increase, however. Aaronson, French, Sorkin, and To (2018) showed that more capital-intensive plants could also replace labor-intensive plants, ultimately leading to an employment loss.
To address the issue of spillovers, we provide a first robustness check that is based on direct responses in the IAB Establishment Panel. In the survey, employers were asked whether the wages of their employees who were not in the domain of the minimum wage had been adjusted and if so, to indicate the type of adjustment that was made: “Did you conduct other wage adjustments due to the introduction of the new statutory minimum wage? 1) Hourly wages above €8.50 were reduced; 2) Hourly wages above €8.50 were increased; 3) Special payments were reduced or abolished.” We exclude 409 establishments that report any of these spillovers from our control group, resulting in a refined control group that is more likely unaffected by wage spillovers. The respective results are presented in Table 8 and show a fully robust positive wage effect and a negative employment effect in columns (1) and (2) using the same specification as in panel A of Table 2.
Effects from a Refined Control Group with Regard to Spillovers
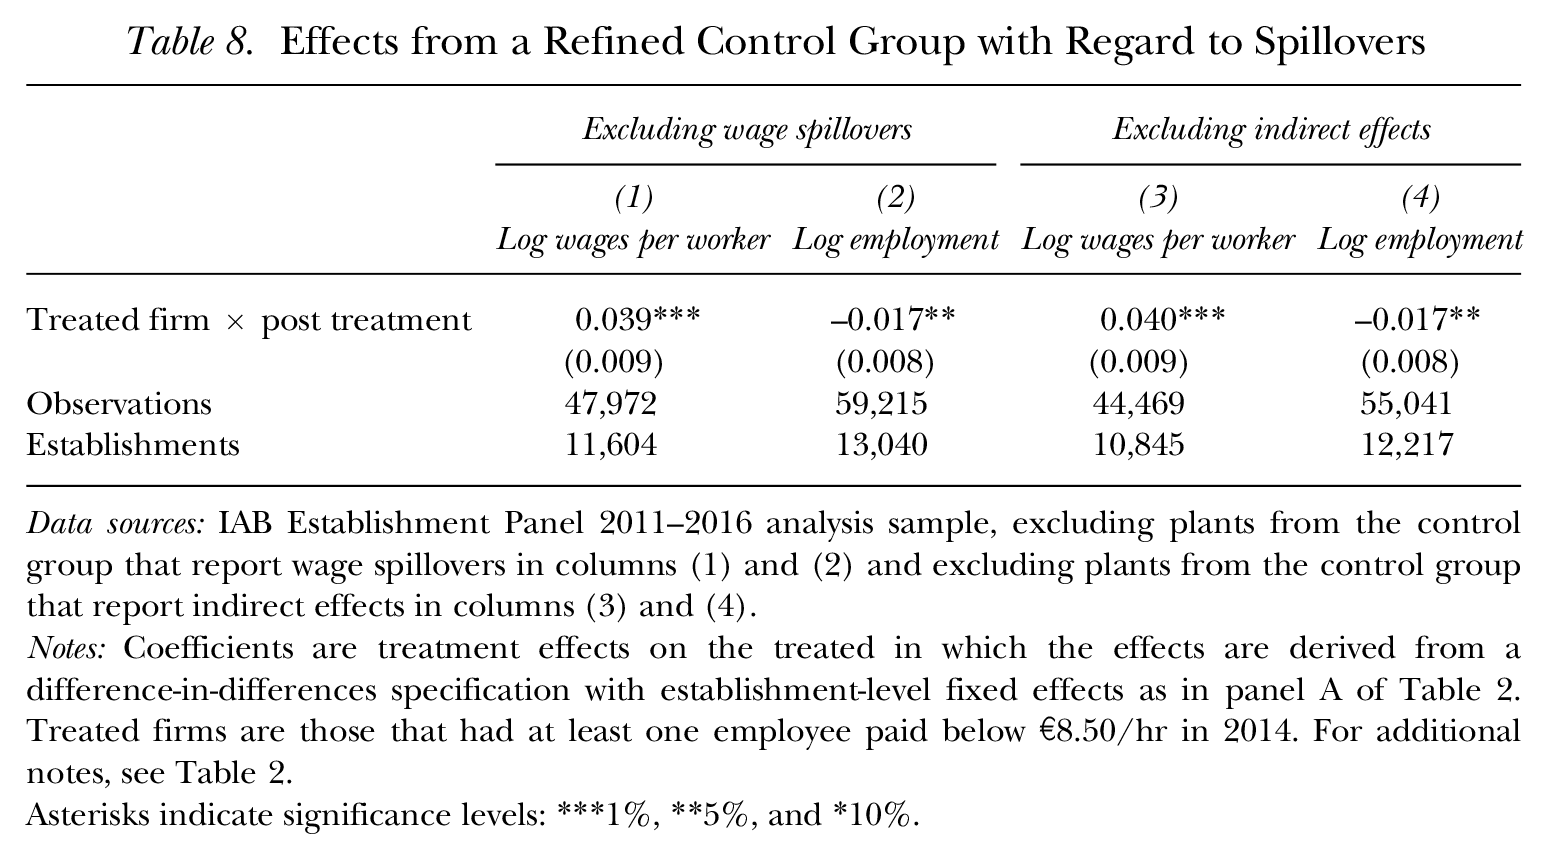
Data sources: IAB Establishment Panel 2011–2016 analysis sample, excluding plants from the control group that report wage spillovers in columns (1) and (2) and excluding plants from the control group that report indirect effects in columns (3) and (4).
Notes: Coefficients are treatment effects on the treated in which the effects are derived from a difference-in-differences specification with establishment-level fixed effects as in panel A of Table 2. Treated firms are those that had at least one employee paid below €8.50/hr in 2014. For additional notes, see Table 2.
Asterisks indicate significance levels: ***1%, **5%, and *10%.
Second, we also want to exclude spillovers on the product or labor market that are reported by the respective employers. In the survey, employers were asked, “Does the introduction of the new statutory minimum wage indirectly affect your establishment (e.g., in terms of price increases by competitors/suppliers or changed competitive conditions)?” We exclude 1,229 establishments from the control group that report being indirectly affected. The wording of the question (asking for indirect effects) suggests that the reported indirect effects are adverse, for example, caused by price increases on the input markets or intensified competition. Hence, we would expect a somewhat larger employment effect identified from adjustments of the treatment group when excluding the adversely affected firms from the control group. The treatment effects in columns (3) and (4) of Table 8 remain robust, however, compared with the baseline specification in panel A of Table 2. Hence, both robustness checks excluding employer-reported spillovers suggest that indirect effects on the control group are unlikely to influence the treatment effects presented earlier.
In an additional step, we address potential spillovers and reallocation effects by exploiting the regional treatment variation. We calculate a regional bite variable and capture the fraction of employees affected by the minimum wage for 141 labor market regions in Germany. 13 We use this information to estimate a regional bite-specific treatment effect for the sample of establishments in the control group. This effect is identified from an interaction of the regional bite and the post-treatment dummy, while controlling for the same variables as in Table 2 as well as a (regional) bite-specific time trend: 14

A positive effect
Reaction of the Control Group in High-Bite Regions
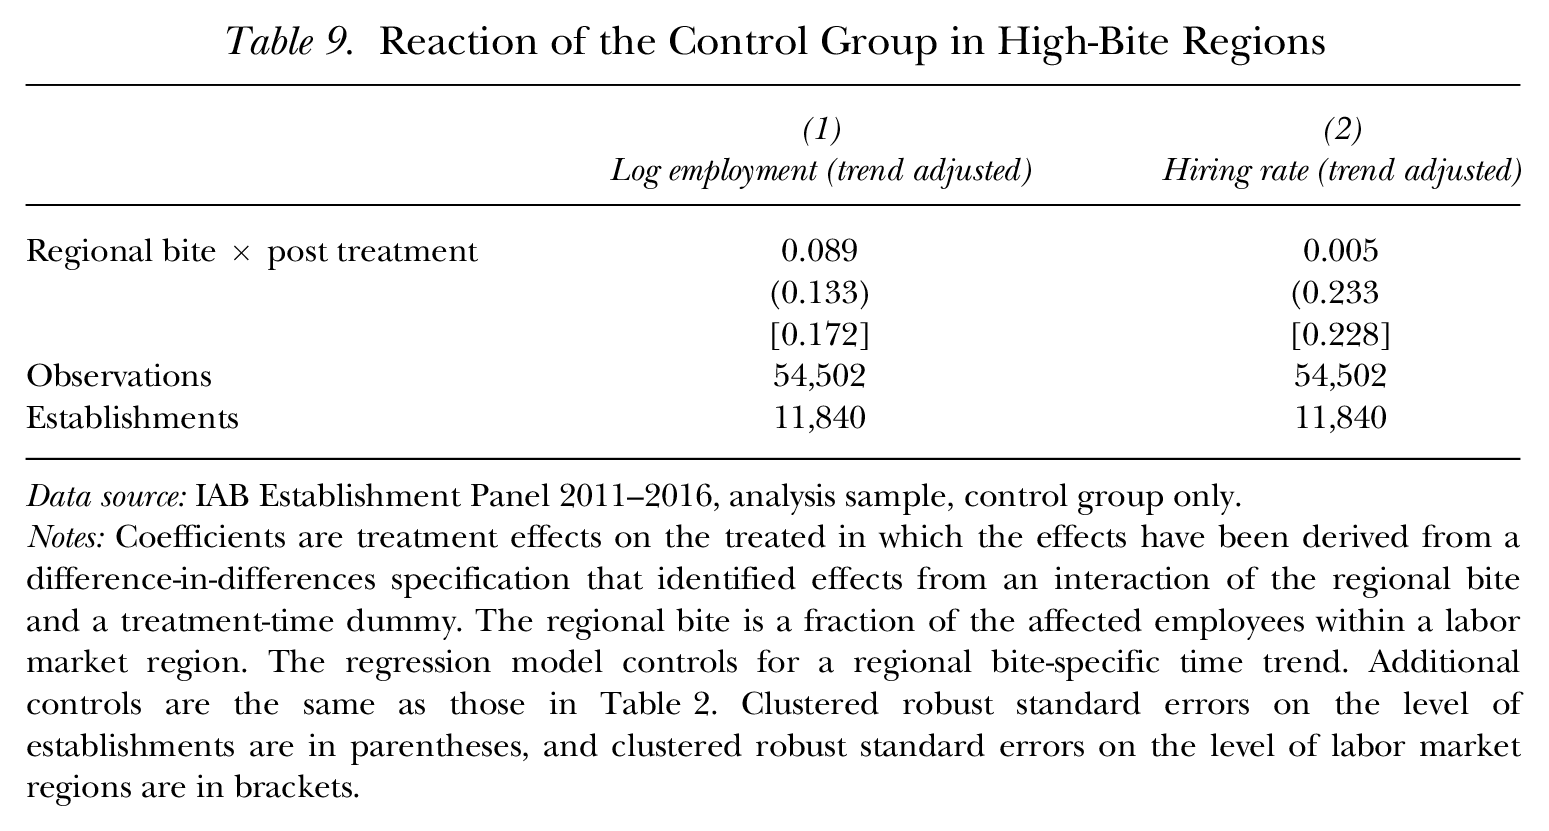
Data source: IAB Establishment Panel 2011–2016, analysis sample, control group only.
Notes: Coefficients are treatment effects on the treated in which the effects have been derived from a difference-in-differences specification that identified effects from an interaction of the regional bite and a treatment-time dummy. The regional bite is a fraction of the affected employees within a labor market region. The regression model controls for a regional bite-specific time trend. Additional controls are the same as those in Table 2. Clustered robust standard errors on the level of establishments are in parentheses, and clustered robust standard errors on the level of labor market regions are in brackets.
The effect in column (1) is positive but economically small and statistically insignificant. When the regional fraction of affected employees increases by one percentage point, the control establishments expand employment by 0.09%. This effect is quite small and statistically insignificant. In addition, column (2) does not point at a significant effect on the hiring rate of control establishments in high-bite regions. Hence, our results do not show a positive effect on the control group in high-bite regions that could compensate for the disemployment effect observed among the treated plants presented earlier. However, such reallocation effects may be a phenomenon in the longer run if displaced workers need a certain time to re-enter employment.
Conclusion
We analyze employment effects of the new statutory minimum wage in Germany, which was implemented on January 1, 2015. We identify employment effects from a difference-in-differences comparison of the treated and untreated establishments. The IAB Establishment Panel allows us to define the minimum wage bite on the establishments from the 2014 panel wave, and the outcome variables include average wages, employment levels, and typical contracted working hours.
We observe a treatment effect on the treated establishments that shows a sharp increase in average wages by approximately 3.8 to 6.3% and a decrease in employment at affected establishments by approximately 1.7%. These estimates imply a labor demand elasticity with respect to wages ranging between −0.2 and −0.4, depending on the model specification. These elasticities are in line with results from the minimum wage introduction in the United Kingdom presented by Machin, Manning, and Rahman (2003). Hence, our results correspond with their conclusion of a modest negative labor demand elasticity. The size of the elasticity estimates should not be compared with direct policy elasticities from the United States, however, if the elasticities are calculated from a percentage change of the minimum wage in the denominator. In the very same application, a direct elasticity is typically smaller than the implied labor demand elasticity, which we present for Germany.
When we relate the disemployment effect in the range of 1.5 to 2.2% to the population of employees in the treatment group, that is, 3,090,626 employees (see Table 1), we conclude that approximately 45,000 to 68,000 additional jobs could have been created at treated establishments in the absence of the minimum wage. Although this conclusion does not correspond by far with the most pessimistic projections, it still shows a modest job loss induced by the minimum wage in Germany. Compared with the descriptive governmental monitoring of transitions between employment states in the months around the minimum wage introduction (Berge et al. 2016), our effect size falls in the range of plausible results. Of note, and in line with evaluation studies of sectoral minimum wages in Germany (König and Möller 2009; Aretz et al. 2013; Berge and Frings 2019), the employment effect is driven by firms in the East that also react with a relatively stronger wage adjustment. Moreover, our estimates are in the range of other more recent studies that exploit regional variation to evaluate employment effects of the new German minimum wage (Caliendo et al. 2018; Garloff 2019).
In addition to the effects on employment, we also observe a transitory reduction in the typical contracted working hours in 2015. The working hours effect pattern suggests that the intensive margin of employment is an additional adjustment margin that was used in the short run and may be shifted to the extensive margin in the long run, which is indicated by a slight increase of the disemployment effect in 2016 compared with 2015. When we study the minimum wage effect on labor flows, employment seems to be affected by a reduction in hires but not by an increase in separations.
To test for spillovers and potentially compensating reallocation effects, we use direct questions included in the survey asking for indirect effects and wage spillovers outside of the direct domain of the minimum wage. When we refine our control group with respect to these measures, the treatment effects remain robust and show the same effect sizes. Moreover, additional estimations that analyze the reactions of the control group in high-bite regions do not show an employment expansion that could compensate for the disemployment effect at treated establishments. Hence, we do not observe a reallocation of labor in our short-run analysis. Nevertheless, such reallocation effects may be more likely in the long run if displaced workers need a certain amount of time to re-enter employment.
We admit several limitations of our analysis: First, our data omit black market employment, and it is possible that the observed employment reduction led to a compensating increase in black market employment. Second, we observe only short-run effects of the minimum wage introduction in 2015 and 2016. Long-run effects might differ and should be addressed in future research. Potential differences between short-run and long-run effects are of particular relevance if labor demand shows an interaction effect during a recession. Third, we cannot estimate accurate hours adjustments on the worker level. Heterogeneities concerning working hours are likely at the worker level and should be addressed in future research.
Supplemental Material
Bossler_Gerner_Supplemental_Online_Appendix – Supplemental material for Employment Effects of the New German Minimum Wage: Evidence from Establishment-Level Microdata
Supplemental material, Bossler_Gerner_Supplemental_Online_Appendix for Employment Effects of the New German Minimum Wage: Evidence from Establishment-Level Microdata by Mario Bossler and Hans-Dieter Gerner in ILR Review
Footnotes
Acknowledgements
We acknowledge comments from participants of the 2017 Conference of the European Association of Labor Economics (EALE), the 2016 Conference of the German Statistical Society (“Statistische Woche”), the 2016 Conference of the European Economic Association, the 2016 and 2017 Conferences of the German Economic Association (“Verein für Socialpolitik”), the 2016 IZA/IFAU Conference on Policy Evaluation, the 2017 Spring Meeting of Young Economists, the 2017 Southern Economic Association, as well as seminar and workshop participants in Cologne, Halle, Hydra, Munich, Nuremberg, and Trier. We also acknowledge particularly helpful discussions and comments from Lutz Bellmann, Philipp vom Berge, Lisa Feist, Hanna Frings, Olaf Hübler, Thorsten Schank, and Claus Schnabel. We thank Barbara Schwengler for preparing the maps included in the article.
For information regarding the data and/or computer programs used for this study, please address correspondence to
1
Employees with exemption clauses are apprentices, college student interns, young individuals under 18 years of age, and the long-term unemployed for the first six months after re-employment.
2
The self-reported applicability is calculated from the 2015 IAB Establishment Panel, in which employers are asked whether an exemption clause allows them to undercut the minimum wage.
3
The Posting of Workers Directive (“Arbeitnehmer-Entsendegesetz”) of 1996 allowed unions, employer associations, and the Federal Ministry of Labor and Social Affairs to expand industry-wide collective bargaining contracts to all employees of the respective industry even if the firm was not a member of the employer association. Hence, the expansion implements a sector-specific minimum wage.
4
In minimum wage evaluations the term “bite” is used to describe the extent to which units of observation (e.g., regions, establishments) are affected by the respective minimum wage.
5
6
The behavior of the group of anticipating plants had already differed greatly from that of non-anticipating plants prior to the minimum wage introduction, as they were on a much more positive employment trend (![]() ). This difference demonstrates that the respective group of plants could afford to increase wages before the law was in force. In addition, the positive employment trend violates the parallel trends assumption, which is another reason to exclude these establishments from the main analysis.
). This difference demonstrates that the respective group of plants could afford to increase wages before the law was in force. In addition, the positive employment trend violates the parallel trends assumption, which is another reason to exclude these establishments from the main analysis.
7
Because of item nonresponse, the sample size is slightly smaller when looking at log wages as the outcome of interest. This limitation could potentially bias the results of the wage effect. As we discuss later, however, the treatment effect on wages is very robust, such that this potential selectivity bias and its influence on the overall results warrant only a theoretical note.
8
9
![]() shows that the point estimates of the baseline results can be replicated using similar but smaller establishment-level data from the IAB QUEST Survey. This survey was conducted by the Institute of Employment Research (IAB) in the beginning of 2016 and it includes the same information on whether establishments were affected by the minimum wage introduction. Linking these survey data to longitudinal administrative employment data of the participating establishments allows us to replicate our baseline estimations with regard to employment.
shows that the point estimates of the baseline results can be replicated using similar but smaller establishment-level data from the IAB QUEST Survey. This survey was conducted by the Institute of Employment Research (IAB) in the beginning of 2016 and it includes the same information on whether establishments were affected by the minimum wage introduction. Linking these survey data to longitudinal administrative employment data of the participating establishments allows us to replicate our baseline estimations with regard to employment.
10
The inverse-hyperbolic-sine transformation closely follows the functional form of the log transformation for values > 1. Hence, all our baseline effects can be precisely replicated using the inverse-hyperbolic-sine transformation.
11
The data on hires and separations have the following limitations: First, hires and separations are only surveyed for half-year periods and hence do not correspond with the yearly stocks. Second, it is unclear whether short-term employment relationships that do not cover yearly cutoffs (which is typically June 30) are reported.
12
In ![]() , we present an alternative robustness check that addresses the parallel trends assumption by using a synthetic control approach. It reweights the control group to resemble the trend of the treatment group, using entropy balancing. The results remain robust when we reweight the control group based on the pretreatment changes of the outcome variable. When we balance the trends based on the pretreatment levels of the outcome variables, the wage effect turns insignificant simply because it leaves no variation in wage levels that could justify a wage effect.
, we present an alternative robustness check that addresses the parallel trends assumption by using a synthetic control approach. It reweights the control group to resemble the trend of the treatment group, using entropy balancing. The results remain robust when we reweight the control group based on the pretreatment changes of the outcome variable. When we balance the trends based on the pretreatment levels of the outcome variables, the wage effect turns insignificant simply because it leaves no variation in wage levels that could justify a wage effect.
13
14
The pretreatment-time trend varies by the regional bite. Even when omitting the trend, however, we do not find evidence for reallocation effects.
References
Supplementary Material
Please find the following supplemental material available below.
For Open Access articles published under a Creative Commons License, all supplemental material carries the same license as the article it is associated with.
For non-Open Access articles published, all supplemental material carries a non-exclusive license, and permission requests for re-use of supplemental material or any part of supplemental material shall be sent directly to the copyright owner as specified in the copyright notice associated with the article.