
Abstract
The authors explore unique complete-count data from the 1930 Census in which a respondent’s race was assigned by enumerators and “Mexican” was one of the possible responses. Census enumerators frequently and selectively assigned a non-Mexican race—predominantly “white”—to US-born individuals of Mexican ancestry. As a result, using enumerator-assigned race to identify Mexican Americans misses a sizeable fraction of the relevant population and significantly understates this group’s socioeconomic attainment. The propensity for Census enumerators to identify Mexican Americans as white varied enormously across US counties, and this variation is strongly associated with both the educational attainment of US-born Mexican Americans observed in the 1940 Census and the amount of return migration by Mexican immigrants during the 1930s. As such, this variation may help to identify local environments that were more favorable for the integration of Mexican Americans.
Keywords
The 1930 Census has two unique features that make it especially valuable for assessing the status of Mexican Americans at an early and important stage in their US history. First, the information necessary to identify US-born Mexican Americans is available for the complete-count (i.e., 100%) microdata sample, a sampling rate that is at least 20 times that of later Census microdata samples. 1 As a result, the 1930 Census by itself provides a massive sample of approximately 1.5 million Mexican Americans, with 58% of these being US-born and the remainder born in Mexico. In addition, the 1930 Census is the only Census to date in which the race question included “Mexican” as a possible response (along with white, black, American Indian, and several Asian responses). Unlike modern Censuses in which respondents self-report their race and Hispanic origin, in 1930 race was assigned by Census enumerators (Humes and Hogan 2009). As a result, these data provide a unique perspective on how other community members—namely, Census enumerators—viewed Mexican Americans and their position in the racial/ethnic structure of the time.
In this article, we begin to explore what these data can teach us about the sources and geographic roots of Mexican American disadvantage and progress. In the first part of the article, we analyze the racial identification of Mexican Americans in the 1930 Census. In particular, which individuals of Mexican ancestry were assigned a race of “white” rather than “Mexican” by Census enumerators? How accurately does the 1930 Census race question identify US-born Mexican Americans? Does this question miss a significant and selective segment of the Mexican ancestry population? How do patterns of Mexican ethnic attrition arising from this enumerator-assigned measure compare with contemporary data in which respondents self-report their ethnic identity? Similar to findings from analyses of the Hispanic origin question available in contemporary data, use of the Mexican race classification in the 1930 Census understates the socioeconomic attainment of US-born Mexican Americans. As discussed further below, our work provides new historical evidence of ethnic attrition and its implications for assessing the integration of the US-born descendants of Mexican immigrants.
In the second part of the article, we show that the chances that a Mexican American was identified racially as white in 1930 vary enormously across locations, even after accounting for socioeconomic characteristics of the individual. We investigate whether this geographic variation might provide useful information about the local environment and how hospitable it was toward Mexican American integration. These analyses suggest potentially fruitful new uses of data in which race or ethnicity is assigned by observers rather than self-reported by respondents.
Racial Identification of Mexican Americans in the 1930 Census
Using contemporary data in which ethnic identification is self-reported by the respondent, recent work analyzes how intermarriage and other factors shape the ethnic attachments of Mexican Americans and the US-born descendants of other immigrant groups (Perlmann and Waters 2007; Alba and Islam 2009; Duncan and Trejo 2011, 2017; Lopez, Gonzalez-Barrera, and Lopez 2017; Duncan, Grogger, Leon, and Trejo 2020). This research highlights how selective ethnic attrition can distort assessments of generational progress for these groups. The 1930 Census data provide an opportunity to study similar issues for Mexican Americans in an earlier era, with the important difference that enumerator assignment of racial/ethnic labels implies that these data tell us more about how other Americans viewed Mexican Americans than about how Mexican Americans viewed themselves.
Defining Immigrant Generations for Mexican Americans
We start with complete-count microdata from the 1930 Census. 2 For each person, information is available regarding their own country of birth as well as the countries of birth of their mother and father. Among adults, we can use this information to identify first- and second-generation Mexican Americans. First-generation Mexican Americans, or Mexican immigrants, are US residents who were born in Mexico. Second-generation Mexican Americans are US-born individuals who have at least one parent born in Mexico. Among the second generation, we can further distinguish between those with both parents versus only one parent born in Mexico, and within the latter group we can also differentiate according to whether it is the mother or the father who was born in Mexico. When analyzing adults, we restrict the sample to respondents who were ages 18 to 59.
A separate set of analyses focuses on children ages 6 to 16 who at the time of the Census were living with both of their parents. For this sample, we can merge information between the child and parent records and thereby learn more about the child’s ancestry. For children living in intact families, the parent records supply information about the countries of birth of the child’s grandparents. These data allow us to identify three generations of Mexican American children. The definitions of first- and second-generation Mexican American children are the same as those provided in the preceding paragraph for Mexican American adults. Third-generation Mexican American children are US-born individuals with two US-born parents and at least one grandparent born in Mexico. 3 Among the third generation, we can differentiate according to how many grandparents (one to four) were born in Mexico and whether the child has Mexican-born grandparents on both the maternal and paternal sides of their family rather than on only one side.
Enumerator Assignment of Race for Mexican Americans
As was the case for all Censuses prior to 1960, information on race in 1930 was assigned by enumerators (Humes and Hogan 2009). For the 1930 Census, enumerators filled out forms in which each row represented a unique individual and each column represented a separate piece of information being collected. 4 In column 12, enumerators recorded the “color or race” of each individual. Enumerators were given abbreviations to use for assigning the following races: white, Negro, Mexican, Indian, Chinese, Japanese, Filipino, Hindu, and Korean. For individuals of any other race, enumerators were asked to write in the relevant race. Notably, the 1930 Census is unique in recognizing Mexican as a valid race response. 5
The “Instructions to Enumerators” for the 1930 Census provided the following guidance about the new racial category of Mexican: “Practically all Mexican laborers are of a racial mixture difficult to classify, though usually well recognized in the localities where they are found. In order to obtain separate figures for this racial group, it has been decided that all persons born in Mexico, or having parents born in Mexico, who are not definitely white, Negro, Indian, Chinese, or Japanese, should be returned as Mexican” (U.S. Department of Commerce 1930: 26).
At first glance, these instructions appear to have given enumerators little choice but to assign a race of Mexican to all first- and second-generation Mexican Americans (i.e., “persons born in Mexico, or having parents born in Mexico”). Yet we show below that a sizeable fraction of US-born individuals with Mexican-born parents were assigned a race of white rather than Mexican. Even among individuals born in Mexico, the fraction assigned a race of white approaches 5%.
Upon closer reading, several features of the instructions suggest that enumerators had some leeway in racially classifying persons of Mexican ancestry. The reference to those “having parents born in Mexico, who are not definitely white” (or some other race) provides a possible justification for enumerators assigning a non-Mexican race to Mexican Americans with mixed backgrounds and perhaps also to second-generation Mexican Americans with one parent not born in Mexico. 6 In addition, the first sentence of the instructions acknowledges that most Mexicans “are of a racial mixture difficult to classify” and seems to invite the use of local standards in assigning race to this group. Gratton and Merchant (2016: 543) noted that “area of residence strongly affected classification” of race for US-born Mexican Americans in the 1930 Census, with enumerators in parts of Texas much more likely to assign a race of Mexican rather than white compared to enumerators in northern New Mexico and southern Colorado. In discussing how to classify other types of mixed-race individuals, the enumerator instructions similarly recognized a role for local standards. For example, “a person of mixed Indian and Negro blood should be returned as Negro, unless the Indian blood predominates and the status as an Indian is generally accepted in the community.” Likewise, “a person of mixed white and Indian blood should be returned as Indian, except where the percentage of Indian blood is ‘very small,’ or where he is regarded as a white person by those in the community where he lives” (U.S. Department of Commerce 1930: 26).
Another interesting feature of the enumerator instructions for the Mexican race category is their explicit reference to “Mexican laborers.” Such language may suggest that this category primarily targets Mexican-origin individuals of lower socioeconomic standing and that Mexican ethnics of higher standing might instead be assigned a race of white. The implied positive relationship between socioeconomic standing and the chances that enumerators assigned Mexican-origin individuals a race of white rather than Mexican is exactly what we find empirically.
The enumerator instructions are imprecise regarding the racial classification of Mexican Americans in the third generation and beyond. As noted previously, these instructions are quite clear for first- and second-generation Mexican Americans. Putting aside the complicating issues discussed above, “persons born in Mexico, or having parents born in Mexico, . . . should be returned as Mexican.” But the instructions do not explicitly state that only such persons should be returned as Mexican. Indeed, we show below that enumerators assigned a race of Mexican to 75% of third-generation Mexican American children, so most enumerators did not seem to interpret the instructions as limiting the Mexican race category to first- and second-generation individuals only. 7 Compared to the third generation, this rate of Mexican racial identification is markedly higher for the first and second generations (96% and 93%, respectively). The lower rate for the third generation could reflect their additional racial integration into the white mainstream, but it could also arise because some enumerators interpreted the instructions as dictating that the Mexican race category did not apply to individuals beyond the second generation.
For the reasons discussed above, we believe that Census enumerators had considerable latitude in how they assigned race to persons of Mexican ancestry. We also note that, on the 1930 Census form, information about the countries of birth of each individual and their father and mother were written in columns 18, 19, and 20, respectively. Therefore, the data regarding own and parental countries of birth were likely collected after the enumerator already had assigned an individual’s race in column 12, which may help to further explain why assigned race sometimes seems inconsistent with the birthplace information. We show below that these inconsistencies between enumerator-assigned race and Mexican ancestry follow sensible patterns with respect to immigrant generation and whether an individual’s Mexican lineage derives from both the maternal and paternal sides of their family.
Patterns of Enumerator-Assigned Race for Mexican Americans
For first- and second-generation Mexican Americans ages 18 to 59, Table 1 reports the percentage distributions of racial categories assigned by 1930 Census enumerators. 8 Results show that 5% of Mexican immigrants and 15% of second-generation Mexican Americans were assigned races other than Mexican. White was by far the predominant non-Mexican race assigned to Mexican Americans, comprising 94% of the non-Mexican races assigned to Mexican immigrants and 91% of the non-Mexican races assigned to second-generation Mexican Americans. The rate of non-Mexican racial identification rises as individuals become further removed from their ethnic roots. Not only is this rate higher for the second generation (15.0%) compared to the first (5.1%), but among second-generation Mexican Americans the rate is dramatically higher for those with just one Mexican-born parent (29.9%) rather than two (8.0%). In addition, among second-generation Mexican Americans with only one parent born in Mexico, the rate of non-Mexican racial identification is higher when the Mexican-born parent is the mother (39.4%) rather than the father (23.7%). This last finding suggests that the absence or presence of a Spanish surname may play a key role in how enumerators assigned race to second-generation Mexican Americans.
Enumerator-Assigned Race for First- and Second-Generation Mexican American Adults in 1930
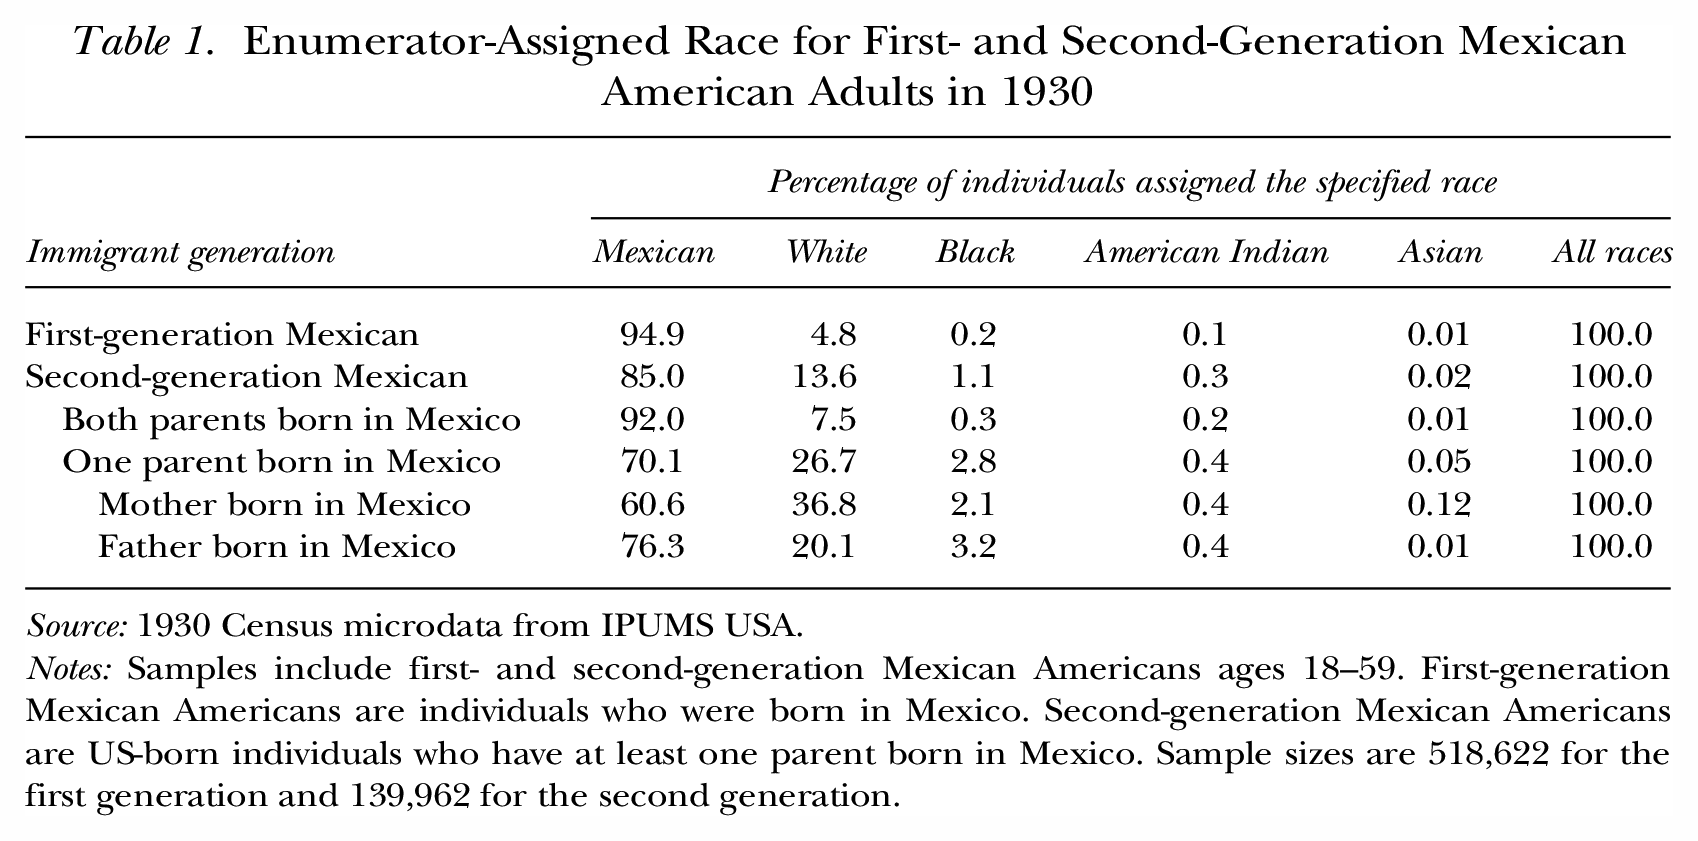
Source: 1930 Census microdata from IPUMS USA.
Notes: Samples include first- and second-generation Mexican Americans ages 18–59. First-generation Mexican Americans are individuals who were born in Mexico. Second-generation Mexican Americans are US-born individuals who have at least one parent born in Mexico. Sample sizes are 518,622 for the first generation and 139,962 for the second generation.
Table 2 presents similar statistics for Mexican American children ages 6 to 16 who were living with both parents at the time of the 1930 Census. As described previously, for this sample we can identify three generations of Mexican Americans. Here, the rate of non-Mexican racial identification rises across generations of Mexican American children from 4.3% for the first generation to 6.9% for the second generation to 24.8% for the third generation. As was observed for adults in Table 1, the rate of non-Mexican identification among the second generation is much higher for Mexican American children with only one Mexican-born parent (rather than two), and within this group the rate is higher if that Mexican-born parent is the mother rather than the father. The third generation also displays similar patterns of higher rates of non-Mexican identification for Mexican American children with weaker ethnic attachments. For example, non-Mexican identification rises monotonically as the number of grandparents born in Mexico falls, from 10.2% for children with four Mexican-born grandparents to 53.7% for those with only one Mexican-born grandparent. The bottom rows of Table 2 instead distinguish third-generation children by which side of their family (i.e., maternal, paternal, or both) has a Mexican-born grandparent. As expected, the rate of non-Mexican identification is substantially higher for third-generation children with a Mexican-born grandparent on just one side of their family (37.4%) rather than on both sides (12.7%). Moreover, similar to what was observed previously for second-generation children and adults, non-Mexican identification is higher for third-generation children whose Mexican-born grandparents come only from their mother’s side rather than only from their father’s side.
Enumerator-Assigned Race for First-, Second-, and Third-Generation Mexican American Children in 1930
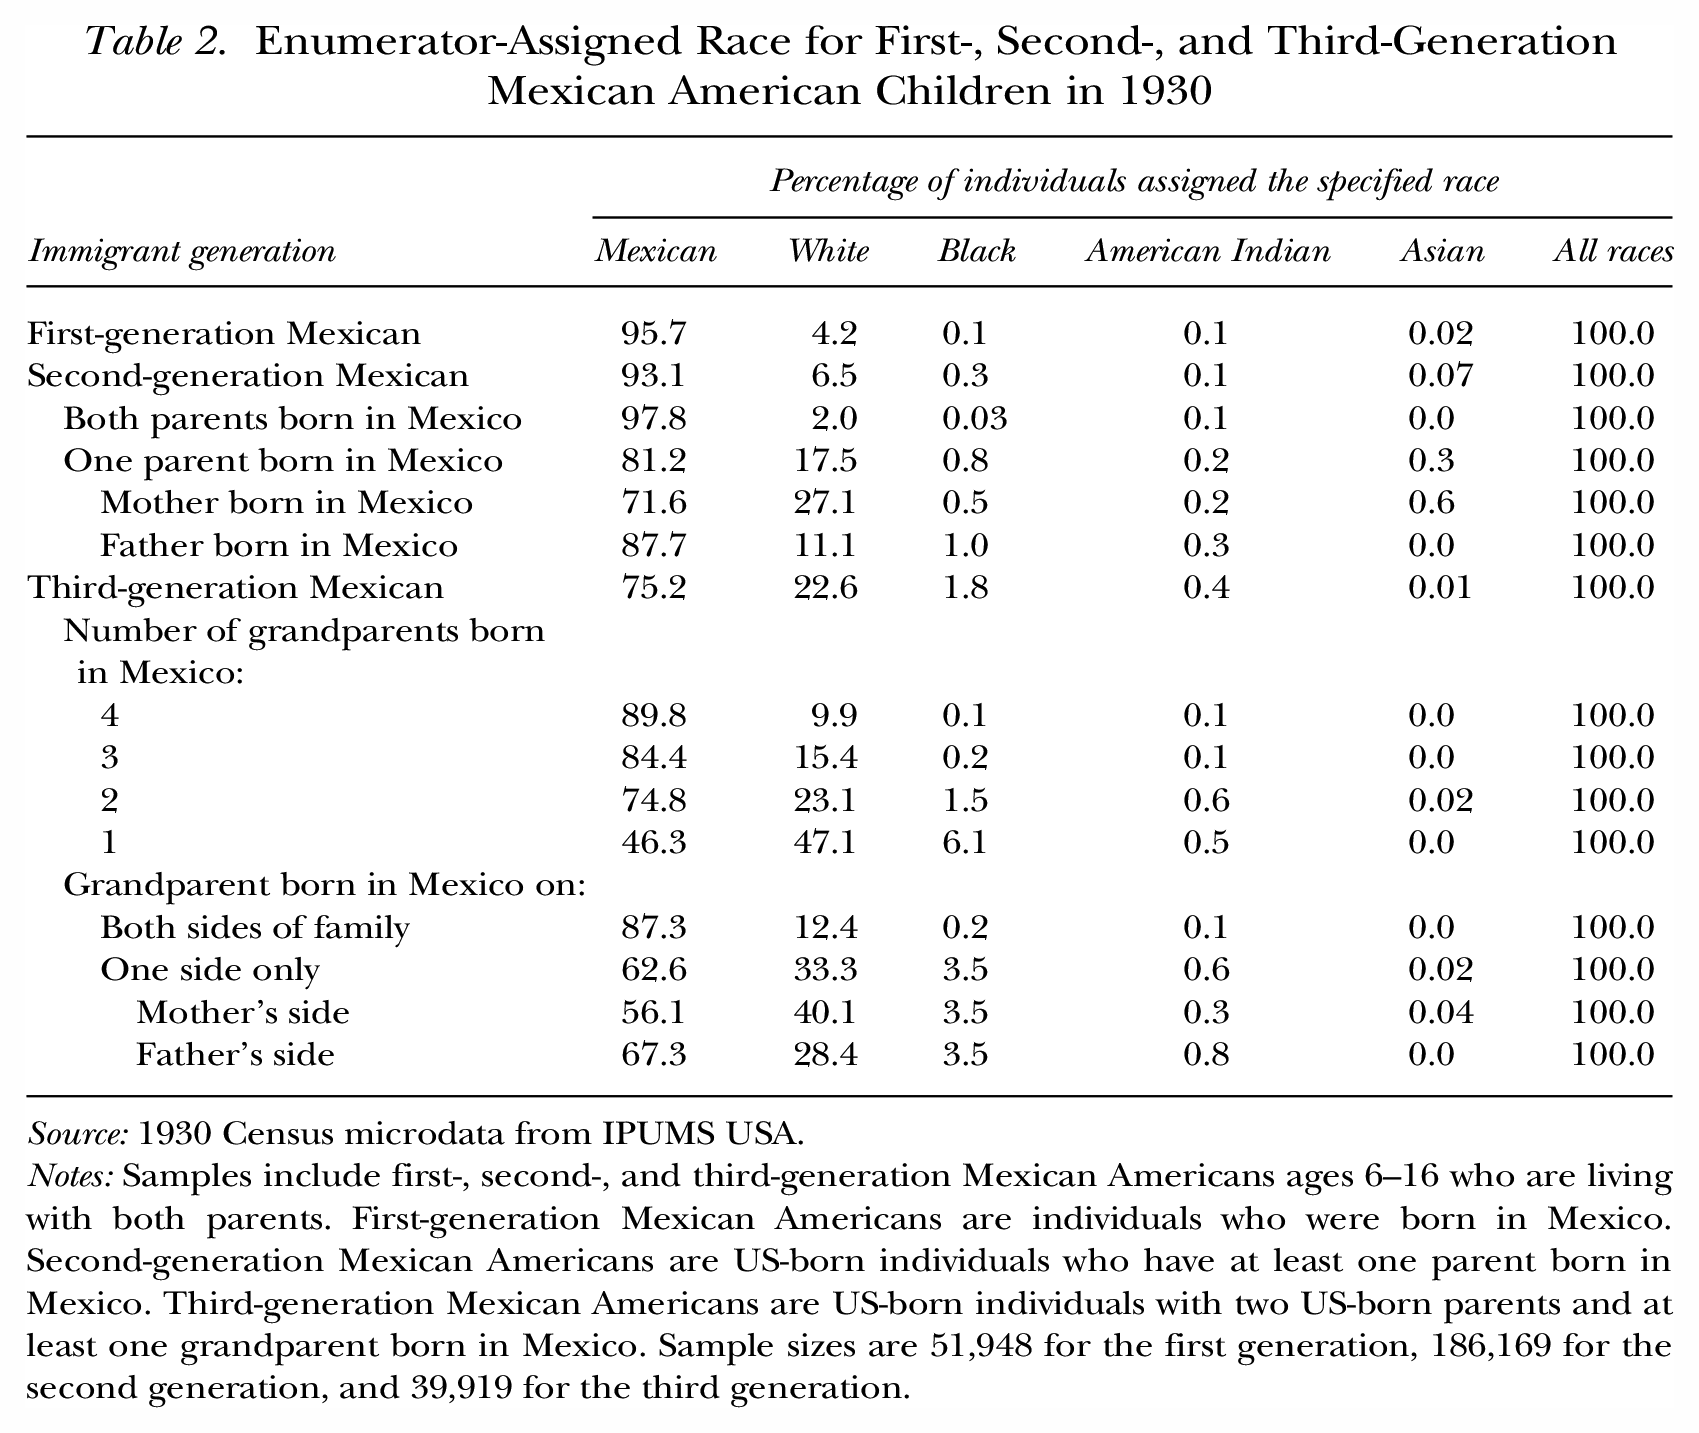
Source: 1930 Census microdata from IPUMS USA.
Notes: Samples include first-, second-, and third-generation Mexican Americans ages 6–16 who are living with both parents. First-generation Mexican Americans are individuals who were born in Mexico. Second-generation Mexican Americans are US-born individuals who have at least one parent born in Mexico. Third-generation Mexican Americans are US-born individuals with two US-born parents and at least one grandparent born in Mexico. Sample sizes are 51,948 for the first generation, 186,169 for the second generation, and 39,919 for the third generation.
In the 1930 Census, enumerators often assigned a non-Mexican race—primarily white—to US residents of Mexican descent. The chances of this happening vary in sensible ways with immigrant generation and with whether Mexican ancestry is observed on both the maternal and paternal sides of the respondent’s family. The presence of such “ethnic attrition” implies that significant numbers of Mexican-origin individuals were missed by the Mexican race category uniquely available in the 1930 Census. The Mexican race category has the advantage of capturing some Mexican Americans beyond the second generation whose ethnicity cannot be identified from the available information regarding own and parental countries of birth, but at the same time the Mexican race category omits a portion of the Mexican-origin population, even among the first and second generations. We might ask, then, how accurate a picture of Mexican Americans is provided by the singular race information available in the 1930 Census? The extent to which ethnic attrition biases assessments of socioeconomic attainment for Mexican Americans in these data will depend on how selective Census enumerators were in assigning race to Mexican-origin individuals. We turn to this issue next.
Socioeconomic Selectivity of Enumerator-Assigned Race for Mexican Americans
To understand the measurement problem created by ethnic attrition, consider a sample of US residents who have Mexican ancestry that is identifiable from the countries of birth of themselves, their parents, and their grandparents. Let

The “bias” from estimating average outcomes for Mexican Americans using the subsample assigned a race of Mexican (rather than using the total sample) is

The rightmost expression in Equation (2) indicates that this bias is the product of the ethnic attrition rate
For first- and second-generation Mexican American adults, Table 3 illustrates the selectivity and bias of Mexican racial identification in the 1930 Census data. The outcomes reported include indicator variables for whether a person is literate (in any language), whether they speak English, whether they reside on a farm, and whether they reside (for first-generation Mexican Americans) or were born (for second-generation Mexican Americans) in the states of California and Texas.
9
The only continuous outcome variable is the natural logarithm of an occupational income score,
10
which we report exclusively for the male sample. The first three columns of numbers in Table 3 show
Selectivity of Enumerator-Assigned Race for First- and Second-Generation Mexican American Adults in 1930
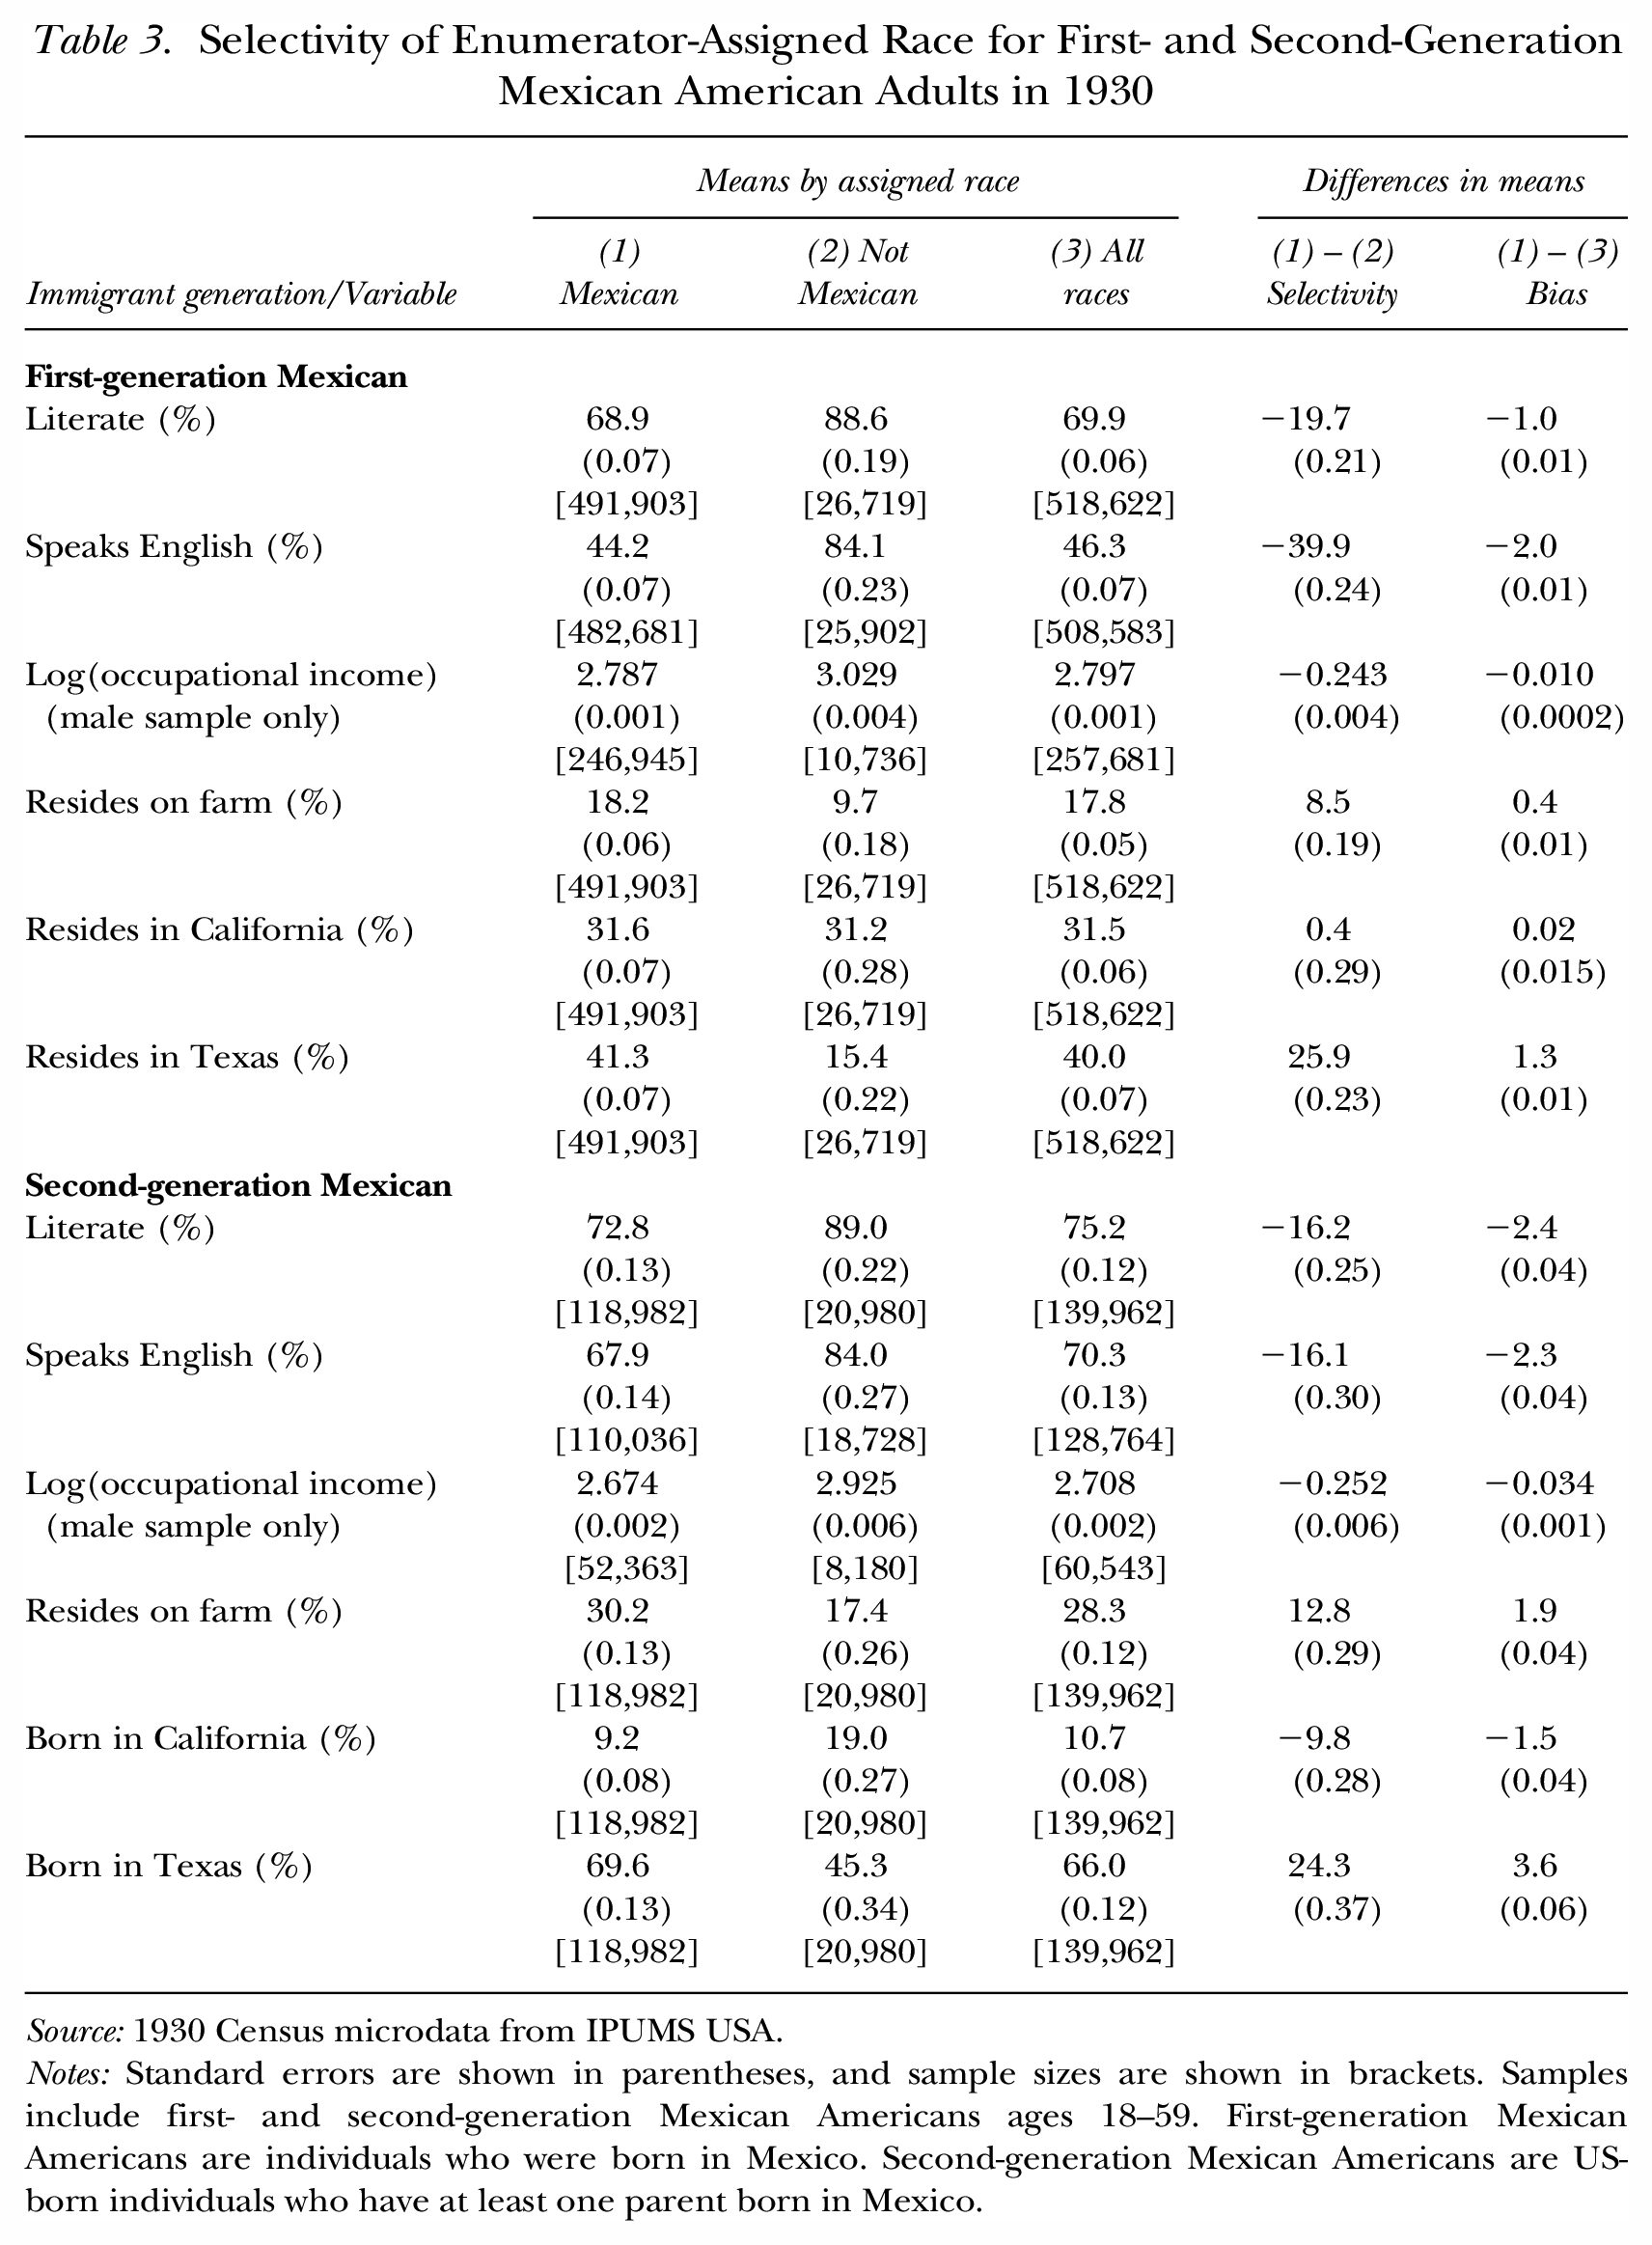
Source: 1930 Census microdata from IPUMS USA.
Notes: Standard errors are shown in parentheses, and sample sizes are shown in brackets. Samples include first- and second-generation Mexican Americans ages 18–59. First-generation Mexican Americans are individuals who were born in Mexico. Second-generation Mexican Americans are US-born individuals who have at least one parent born in Mexico.
Table 3 reveals that Census enumerators in 1930 were highly selective in assigning race to Mexican Americans. Among Mexican-origin individuals, those assigned a Mexican race had much lower rates of literacy and ability to speak English, worked in worse-paying occupations, and were more likely to live on a farm and to hail from Texas. The selectivity of Mexican racial identification displays a similar pattern for the first and second generations, with those Mexican Americans assigned a Mexican race more likely to possess characteristics associated with lower socioeconomic attainment. Recall that the bias reported in the last column of Table 3 is the product of this selectivity and the relevant ethnic attrition rate. Ethnic attrition rates are markedly higher for the second generation than for the first (see Table 1), whereas the selectivity of Mexican racial identification is roughly similar across generations. As a result, the bias is typically larger for the second generation compared with the first. For example, using enumerator-assigned race to identify Mexican Americans biases the literacy rate downward by 1.0 percentage point for Mexican immigrants and by 2.4 percentage points for second-generation Mexican Americans. The corresponding downward biases in occupational income are 1% for immigrants and more than 3% for the second generation. Overall, these data suggest that selective racial identification of Mexican Americans by 1930 Census enumerators leads to underestimates of this population’s socioeconomic attainment.
Table 4 reports similar estimates for third-generation Mexican American children. For this population, Mexican racial identification is strongly selective in the same direction as for Mexican American adults. Because the ethnic attrition rate approaches 25% for third-generation children (see Table 2), the corresponding biases are quite large. Restricting the sample of third-generation children to those assigned a Mexican race by enumerators understates the school enrollment rate (for ages 6 to 16) by 5 percentage points and the rates of literacy and ability to speak English (for ages 10 to 16) by more than 4 percentage points each. Use of enumerator-assigned race also produces substantially overstated fractions of third-generation Mexican American children who grew up on farms or in Texas.
Selectivity of Enumerator-Assigned Race for Third-Generation Mexican American Children in 1930
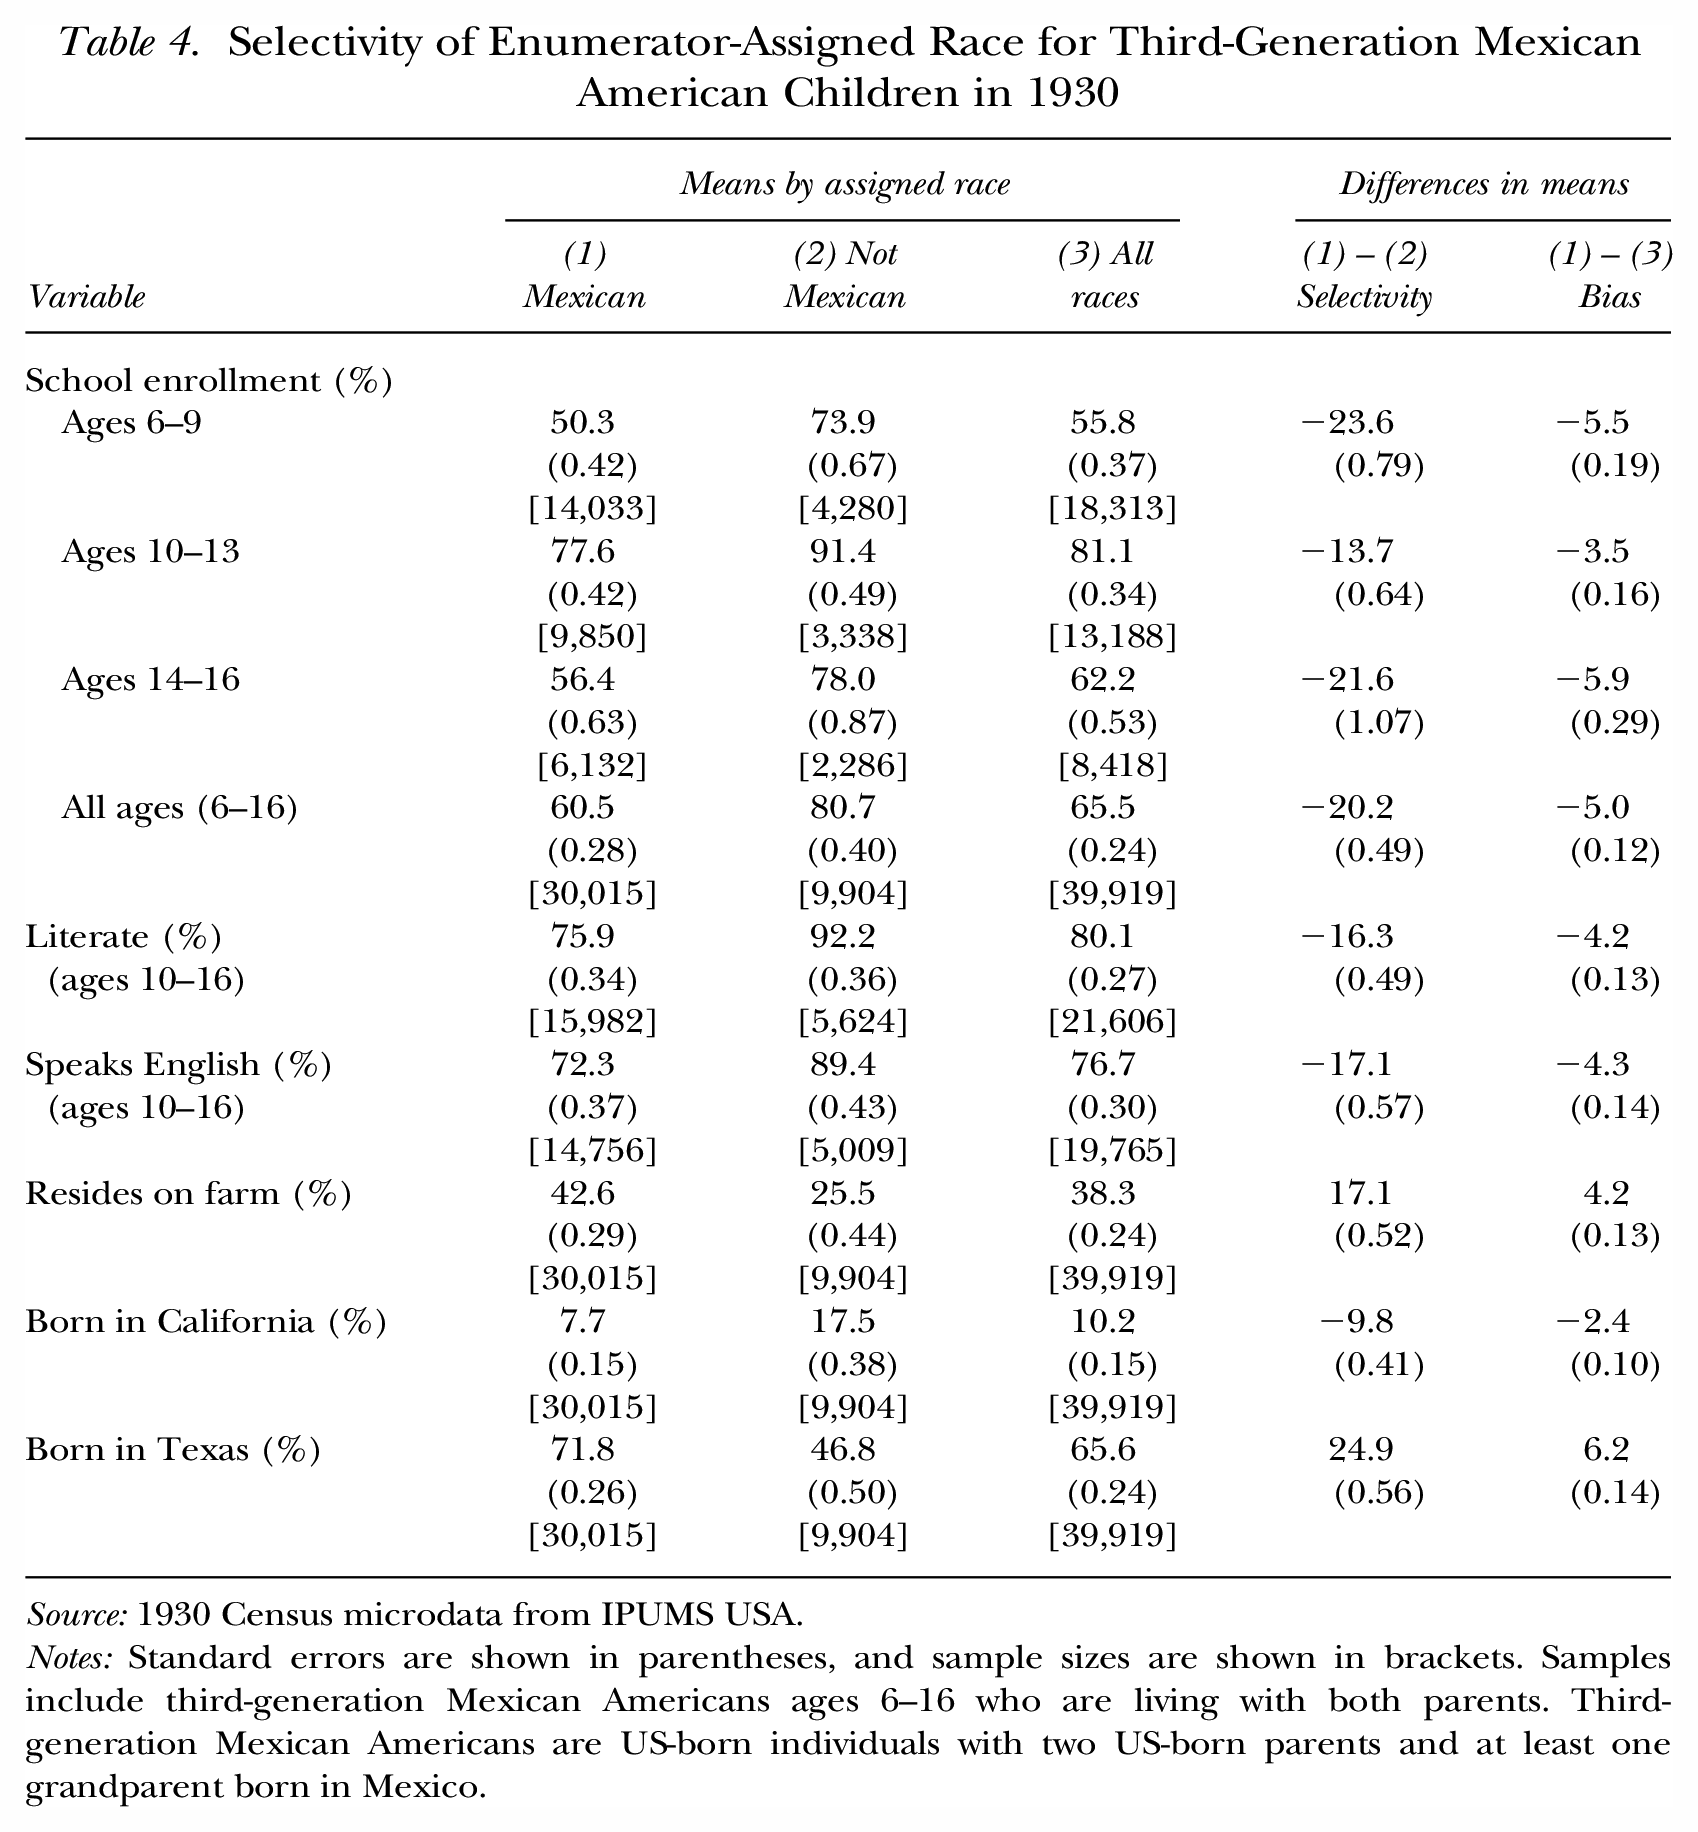
Source: 1930 Census microdata from IPUMS USA.
Notes: Standard errors are shown in parentheses, and sample sizes are shown in brackets. Samples include third-generation Mexican Americans ages 6–16 who are living with both parents. Third-generation Mexican Americans are US-born individuals with two US-born parents and at least one grandparent born in Mexico.
Disparities in school enrollment and literacy among children provide useful information, but we would like to know their implications for the corresponding differences in completed educational attainment and labor market earnings among adults. For a subset of the sample used in Table 4, we can shed light on these issues by linking children observed in the 1930 Census to their records in the 1940 Census, which provide information about years of schooling and annual earnings 10 years later. We match Census records using the links provided by the Census Linking Project (Abramitzky et al. 2020). 11 Here, we restrict the analysis to males because surname changes upon marriage make it much more difficult to link female records across Censuses, particularly in situations such as ours in which few of the target individuals (ages 6 to 16 and living with both parents in 1930) will be married initially, but many will have married 10 years later.
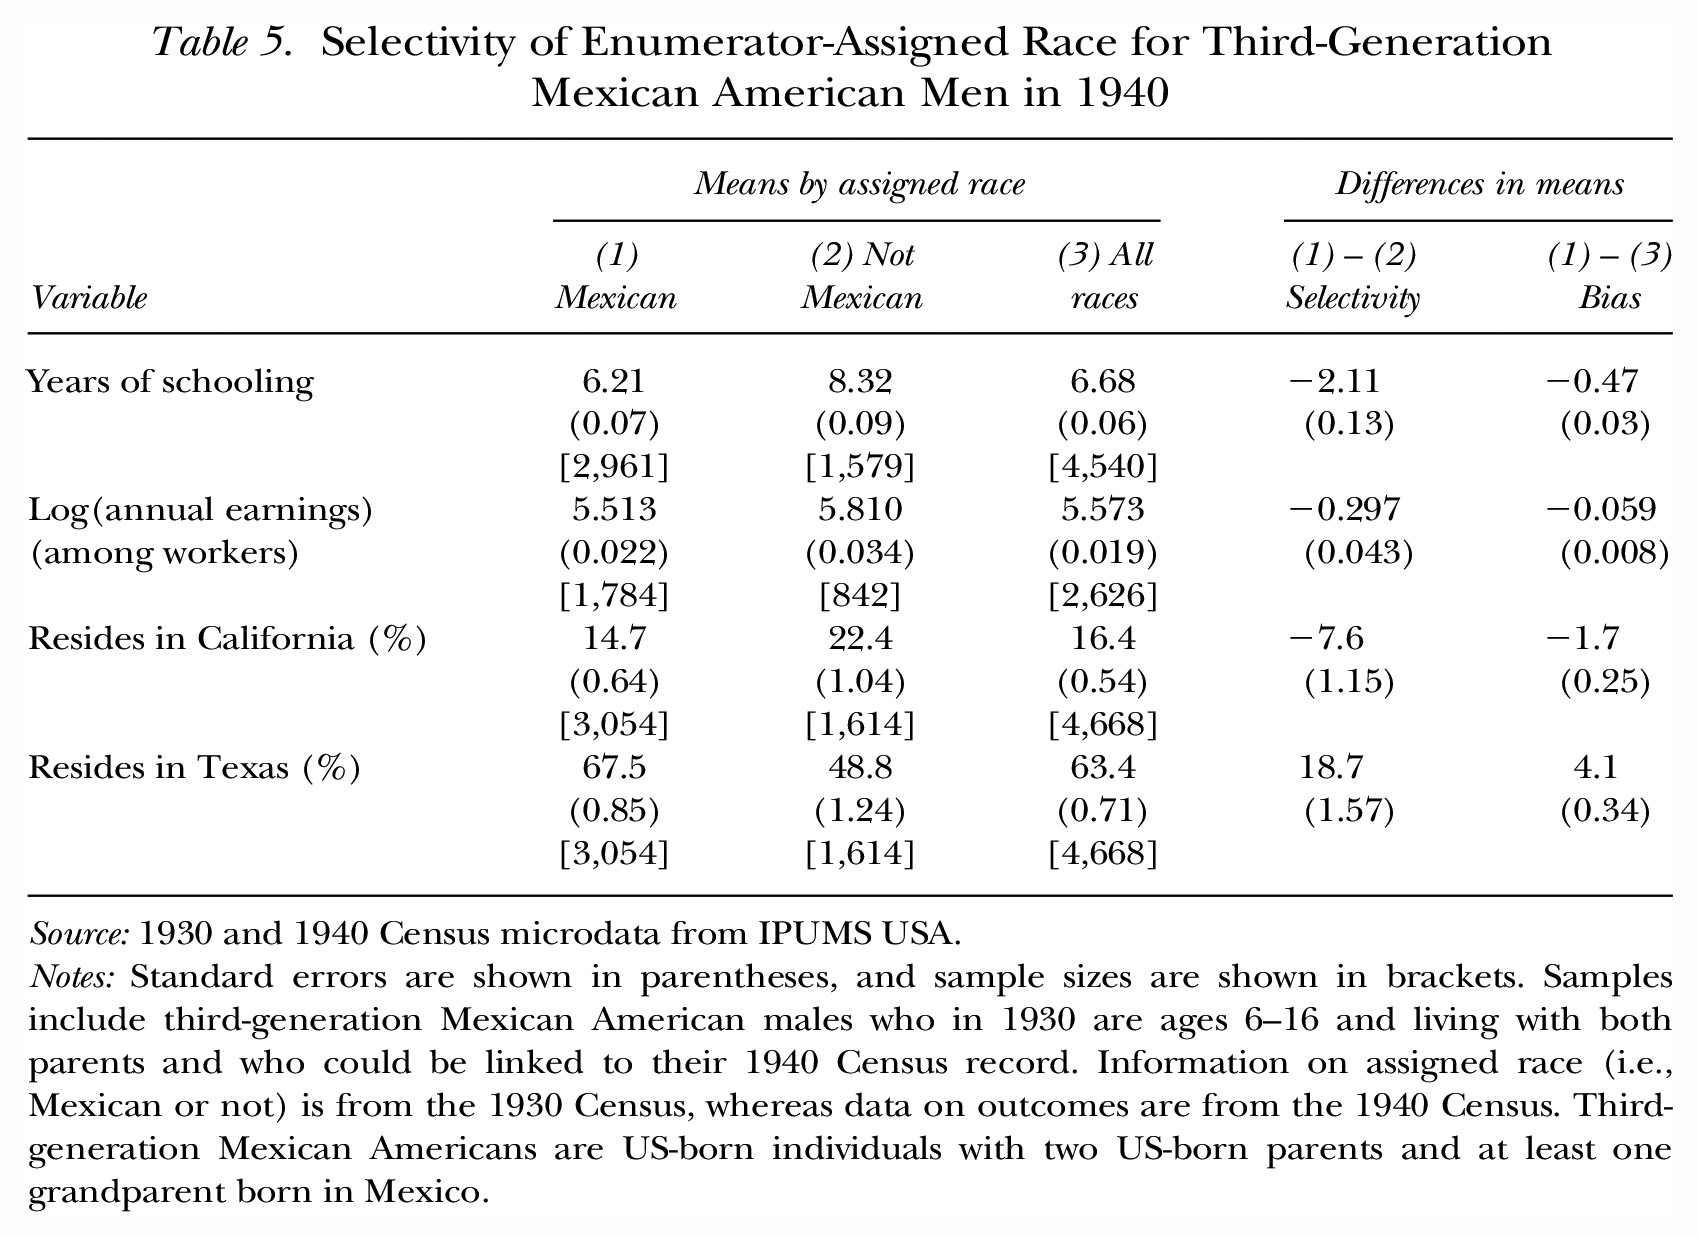
For the third-generation Mexican American males whom we could link between the 1930 and 1940 Censuses, Table 5 documents the selectivity of enumerator-assigned race and the biases that result from using these race data to identify the Mexican-origin population. 12 Third-generation Mexican American males who were assigned a race of Mexican in 1930 exhibit much less favorable outcomes in 1940 when compared to their counterparts who were not identified racially as Mexican. Specifically, those assigned a race of Mexican average two fewer years of schooling and 30% lower earnings, and they were substantially less likely to live in California (by 8 percentage points) and markedly more likely to live in Texas (by 19 percentage points). As a result, using enumerator-assigned race to identify Mexican Americans significantly underestimates both the educational attainment (by nearly half a year) and earnings (by 6%) of third-generation men, and doing so also understates (by 1.7 percentage points) this population’s presence in California and overstates (by 4.1 percentage points) its presence in Texas. To put some perspective on the magnitude of the bias in educational attainment, we note that using enumerator-assigned race implies schooling deficits (at ages 16 to 26) for third-generation Mexican American men of 3.9 years relative to US-born whites and 0.9 years relative to US-born blacks. Therefore, correcting for the almost half-year of bias created by using enumerator-assigned race reduces the Mexican American schooling deficit relative to whites by 12% and the corresponding deficit relative to blacks by 52%.
Selectivity of Enumerator-Assigned Race for Third-Generation Mexican American Men in 1940
Source: 1930 and 1940 Census microdata from IPUMS USA.
Notes: Standard errors are shown in parentheses, and sample sizes are shown in brackets. Samples include third-generation Mexican American males who in 1930 are ages 6–16 and living with both parents and who could be linked to their 1940 Census record. Information on assigned race (i.e., Mexican or not) is from the 1930 Census, whereas data on outcomes are from the 1940 Census. Third-generation Mexican Americans are US-born individuals with two US-born parents and at least one grandparent born in Mexico.
Our results regarding the selectivity and bias of ethnic attrition for third-generation Mexican Americans echo related findings by Kosack and Ward (2020). By observing children living with their parents in the 1910 Census, Kosack and Ward identified the countries of birth of these children’s parents and grandparents in the same manner we do here. They then linked the records of third-generation Mexican American males between the 1910 and 1940 Censuses to observe adult outcomes for this population. For their linked sample, they assessed the accuracy of the IPUMS Hispanic identifier created by Gratton and Gutmann (2000) that primarily uses the presence of a Spanish surname to uncover Mexican Americans beyond the second generation in Census data prior to 1980. 13 This proxy for Hispanic origin misses half of third-generation Mexican Americans, and the socioeconomic selectivity of the proxy is qualitatively similar to and quantitatively larger than what we document in Table 5 for enumerator-assigned race in the 1930 Census. As a result, Kosack and Ward (2020) showed that use of the IPUMS Hispanic identifier (in 1940 Census data) understates the education and earnings of third-generation Mexican Americans by an even greater amount than what we report here from using the Mexican race data uniquely available in the 1930 Census. 14
We have shown that, in the 1930 Census, enumerators assigned a non-Mexican race—predominantly white—to sizeable fractions of the Mexican-origin population. The chances of this happening were much greater for individuals with weaker or more distant ancestral ties to Mexico and for individuals possessing characteristics associated with better socioeconomic attainment (e.g., literacy, ability to speak English, and higher levels of education and earnings). The extent and strong selectivity of non-Mexican racial identification combine to create significant biases when enumerator-assigned race is used to define the Mexican-origin population. In particular, analyses based on Mexican race understate the socioeconomic attainment of Mexican Americans. These findings are remarkably similar to those reported in studies of ethnic identification among Mexican Americans using recent data (Duncan and Trejo 2011, 2017), despite the fact that race/ethnicity was assigned by Census enumerators in 1930 and is self-reported by the respondent in contemporary data. The similar patterns are consistent with evidence from longitudinal data suggesting that a respondent’s chances of being classified racially as white increase with their social and economic standing, regardless of whether this classification is done by the interviewer or by the respondent (Penner and Saperstein 2008).
Geographic Variation in the Racial Identification of Mexican Americans
Next, we use the 1930 Census data to document and analyze geographic variation in how Census enumerators assigned race to Mexican Americans. We argue that this variation seems to provide useful information about the local environment for Mexican Americans and whether it helps or hinders their integration.
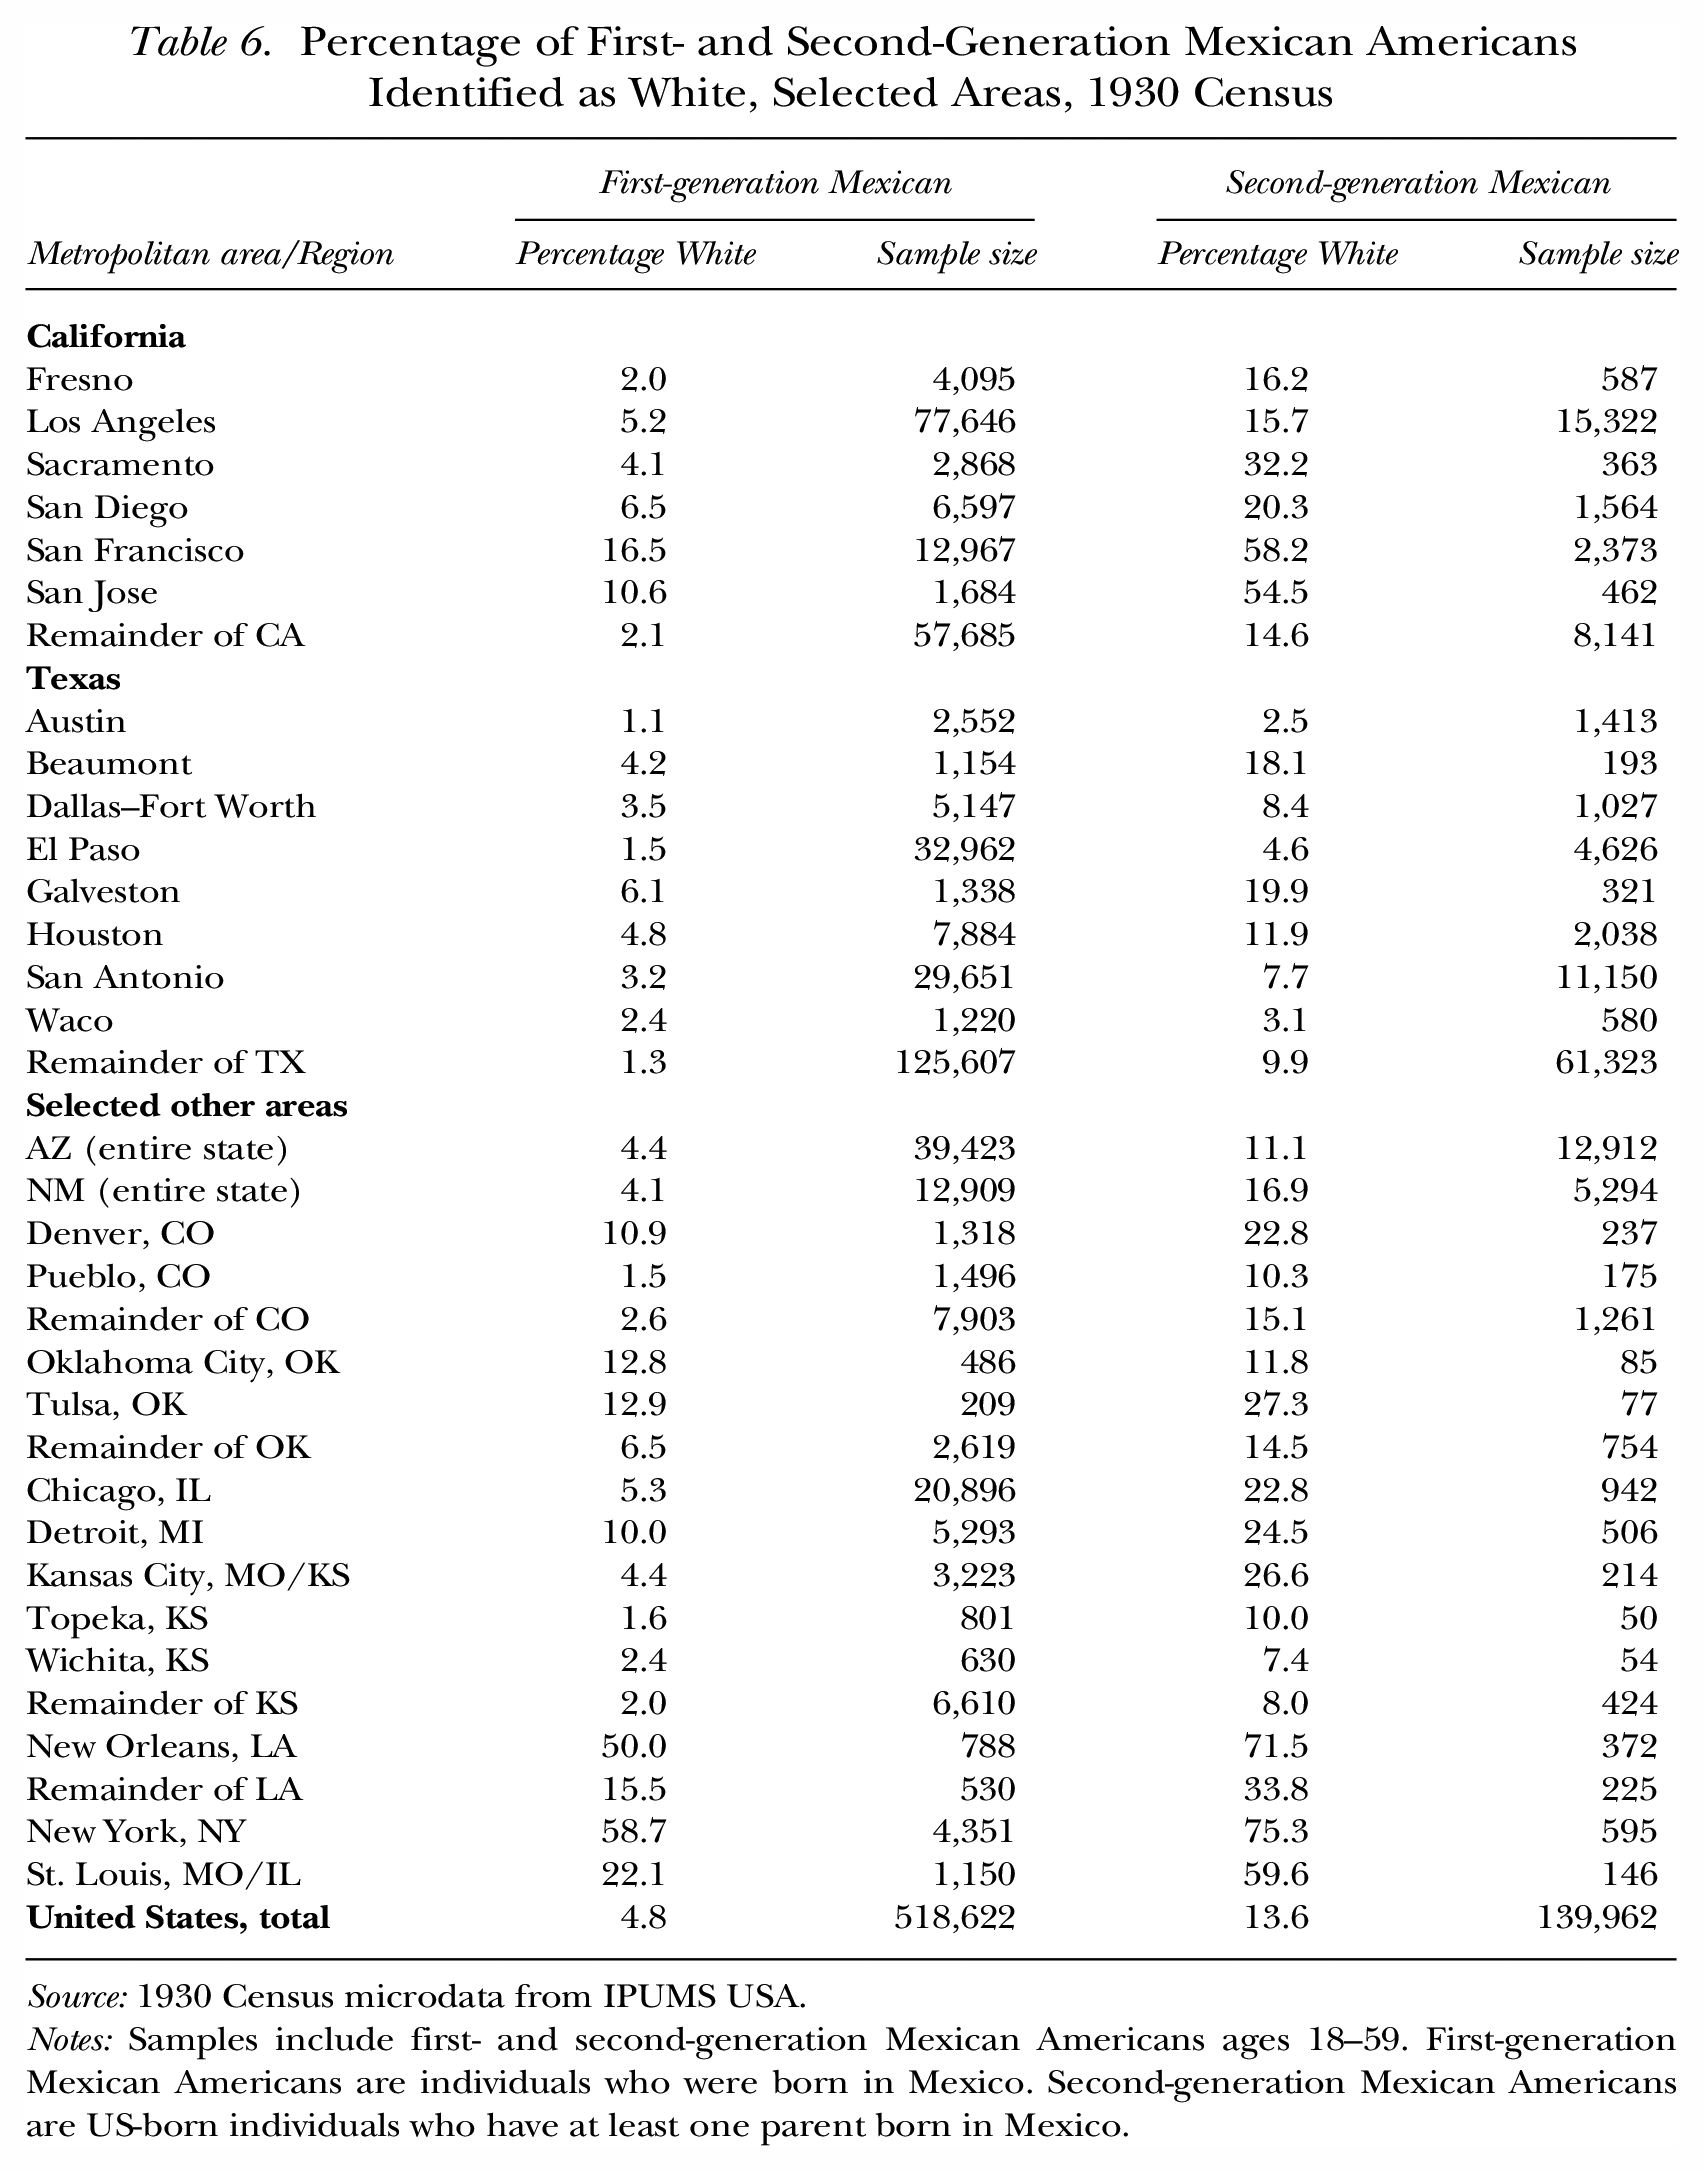
For first- and second-generation Mexican American adults (ages 18 to 59) in the 1930 Census, Table 6 reports the percentage of individuals assigned a race of “white” for selected metropolitan areas, states, and parts of states. 15 The table also shows the sample sizes for these calculations. Because the underlying data are complete counts (i.e., 100% sample) from the 1930 Census, the reported sample sizes represent the populations of first- and second-generation Mexican American adults in each location.
Percentage of First- and Second-Generation Mexican Americans Identified as White, Selected Areas, 1930 Census
Source: 1930 Census microdata from IPUMS USA.
Notes: Samples include first- and second-generation Mexican Americans ages 18–59. First-generation Mexican Americans are individuals who were born in Mexico. Second-generation Mexican Americans are US-born individuals who have at least one parent born in Mexico.
For the United States as a whole, 4.8% of Mexican immigrants and 13.6% of second-generation Mexican Americans were assigned a race of white, but this rate varies enormously across locations. For example, across Texas metropolitan areas, the percent of second-generation Mexican Americans labeled as white ranges from 2.5% in Austin to 8.4% in Dallas–Fort Worth to 19.9% in Galveston. This rate is generally higher in California than in Texas, but it also varies widely across California metropolitan areas: from 15.7% in Los Angeles and 20.3% in San Diego to 32.2% in Sacramento to more than 50% in San Jose and in San Francisco. The chances of Mexican American adults being identified as white increase with individual characteristics suggestive of assimilation, such as literacy, ability to speak English, occupational income score, and home ownership, but controlling for these variables and a rich set of other characteristics does not change the patterns of variation across geographic locations.
This information regarding how Census enumerators assigned racial labels to US-born Mexican Americans in 1930 potentially provides a valuable window into local attitudes toward Mexican ethnics. The resulting geographic variation seems consistent with historical accounts of how attitudes toward and treatment of Mexican Americans differed across cities and regions. For example, Montejano (1987) reported wide variation in Mexican-Anglo relations across the farm and ranch counties of South Texas during the 1920s and 1930s. In addition, Weise (2008: 749) described how Mexican immigrants and US-born Mexican Americans who settled in New Orleans eventually came to “claim their place as European-style white immigrants and escape racialization as a distinct group.” Consistent with this account, Table 6 shows that Mexican Americans in the New Orleans metropolitan area had very high rates of being classified racially as white in the 1930 Census. The relevant rates are 50.0% for Mexican immigrants and 71.5% for second-generation Mexican Americans. Also note that the rates for New Orleans are much higher than the corresponding rates for the remainder of Louisiana: 15.5% for Mexican immigrants and 33.8% for second-generation Mexican Americans.
Association with Educational Attainment in 1940
We wish to explore whether geographic variation in the racial identification of Mexican Americans in 1930 is associated with how the integration and well-being of this population differed across locations. Specifically, did Mexican Americans seem to fare better in communities in which they were more likely to be classified racially as white rather than non-white? Initially, we examine this question using educational attainment in 1940 as an indicator of integration.
First, we use 1930 Census microdata to characterize variation across counties in the propensity for enumerators to assign a race of white to Mexican Americans. We restrict the sample to second-generation Mexican Americans ages 18 to 59 who reside in the states of Arizona, California, New Mexico, or Texas. Because we use variation at the county level, we further restrict the sample to individuals living in a county that has at least 100 second-generation Mexican Americans ages 18 to 59 in the 1930 Census. 16 These restrictions produce a sample of 124,913 second-generation Mexican Americans living in 137 counties.
For this sample, we estimate the following regression (i.e., linear probability model):

where
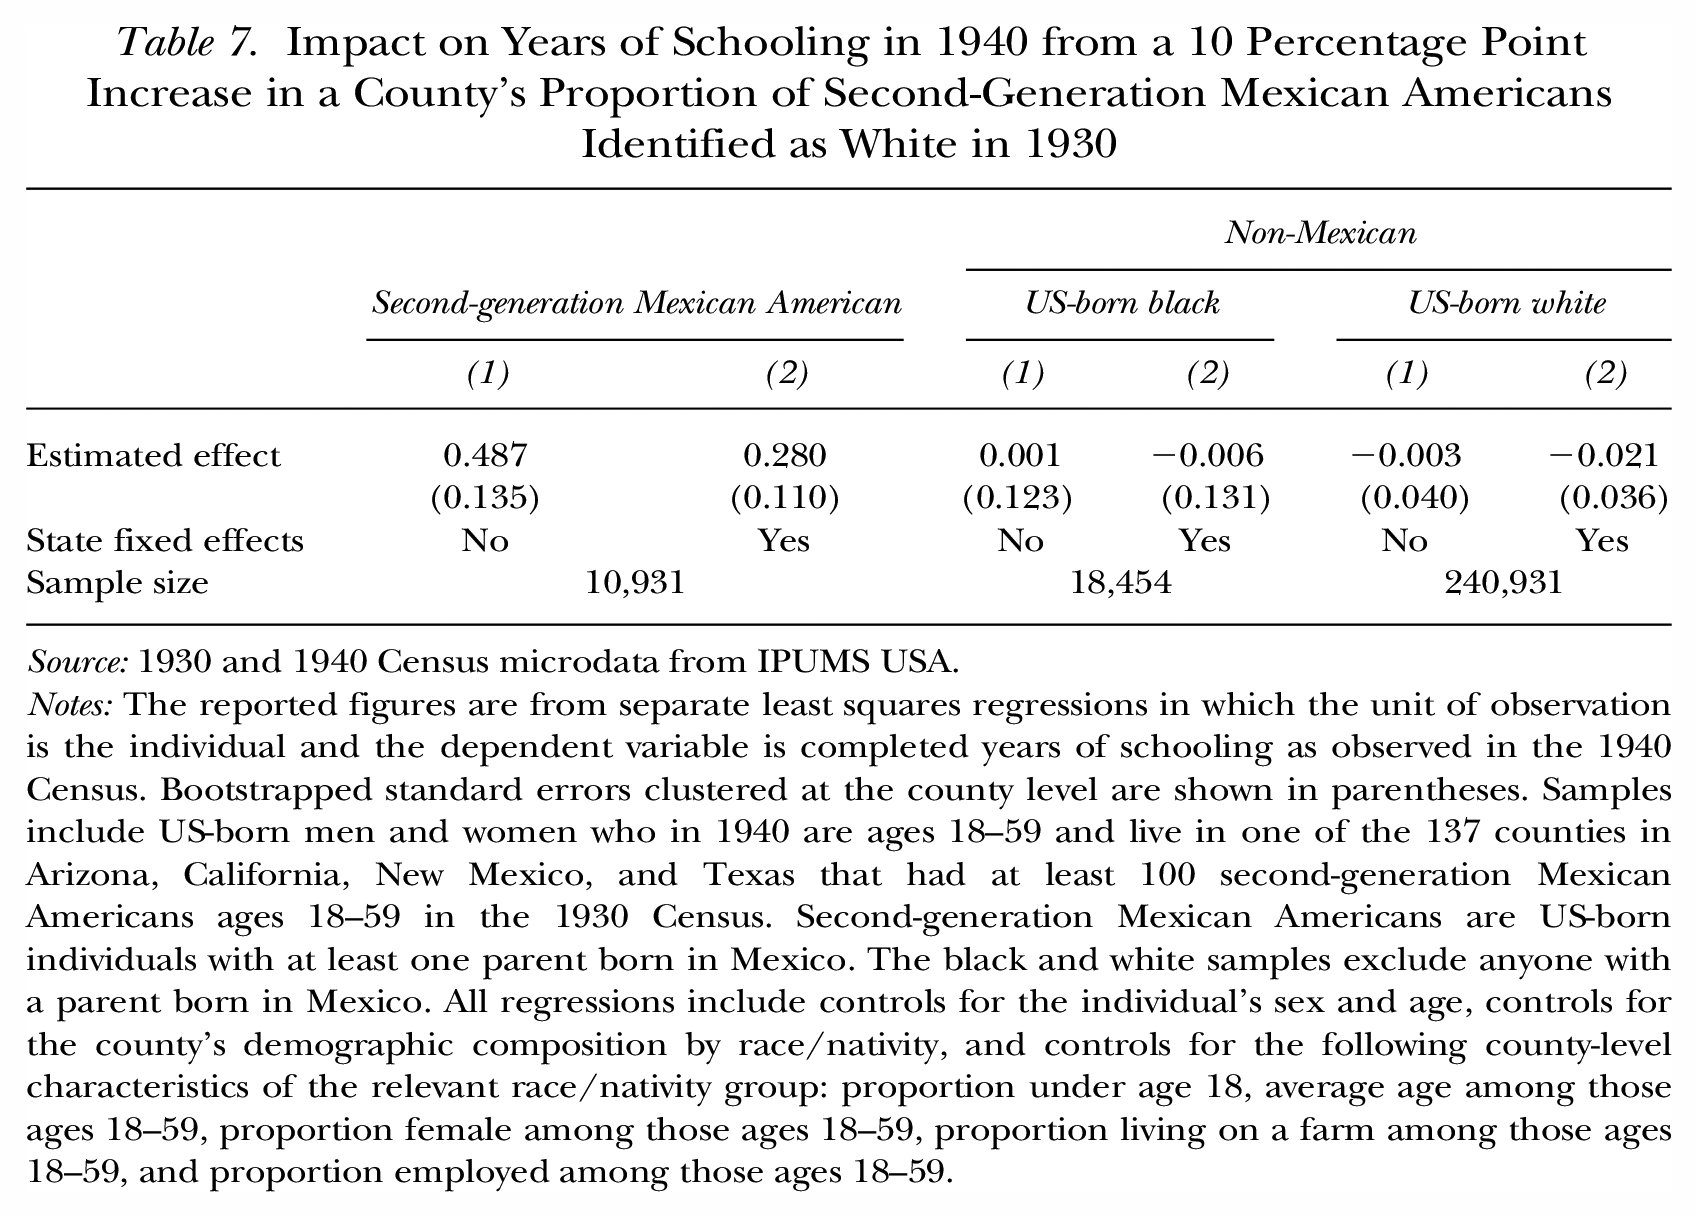
We then investigate how the county fixed effects are associated with the educational attainment of Mexican Americans and other groups in 1940. Using microdata on US-born men and women ages 18 to 59 from the 1940 Census, we regress an individual’s completed years of schooling on the county fixed effects in Mexican racial identification estimated from the 1930 Census and a set of individual-level and county-level control variables. 18 Separate regressions are estimated for three groups: second-generation Mexican Americans, US-born blacks, and US-born whites. 19 From these regressions, Table 7 reports the estimated impact on schooling of living in a county with a 10 percentage point higher rate of Mexican Americans being identified as white in 1930. 20 Specification (2) adds state fixed effects and therefore exploits only the variation that occurs across counties within a state. This specification substantially reduces the estimated effect for Mexican Americans. Both education levels and rates of Mexican Americans being identified as white tend to be much higher in California than in Texas, for example, so estimates without state fixed effects may overstate the impact of county-level racial identification by also capturing unobserved differences between states.
Impact on Years of Schooling in 1940 from a 10 Percentage Point Increase in a County’s Proportion of Second-Generation Mexican Americans Identified as White in 1930
Source: 1930 and 1940 Census microdata from IPUMS USA.
Notes: The reported figures are from separate least squares regressions in which the unit of observation is the individual and the dependent variable is completed years of schooling as observed in the 1940 Census. Bootstrapped standard errors clustered at the county level are shown in parentheses. Samples include US-born men and women who in 1940 are ages 18–59 and live in one of the 137 counties in Arizona, California, New Mexico, and Texas that had at least 100 second-generation Mexican Americans ages 18–59 in the 1930 Census. Second-generation Mexican Americans are US-born individuals with at least one parent born in Mexico. The black and white samples exclude anyone with a parent born in Mexico. All regressions include controls for the individual’s sex and age, controls for the county’s demographic composition by race/nativity, and controls for the following county-level characteristics of the relevant race/nativity group: proportion under age 18, average age among those ages 18–59, proportion female among those ages 18–59, proportion living on a farm among those ages 18–59, and proportion employed among those ages 18–59.
The estimates in Table 7 indicate that county-level variation in the racial identification of Mexican Americans in 1930 is strongly related to the educational attainment of Mexican Americans observed in the 1940 Census, even when focusing on within-state variation. In terms of the predicted probability that a second-generation Mexican American was identified as white in 1930, this probability for Jefferson County, Texas (home to the city of Beaumont) is 10 percentage points higher than it is for Dallas County, Texas (home to the city of Dallas). According to the specification (2) estimates presented in Table 7, a 1930 differential in Mexican racial identification of this magnitude is associated with an average schooling advantage in 1940 of more than one-quarter of a year for second-generation Mexican Americans in Beaumont. For blacks and whites, by contrast, this same association is very weak and not close to being statistically significant. Our Mexican racial identification measure appears to capture something about counties that improves educational outcomes for Mexican Americans but not for other groups.
Association with Mexican Repatriation during the 1930s
We conducted one other exploration along these lines. During the economic upheaval of the 1930s, many Mexican-origin people living in the United States returned to Mexico. The best estimates suggest that approximately 400,000 first- and second-generation Mexican Americans returned to Mexico (Gratton and Merchant 2013; Lee, Peri, and Yasenov 2019). Most of the second-generation returnees were children living with their Mexican immigrant parents. Some of this unusually high level of return migration was in response to coercion, pressure, or inducement (e.g., payment of train fare) by local governments in the United States, but much of the return migration was voluntary in response to the depressed economy. We investigate whether the amount of “Mexican repatriation” that a county experienced between 1930 and 1940 was associated with the proportion of second-generation Mexican Americans who were identified racially as white in 1930. If a higher rate of white identification characterizes counties with a less hostile environment toward Mexican immigrants, we would expect a lower rate of return migration to Mexico from such counties.
A crude measure of Mexican return migration during the 1930s is the net population change experienced by a given age cohort between the 1930 and 1940 US Censuses. In log terms, for individuals ages 18 to 59 in 1930:
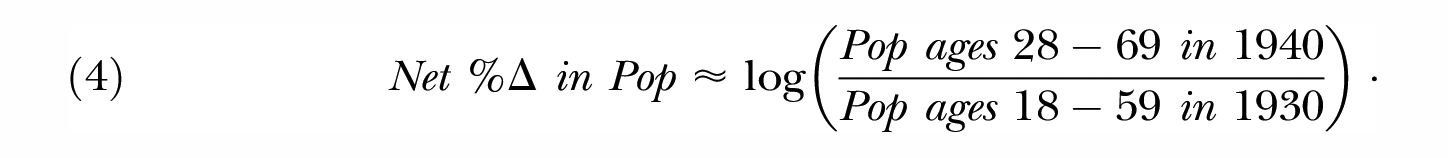
In addition to migration flows into or out of the United States, this measure will reflect mortality over the decade.
Table 8 reports, at the national level, net population change (in percentage terms) between 1930 and 1940, separately by age cohort and race/nativity. These calculations use the complete-count microdata samples of the 1930 and 1940 Censuses. Even this crude measure illustrates the much larger decline in adult population over this period for Mexican immigrants than for other adults. 21 Moreover, for non-Mexican groups, population losses were larger for older age cohorts, as we would expect from mortality. For Mexican immigrants, in contrast, population declines were very large and almost constant with age.
Net US Population Change between 1930 and 1940 Census, by Race/Nativity and Age Cohort
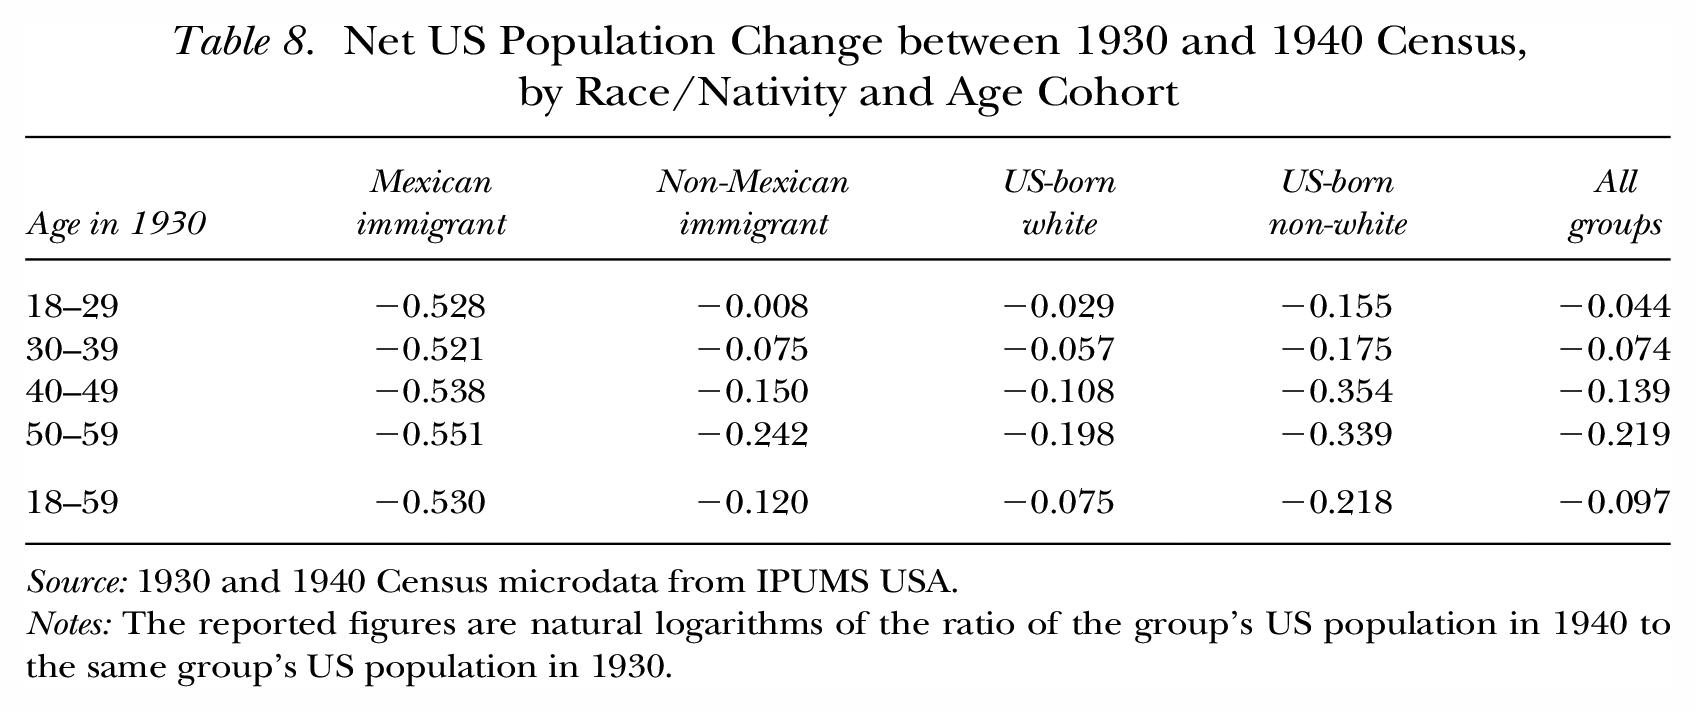
Source: 1930 and 1940 Census microdata from IPUMS USA.
Notes: The reported figures are natural logarithms of the ratio of the group’s US population in 1940 to the same group’s US population in 1930.
We constructed analogous measures of net population change at the county level for the 137 counties in Arizona, California, New Mexico, and Texas for which we estimated fixed effects for the proportion of second-generation Mexican Americans identified racially as white in 1930. In addition to international migration and mortality, these county-level measures reflect internal migration between counties within the United States. Nonetheless, these measures provide information about which counties were better able during the 1930s to retain Mexican-born individuals or to attract them either from other US counties or from Mexico.
Figure 1 displays frequency distributions of the county-level measures of net population change for each race/nativity group. These calculations are for individuals ages 18 to 59 in 1930 and 28 to 69 in 1940. In each graph, a vertical line at zero indicates the reference point of no net change in population. For these county-level measures, Mexican immigrants continue to stand out as having much greater population loss over the 1930s than the other groups. Indeed, almost every county in the sample experienced a decline in its population of Mexican immigrants, whereas for each of the other groups many counties experienced population gains. In addition, the distributions reveal wide variation across counties in net population change. 22 Is county-level variation in the racial identification of Mexican Americans related to these geographic differences in the extent of return migration by Mexican immigrants?
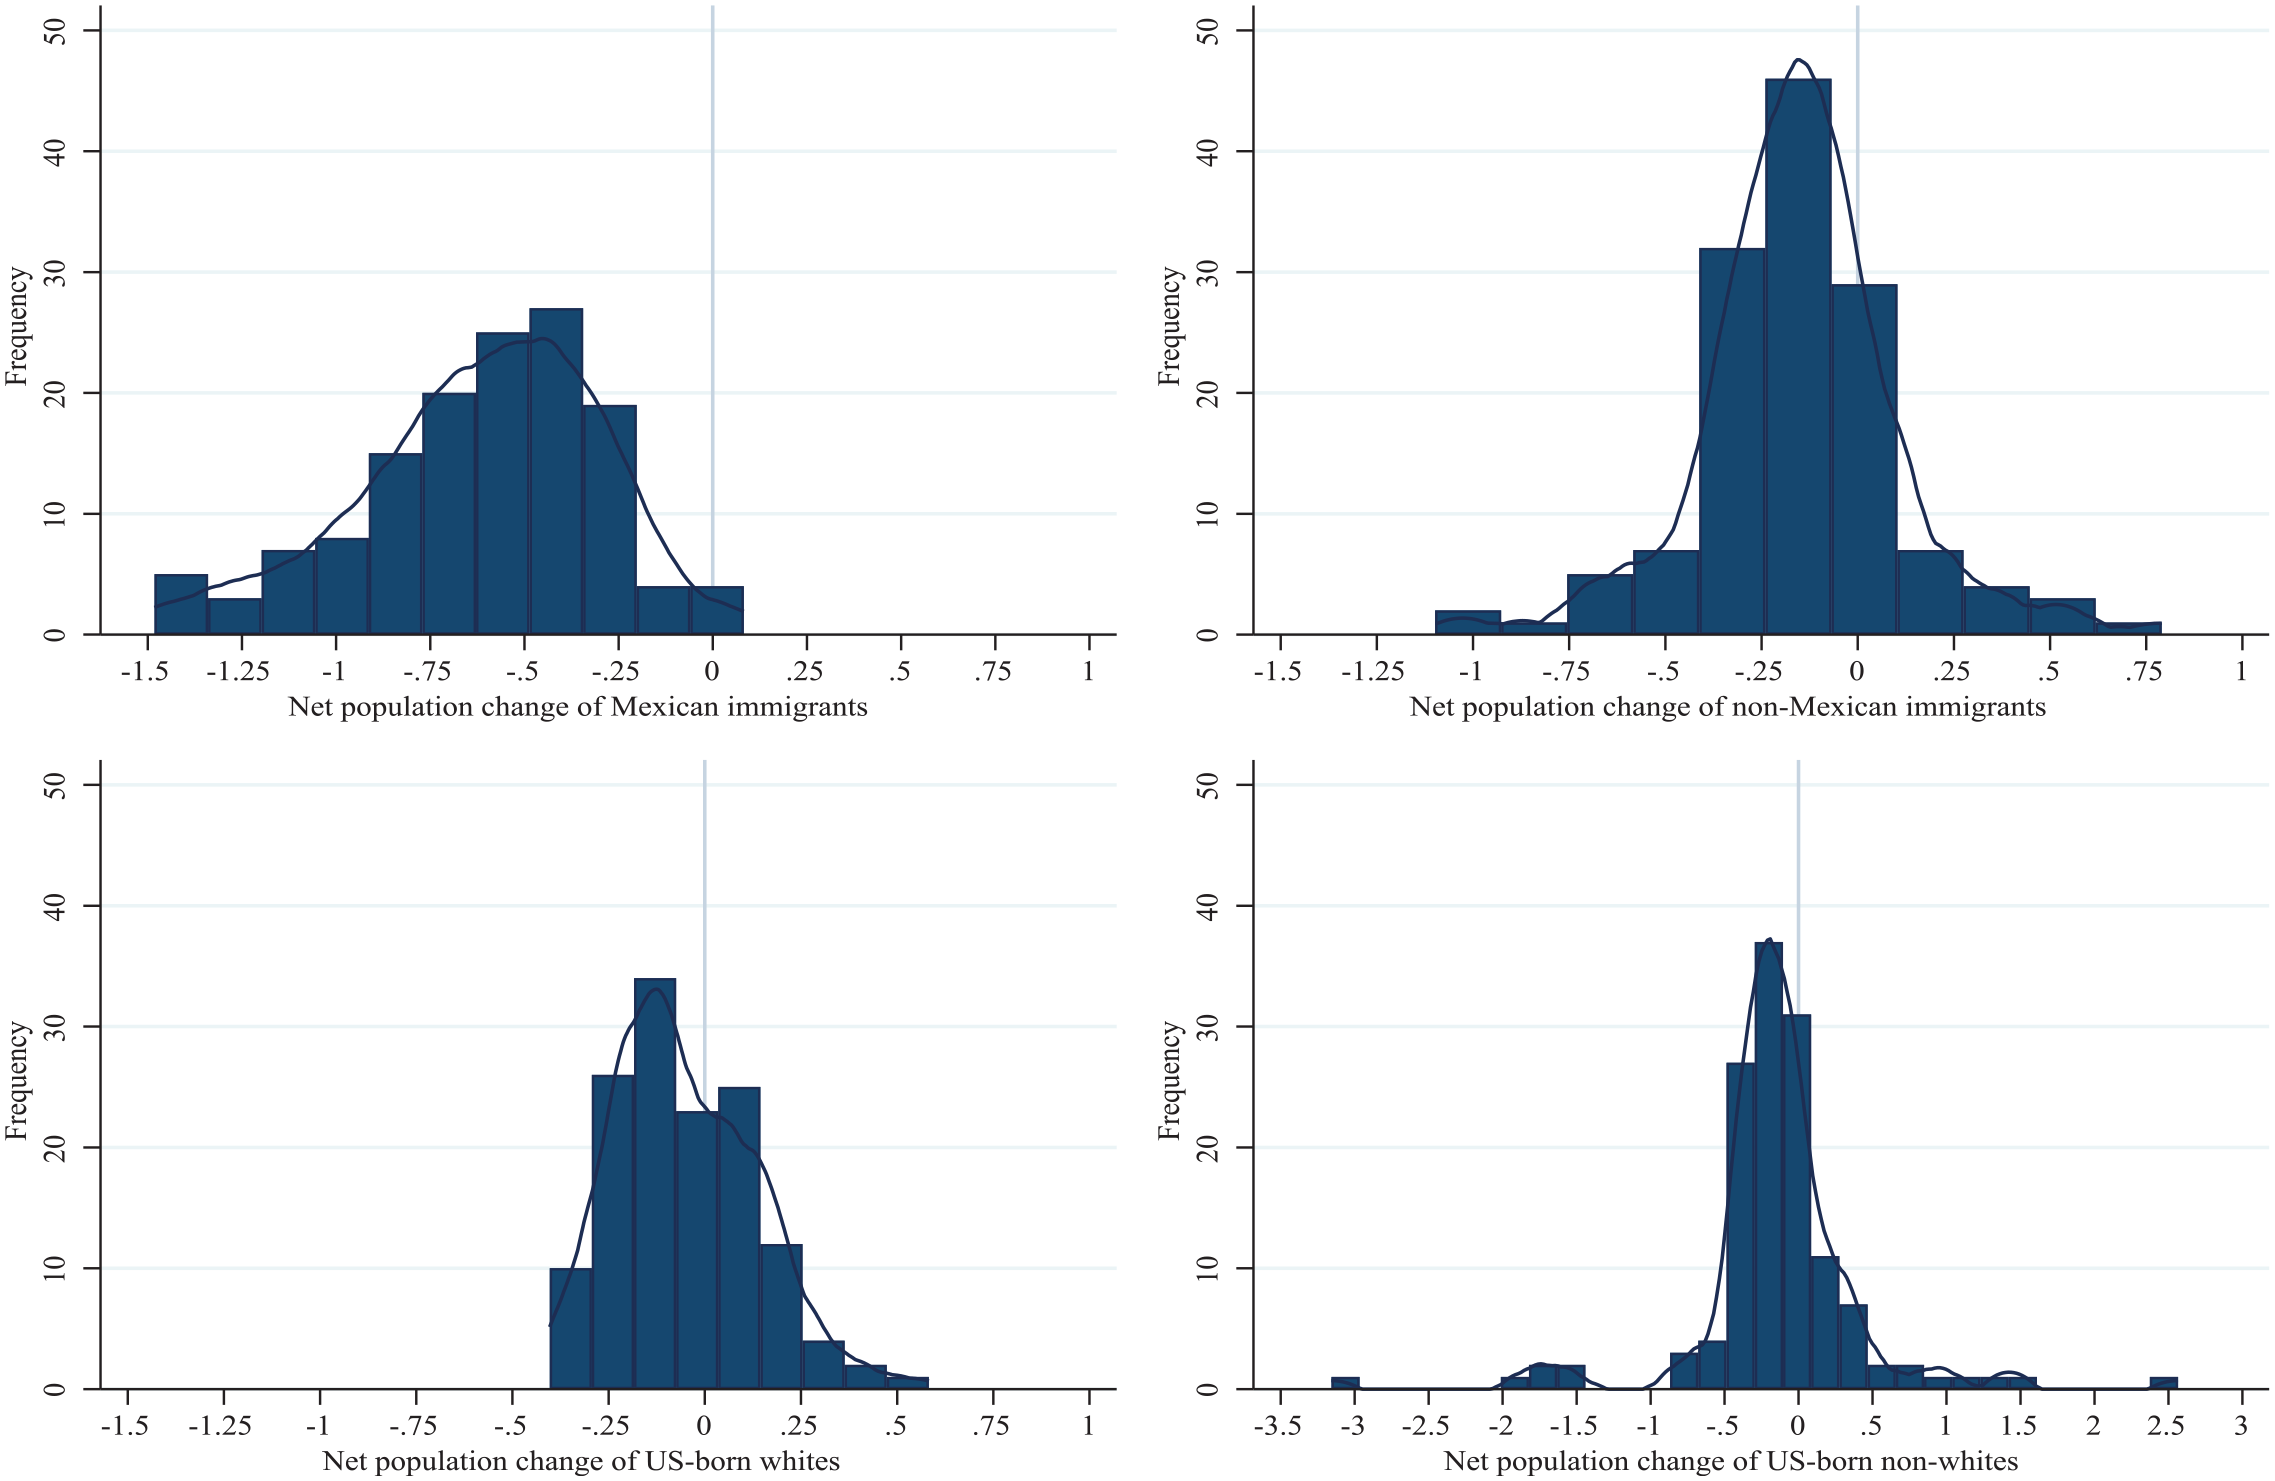
Frequency Distributions of County-Level Measures of Net Population Change between 1930 and 1940, by Race/Nativity
To answer this question, we regress net population change, as defined by Equation (4), on the county fixed effects in Mexican racial identification estimated from the 1930 Census. The unit of analysis is the county, and separate regressions are estimated for each race/nativity group. All regressions are weighted by the population ages 18 to 59 of the relevant race/nativity group residing in the county in 1930. The regressions include state fixed effects and controls for the county’s demographic composition by race/nativity and for the following characteristics of the relevant race/nativity group: proportion under age 18, average age among those ages 18 to 59, proportion female among those ages 18 to 59, proportion living on a farm among those ages 18 to 59, and proportion employed among those ages 18 to 59.
Table 9 reports the estimated impact on net population change from a county having a 10 percentage point higher proportion of Mexican Americans identified as white. As expected, a positive relationship is evident across counties between the rate at which Mexican Americans were identified as white in 1930 and the net population change for Mexican immigrants over the subsequent decade. Note that this same relationship is negative for all other groups. The estimated magnitude of the effect implies that, all else equal, a county with a 10 percentage point higher proportion of Mexican Americans identified as white in 1930 retained a 5.2% larger share of its Mexican immigrant population in 1940. In other words, counties in which Mexican Americans were more likely to be identified as white tended to experience less Mexican return migration over the 1930s. This finding provides additional evidence suggesting that the rate at which local Census enumerators assigned Mexicans Americans a race of white in 1930 may signal environments that were more favorable to the socioeconomic integration of Mexican ethnics.
Impact on a County’s Net Population Change between 1930 and 1940 from a 10 Percentage Point Increase in the County’s Proportion of Second-Generation Mexican Americans Identified as White in 1930
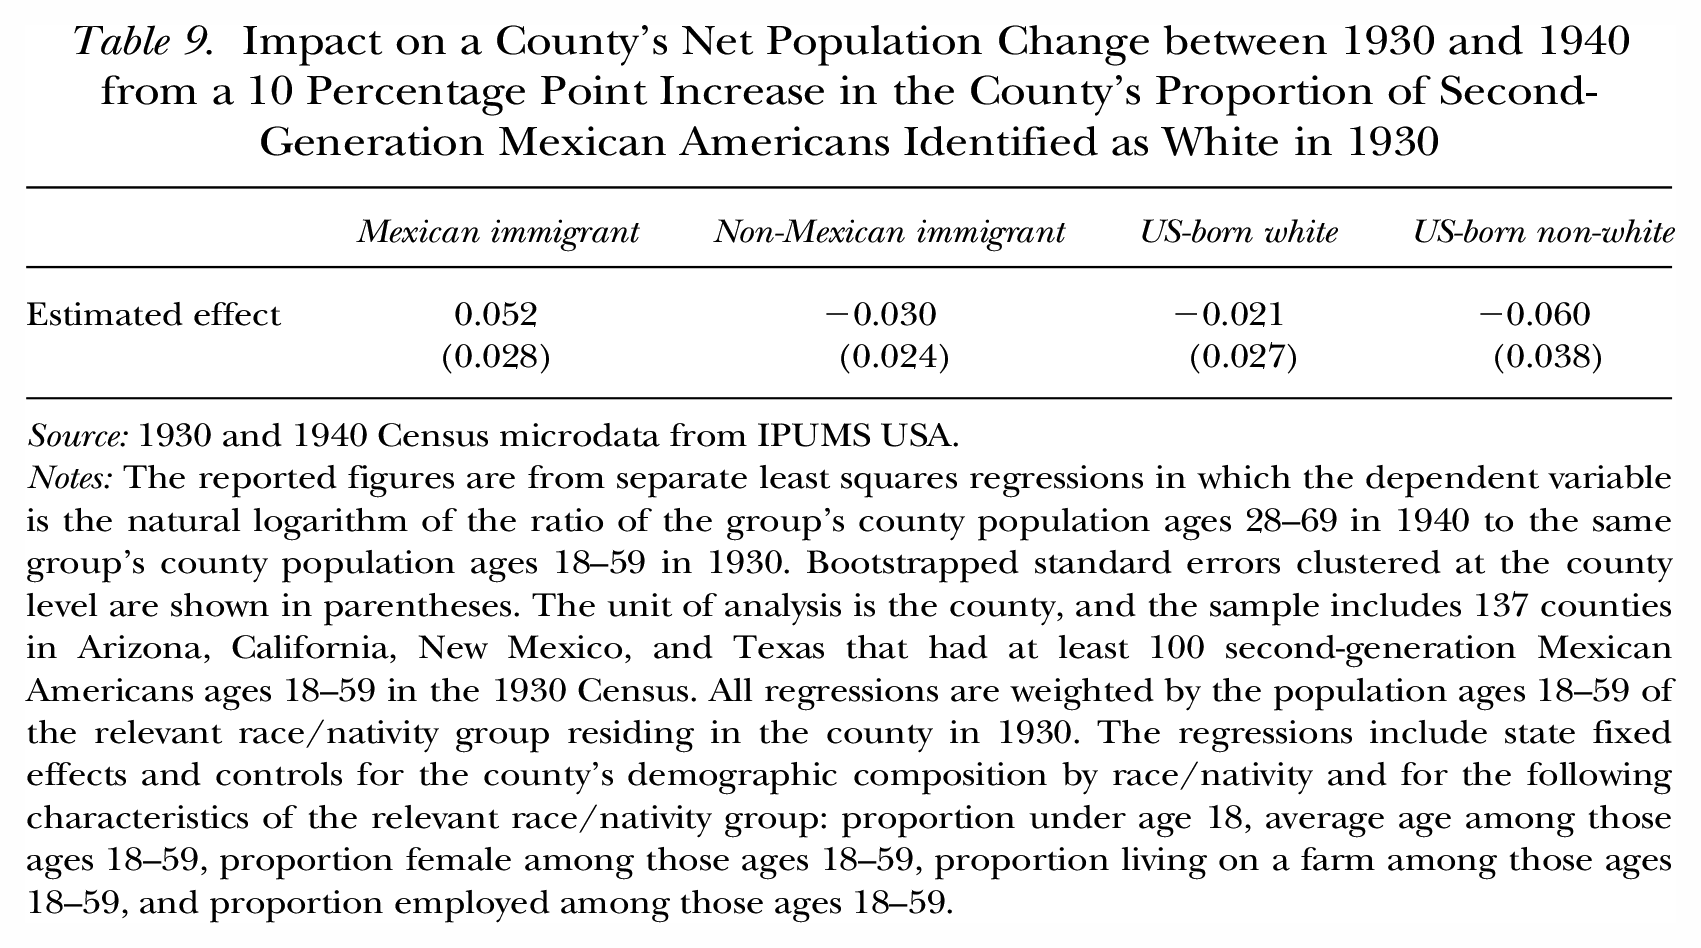
Source: 1930 and 1940 Census microdata from IPUMS USA.
Notes: The reported figures are from separate least squares regressions in which the dependent variable is the natural logarithm of the ratio of the group’s county population ages 28–69 in 1940 to the same group’s county population ages 18–59 in 1930. Bootstrapped standard errors clustered at the county level are shown in parentheses. The unit of analysis is the county, and the sample includes 137 counties in Arizona, California, New Mexico, and Texas that had at least 100 second-generation Mexican Americans ages 18–59 in the 1930 Census. All regressions are weighted by the population ages 18–59 of the relevant race/nativity group residing in the county in 1930. The regressions include state fixed effects and controls for the county’s demographic composition by race/nativity and for the following characteristics of the relevant race/nativity group: proportion under age 18, average age among those ages 18–59, proportion female among those ages 18–59, proportion living on a farm among those ages 18–59, and proportion employed among those ages 18–59.
Conclusion
In this article, we explore unique complete-count data from the 1930 Census in which a respondent’s race was assigned by enumerators and “Mexican” was one of the possible responses. Census enumerators frequently and selectively assigned a non-Mexican race—predominantly “white”—to US-born individuals of Mexican ancestry. Among the grandchildren of Mexican immigrants, for example, using enumerator-assigned race to identify Mexican Americans misses one-quarter of the relevant population and significantly understates this group’s literacy, ability to speak English, education, and earnings. Similar patterns are reported in studies of ethnic identification among Mexican Americans using recent data (Duncan and Trejo 2011, 2017), despite the fact that race/ethnicity was assigned by Census enumerators in 1930 and is self-reported by the respondent in contemporary data.
Even after controlling for a rich set of characteristics, the rate at which Mexican Americans were identified as white varies enormously across locations. The resulting geographic variation is consistent with historical accounts of how attitudes toward and treatment of Mexican Americans differed across cities and regions. We provide evidence that variation across counties in the racial identification of Mexican Americans in 1930 is associated with both the educational attainment of US-born Mexican Americans observed in the 1940 Census and the net change that occurred in the county’s Mexican-born adult population during the 1930s when large numbers of such individuals returned to Mexico. These findings suggest that the rate at which local Census enumerators assigned Mexican Americans a race of white in 1930 may help to identify environments that were more favorable to the socioeconomic integration of Mexican ethnics.
Footnotes
Acknowledgements
For helpful advice and comments, the authors are grateful to Catalina Amuedo-Dorantes, Francisca Antman, George Borjas, Alfonso Flores-Lagunes, Daniel Hamermesh, Gordon Hanson, Brian Kovak, Patrick Mason, Susan Pozo, Rhonda Sharpe, Jan Stuhler, and Zachary Ward. Data used in this article are publicly available from IPUMS
This article is part of a set of papers from a Festschrift honoring George Borjas.
Copies of the computer programs used to generate the results presented in the article are available from Brian Duncan at
1
A complete-count microdata sample also exists for the 1940 Census, but the information on parental countries of birth necessary to identify US-born Mexican Americans in 1940 is available only for “sample line” individuals, who represent a 5% random sample of the population.
3
5
After the 1930 Census, some Mexican Americans and the Mexican government lobbied against the use of Mexican as a race category, and this practice was discontinued (![]() ; Gratton and Merchant 2016). In later Censuses, most Mexican Americans were included in the race category “white,” although in recent Censuses increasing shares of Mexican Americans end up in the “other race” category (Humes, Jones, and Ramirez 2011). Starting with the 1970 Census, a separate question on Hispanic origin was added that allows individuals to self-identify as being of Mexican descent or ancestry (Humes and Hogan 2009).
; Gratton and Merchant 2016). In later Censuses, most Mexican Americans were included in the race category “white,” although in recent Censuses increasing shares of Mexican Americans end up in the “other race” category (Humes, Jones, and Ramirez 2011). Starting with the 1970 Census, a separate question on Hispanic origin was added that allows individuals to self-identify as being of Mexican descent or ancestry (Humes and Hogan 2009).
6
7
The third-generation Mexican American children we can identify in 1930 Census data must be living at home with their parents, and at least one of the parents must be a second-generation Mexican American. If enumerators tend to assign children the same race as their parents, then the rate of Mexican racial identification for third-generation adults might be lower than what we are able to observe for third-generation children.
8
All analyses in this article exclude the small number of individuals with any missing or imputed information regarding their race, own country of birth, mother’s country of birth, or father’s country of birth.
9
In the first half of the 20th century, Mexican Americans who grew up on farms were particularly disadvantaged, as were Mexicans Americans born in Texas rather than California (Montejano 1987; Bean, Brown, and Bachmeier 2015). By definition, first-generation Mexican Americans were born in Mexico, so in the top half of ![]() we report indicators for their current state of residence as of the 1930 Census (California or Texas, with all other states as the residual category). For the US-born second generation in the bottom half of the table, we instead report indicators for their state of birth.
we report indicators for their current state of residence as of the 1930 Census (California or Texas, with all other states as the residual category). For the US-born second generation in the bottom half of the table, we instead report indicators for their state of birth.
10
The occupational income score is the variable OCCSCORE constructed by IPUMS. This variable, based on each person’s reported occupation in the 1930 Census, represents the median total income (measured in hundreds of 1950 dollars) for workers in that occupation in 1950 who had positive income. This variable provides a continuous measure of the relative economic standing of a person’s occupation. We use occupational income because information on educational attainment and earnings did not start to be collected until the 1940 Census.
11
We report results that use matches based on the standard ![]() (ABE) algorithm with New York State Identification and Intelligence System (NYSIIS) names. This method results in the most matches. Alternatively, using the most conservative version of the ABE algorithm—which requires exact matches on name that are unique within a five-year age band—generates matched samples that are about half as large. Nonetheless, the standard and conservative ABE linking algorithms produce very similar results.
(ABE) algorithm with New York State Identification and Intelligence System (NYSIIS) names. This method results in the most matches. Alternatively, using the most conservative version of the ABE algorithm—which requires exact matches on name that are unique within a five-year age band—generates matched samples that are about half as large. Nonetheless, the standard and conservative ABE linking algorithms produce very similar results.
12
Linking records across Censuses often creates samples that are no longer representative of the target population (Bailey, Cole, and Massey 2020; Abramitzky et al. 2021). To increase the representativeness of our linked sample, we follow procedures described in the Census Linking Project (![]() ) to create weights using the following observable characteristics from 1930 Census records: age, race, Mexican ancestry, state of residence, farm residence, rural residence, school enrollment, literacy, and ability to speak English.
) to create weights using the following observable characteristics from 1930 Census records: age, race, Mexican ancestry, state of residence, farm residence, rural residence, school enrollment, literacy, and ability to speak English.
14
The analysis of attrition and bias from using the IPUMS Hispanic identifier in Census data prior to 1980 is only a small part of the ![]() : 978–980) study. Their primary focus is measuring for Mexican Americans their occupational progress across immigrant generations and their rate of upward economic mobility between fathers and sons. By contrast, our article examines in detail the usefulness of the Mexican race category available in the 1930 Census.
: 978–980) study. Their primary focus is measuring for Mexican Americans their occupational progress across immigrant generations and their rate of upward economic mobility between fathers and sons. By contrast, our article examines in detail the usefulness of the Mexican race category available in the 1930 Census.
15
As shown earlier in ![]() , Census enumerators in 1930 rarely assigned Mexican Americans a race other than “Mexican” or “white.” Among Mexican immigrants, 94.9% were assigned a race of Mexican and almost all remaining individuals were assigned a race of white, with only 0.3% of individuals assigned any other race. Among second-generation Mexican Americans, 85.0% were assigned a race of Mexican and 1.4% were assigned other non-white races (primarily “black” and “American Indian”).
, Census enumerators in 1930 rarely assigned Mexican Americans a race other than “Mexican” or “white.” Among Mexican immigrants, 94.9% were assigned a race of Mexican and almost all remaining individuals were assigned a race of white, with only 0.3% of individuals assigned any other race. Among second-generation Mexican Americans, 85.0% were assigned a race of Mexican and 1.4% were assigned other non-white races (primarily “black” and “American Indian”).
16
Of the relevant population of second-generation Mexican Americans, 93% reside in the selected states, and 96% of the relevant Mexican Americans in these states live in a county that meets the sample size threshold.
17
18
All regressions include controls for the individual’s sex and age, controls for the county’s demographic composition by race/nativity, and controls for the following county-level characteristics of the relevant race/nativity group: proportion under age 18, average age among those ages 18–59, proportion female among those ages 18–59, proportion living on a farm among those ages 18–59, and proportion employed among those ages 18–59.
19
The black and white samples exclude anyone with a parent born in Mexico.
20
21
We focus our analysis of return migration on Mexican immigrants rather than US-born Mexican Americans for two reasons. First, as mentioned earlier, Mexican immigrants make up the overwhelming majority of adult returnees. Second, because the information on parental countries of birth necessary to identify second-generation Mexican Americans is available for only a 5% random sample of the population in the 1940 Census, the sample sizes are too small to reliably estimate net population change between 1930 and 1940 at the county level for second-generation Mexican Americans.
22
Note that the graph for US-born non-whites in the lower right quadrant of ![]() has a different scale for the horizontal axis than do the other three graphs. This group had some counties that experienced very large positive or negative percentage changes in net population between 1930 and 1940, in part because some counties had very few observations of US-born non-whites.
has a different scale for the horizontal axis than do the other three graphs. This group had some counties that experienced very large positive or negative percentage changes in net population between 1930 and 1940, in part because some counties had very few observations of US-born non-whites.