
Abstract
This article is based on an empirical study and deals with the service users of Sewa Kendras and Saanjh Kendras in the SAS Nagar district of the Punjab state. The article relates to the viewpoints of the service users of Sewa and Saanjh Kendras to assess the perceptions of service users regarding the implementation of the Punjab Right to Service Act, 2011, in the SAS Nagar district. By perception, it tries to figure out the awareness and satisfaction levels of service users regarding the delivery of services at these Kendras working under the Punjab Right to Service Act, 2011. In order to form an estimate of the perception of the service users, an interview schedule was administered to a randomly selected sample of 300 citizens, who were receiving services at Sewa and Saanjh Kendras of all the Tehsils of the SAS Nagar district.
Introduction
The Right to Service is a growing concept. It is committed to provide security in the matter of public services and protects the interests of the citizens by specifying the public service performance standards. A good development strategy of the government always requires an efficient and timely delivery of public services to citizens in order to ensure good governance in the society. ‘Right to Public Service Delivery is a mechanism of the most crucial significance in the entire range of issues related to governance in a nation. Public service delivery affects the lives of almost every citizen of a country, directly or indirectly. It also affects the entire life-cycle of a citizen right from the birth to death’ (Jain & Jain, 2011).
Right to Service represents the commitment of a particular state towards standard, transparency, accountability, quality and timeframe of service delivery and grievance redressal mechanism. The Right to Service is an authentic platform for providing clear, precise and enforceable laws in the form of Public Service Guarantee. It is aimed at ensuring time-bound delivery of public services to the citizens by providing them with necessary arrangements. It enables the service seekers to avail the services from the government departments with minimum inconvenience and maximum speed.
‘Right to Service’ is defined under Section 2(g) of the Punjab Right to Service Act, 2011, as ‘a right to obtain service within the given time limit’. Section 3(1) of this Act states that ‘the State Government may, by notification from time to time, notify the services, to which this Act shall apply’ (Government of Punjab, 2011).
It means ‘Right to Service’ is some of the commonly provided public services, including issuance of caste, birth, marriage and domicile certificates, electricity connections, voters’ cards, ration cards, copies of land records and so on, within fixed timeframes. The public services which are granted as rights are generally notified from time to time through Gazette notifications.
Research Methodology
The interview schedule method has been applied to collect primary data of the SAS Nagar district. Sewa Kendras and Saanjh Kendras (service delivery centres) have been selected to collect the primary data of the study because Sewa and Saanjh Kendras are the main service providers under the Punjab Right to Service Act, 2011. In order to form an estimate of the perception of the service users, an interview schedule was administered to a randomly selected sample of 300 citizens who were receiving services at Sewa and Saanjh Kendras of all the Tehsils of the SAS Nagar district. Detailed schedules comprising both close-ended and open-ended questions were prepared, keeping the objectives of research in mind. The collected data have been edited and tabulated through simple statistical techniques. The data are also presented by pie charts.
A sample of 300 service users from various sections of the society have been selected from the SAS Nagar district. Therefore, 240 service users (80 from each Tehsil) have been chosen randomly from the Sewa Kendra and 60 service users (20 from each Tehsil) have been chosen randomly from Saanjh Kendra to collect the relevant data. The sample of Saanjh Kendra is one-fourth of the population of the Sewa Kendra giving a right proportion of the members because Saanjh Kendra was one-fourth of Sewa Kendra in the SAS Nagar district, that is, eighty Sewa Kendra and twenty Saanjh Kendra. The study has been conducted in both rural and urban areas.
Right to Service in Punjab State
Punjab Governance Reforms Commission (PGRC) was constituted to study the existing system and recommend citizen-friendly practices to the government. Based on the recommendations of the PGRC, the government promulgated an Ordinance on 12 July 2011, called the Punjab Right to Services Ordinance, 2011. The Ordinance came into force with effect from 28 July 2011. The ordinance later on took the shape of Punjab Act No. 24 of 2011, named the Punjab Right to Service Act, 2011 (PRTS Act, 2011) which was notified vide notification no. 37-Leg/2011, Legislature of the state of Punjab, after receiving the assent of the Governor of Punjab on the 19 October 2011. PRTS Act, 2011, was published for general information on 20 October 2011 in the Punjab Government Gazette and came into effect from 20 October 2011 (Singh, 2016).
Punjab is the first state in north-western region of the country to have passed this Act. It is considered a major administrative reform aimed at providing citizens’ services to the people as a right. The Act defines ‘Right to Service’ as the right to obtain service within the stipulated time limit. Initially, it covered sixty-seven services rendered by eleven departments (Government of Punjab, 2011). However, the number of services has gone up to 351. These services are rendered by twenty-three departments under the nodal department ‘Department of Governance Reforms and Public Grievances’ (Department of Governance Reforms, 2016).
After that, in a major initiative to ensure the delivery of public services to the citizens in a more transparent and accountable manner, the Punjab Cabinet on 20 December 2017 gave its nod to the Punjab Transparency and Accountability in Delivery of Public Services Ordinance, 2017 (
Kendras/Centres in Punjab State
Sewa Kendra, Saanjh Kendra, Fard Kendras (land record centres) and transport centre are working in the Punjab state. These centres/Kendras provide services to the public as a ‘Right’ under the Punjab Right to Service Act, 2011, later changed to the Punjab Transparency and Accountability in Delivery of Public Service Act, 2018. The number of Sewa and Saanjh Kendras is very high compared to other centres/Kendras and most of the services are provided by Sewa Kendra and Saanjh Kendra under the rule of Right to Service Act. It means Sewa Kendras and Saanjh Kendras are the main service providers under the Right to Service Act. Sewa Kendras are providing general services and Saanjh Kendras are providing police-related services (Singh, 2019).
Three types of Sewa Kendras and Saanjh Kendras are in existence at present. Type I Sewa Kendras are working in district headquarters, Type II are working in semi-urban areas and Type III are working in rural areas. Type I Saanjh Kendras are working at district headquarters level, Type II at sub-division level and Type III at the police station level. There are some variations in the number of services provided by Type I, Type II, Type III Sewa Kendras and Saanjh Kendras. Most of the services are provided by Type I Sewa and Saanjh Kendras, because Type I Sewa and Saanjh Kendras are situated at district headquarters (Singh, 2019).
Findings of the Study: Socio-economic Profile of the Service Users
It is important to contextualise the socio-economic situation of the service users and relate them to their access to rights and their levels of awareness. A study of the socio-economic environment also provides an indication of the awareness of an individual. Under the socio-economic profile, age, gender, category and education of the respondents have been included in this study (Table 1).
Social Profile of the Respondents.
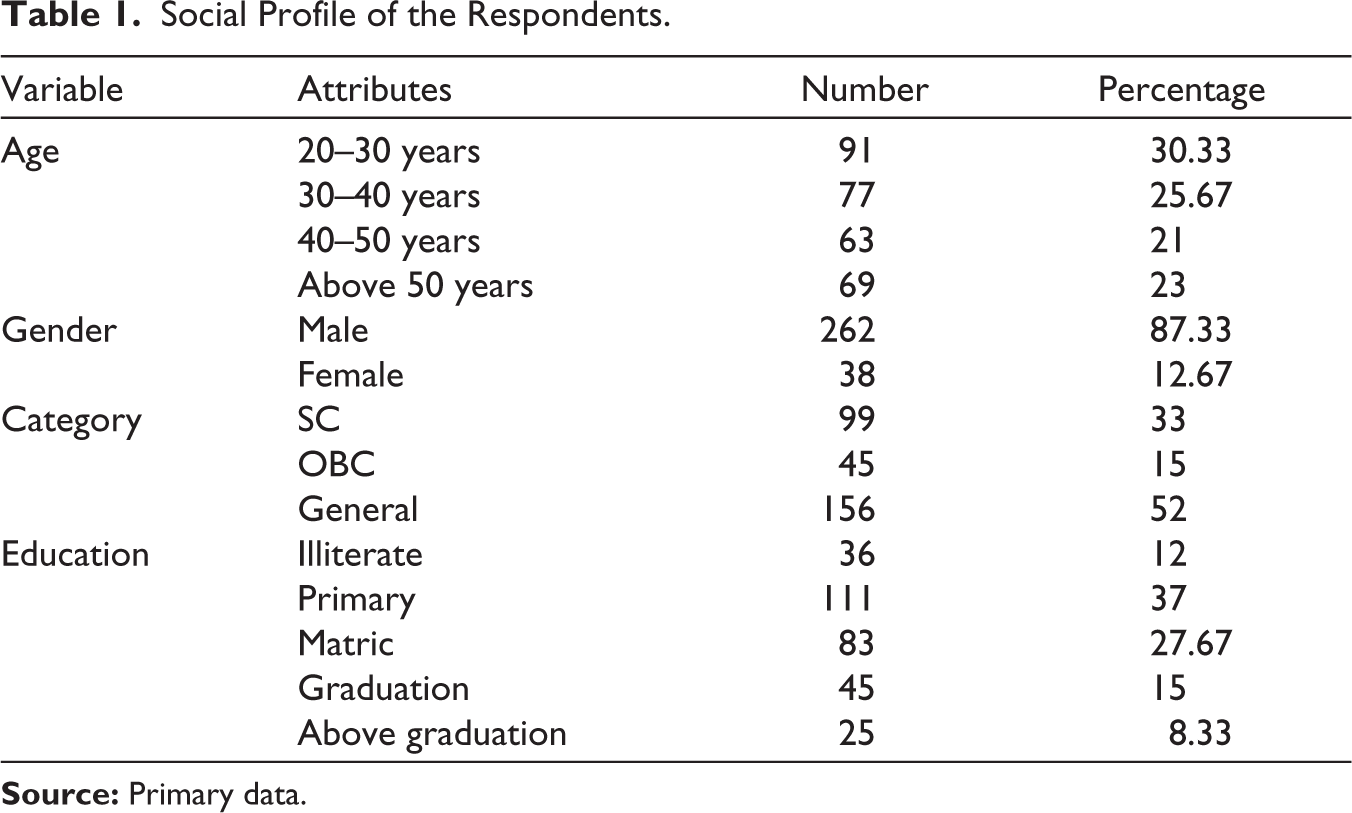
The profile of the total sample in Table 1 shows that the total percentage of different age groups in the Sewa and Saanjh Kendras are arranged in a way that 30.33% fall in the age group of 20–30 years, 25.67% of respondents belong to the age group 30–40 years, 21% respondents are placed under the age group of 40–50 years and 23% respondents are above 50 years. There is a very constant pattern of age distribution. This establishes the fact that the services provided by Sewa and Saanjh Kendras are being availed across all age groups. But, it is clear from the data that various age groups are more or less uniformly distributed with minor variants. The overall percentage makes it clear that according to the sample, males are in a majority, that is, 87.33% and females are only 12.67%. Gender-wise distribution conforms to the patriarchal structure of Indian society. Male members of the society clearly outstrip the women, who do not visit these Kendras as much as men.
The data of the district show that respondents of the general category are in a majority, that is, 52% in comparison with SCs at 33% and OBCs at only 15%. Data show that respondents belonging to the general category are availing the services in larger numbers. And, SCs or OBCs categories are reluctant to come to the Kendras. But, in the category-based distribution, the distribution of respondents is proportional to the distribution of caste-based categories in the society. As the general castes are the numerically dominant castes, their percentage is greater than that of the lower castes and minority communities.
Majority of the respondents, that is, 37%, are educated up to primary school, 27.67% up to Matriculation, 15% up to Graduation and 8.33% were above graduation. However, there are 12% respondents who are completely illiterate. The state of Punjab as a society does not have very high level of literacy. As such the highest percentage of respondents consists of people who have education levels ranging from primary to matriculation, illiterates and post-graduates form the smallest group.
Findings of the Study: Viewpoints of the Service Users and Observations of the Researcher
The viewpoints of respondents regarding the implementation of the Punjab Right to Service Act, 2011, mainly assess the opinion of the citizens regarding awareness of Right to Service, time-bound delivery of services by Sewa and Saanjh Kendras, and the citizens receiving the acknowledgement slip, numbers of counters at Kendras, adequacy of infrastructure, the role of middlemen in service delivery, harassment faced by citizens in the process of getting services, with transparency, responsiveness, equity, efficiency and accountability in service delivery system and so on for the effective and comprehensive implementation of this Act.
Table 2 indicates the levels of awareness among the respondents about the Punjab Right to Service Act, 2011, as being implemented through Sewa and Saanjh Kendras. At the SAS Nagar district level, 12.08% respondents of Sewa Kendras and 11.67% respondents of Saanjh Kendras were aware of the Punjab Right to Service Act, 2011, whereas 87.92% respondents of Sewa Kendras and 88.33% respondents of Saanjh Kendras were unaware of the Punjab Right to Service Act. Ratio of the respondents who had the knowledge of this Act stood at 12%, whereas 88% respondents were ignorant about this provision.
Awareness-level About the Punjab Right to Service Act, 2011.
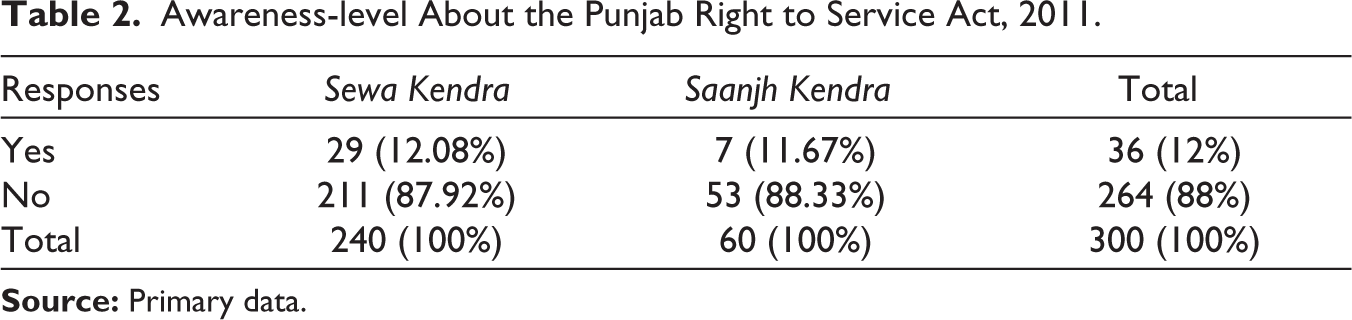
Table 3 shows the awareness among the respondents about the existence of various services at Sewa and Saanjh Kendras in their respective areas under the Punjab Right to Service Act, 2011. It was found that 87.08% respondents of Sewa Kendra and 80% respondents of Saanjh Kendra were sure and had accurate knowledge about the services provided by these Kendras, and 12.92% respondents of Sewa Kendras and 20% respondents of Saanjh Kendras were not aware of the various services provided by these institutions. To put it concisely, the ratio of the respondents who had the proper knowledge of the various services provided by these institutions was 85.67% and 14.33% respondents were not having proper knowledge of the various services provided by these institutions. It is interesting to know that although the awareness among respondents about ‘The Right to Service Act, 2011’ is very poor; yet, the awareness among the people about the services provided by Sewa and Saanjh Kendras was quite high. This shows that even if people lacked knowledge about theoretical issues in legislative developments, they learnt about the practical aspects of legislative aspects very quietly.
Awareness Level About the Services Provided by Sewa and Saanjh Kendras.
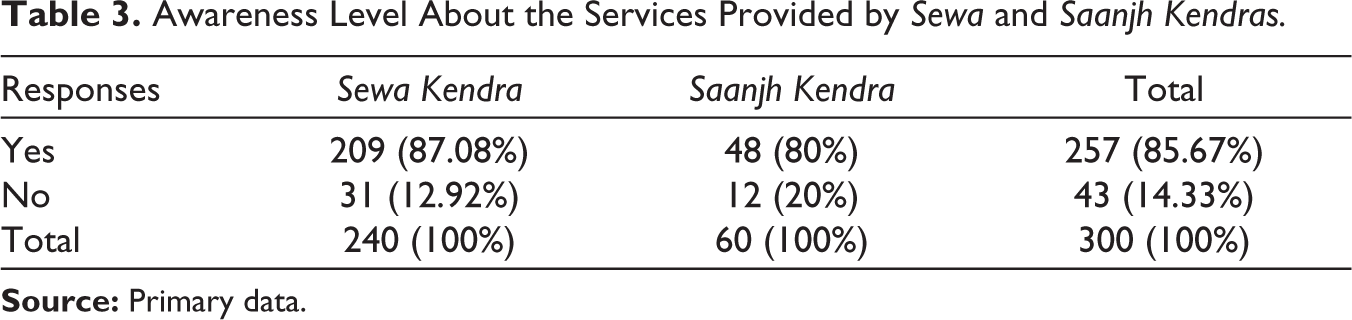
Table 4 shows the views of the respondents regarding the required documents to be attached while seeking the benefits of the various services in the Sewa and Saanjh Kendras. It was found that 34.67% respondents of Sewa Kendras and 31.67% respondents of Saanjh Kendras had accurate knowledge about the necessary documents, whereas 65.83% respondents of Sewa Kendras and 68.33% respondents of Saanjh Kendras were ignorant of the necessary documents needed for the service. It shows that 33.67% respondents were aware of the needed documents for the service, whereas 66.33% respondents were unaware of the various documents required for the service. Table 4 clearly brings out that awareness about supporting documents required for various services is comparatively low. It can be observed that the government is not making much efforts to generate the awareness.
Opinion of Respondents Regarding Awareness About the Documents to Be Attached with the Application.
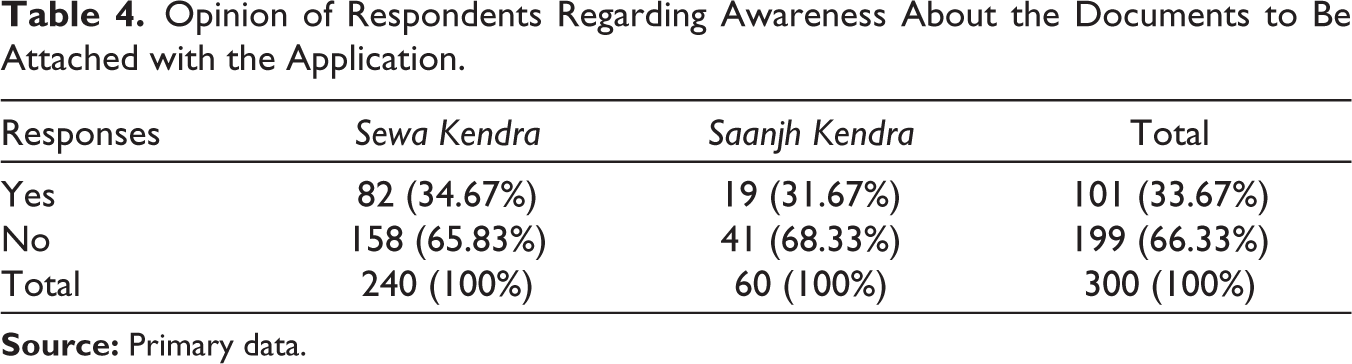
Table 5 reveals that views of respondents regarding awareness of the right to appeal/complaint if the service is not delivered in stipulated time limits by the Sewa and Saanjh Kendra. At the district level, 10.83% respondents of Sewa Kendras and 13.33% respondents of Saanjh Kendras were alert regarding the right to complaint and appeal if their service was not delivered within stipulated time limits, whereas 89.17% respondents of Sewa Kendra and 86.67% respondents of Saanjh Kendra were unaware of the complaints/appeals if their service is not delivered within the stipulated time limits. The whole set of responses reveals that 11.33% respondents claimed to be aware regarding the right to complaint/appeal, whereas majority of respondents 88.67% were not aware of their right to complaint/appeal if their service could not to be delivered within the stipulated time limit. It is apparent that most of the respondents in the district were not aware of their right to appeal/complaint if their service is not delivered within the stipulated time limits. There is strong evidence to link this lack of awareness with poor levels of literacy.
Service Users’ Perception Regarding Awareness of Right to Appeal/Complaint.
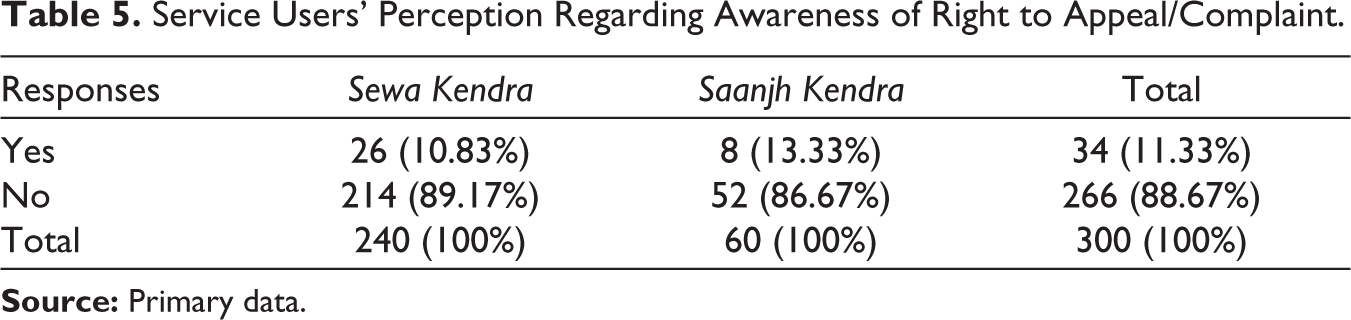
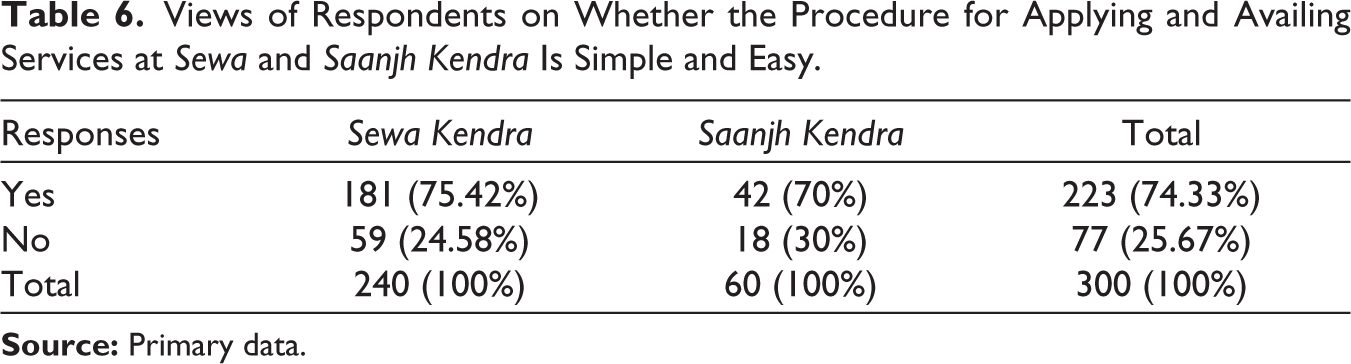
Table 6 indicates the opinion of respondents regarding whether the procedure for applying and availing services at Sewa and Saanjh Kendras is simple and easy. In the SAS Nagar district, 75.42% respondents of Sewa Kendras and 70% respondents of Saanjh Kendras confirmed that the ways to avail the services were simple and easy, whereas 24.58% respondents of Sewa Kendras and 30% respondents of Saanjh Kendras said that the procedures to avail the services were complex. In the overall point of view of the respondents, 74.33% respondents agreed that the procedure for applying and availing services at the Kendras were simple and easy, whereas 25.67% disagreed with the statement that procedure for applying and availing services at Kendras is simple and easy. In the opinion of most of the respondents, the services at both Sewa and Saanjh Kendras were vastly more accessible as the procedure for applying and availing services was easy.
Views of Respondents on Whether the Procedure for Applying and Availing Services at Sewa and Saanjh Kendra Is Simple and Easy.
The data presented in Table 7 deal with the opinion of respondents regarding satisfaction with the number of counters at the Kendras. The table makes it clear that 51.67% respondents of Sewa Kendras and 56.67% respondents of Saanjh Kendras, respectively, were happy that there were sufficient numbers of counters at the Kendras, whereas 48.33% respondents of Sewa Kendras and 43.33% respondents of Saanjh Kendras were unsatisfied with the provision of counters. Analysing the overall views, 52.67% respondents were satisfied with the number of counters at these Kendras, whereas 47.33% respondents were dissatisfied with the number of counters at the Kendras. The happiness level in relation to the number of counters is reasonably good. It can be assumed that within a few years of their setting up, these Kendras are not sites of chaos. Figure 1 shows the number of service delivery counters at Sewa and Saanjh Kendras.
Opinion of Respondents Regarding Satisfaction with the Number of Counters at the Sewa and Saanjh Kendra.
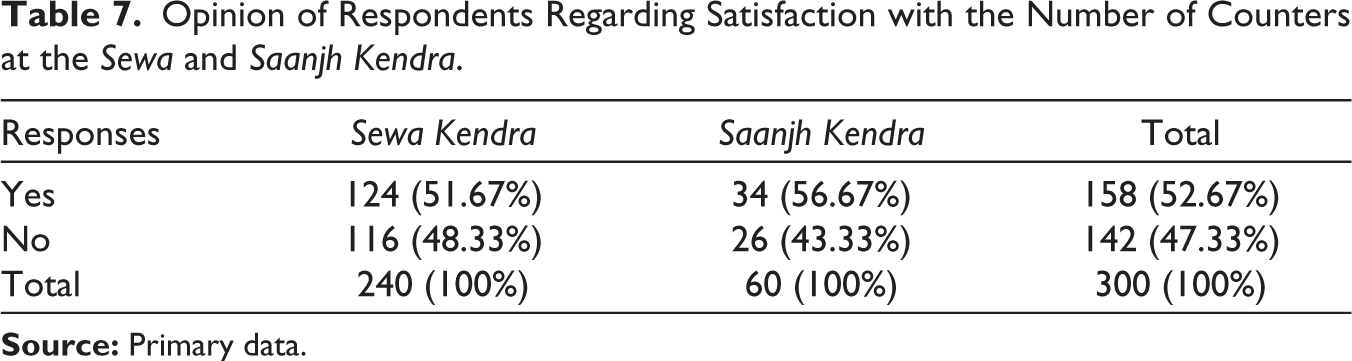
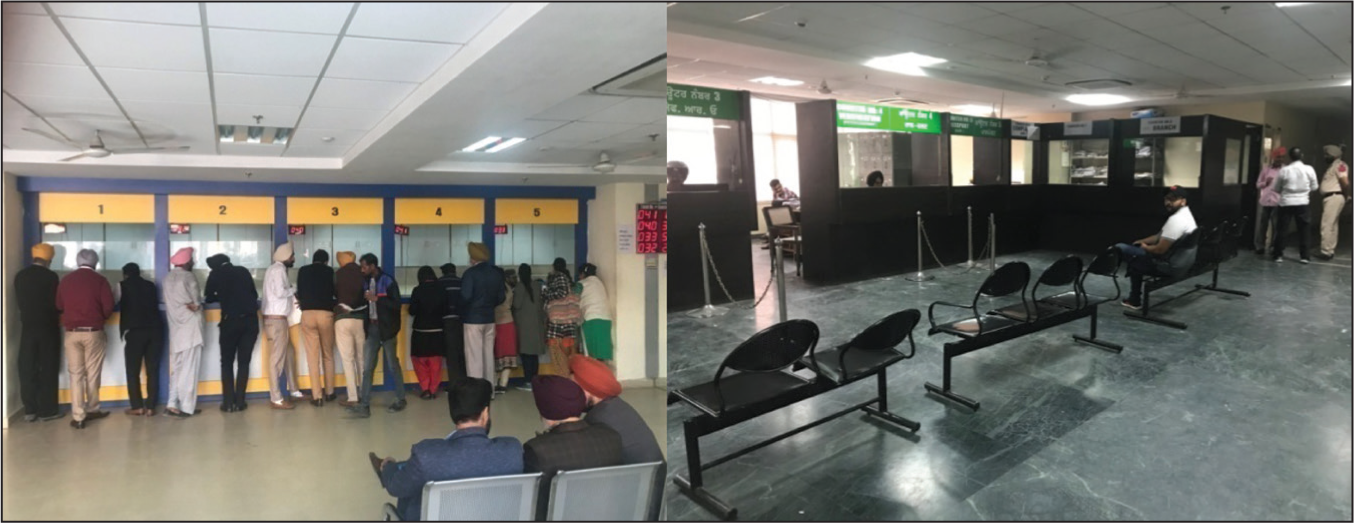
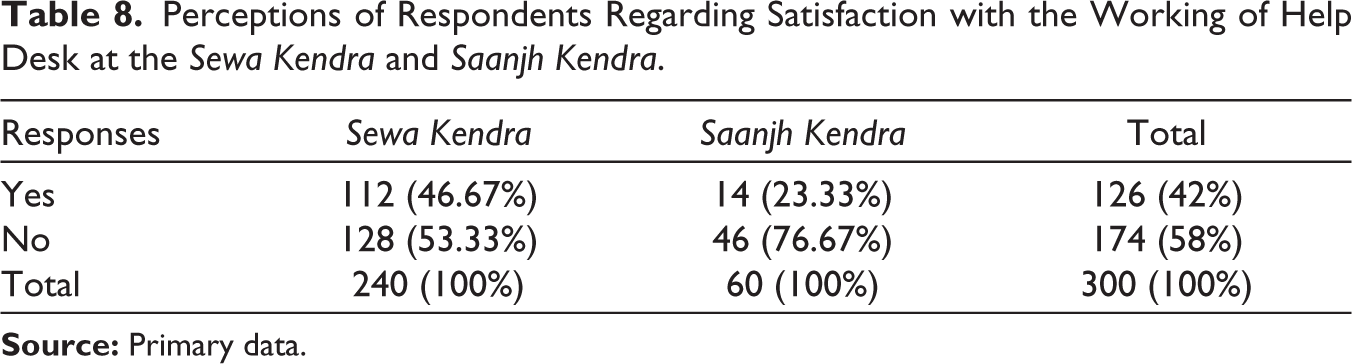
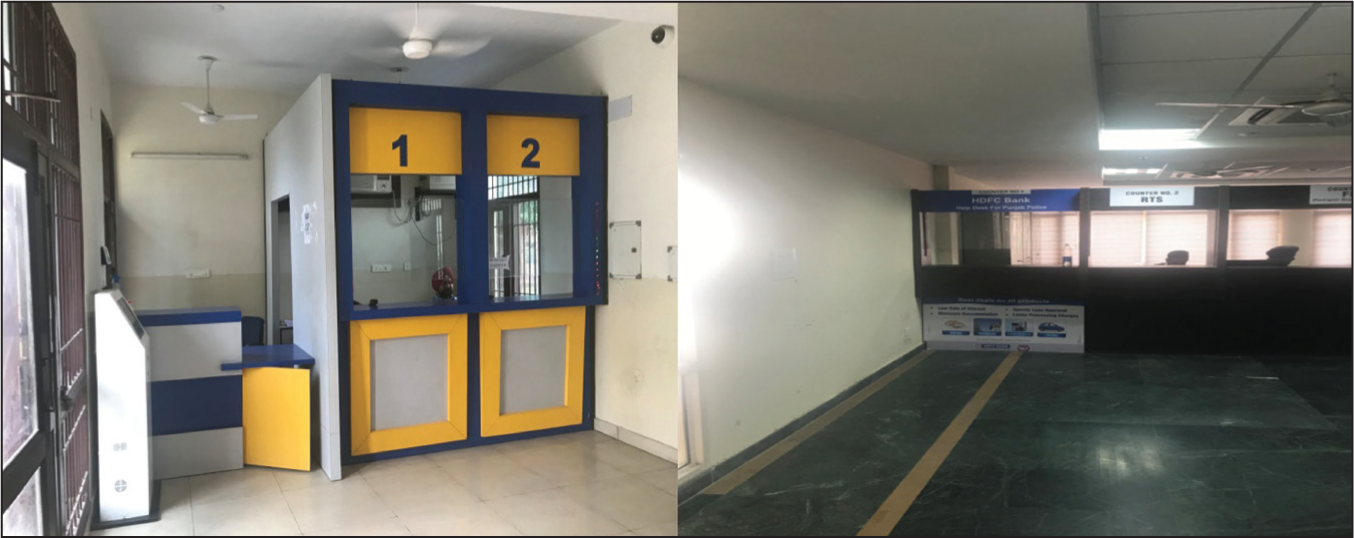
Table 8 shows the views of respondents regarding satisfaction with the working of help desks at the Sewa Kendras and Saanjh Kendras. It shows that 46.67% respondents of Sewa Kendras and 23.33% respondents of Saanjh Kendra were happy with the working of the help desks at Sewa Kendras and Saanjh Kendras, whereas 53.33% respondents of Sewa Kendras and 76.67% respondents of Saanjh Kendras were unhappy with the working of the help desks. An overall view of the SAS Nagar district shows that 42% were satisfied with the working of the help desks in the premises, whereas 58% respondents were dissatisfied with the working of the help desks at these Kendras. It was found that leaving the police apart, station Saanjh Kendras, all other Sewa and Saanjh Kendras have additional helpdesk counters. However, some of these helpdesk counters did not have any occupants in form of attendants or officials. Figure 2 shows helpdesk counters without attendants or employees at Sewa and Saanjh Kendras.
Perceptions of Respondents Regarding Satisfaction with the Working of Help Desk at the Sewa Kendra and Saanjh Kendra.
The data given in Table 9 show the views of respondents regarding satisfaction with the public facilities available at Sewa Kendras and Saanjh Kendras. Assessing the data, 42.5% respondents of Sewa Kendras and 23.33% respondents of Saanjh Kendras, respectively, were satisfied with the public facilities, whereas 57.5% respondents of Sewa Kendras and 76.67% respondents of Saanjh Kendras, respectively, were unsatisfied with the public facilities available in the premises of Sewa Kendras and Saanjh Kendras. The overall data show that 38.67% respondents were pleased with the public facilities available in the premises of these Kendras, whereas majority of the respondents at 61.33% were not pleased with the public facilities available at the Sewa and Saanjh Kendras. Public facilities have an indirect and tangential relationship with the working of Sewa and Saanjh Kendras. However, when it comes to public facilities, there is a general sense of dissatisfaction among the service users. It can be observed that this is an area where there is ample scope for improvement.
Visions of Respondents Regarding Satisfaction with the Public Facilities Available at Sewa and Saanjh Kendras.
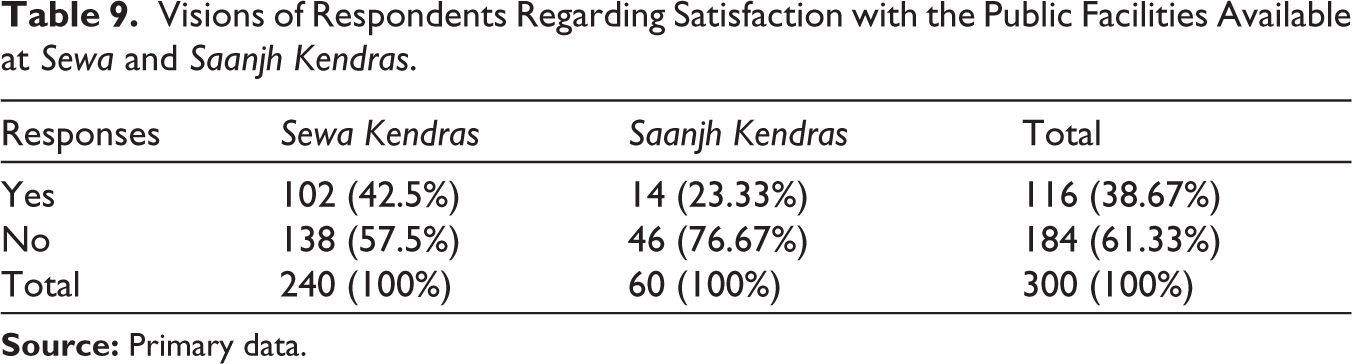
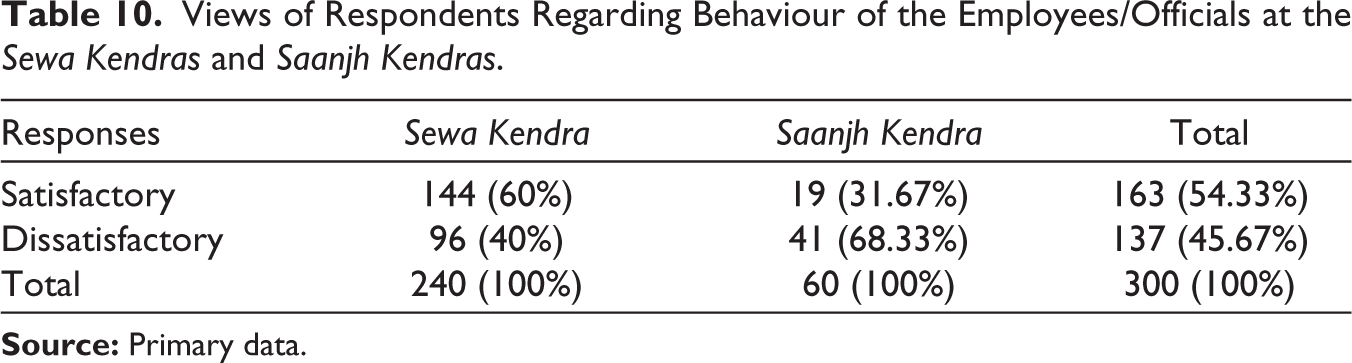
Table 10 compiles the views of respondents regarding behaviour of the employees/officials at the Sewa Kendras and Saanjh Kendras. Sixty per cent of respondents of Sewa Kendras and 31.67% respondents of Saanjh Kendras were happy with the behaviour of the employees/officials, whereas 40% respondents of Sewa Kendras and 68.33% respondents of Saanjh Kendras were unhappy with the behaviour of the employees/officials. In terms of the overall points of view, the majority of the respondents at 54.33% were satisfied with the behaviour of the employees/officials, whereas 45.67% respondents were dissatisfied with the behaviour of the employees/officials at these Kendras. The responses in relation to the general behaviour of the employees and officials are quite mixed.
Views of Respondents Regarding Behaviour of the Employees/Officials at the Sewa Kendras and Saanjh Kendras.
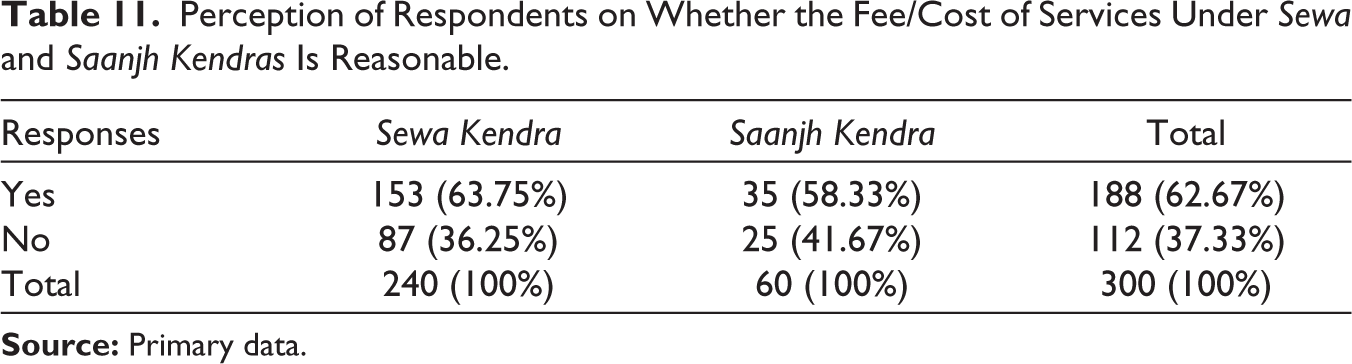
An analysis of Table 11 about the views of respondents whether according to them the fee/cost of services under Sewa and Saanjh Kendras is reasonable. About 63.75% respondents of Sewa Kendra and 58.33% respondents of Saanjh Kendra were pleased with the charges of the various services, whereas 36.25% respondents of Sewa Kendras and 41.67% respondents of Saanjh Kendras, respectively, were not happy with the charges of the various services under these Kendras. To present a concise picture, majority of the respondents at 62.67% were satisfied with the charges of the various services, whereas 37.33% respondents were not satisfied with the charges of the various services being provided. Majority of the respondents found the fee/cost of services to be within reasonable limits. This is a clear sign that services were reasonably priced.
Perception of Respondents on Whether the Fee/Cost of Services Under Sewa and Saanjh Kendras Is Reasonable.
The data in Table 12 show the views of respondents regarding the role of middlemen/agents which ostensibly were diminished due to delivery of services by Sewa and Saanjh Kendra. Regarding this issue 55.83% respondents of Sewa Kendras and 51.67% respondents of Saanjh Kendras agreed that role of middlemen/agents has been reduced by Sewa and Saanjh Kendra, whereas 44.17% respondents of Sewa Kendra and 48.33% respondents of Saanjh Kendra disagreed. The overall responses show that 55% respondents were agreed that role of middleman/agent had diminished by these Kendras, but 45% respondents were of the view that role of middleman/agent still remained strong. They argued that middlemen/agents still enjoyed importance because many people preferred to avail services through agents to save their time, and they paid more to the agents in order to spare themselves the trouble of visiting the Kendras. These agents/middlemen were opportunists who created unofficial networks and facilitated various services. This kind of activity was a part and parcel of corruption. Table 12 proves the existence of agents/middlemen and the role of agents/middlemen has reduced but not fully eliminated.
Views of Respondents Regarding the Diminishing Role of Middlemen/Agents at Sewa Kendras and Saanjh Kendras.
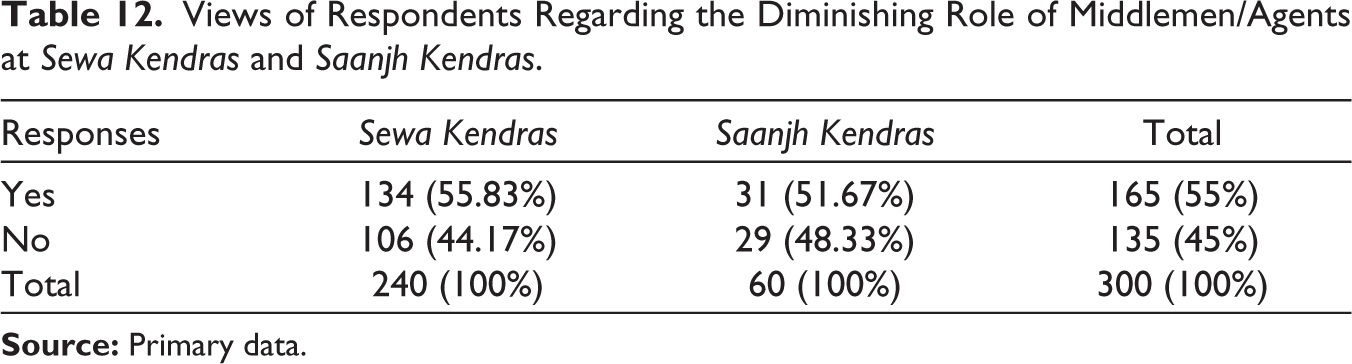
Table 13 shows the opinion of respondents regarding the type of system which is better for delivering services to citizens. About 80% respondents of Sewa Kendras and 66.67% respondents of Saanjh Kendras expressed the view that the single-window system was better than the traditional system, whereas 20% respondents of Sewa Kendras and 33.33% respondents of Saanjh Kendra expressed the opinion that the traditional system was better than the single-window system. In terms of the overall point of views, majority of respondents at 77.33% confirmed that the single-window system was better than the traditional system because all services were available at a single window (one place) for service users, whereas 22.67% respondents expressed disagreement and said that the traditional system was better than the single-window system. There is a clear preference for a single-window system in these Kendras.
Opinion of Respondents Regarding Type of System They Found Better for Delivering Services to Citizens.
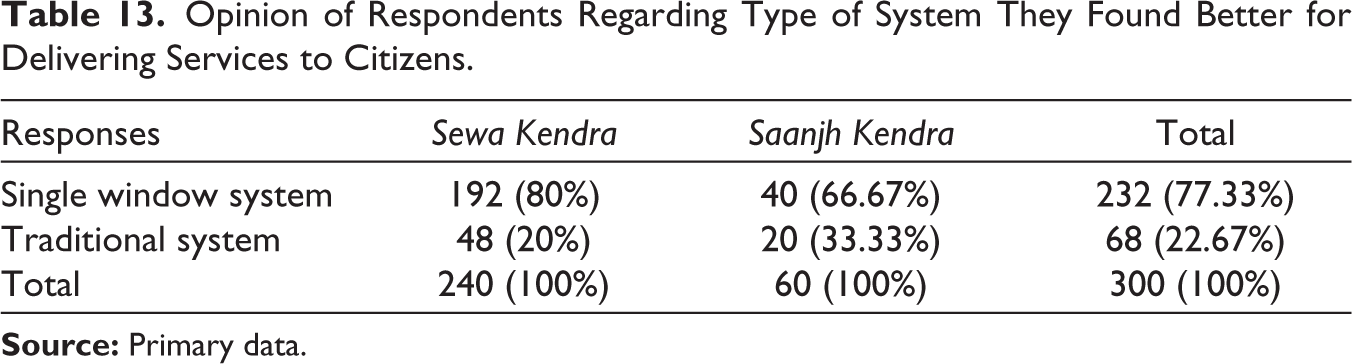
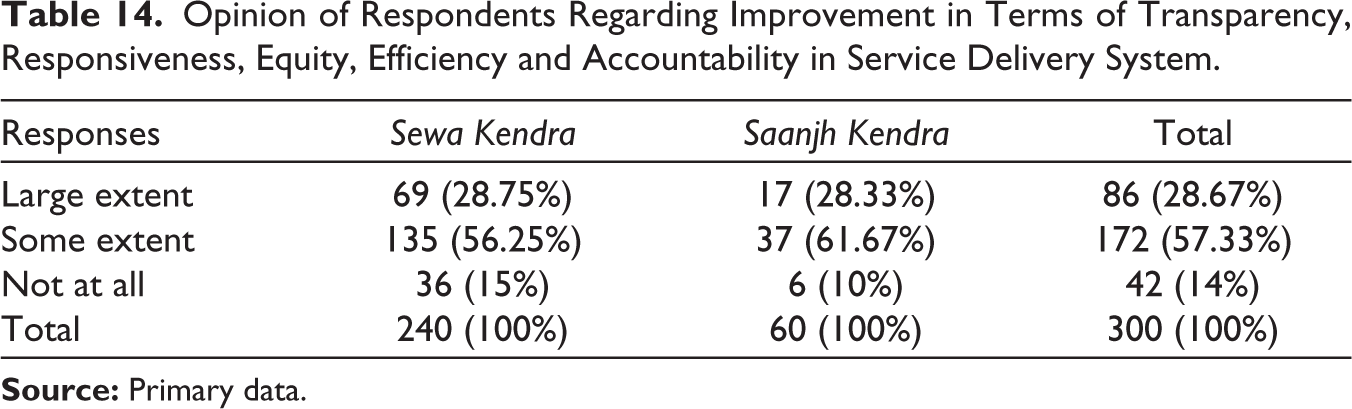
Table 14 demonstrates the opinion of respondents on whether Sewa Kendra and Saanjh Kendras had improved in terms of transparency, responsiveness, equity, efficiency and accountability in service delivery system. Regarding the response on this issue, 28.75% respondents of Sewa Kendra and 28.33% respondents of Saanjh Kendras agreed that these institutions had brought about change to the system to a great extent, and 56.25% respondents of Sewa Kendras and 61.67% respondents of Saanjh Kendras agreed that these institutions had brought change to some extent, whereas 15% respondents of Sewa Kendras and 10% respondents of Saanjh Kendras disagreed and said that these institutions had brought about no change at all. Assessing overall point of views about transparency, responsiveness, equity, efficiency and accountability in the delivery of public service, 28.67% respondents felt that these institutions had brought change in the system to a large extent, 57.33% felt that these institutions had brought change up to some extent, whereas 14% felt that these institutions had brought no change at all in functioning and deliverance. The respondents had a clear perception of improvement in service delivery as a result of the existence of the Punjab Right to Service Act, 2011, and the setting up of Sewa and Saanjh Kendras.
Opinion of Respondents Regarding Improvement in Terms of Transparency, Responsiveness, Equity, Efficiency and Accountability in Service Delivery System.
Analysis of Overall Views of Service Users
To make some concluding statements about the effectiveness of the Punjab Right to Service Act, 2011, some parameters regarding awareness and satisfaction of service users were selected which are based on the perception of service users. The perception of service users was assessed on the basis of their views through their answers. The overall percentage of perception was calculated to derive a quantitative result. These perceptions were compiled to specify the results which were described in Tables 15 and 16 and Figures 3 and 4.
Overall Awareness Level of Service Users About the Provisions of Right to Service.
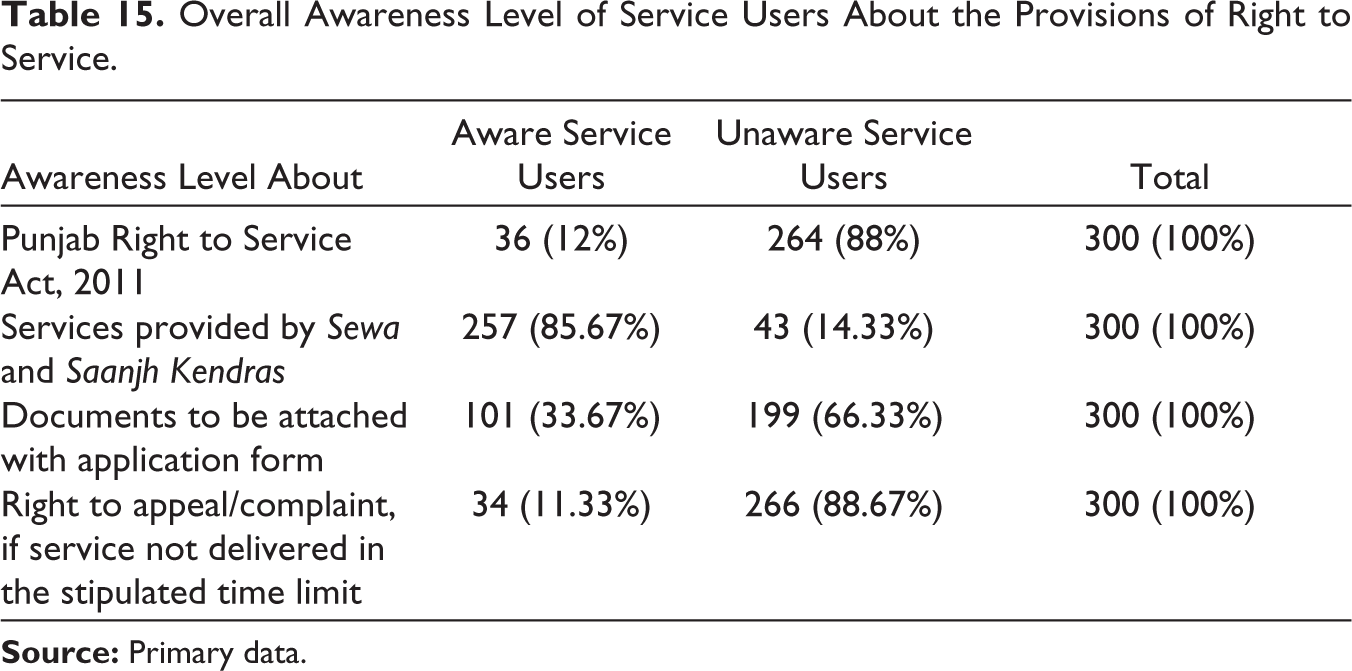
Figure 3 is based on Table 15, which shows the indicators of awareness of citizens on such aspects as awareness about the Punjab Right to Service Act, 2011, whether services are provided by Kendras, documents to be attached with the application form, and right to appeal/complaint if service was not delivered within the stipulated time. Figure 3 shows that overall 64.33% service users are unaware of the above-noted provisions of the Right to Service Act.
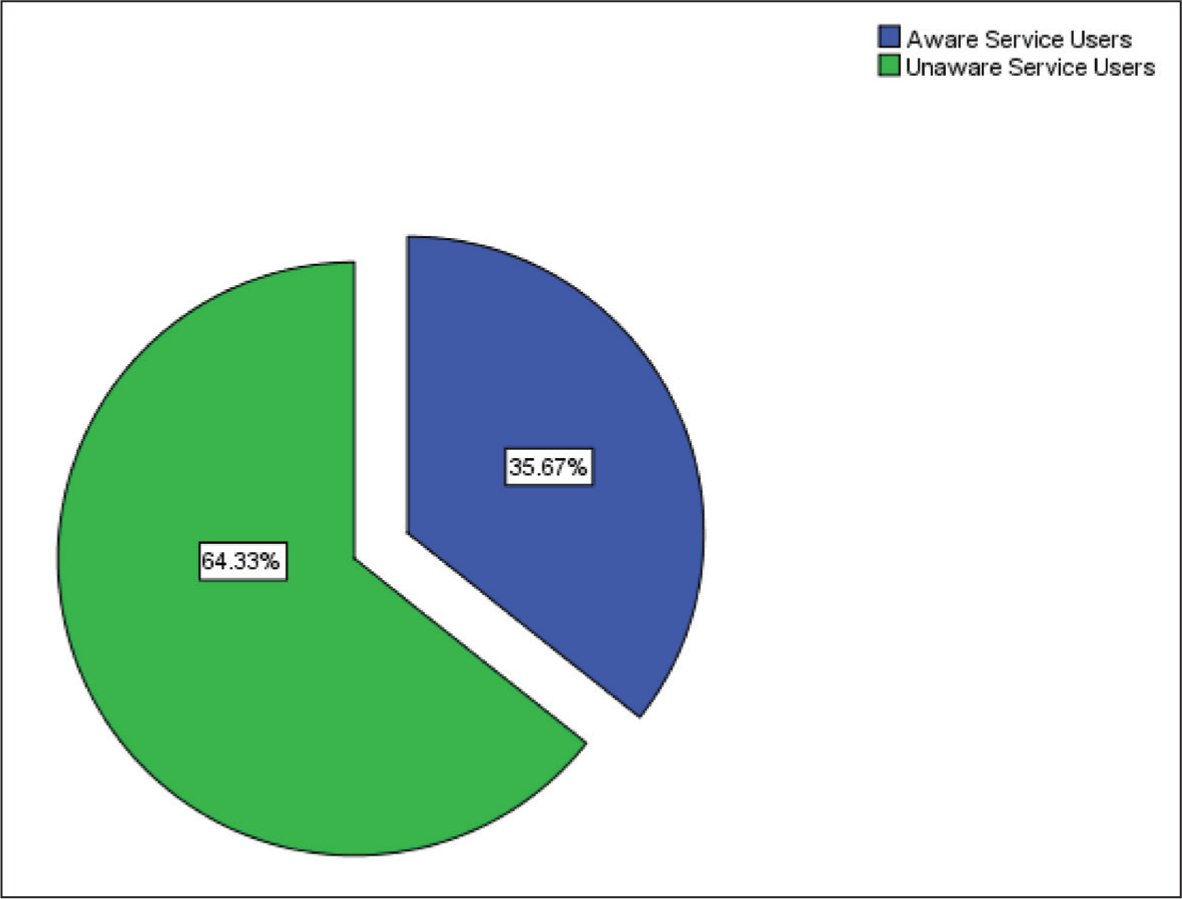
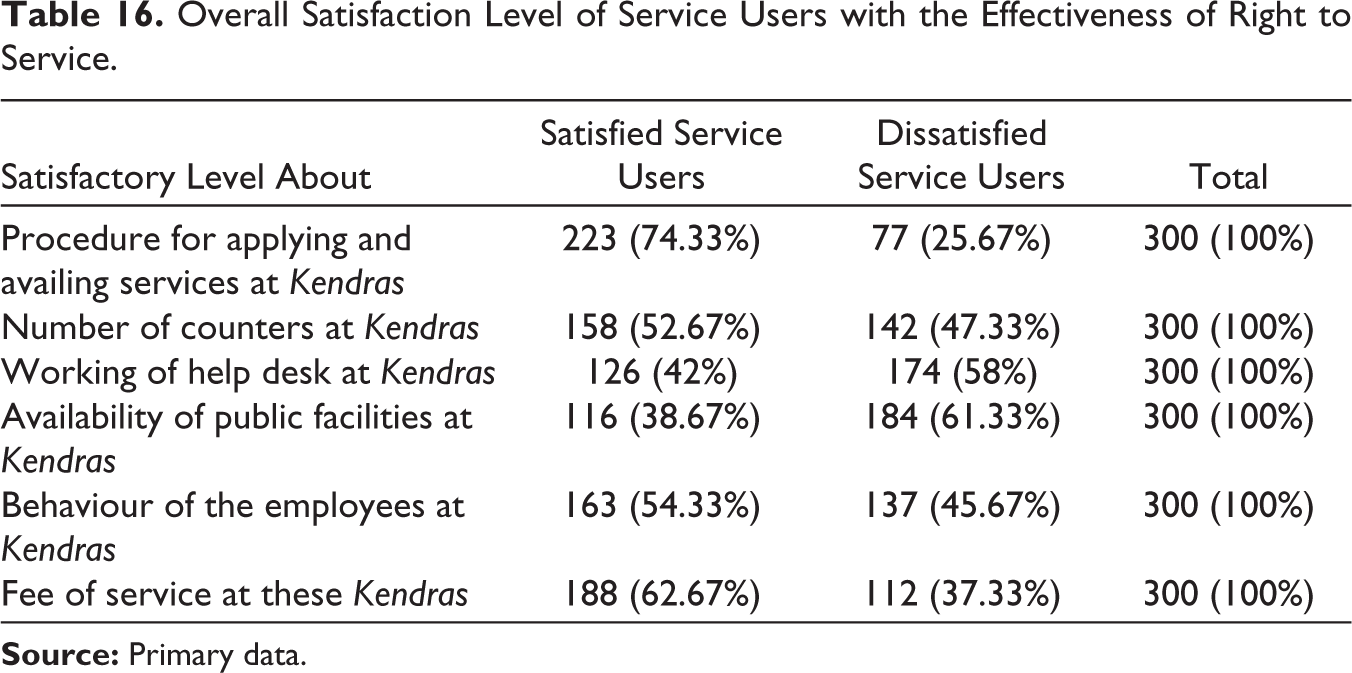
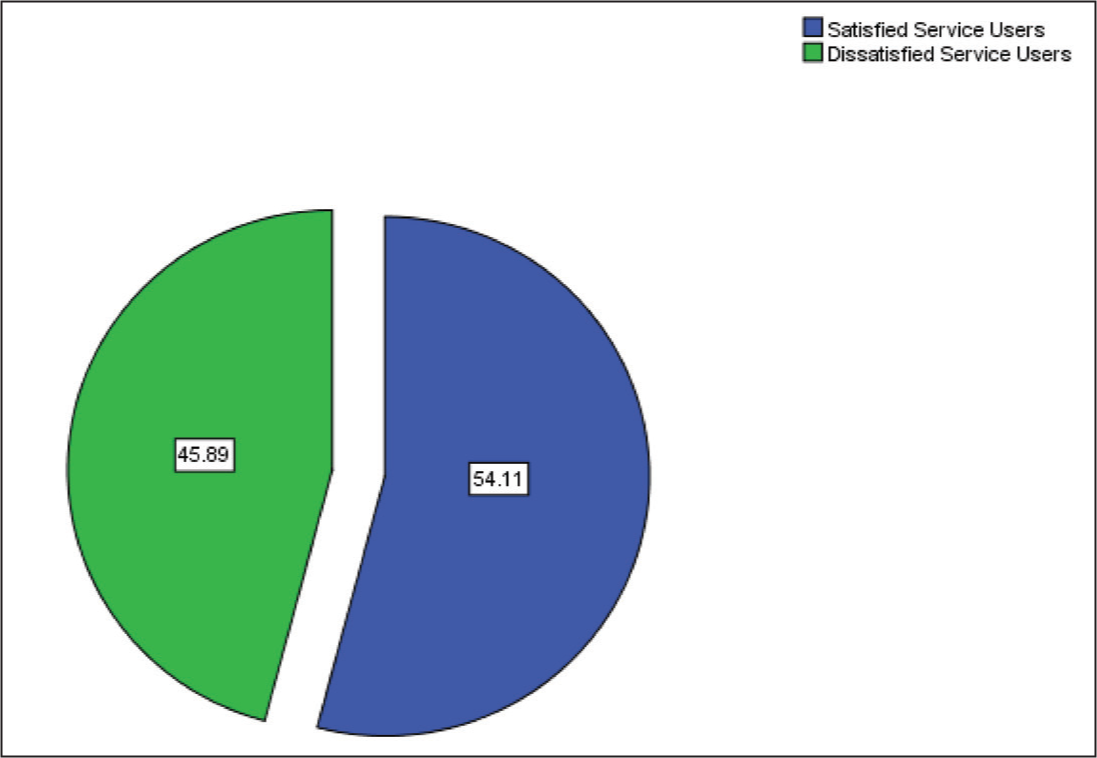
Figure 4 is based on Table 16, which shows the indicators of satisfaction such as the procedure of applying and availing services, number of counters, working of helpdesks, availability of public facilities, behaviour of the employees and fee of services at these Kendras. Figure 4 shows that 54.11% service users were generally satisfied with the working of these Kendras.
Overall Satisfaction Level of Service Users with the Effectiveness of Right to Service.
Concluding Remarks
To sum up, views gathered from service users under Sewa and Saanjh Kendras prove that majority of the service users were aware of the existence of various services at Sewa and Saanjh Kendra in their respective areas. Majority of the service users (citizens) were totally ignorant about the concept the Punjab Right to Service Act, 2011, and lacked the knowledge about the documents to be attached with the application form or about matters such as stipulated time period of service delivery, right to appeal/complaint if service was not delivered within the stipulated time and procedure of appeal/complaint.
The study exhibited that majority of service users were satisfied with many key aspects such as service procedure, service cost, number of counters, service availability, service delivery, intimation regarding service updating and behaviour of the officials at Sewa and Saanjh Kendras. However, they were not satisfied with the working of helpdesks and public facilities available at these Kendras.
According to the perception of service users, single-window system was better than traditional system for service delivery because many services were available at single windows in Sewa and Saanjh Kendras. Service users believed that the role of middlemen/agents and corruption had diminished to some extent at these Kendras. The study also showed that the Punjab Right to Service Act, 2011, had improvised transparency, responsiveness, equity, efficiency and accountability in the delivery of public services and changed the government-centric approach to citizen-centric approach.
Thus, the existence of Right to Service because of the mentioned exhibits seems a reality. A lot of work had been done in this direction of creating a model of good governance, yet a lot of more efforts were needed for strengthening this model. The awareness about the conceptual clarity of Right to Service as well as a first-hand knowledge of its benefits was a pertinent point of importance in this direction. The cyber-literacy needs to be imparted to the citizens to make the usage of this Act more practical and beneficial to the citizens.
Footnotes
Declaration of Conflicting Interests
The author declared no potential conflicts of interest with respect to the research, authorship and/or publication of this article.
Funding
The author received no financial support for the research, authorship and/or publication of this article.