
Abstract
In the year 2019–2020, Indian economy was already on its trough and the incidence of coronavirus pandemic in 2020–2021 has further deteriorated the economic condition, limiting the fiscal space of the government. As need of the hour was to take some supportive measures to handle such an unusual situation, therefore various monetary and fiscal measures were taken by the government to overcome the impact of the pandemic. This resulted in overshooting of the fiscal deficit target set under the Fiscal Responsibility and Budget Management (FRBM) Act (2003) and made the government to revise its fiscal deficit target of 3.5% of Gross Domestic Product (GDP) in 2020–2021 Budget Estimates (BE) and 9.5% in 2020–2021 Revised Estimates (RE), and further it is projected as 6.8% of GDP for 2021–2022 (BE). After an estimated 7.7% pandemic-driven contraction in 2020–2021, India’s real GDP is projected to record growth of 11.0% in 2021–2022 and nominal GDP by 15.4%. The government is expected to generate 23% more revenue and has budgeted to increase its spending by only 0.95% in FY22 as compared to FY21 (RE). In order to deal with pandemic situation, the economists have suggested more active, counter-cyclical fiscal policy to enable growth during economic downturn. However, due to lack of revenue sources, it also becomes important to strategise the path for fiscal consolidation for the ensuing years.
Introduction
The situation of coronavirus pandemic has been described as once-in-a-century crisis where the governments across economies have taken numerous fiscal and monetary measures to minimise the economic impact of the pandemic. In India too, the government has deployed a range of macroeconomic policy responses to deal with the economic crisis, resulting both from supply side disruptions and reductions in aggregate demand. As an economic revival strategy, the Government of India (GoI) announced a series of Aatmanirbhar Bharat or Self-Reliant India (ANB) packages. According to the Budget 2020–2021 presented by finance minister of India, the total financial impact of all ANB packages, including measures taken by Reserve Bank of India (RBI), was estimated to be about ₹27.1 lakh crore, which amounts to more than 13% of the GDP.
The impact of pandemic resulted in weak tax and non-tax revenue inflow and an expanded expenditure. According to the Union Budget FY22, Centre’s non-tax revenues were estimated to contract by (–)35.6% in FY21 (RE) over FY20 actuals. While the flow of tax revenue from direct tax, Corporate Income Tax (CIT), Personal Income Tax (PIT) and indirect taxes, especially GST, also contracted. Thus, such a scenario compelled the government to provide essential relief to vulnerable sections of the society and required it to push the fiscal constraints of the economy.
In such a scenario, it becomes pertinent to take a review of the fiscal situation of the economy in pre-Covid-19 period; how it is going to be in next few years given the Covid-19 impact; and what strategy the government is going to adopt for the ensuing years for fiscal consolidation. In addition, it is not only about the levels of deficits but also revamping the financing pattern of deficit which is relevant.
Against this backdrop, the study is organised in seven sections. Besides the introduction, the second section reviews the Indian economy in pre-Covid-19 period. The third section explains the outbreak of coronavirus pandemic globally and in India. The fourth section gives details of the preventive measures taken by the government to deal with the pandemic. The fifth section examines the economic impact of coronavirus pandemic during 2020–2021. The sixth section deals with the Covid impact on states. Finally, the last section concludes by giving fiscal strategy for ensuing years as suggested by the Union government and the Fifteenth Finance Commission.
Economy in 2019–2020: A Year Before the Pandemic
Output Growth
On an average, the economy grew at 6.7% in the last five years. Looking at the performance of the Indian economy in the year before the Covid-19 pandemic, which hit worldwide, one can observe that the growth was already low as compared to the preceding years. In the year 2019–2020, the Indian economy registered an 11-year low of 4% whereas in the year 2018–2019, the economy expanded at 6.8%.
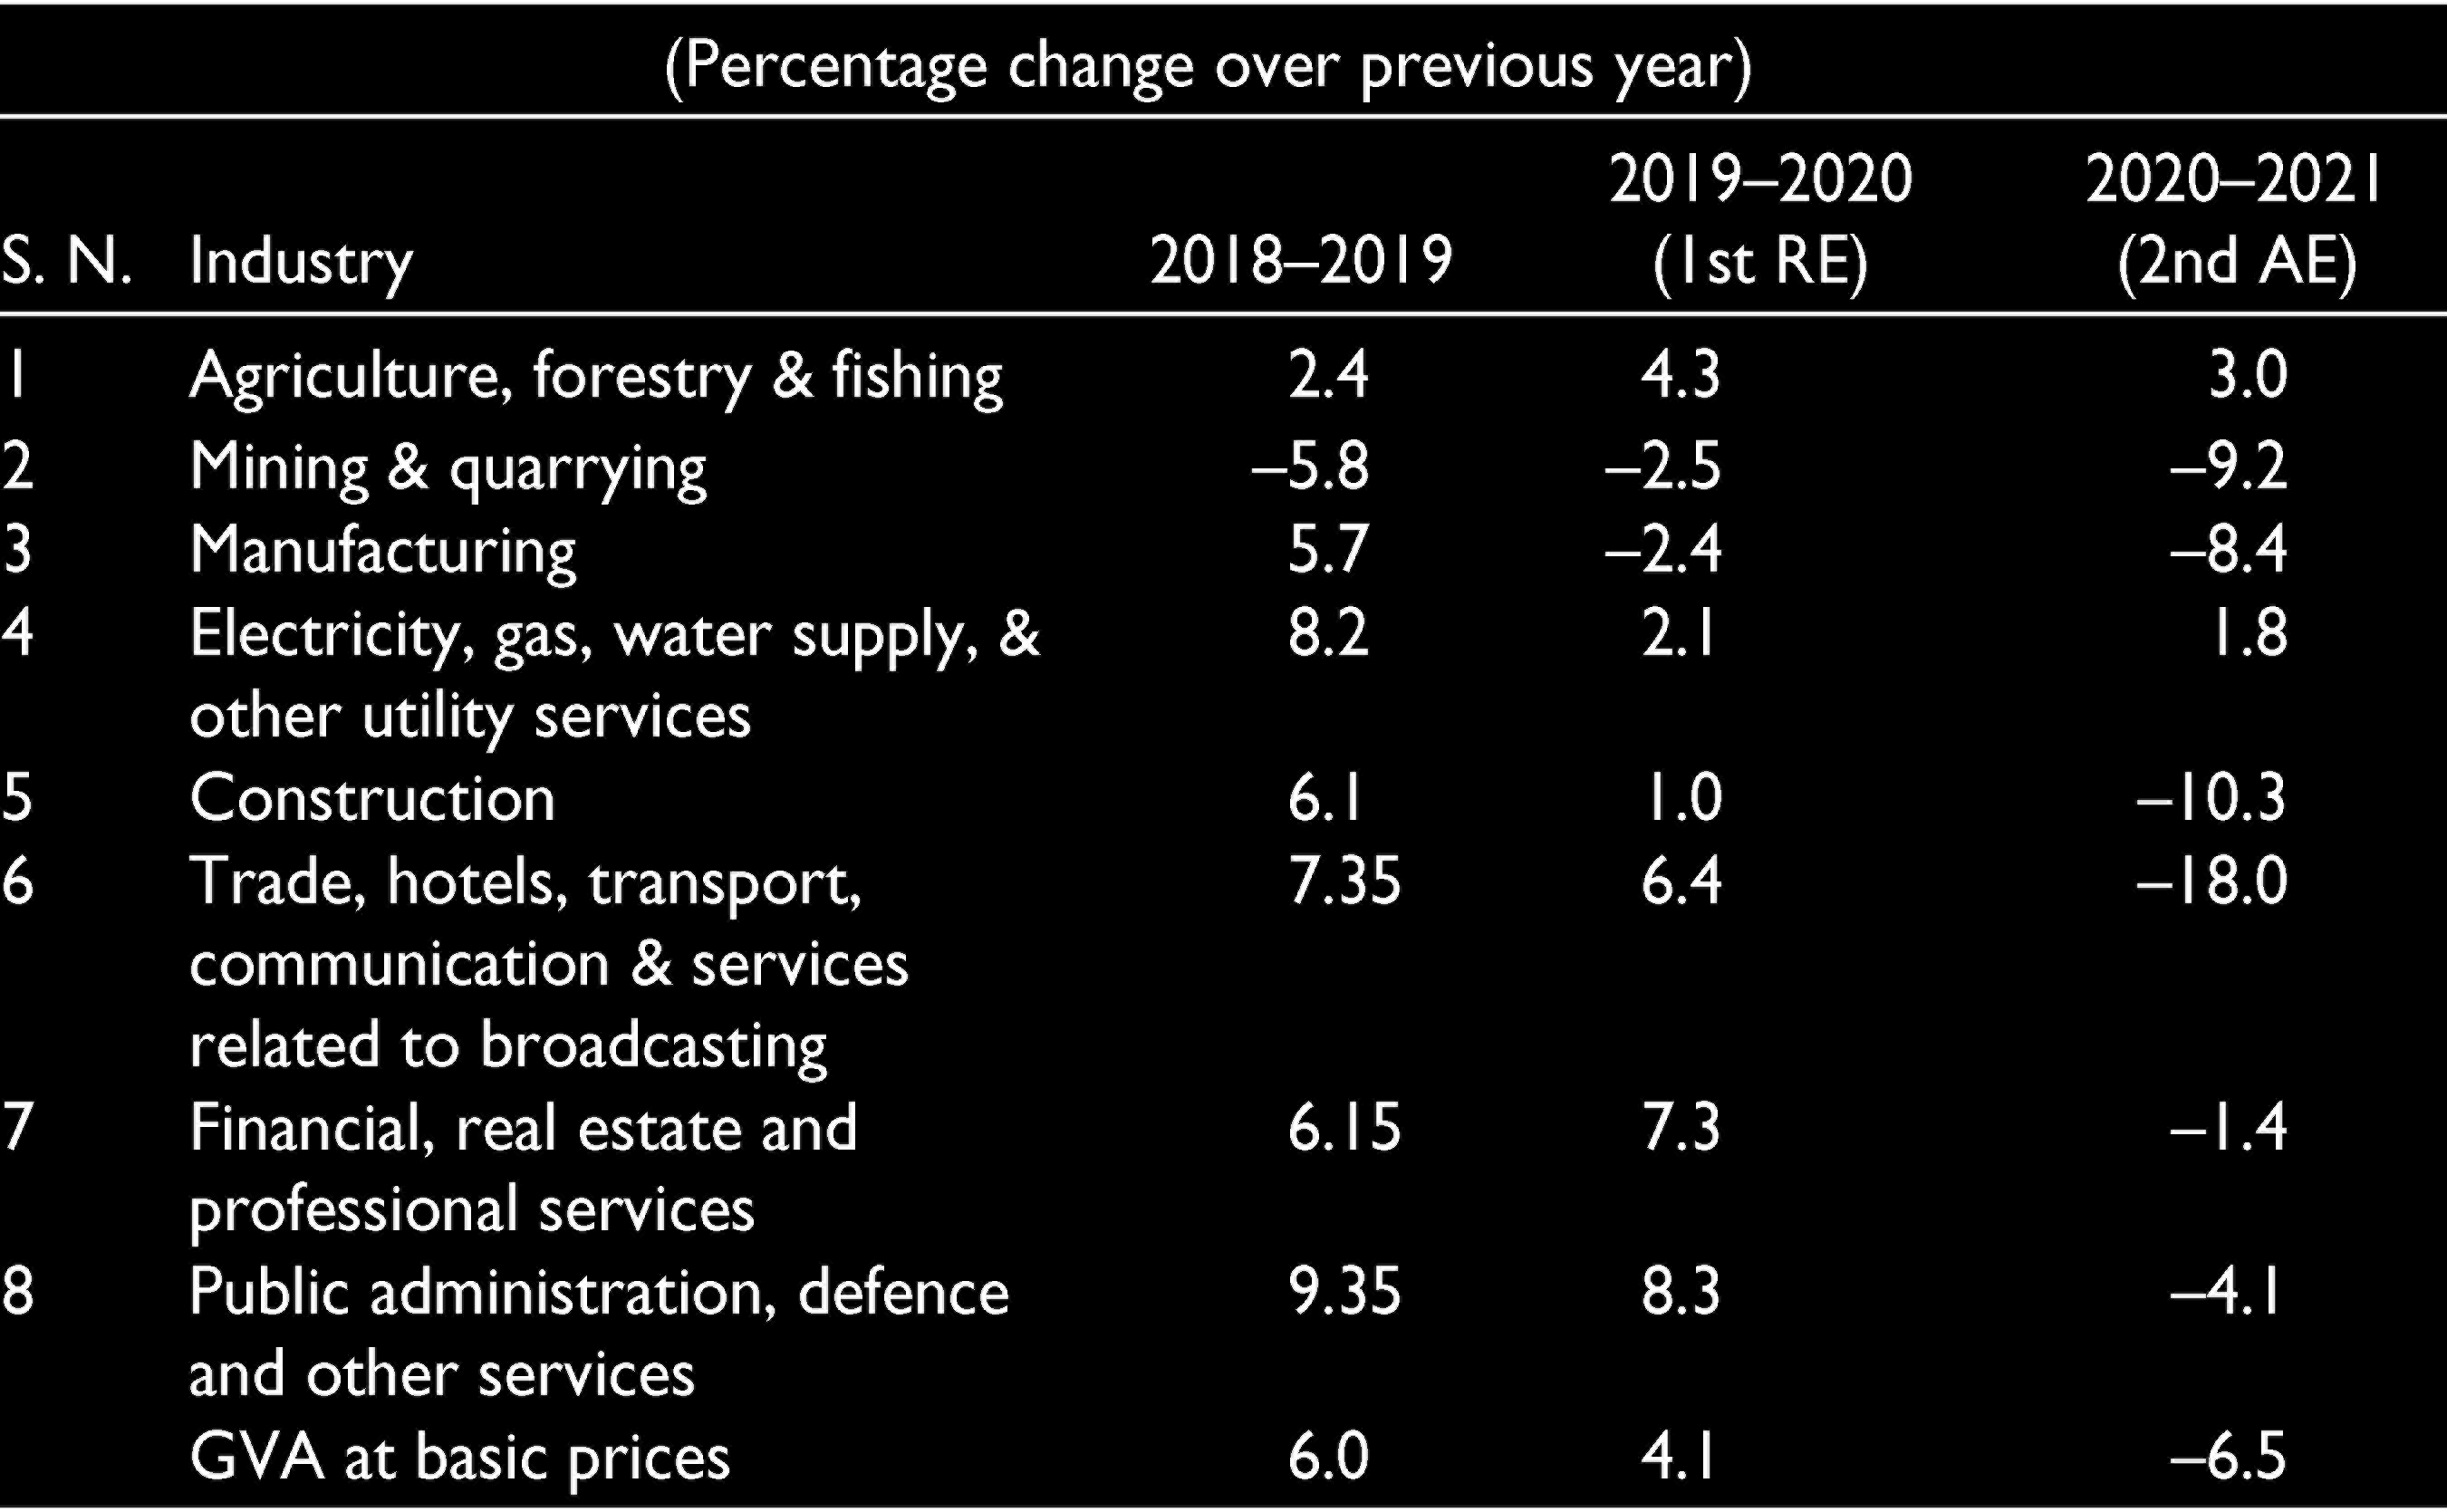
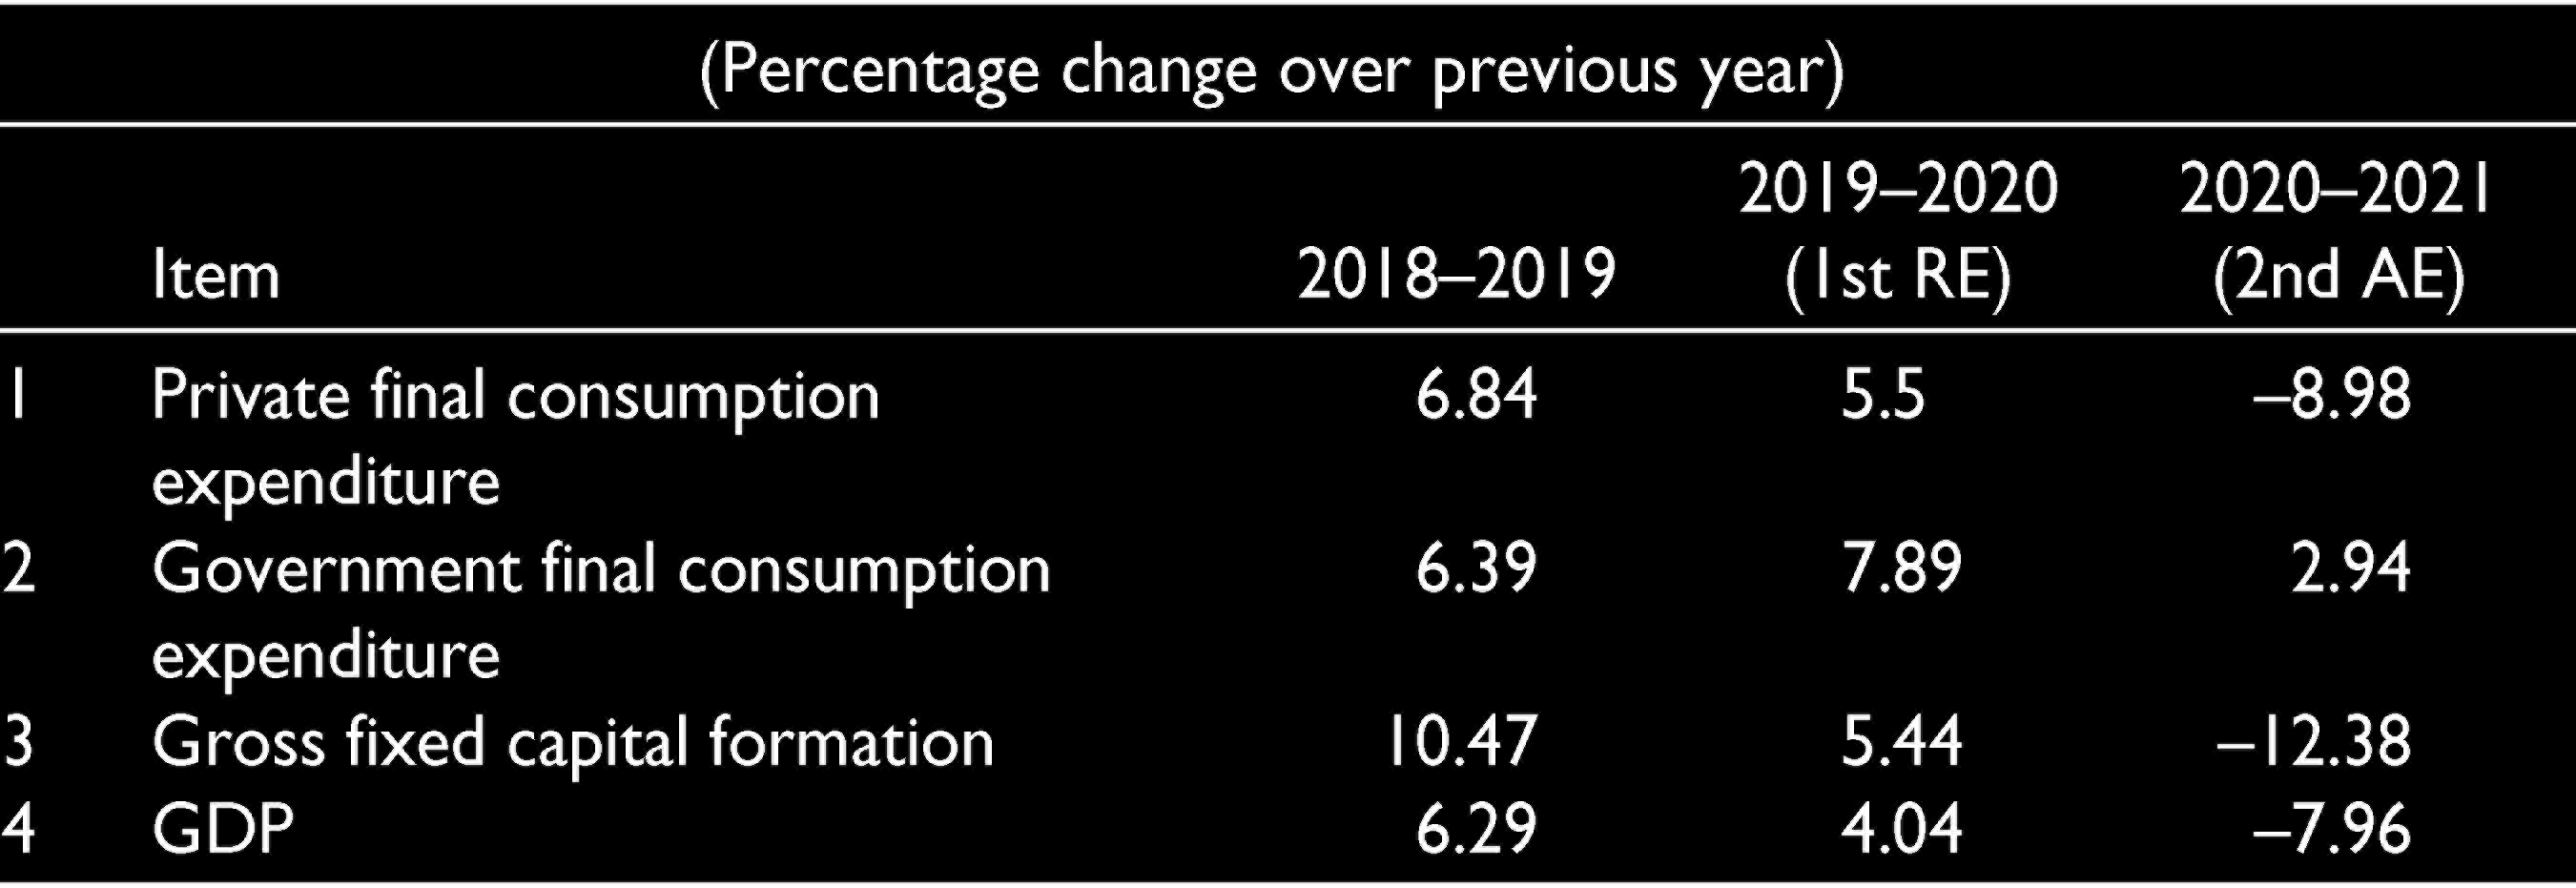
According to the revised estimates released by the National Statistical Office (NSO) for the year 2019–2020, 1 the growth of real Gross Value Added (GVA) in 2019–2020 is 4.1% as against 6% in 2018–2019 (Table 1). This decline is mainly attributed to the contraction in manufacturing and mining and quarrying sector, registering a negative GVA growth. Construction also exhibited a growth of only 1% during 2019–2020 as compared to 6% in 2018–2019. From demand side, all components were driven down, except Government Final Consumption Expenditure (GFCE) which provided sustained support to aggregate demand (Table 2).
GVA at Basic Prices by Economic Activity.
Final Expenditures and GDP.
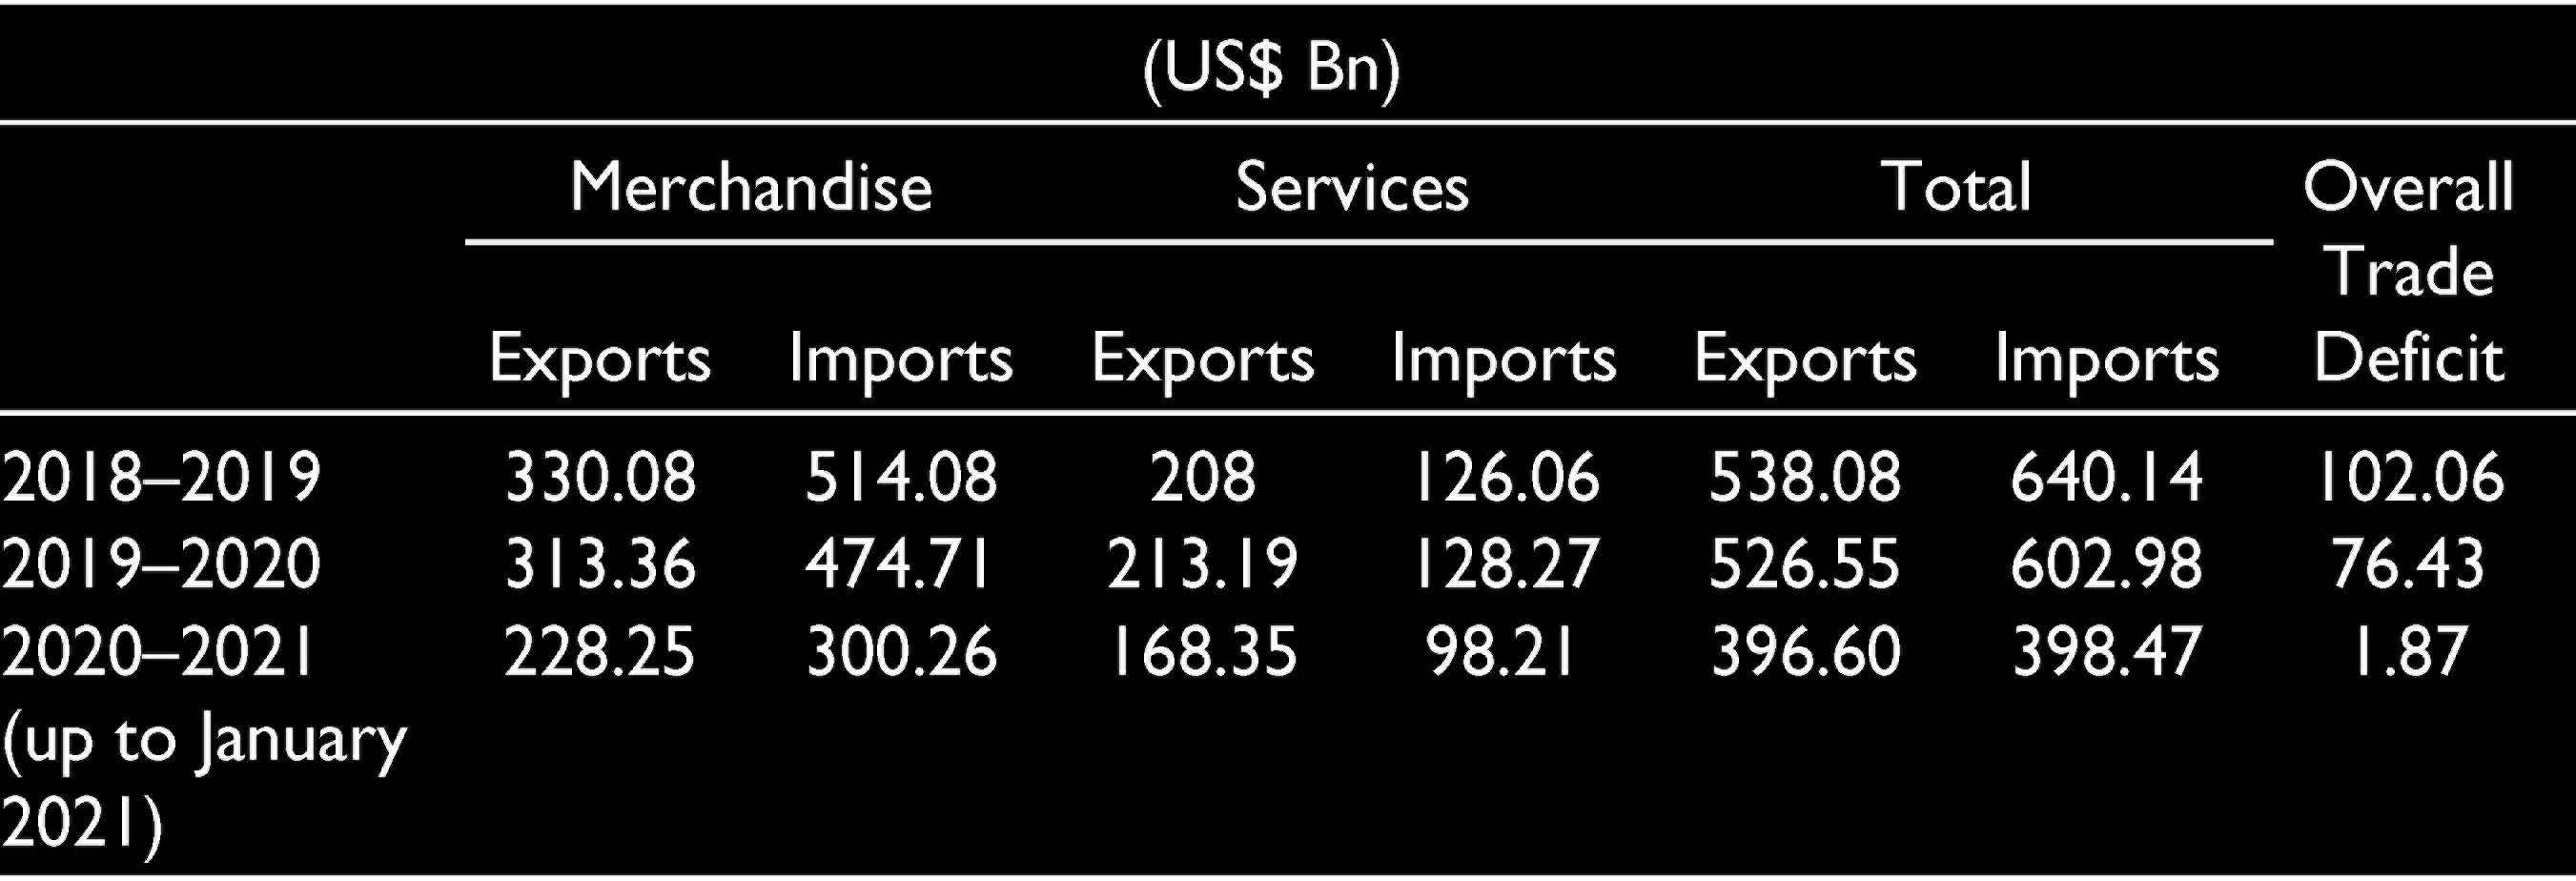
The total exports and imports during 2019–2020 contracted by (–)2.14% and (–)5.80%, as compared to that of 2018–2019, respectively, which resulted in contraction in trade deficit during the year. Overall trade deficit in 2019–2020 was US$76.4 billion, which was lower than the deficit of US$102.1 billion in 2018–2019.
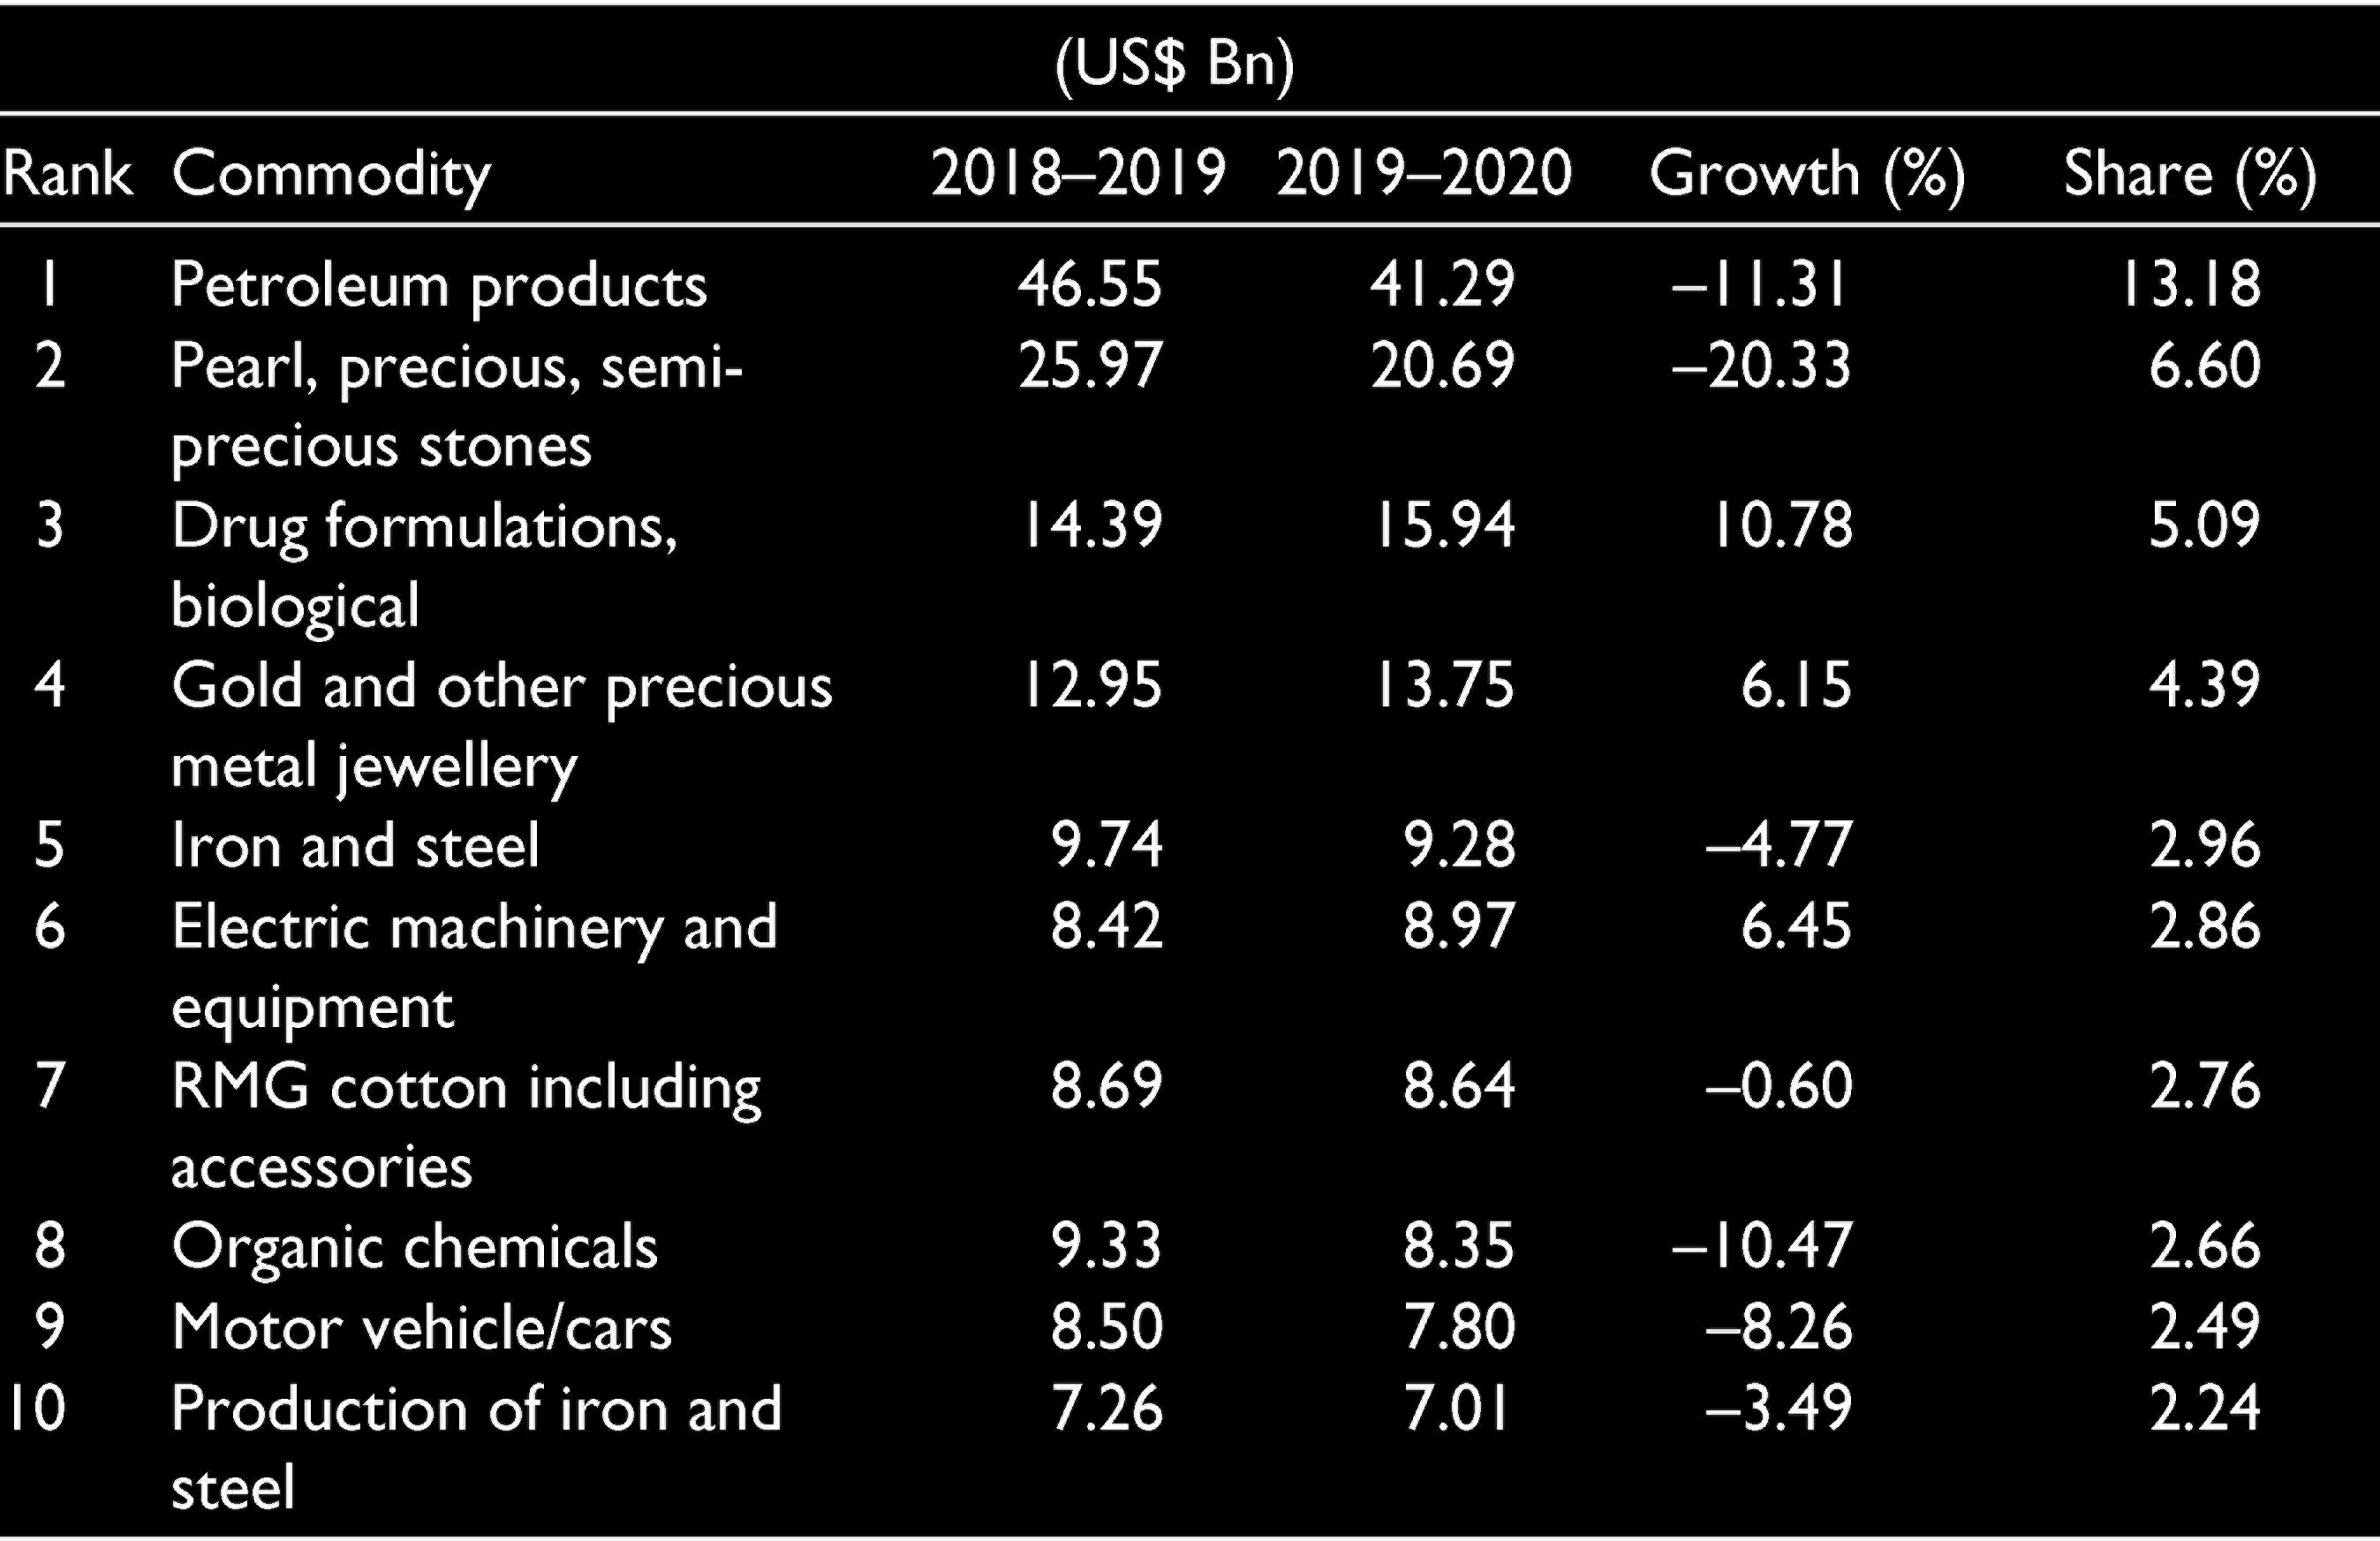
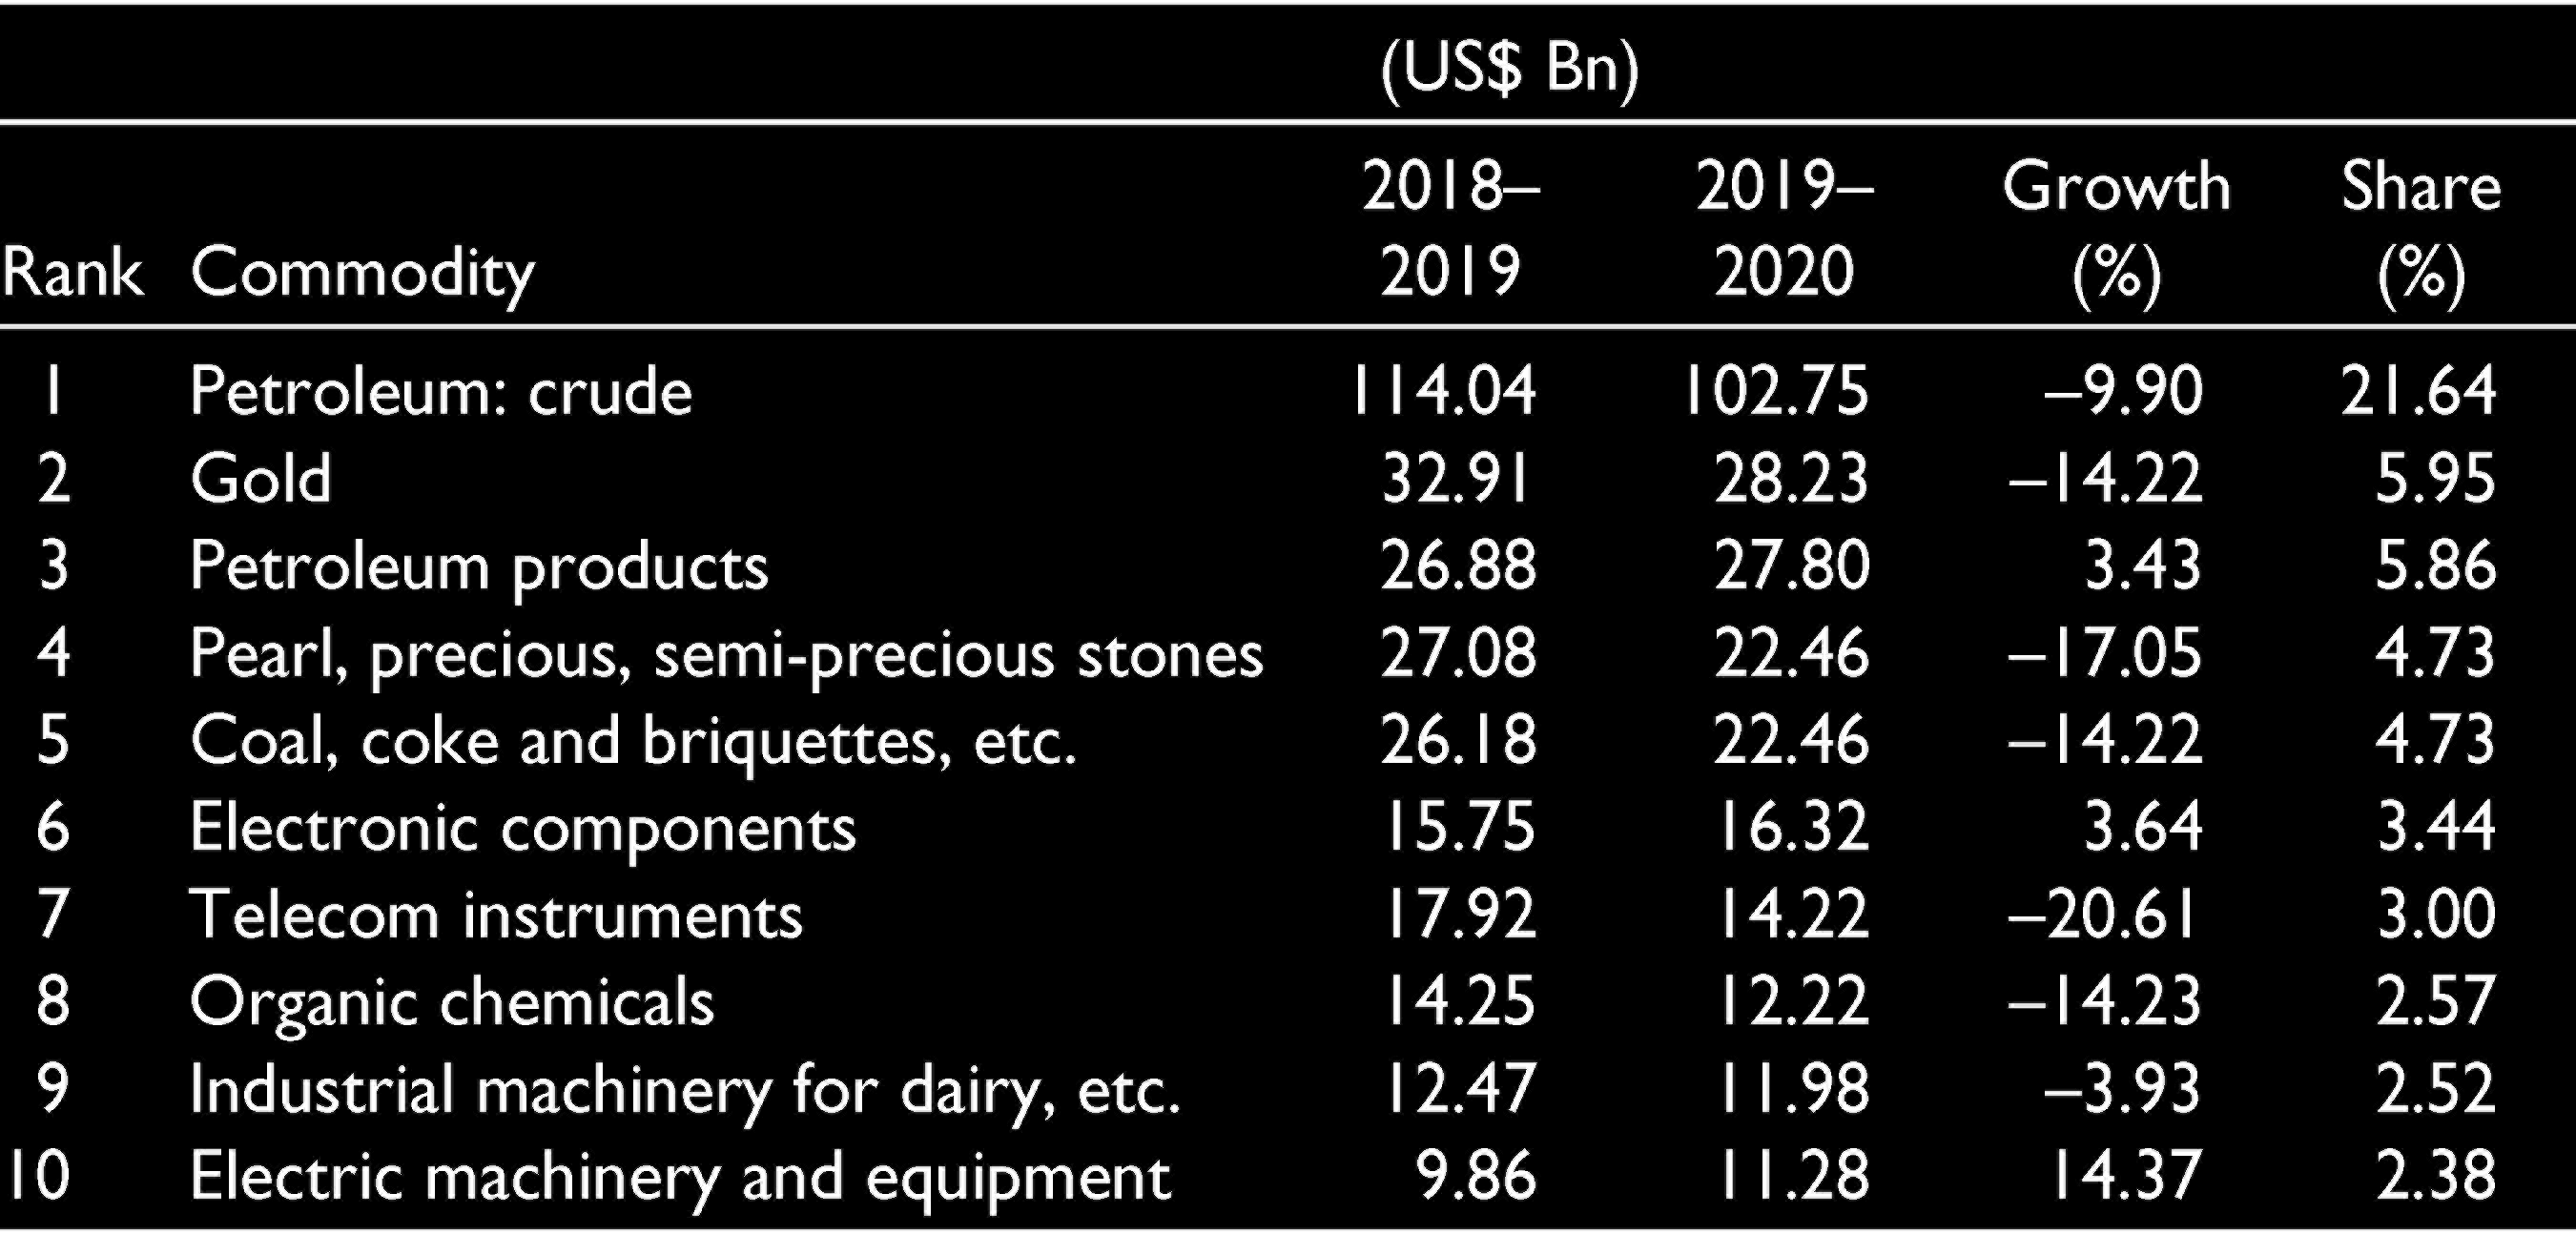
The merchandise exports during 2019–2020 was US$313.4 billion as against US$330.1 billion during 2018–2019, registering a negative growth of (–)4.78% (Table 3). This is mainly due to a major fall in export of ‘petroleum products’, ‘pearls, precious and semi-precious stones’ and ‘organic chemicals’ registering a fall in growth of more than 10% in each from the level in 2018–2019 (Table 4).
India’s Foreign Trade.
Exports of Top 10 Commodities in 2019–2020.
The merchandise imports during 2019–2020, on the other hand, was US$474.Seven billion as against US$514.1 billion in 2018–2019, registering a negative growth of (–)9.12%. Out of the top 10 commodities of imports in India in 2019–2020, commodities such as gold, pearl, precious, semi-precious stones, coal, coke and briquettes and so on, telecom instruments, and organic chemicals registered a fall in growth of more than 14% as compared to that in 2018–2019 (Table 5).
Imports of Top 10 Commodities in 2019–2020.
The Consumer Price Index (Combined) (CPI-C) inflation for 2019–2020 increased to 4.8% from 3.4% in 2018–2019. Inflation in food and beverages (having a weight of about 46% in CPI-C) increased from 0.7% in 2018–2019 to 6.0% in 2019–2020. This was mainly because of delayed southwest monsoon, combined with unseasonal rains during the kharif harvest period which became the cause for food inflation. The contribution of the fuel group to inflation decreased to 1.9% in 2019–2020 from 11.3% in the previous year. Inflation measured in terms of Wholesale Price Index (WPI) remained subdued during 2019–2020 and stood at 1.7% as compared to 4.3% in 2018–2019 due to deflation in prices of non-food manufactured products, fuel and power.
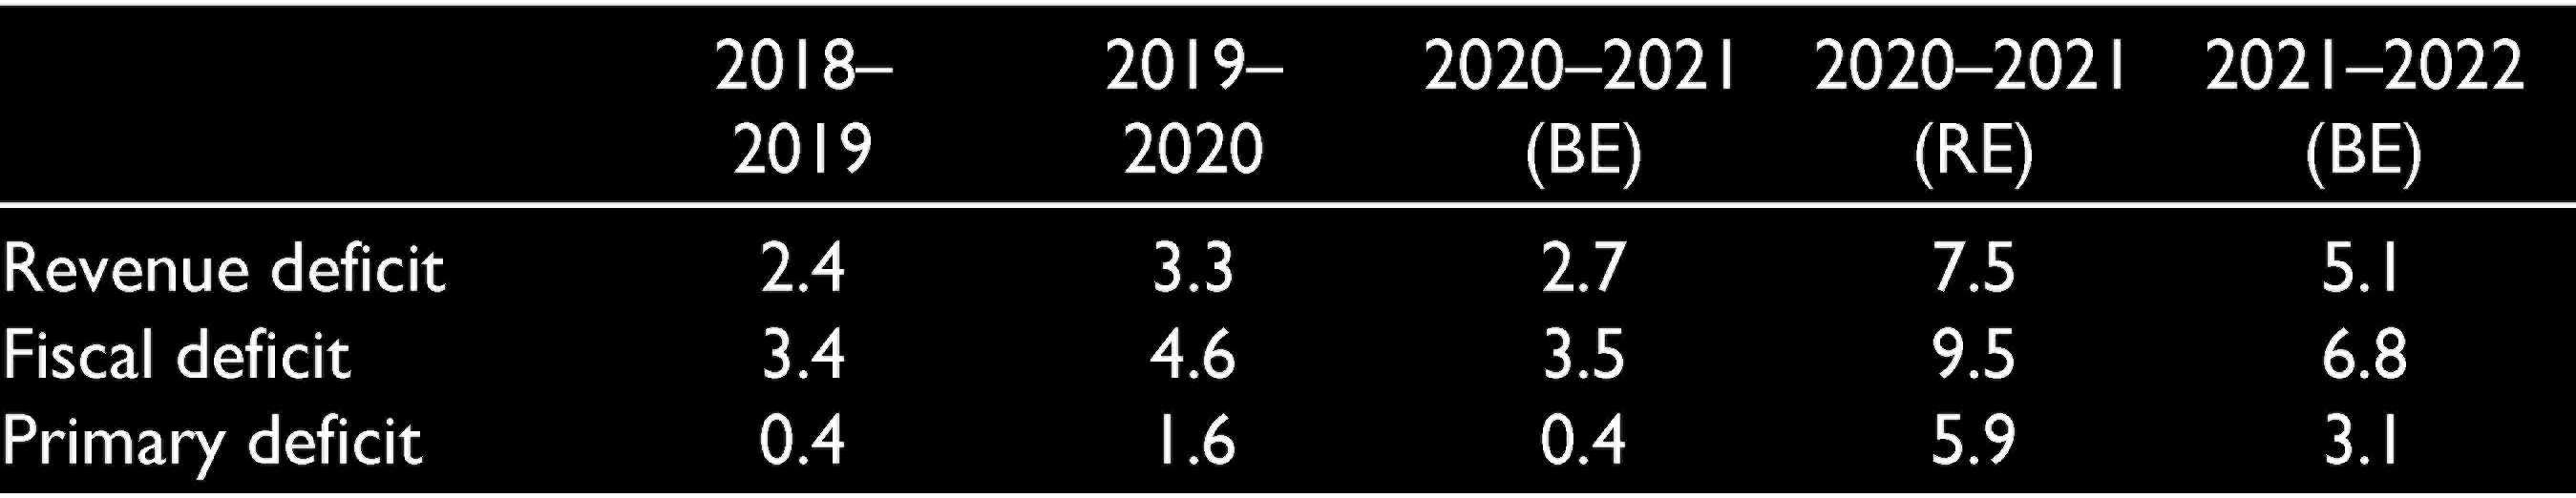
The fiscal deficit for 2019–2020 was budgeted at 3.3% of GDP. The envisaged growth for gross tax revenue was 9.5% and 3.4% for total expenditure over 2018–2019 RE. The gross tax revenue, however, registered a fall of 3.38% over 2018–2019, and total expenditure registered a growth of 16.03% over 2018–2019 (Table 6). With slowing economy and declining tax revenue collection, falling disinvestment, increased expenditure on subsidy and so on, fiscal deficit worsened to 4.6% of GDP in 2019–2020 as against 3.4% in 2018–2019 (Table 7).
Central Finances at Glance.
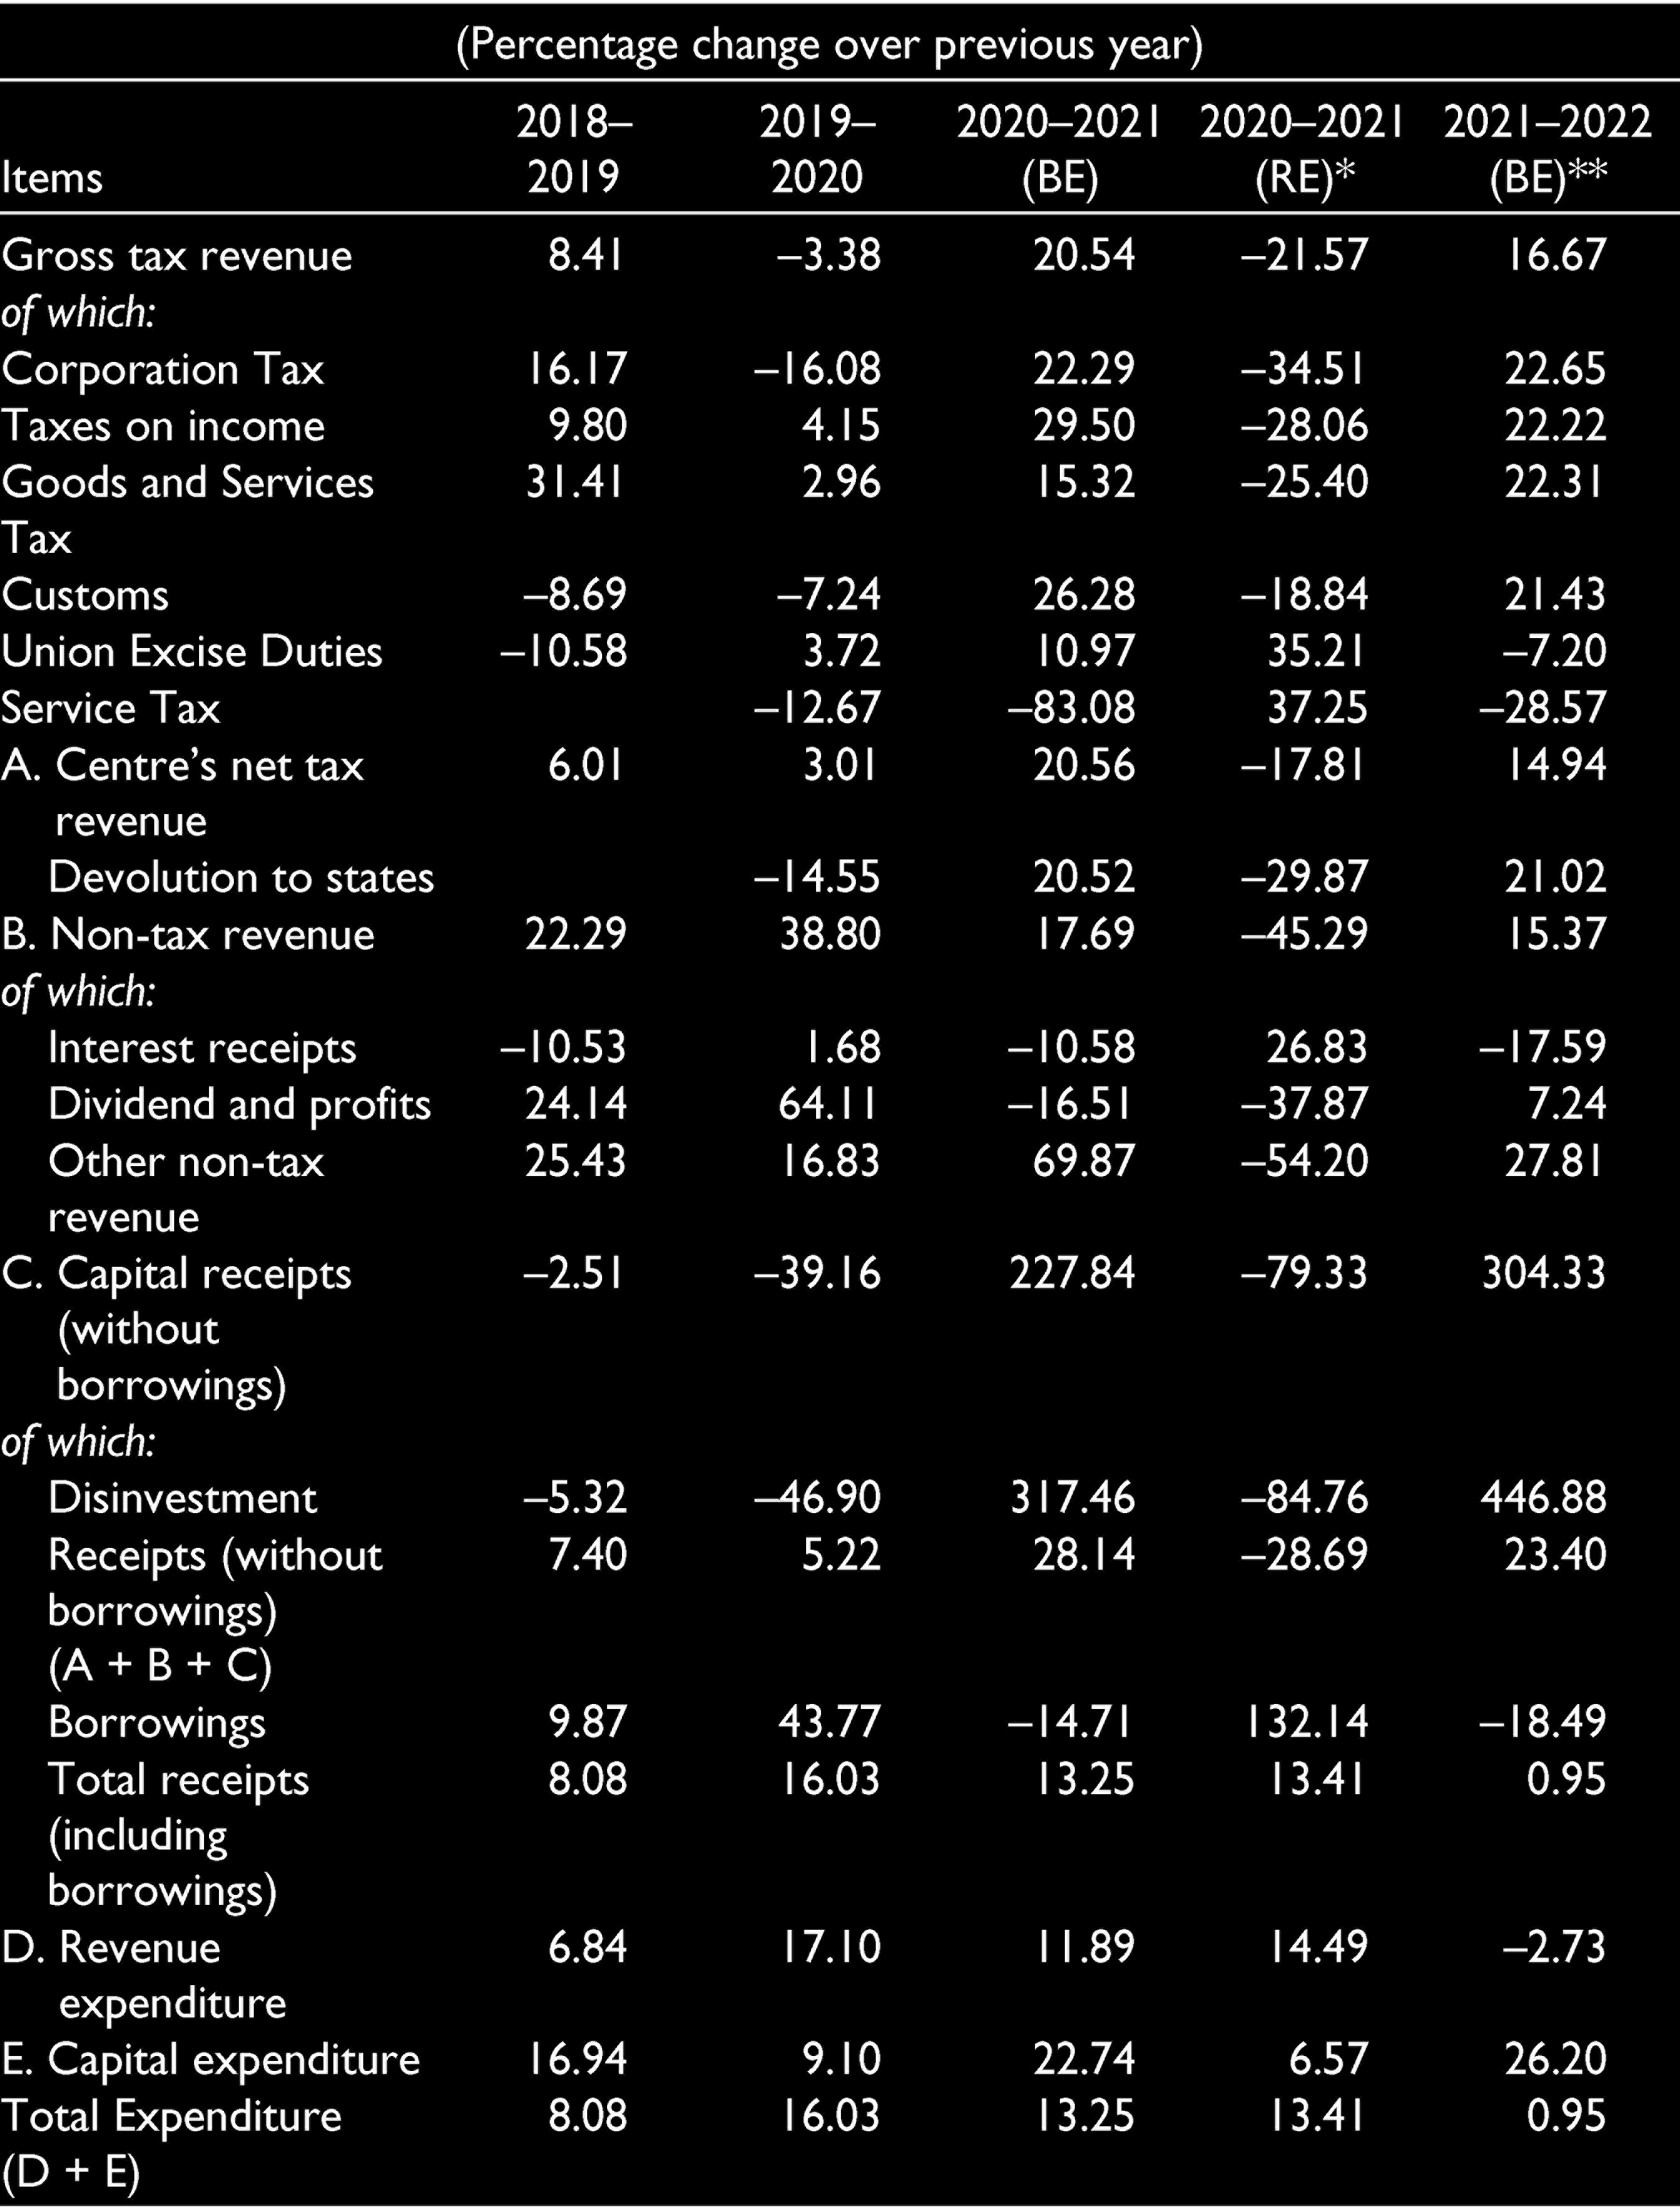
** the percentage change is over 2020–2021 (RE).
Deficits (as % of GDP).
Outbreak of Covid-19 Crisis
Global Spread
The coronavirus pandemic has reshaped the world. It started as an inexplicable pneumonia-like ailment in Wuhan, China, and got spread across 221 nations and domains, including Antarctica (in December 2020). As of 9 March 2021, the virus infected more than 117.7 million individuals, with 2.6 million reported deaths. North and South America were the most awfully struck areas as far as case tally and fatalities are concerned. However, Asia witnessed a surge in cases and fatalities due to the covid wave in India. The worldwide economy crashed, as containment and mitigation endeavours continued to interrupt manufacturing, education, the financial sector and other prospects of life. The United States emerged as the leading country in terms of all the parameters, that is, total number of reported cases, deaths and active cases. India had the second highest number of total reported cases followed by Brazil and Russia, but the total number of reported deaths was below that of Brazil. The figures of France were cause of concern because its total number of recovered patients was lowest and the number of active cases was the second highest, after the United States. This meant that there was a surge in number of people getting affected with coronavirus, but the recovery rate was very low, and, if continued, this might raise the Case Fatality Rate (CFR) in France. The total number of reported cases, recovered cases, active cases and deaths in the world and the top 10 most effected countries are given in Table 8.
COVID-19 Reported Cases in Top 10 Countries vis-à-vis Global.
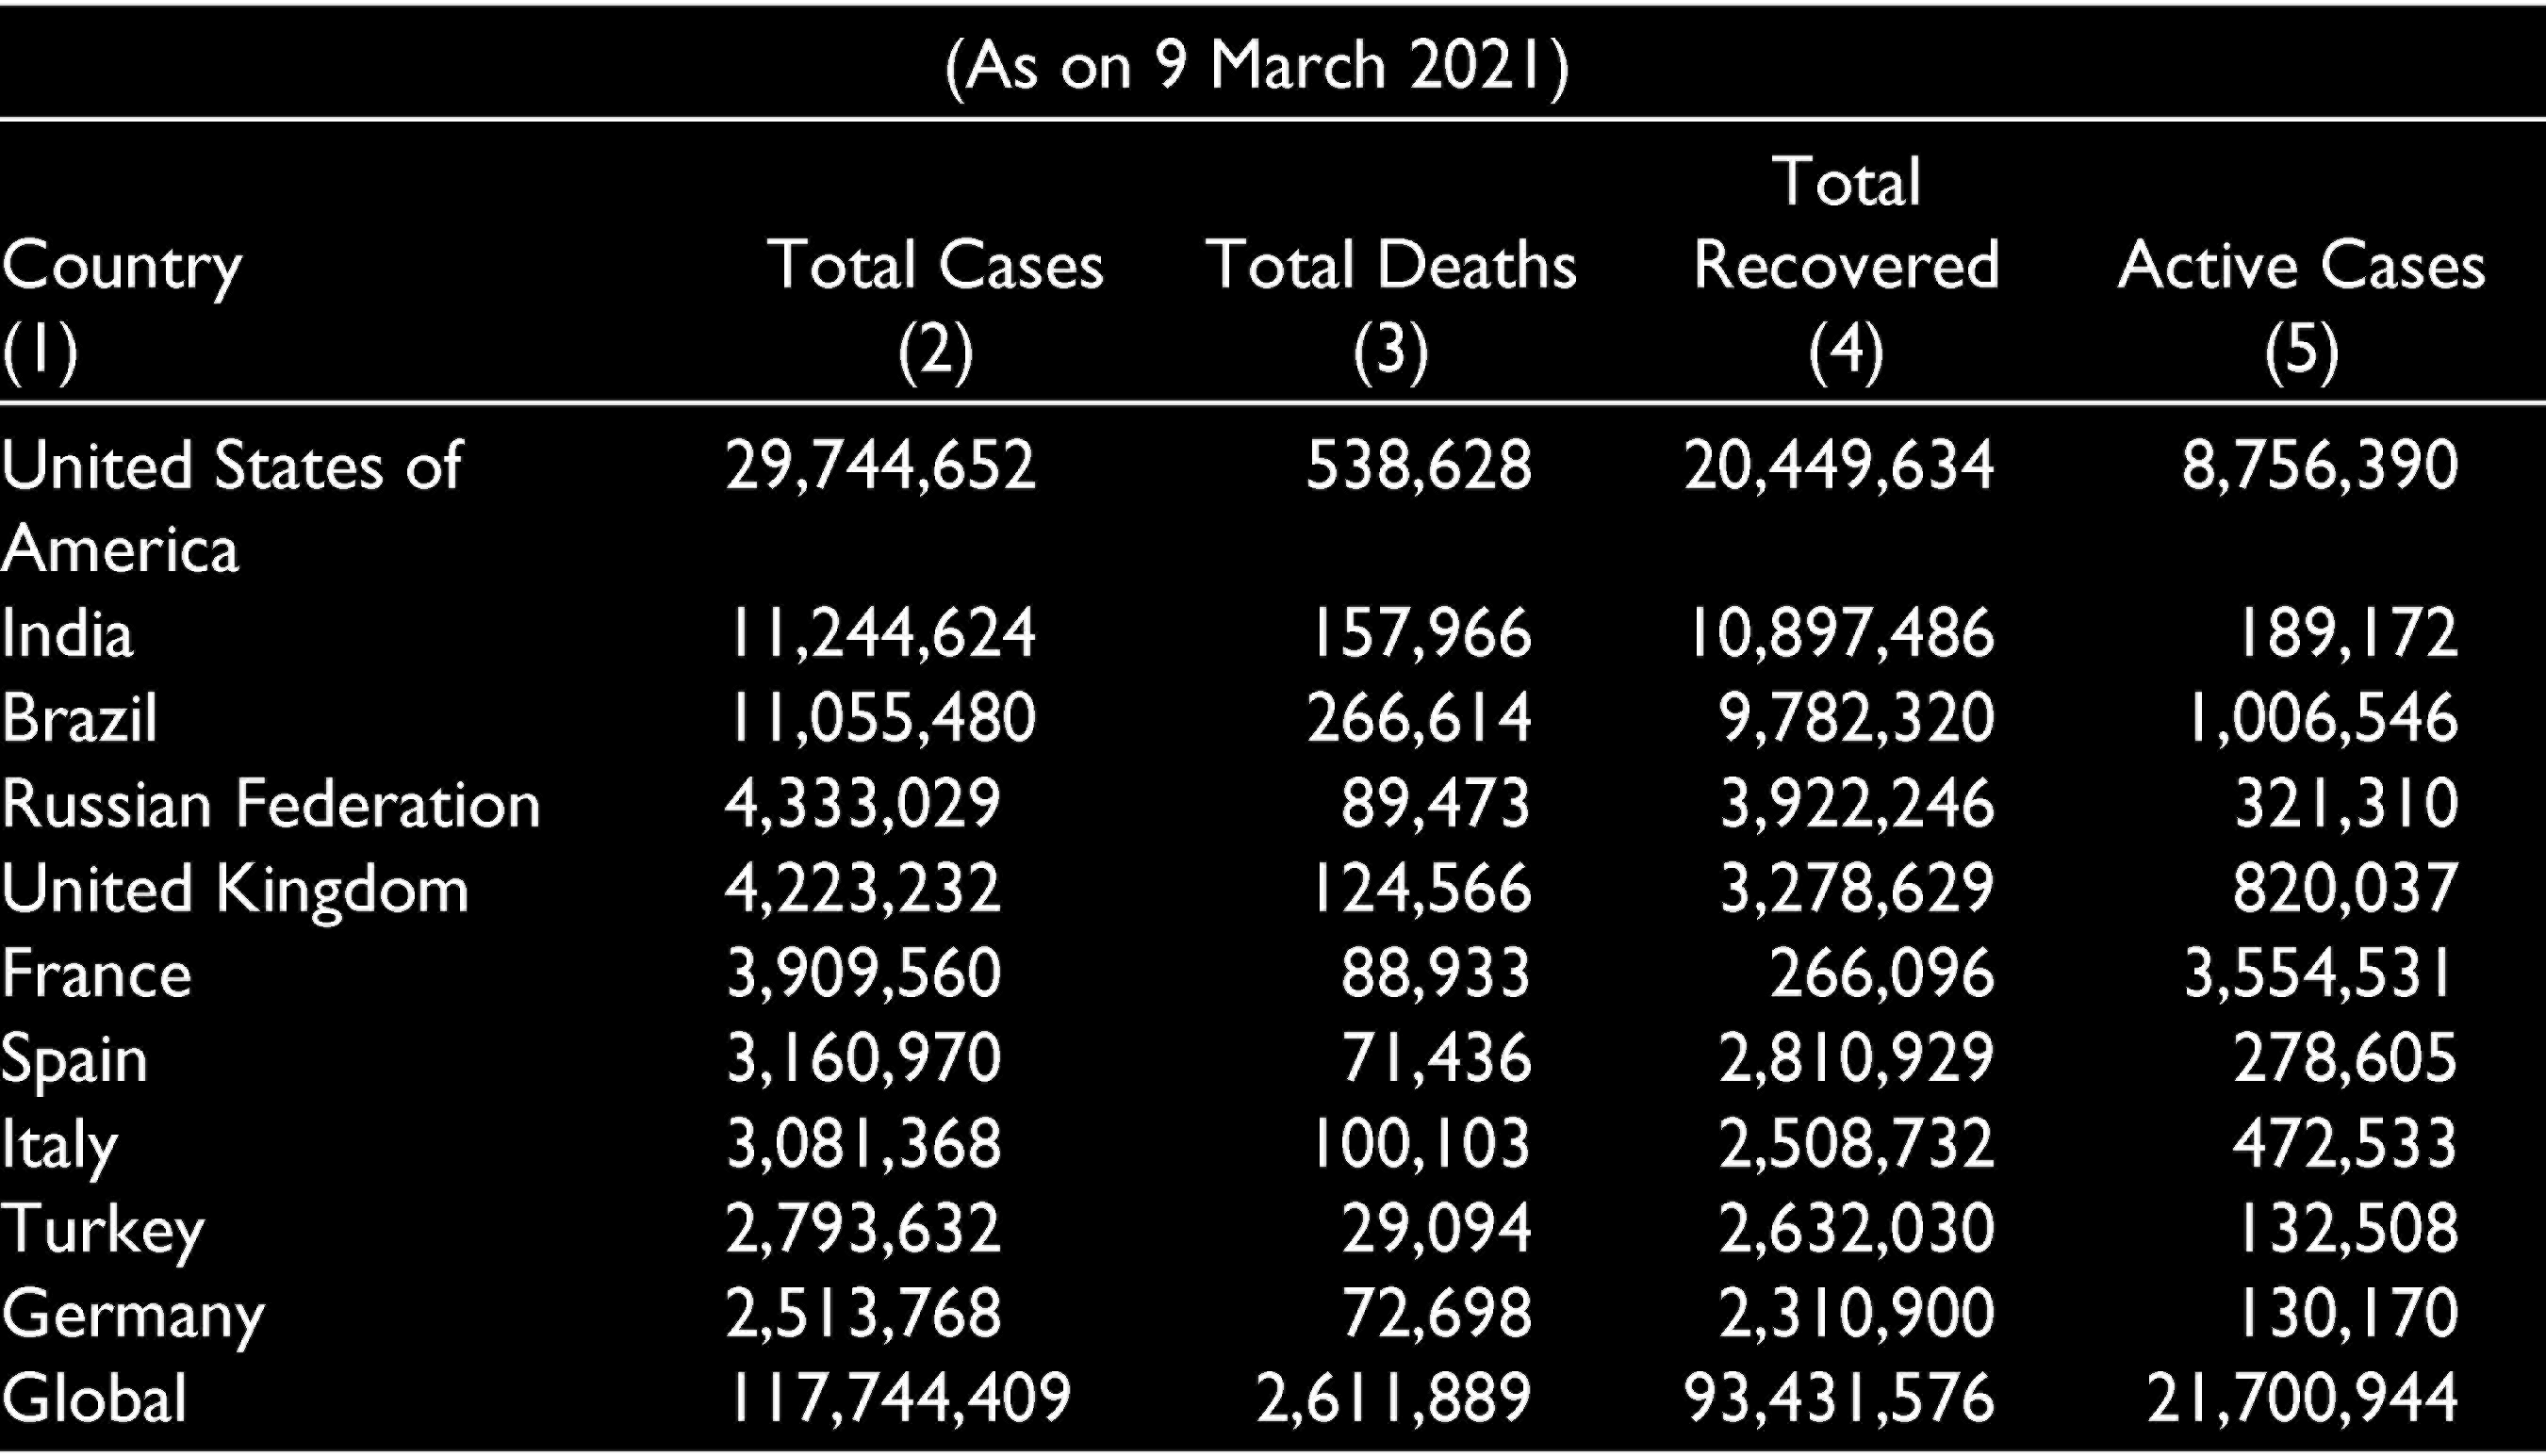
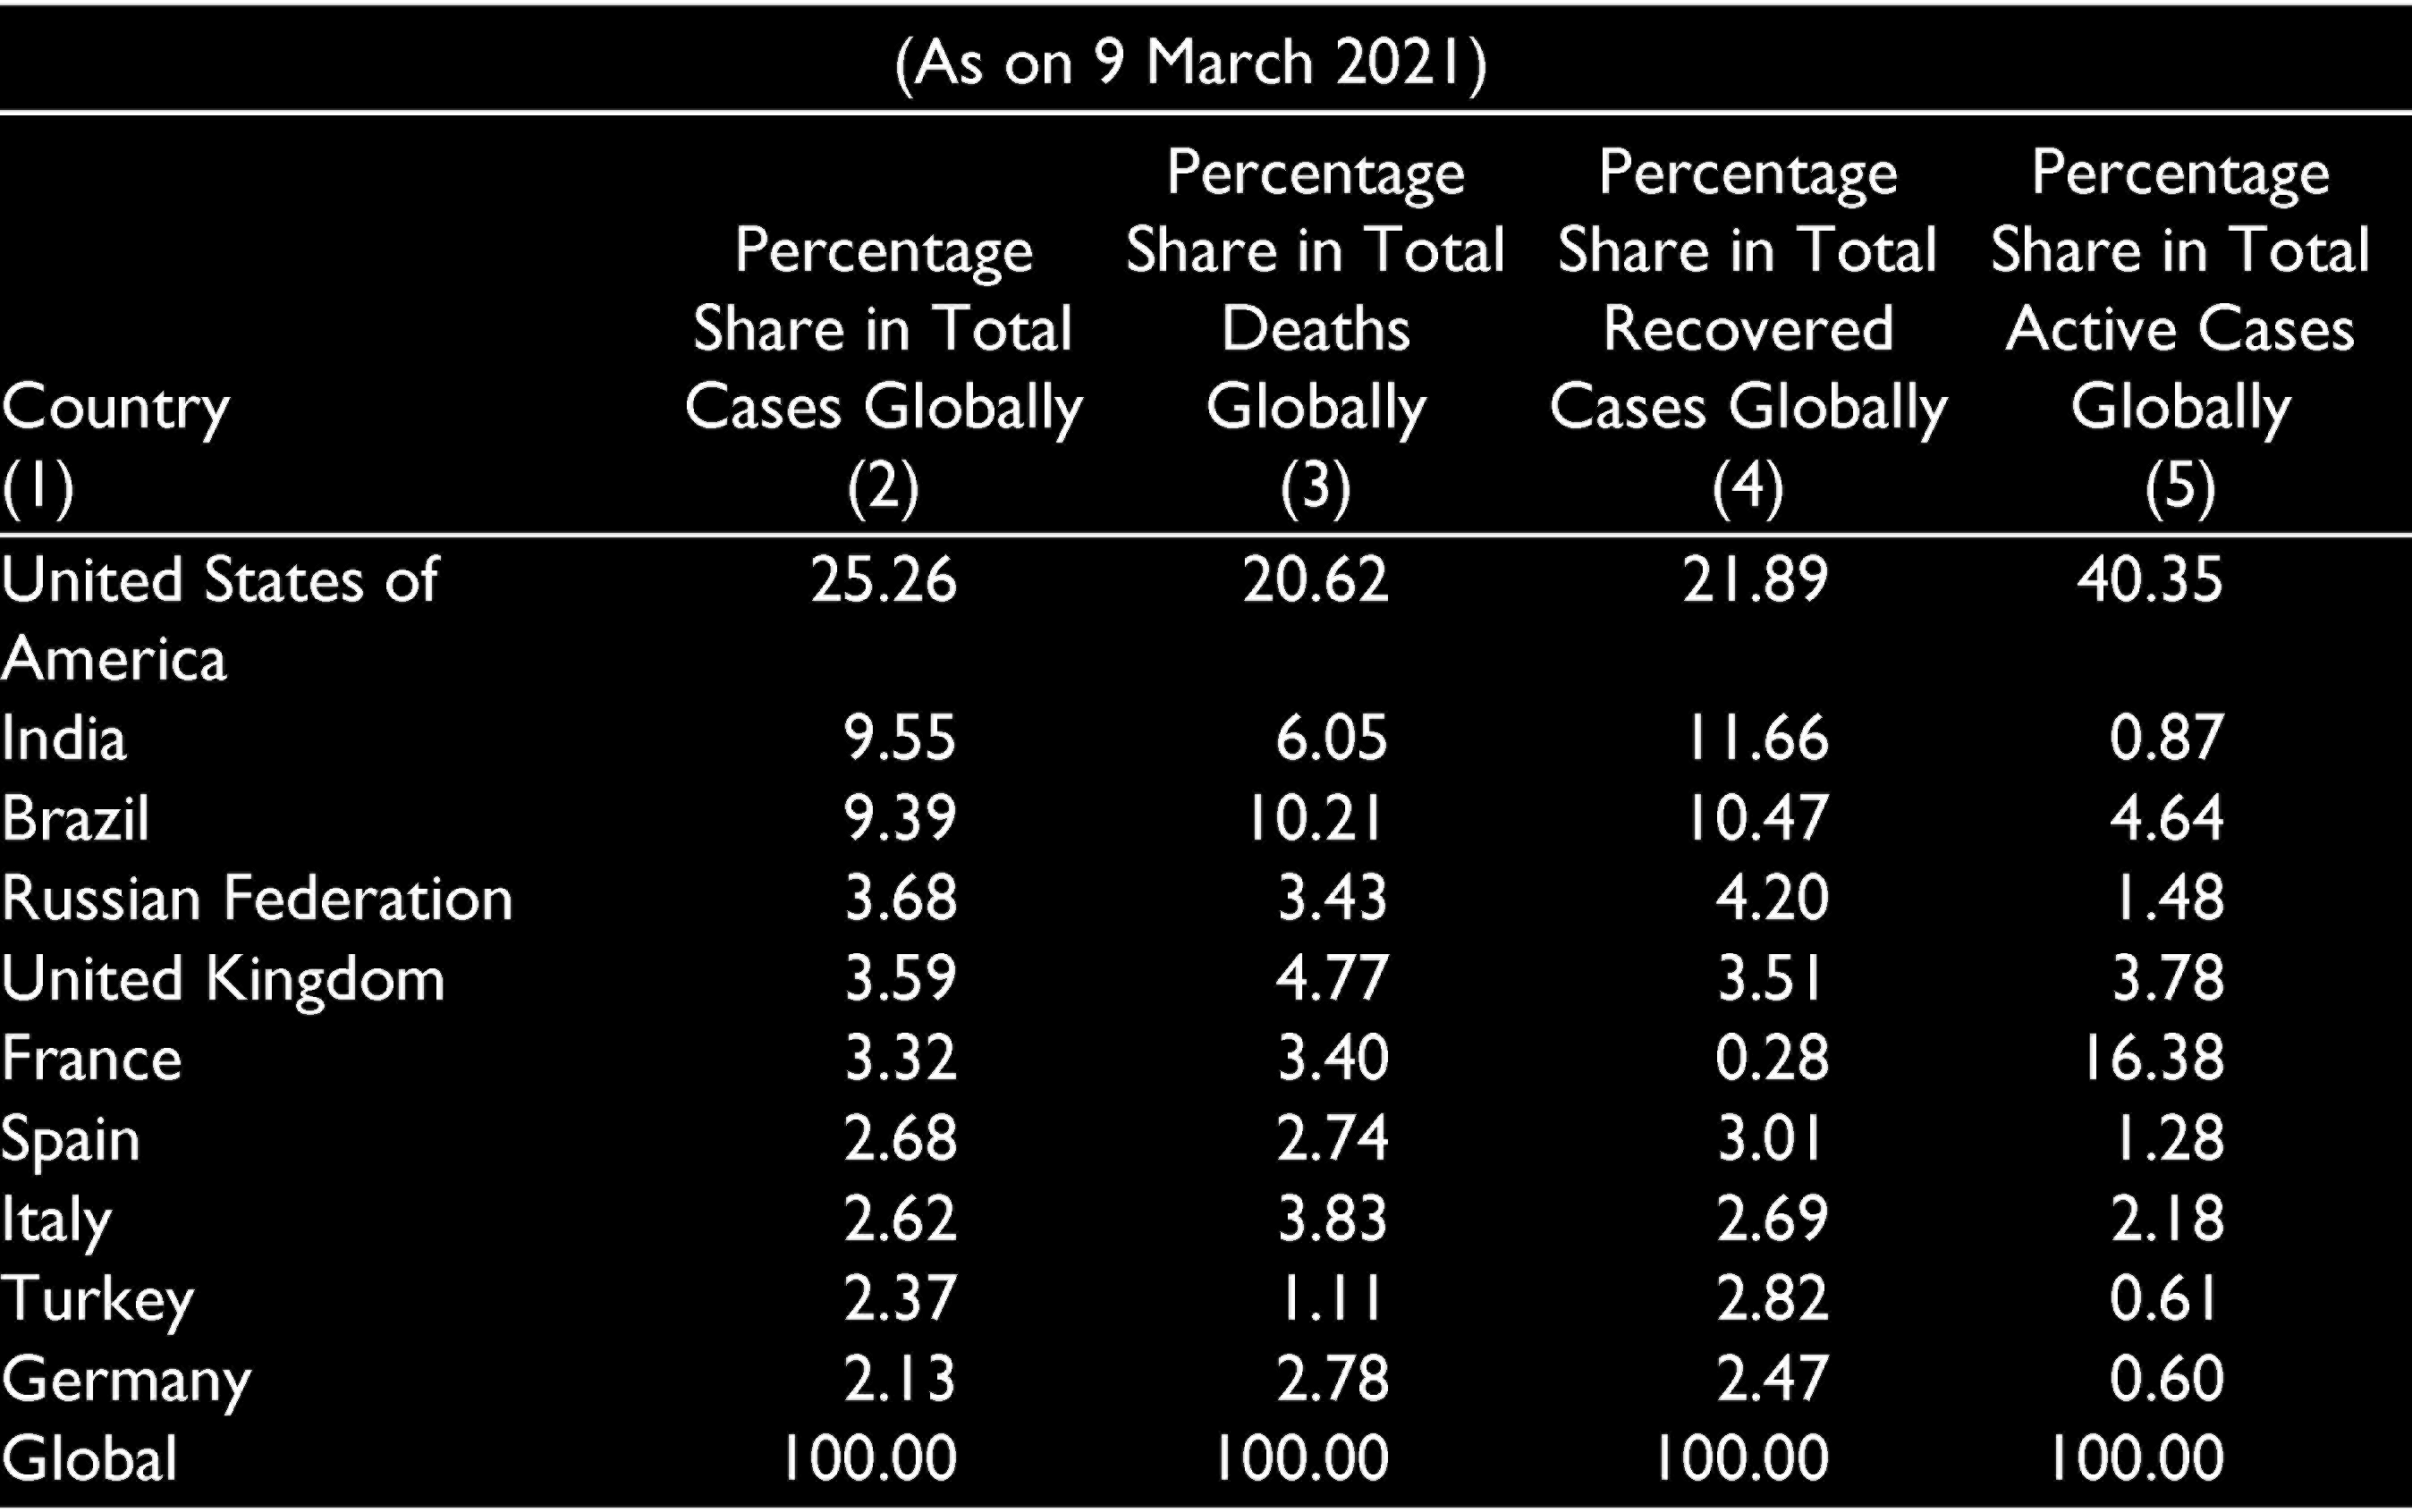
Table 9 shows the percentage share of each country in the total number of reported cases, recovered cases, active cases and deaths in the world. From the total global share of total coronavirus affected cases, about one-fifth of the total number of deaths and recovered people were from the United States, and it also had one-fourth share in the total number of cases. As on 9 March 2021, more than 50% of the total active cases were coming from the United States and France. Among the top 10 most affected countries, India had one of the lowest shares in total active cases globally, after Germany and Turkey. India and Brazil had negligible difference in the share of total reported cases globally, that is, 9.55% and 9.39%, respectively.
County-wise Share of Reported Cases in the World.
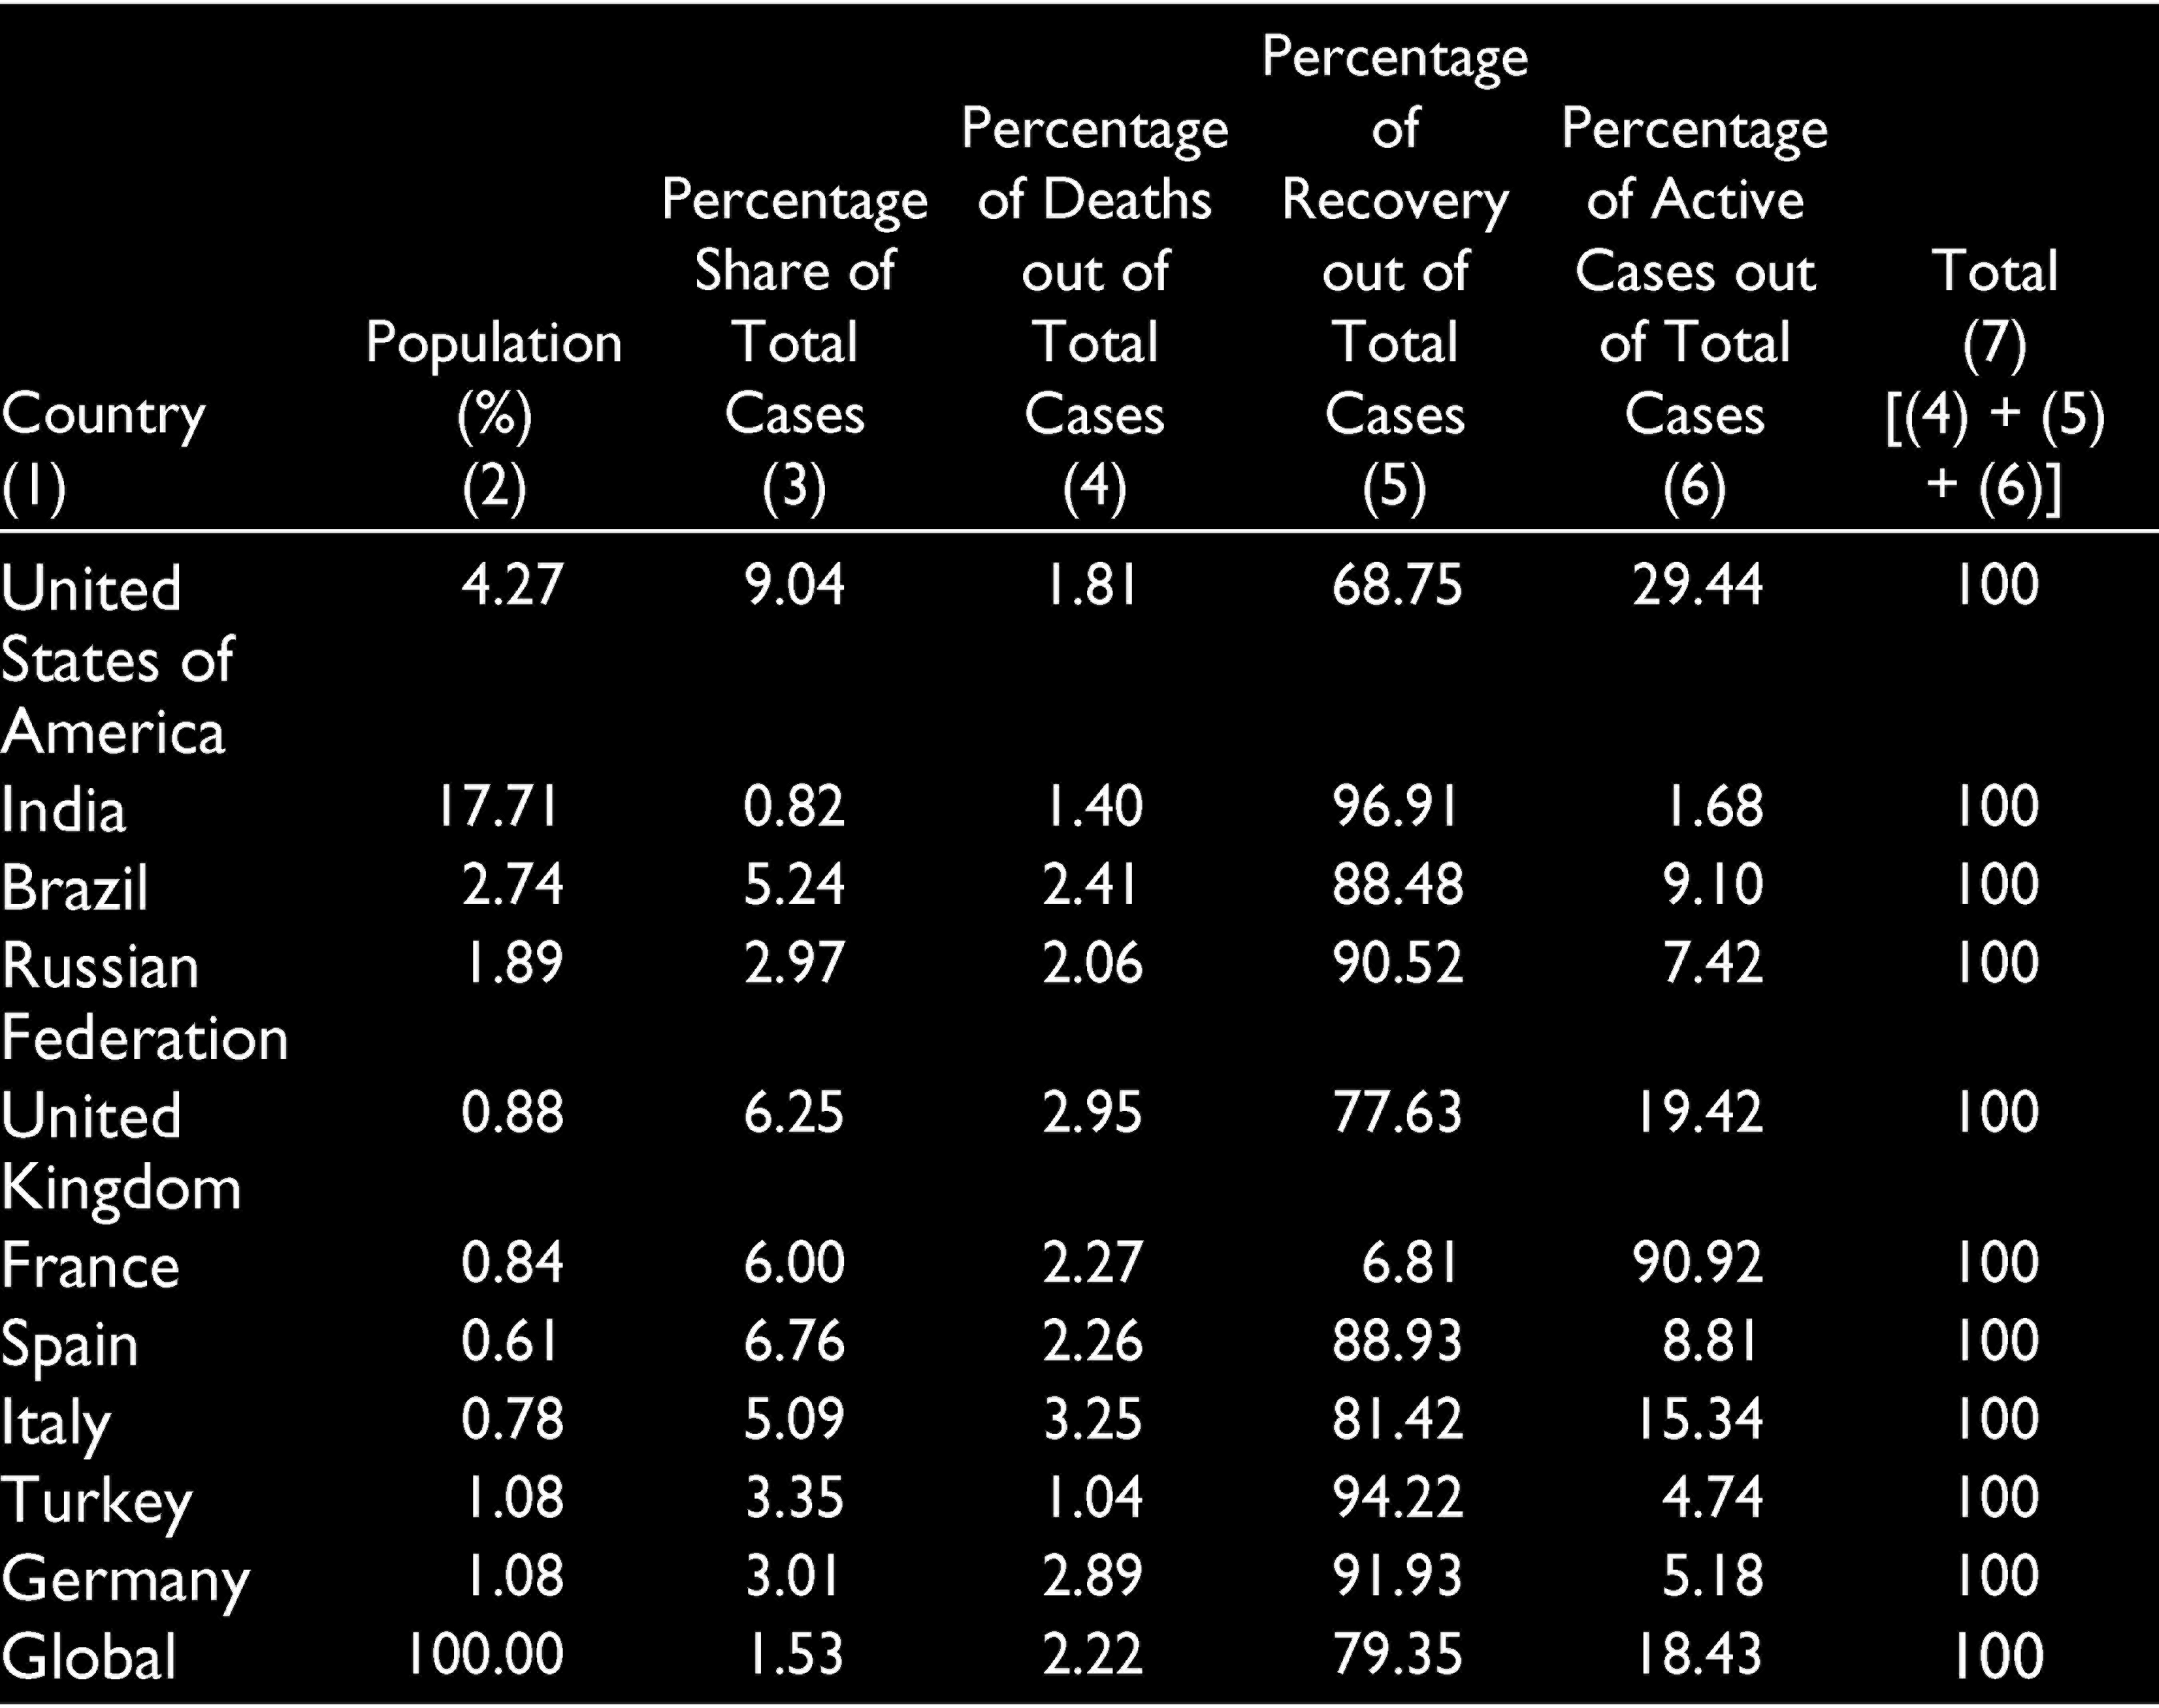
The Column (3) of Table 10 shows that out of the total population of the country, how many had been infected by the coronavirus. Approximately, 1.53% of the total population in the world had been infected by the coronavirus till 9th March 2021. The United States had highest percentage (9.04%) of infected population from the disease, and India had the lowest percentage (0.82%) of infected population. In the Column (3), the values represent that out of the total infected cases, what percentage of people had died after getting infected in a country. Globally, out of the total cases reported, 2.22% of people had died. The highest percentage of deaths had taken place in Italy and lowest in Turkey, out of the number of cases reported in the respective countries. The recovery rate at the global level was 79.35% and, among all the nations, India had the highest rate of recovery, that is, 96.91%. Out of total cases, France had 6.81% of recovery rate, and 90.92% of active cases out of the total cases reported within the country.
Share of Total Cases Reported Out of the Country’s Population.
Spread in India
India’s first novel coronavirus patient was reported on 30 January 2020 in Kerala’s Thrissur district. At that time, more than 7,500 cases were reported in 20 countries of the world. As on 9 March 2021, India had the highest number of confirmed cases in Asia, and the second-highest number of confirmed cases globally after the United States, which had more than million confirmed cases and more than 157,000 deaths. The per-day cases peaked during mid-September in India with more than 90,000 cases reported each day, which decreased to under 15,000 starting as of 2021 January. A majority of those infected had a travel history to countries such as Italy, China and Iran, as per the analysis of the Ministry of Health and Family Welfare, GoI.
The Economic Survey 2020–2021 rightly quotes that Covid-19 is once-in-a-century crisis by giving three reasons. First, the crisis was a health-induced slowdown and its impact got compounded due to unknown nature of virus and the high CFR of 2–6% for April–March 2020. Owing to the unknown nature of virus in terms of reproduction number (R0) and CFR, there was a nationwide lockdown imposed in the major economies of the world, leading to limited economic activities. This was a rarely observed phenomenon because it was not a war or financial crisis but a health-induced crisis. Second, it was a synchronised crisis as 85–90% of economies were hitting recession as two successive quarters with falling GDP or negative GDP growth. This meant that recession was compounded in an interconnected world because of the disruption in global supply chain and global demand failure. Third, that the crisis was creating a trade-off between life and livelihood which meant that saving life was given precedence over generating livelihood, in the short run. This kind of crisis required an immediate policy intervention such as active surveillance, early detection, contact tracing, quarantine, case management and prevention of spread.
Dealing with the Pandemic
Measures India Took to Control the Coronavirus Spread
The Indian government had announced strategic multi-pronged policy response to minimise the entry and spread of coronavirus. Some of the immediate responses were increasing the testing capacity across the nation; building up the capacity to meet the requirements of Personal Protective Equipment (PPE), masks and ventilators; setting up of 24×7 helpline number to address queries related to coronavirus; travel and entry restrictions in the country; nationwide lockdown; stimulus package for the poor, and so on. Some of the major steps taken by the government are described in detail as follows:
Legal Provisions and Nationwide Lockdown
India’s response to the Covid-19 pandemic was predominantly dealt with the following laws:
The Disaster Management Act (DMA), 2005 The Epidemic Disease Act (EDA), 1897 The Indian Penal Code (IPC), 1860
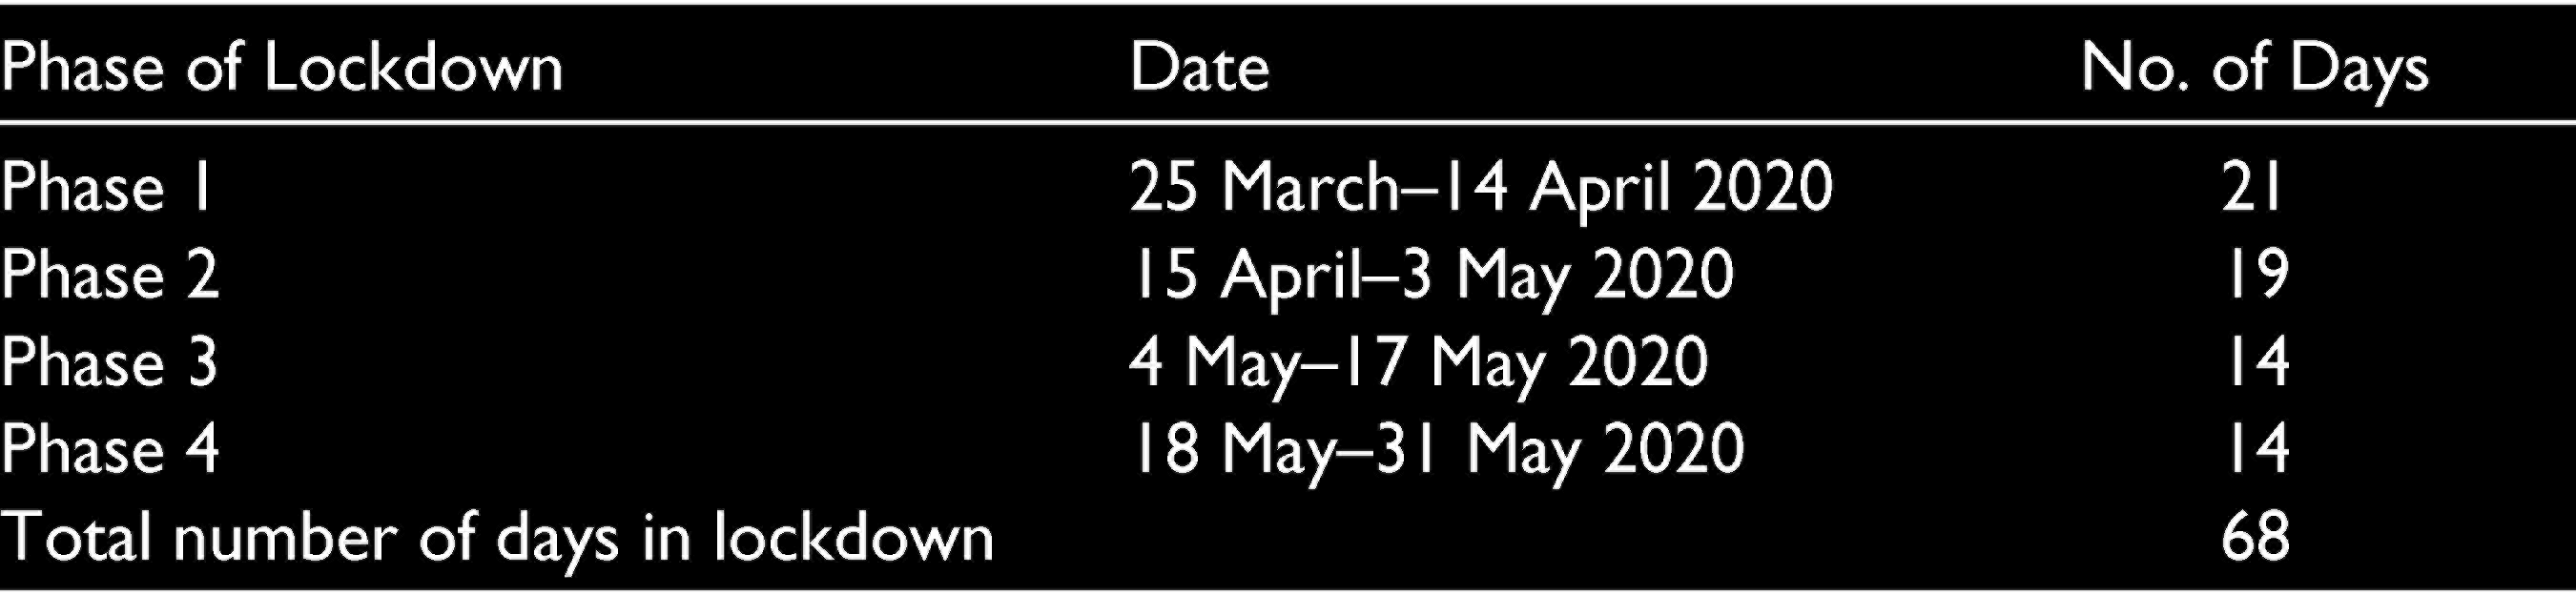
After the declaration of the coronavirus pandemic as a notified disaster, the National Executive Committee of the National Disaster Management Authority (NDMA), set up under the Disaster Management Act, had imposed the graded lockdowns (starting from 24 March 2020) as shown in Table 11. The Centre issued periodic guidelines to states to enforce the lockdowns. The EDA 1897 was used simultaneously, by both the Central and the state governments, to address the health aspect of the disaster. This was done despite the fact that EDA does not define what constitutes a dangerous epidemic disease. People violating lockdown orders were being charged under Sections 188, 269 and 270 of the IPC.
Phases of Lockdown During COVID Period.
Some of the states or Union Territories such as Andhra Pradesh, Bihar, Chandigarh, Chhattisgarh, Delhi, Goa, Gujarat, Himachal Pradesh, Karnataka, Kerala, Madhya Pradesh, Maharashtra, Manipur, Odisha, Punjab, Puducherry, Rajasthan, Sikkim, Tamil Nadu, Telangana, Uttar Pradesh and West Bengal had imposed the partial lockdown (like closing of schools and colleges) even before 24 March 2020.
Evacuation Measures
The GoI started an enormous evacuation of stranded Indian citizens from across the globe called Vande Bharat Mission in the first half of May 2020. It deployed several commercial jets, military transport planes and maritime warships in what is set to be one of the greatest ever peacetime repatriation exercises in history. In the first stage, around 14,800 citizens stranded in 13 nations were brought back by 64 flights. Ministry of Civil Aviation, in co-ordination with the Ministry of External Affairs, planned Stage 2 of the Vande Bharat Mission to bring Indian residents from almost 31 nations all around the world for which 149 flights were deployed. There was another programme named Operation Samudra Setu by the Indian Navy which brought back around two thousand Indians in two ships during the first phase of evacuation.
Fiscal and Monetary Steps
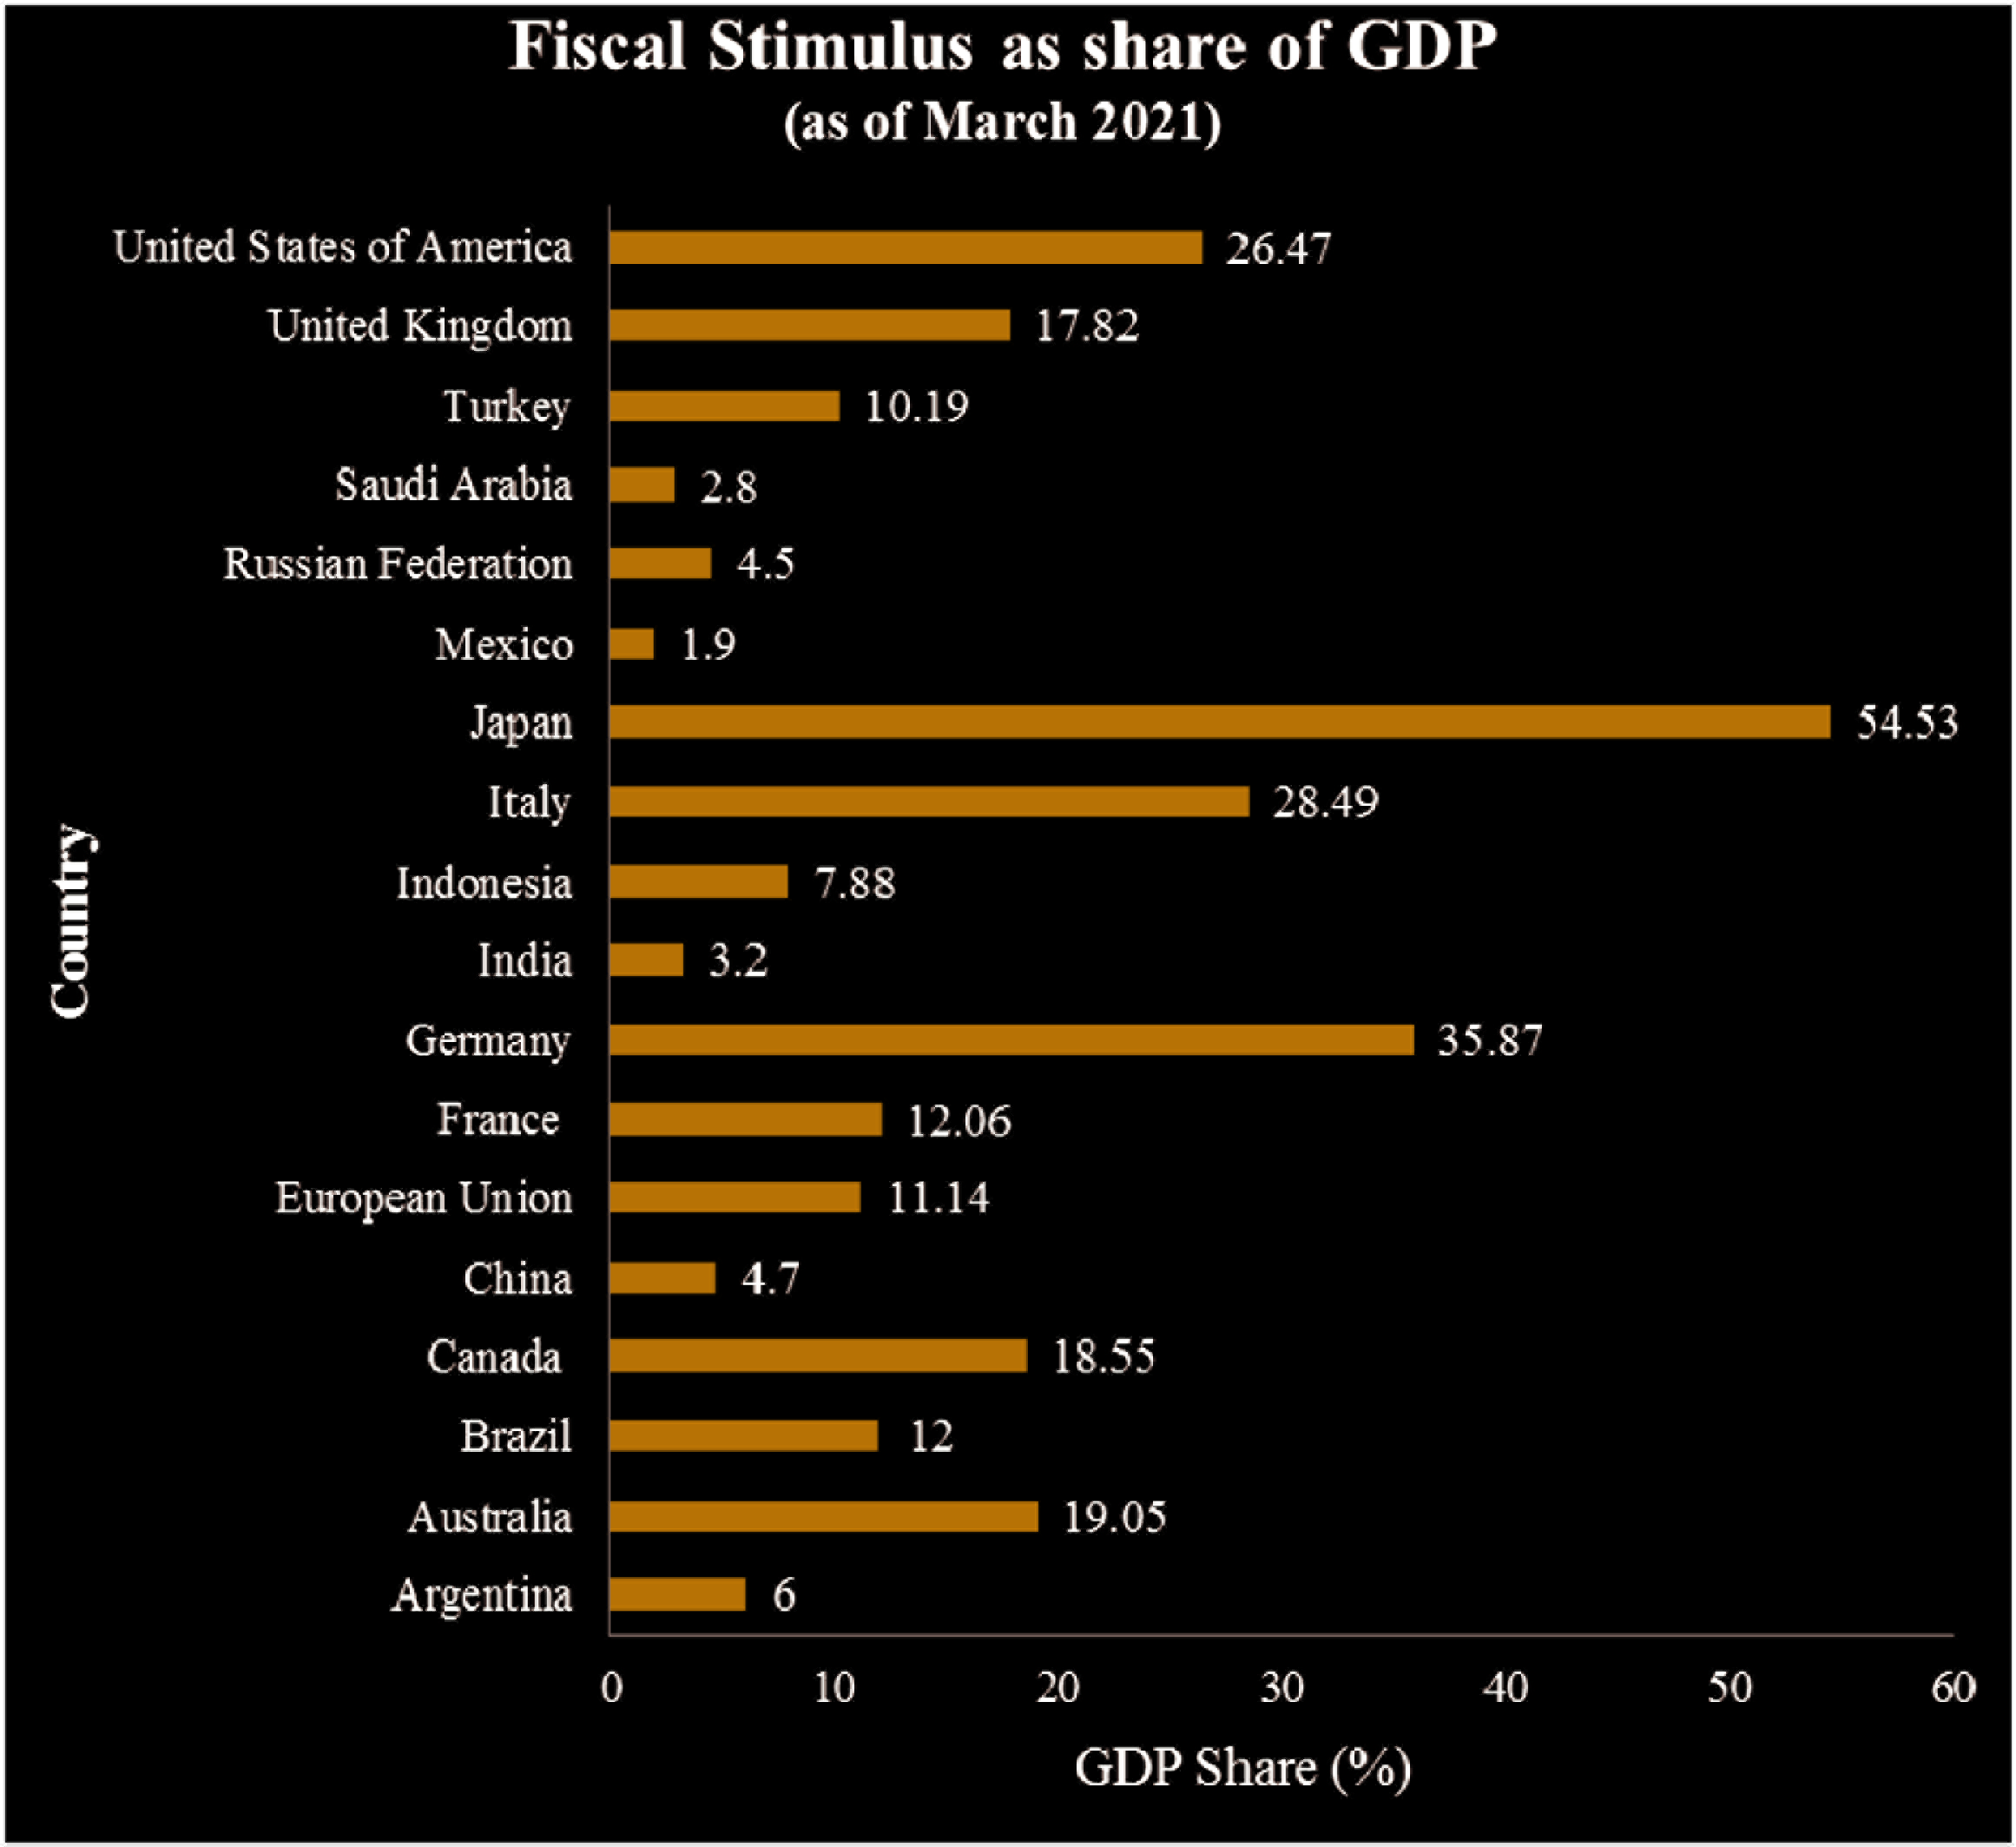
In order to combat Covid-19, the GoI and the RBI adopted a multi-pronged strategy to maintain financial stability and provide necessary regulatory support to assuage both demand and supply constraints posed by the pandemic. The response to pandemic in India through fiscal policy differed from the ways adopted in other countries. In India, the demand stimulus was introduced in a phased manner with prior focus on measures to provide a cushion for the poor and vulnerable sections of the society. The stimulus packages announced by G20 countries as percentage of their GDP as of March 2021 are given at Figure 1.
The Union Finance Minister announced short-term and long-term measures under ANB 1.0. The broad categorisation of the different tranches is given in the Table 12. The MSME sector received the primary focus as it is the heart of Indian industrial ecosystem and employs an estimated 11 crore persons, produces 45% of the country’s total manufacturing output, 40% of exports and almost 30% of the national GDP (Mukul et al., 2020).
Stimulus Package in Response to Covid-19.
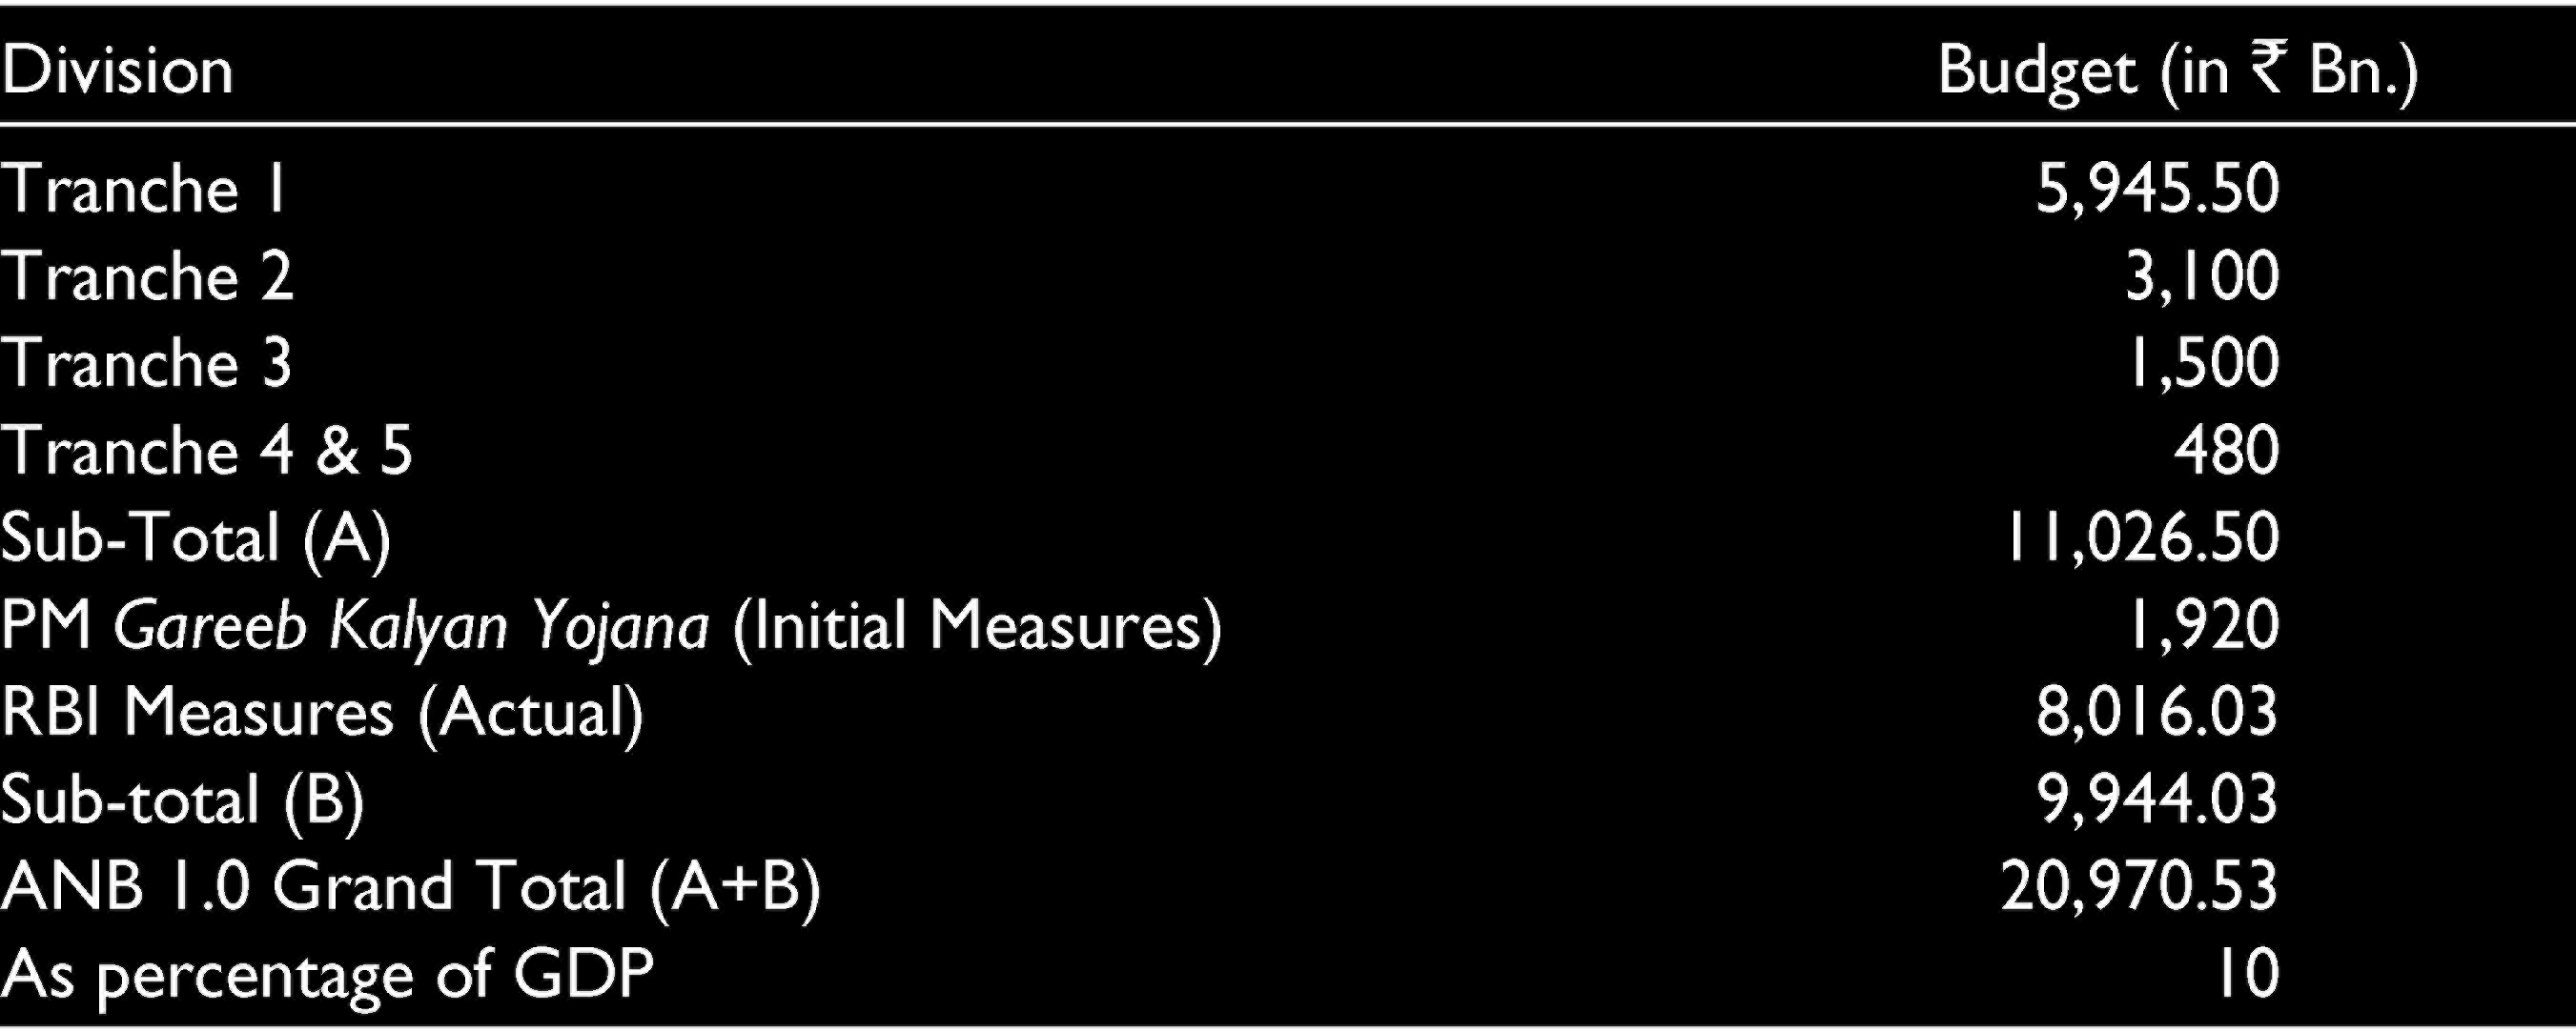
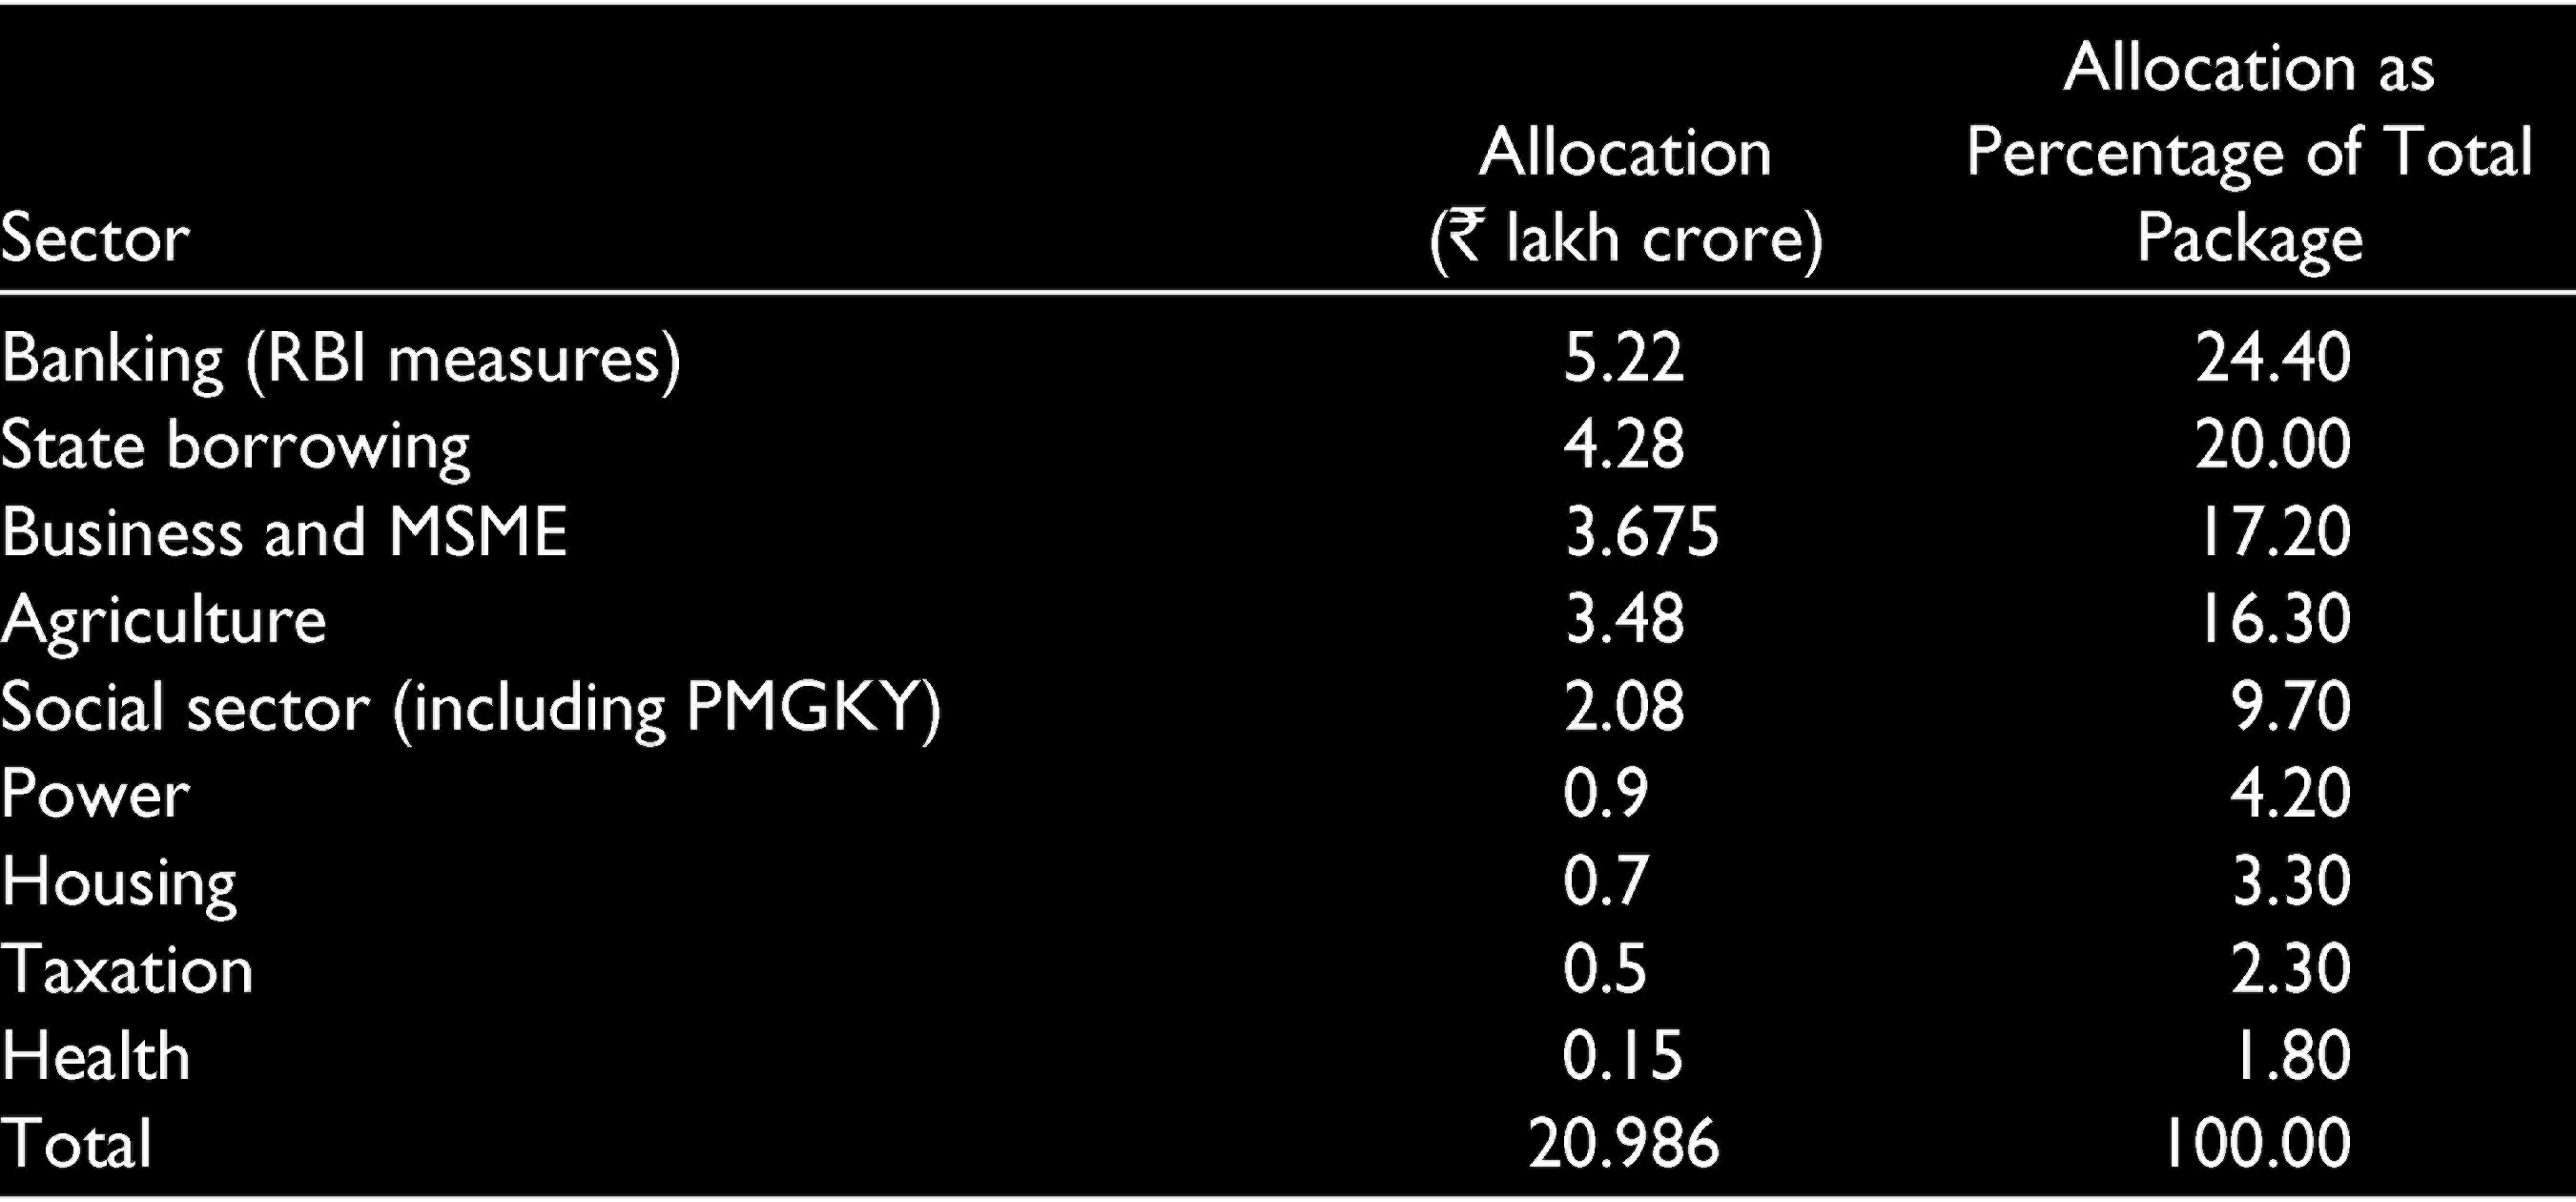
According to the government, the total outlay for ANB 1.0 was approximately 10% of the GDP. The first tranche laid focus on the poor including migrant workers, who were supplied foodgrains; farmers were given additional re-finance support of ₹30,000 crore; Mudra Shishu loanees (loans below ₹50,000) were given interest subvention of 2% for prompt payees; and street vendors were facilitated easy access to credit. In order to include large number of enterprises under the bracket of MSMEs, the government had expanded the definition of MSMEs to make them eligible to avail of the benefits. Again, in the second tranche, the major focus was on the poor, migrants and farmers. The major steps included free foodgrains for migrants, extension of Pradhan Mantri Awas Yojana (PMAY) scheme, and MGNREGA wages raised to national average of ₹202/day per day against ₹182 per day, and so on. Under the third tranche, measures were taken to strengthen infrastructure, logistics and capacity building for agriculture, fisheries and food processing sectors. In the fourth and fifth tranche, measures for reforms in the sectors including coal, minerals, defence production, air space management, airports, MRO, distribution companies in UTs, space sector and atomic energy were taken. The sector-wise allocation of the package is shown in the Table 13.
Sector-wise Allocation of Aatmanirbhar Bharat Package.
Subsequent to ANB 1.0, two more Aatmanirbhar packages were announced by the government. PMGKY, three ANB packages and RBI measures were considered five mini budgets in themselves which amounted to ₹27.1 lakh crore (more than 13% of GDP). 2
According to the findings of IMF, India’s fiscal measures to support its population can be partitioned into two categories. First, above-the-line estimates which incorporated government spending (about 3.2% of GDP, of which about 2.2% of GDP is expected to fall in the current financial year), foregone or deferred revenues (about 0.3% of GDP falling in the current year) and facilitated spending (about 0.3% of GDP falling due inside the current year). Second, below-the-line measures in form of equity, advances and guarantees were intended to help organisations and shore up credit arrangement to several sectors (about 5.2% of GDP).
Under monetary and macro-financial measures, the RBI reduced the repo and reverse repo rates by 115 and 155 basis points (bps) to 4.0% and 3.35%, respectively. RBI had also announced liquidity measures across three estimates involving Long Term Repo Operations (LTROs), a Cash Reserve Ratio (CRR) cut of 100 bps,, and an increase in the Marginal Standing Facility (MSF) to 3% of the Statutory Liquidity Ratio (SLR) (further extended to 30 September 2021) and open market operations (simultaneous sale and purchase of government securities), resulting in cumulative liquidity injections of 5.9% of GDP through September. 3
Impact of Covid-19 on Indian Economy
The pandemic caused both demand and supply-side disruptions, impacting the Indian economy adversely. The changed consumption pattern of people due to the loss of income and ambiguity about future affected the demand side whereas the nationwide lockdown and shutting down of economic activity interrupted the supply chain. The severity of these disruptions can be comprehended through various economic indicators.
As per the second advance estimates of national income released by NSO, real GDP is estimated to contract by 8% in 2020–2021, as compared to a growth of 4% in 2019–2020 (Table 1). This contraction in GDP was mainly due to the contraction in industry and services sector. Among the industries, mining contracted by 9.2%, manufacturing by 8.4% and construction by 10.3%. In services sector, trade, hotels, transport and communication contracted by 18%. Only two sectors, agriculture and electricity, registered a positive growth rate of 3% and 1.8%, respectively.
From the demand side, both private consumption expenditure and fixed investment were estimated to contract by 8.9% and 12.4%, respectively in 2020–2021; whereas, government consumption final expenditure was estimated to grow at 2.9% in 2020–2021 (Table 2).
During the pandemic, the external sector of India emerged to be the key cushion for resilience. The merchandise exports and imports during 2020–2021 (April–January) were US$228.25 billion and US$300.26 billion which declined by 13.3% and 25.9%, respectively, over the corresponding period of the previous year (Table 3). The steep contraction in merchandise imports and stable net services receipts led to a very narrow current account deficit of US$1.87 billion.
As per the latest estimates available for the price situation, the CPI-C averaged 6.6% in 2020–2021 (April–December) up from 4.1% during the corresponding period in 2019–2020. Of this, the Consumer Food Price Index averaged to 9.1%. Inflation measured in terms of WPI averaged (–)0.1% in 2020–2021 (April–December) as compared to 1.5% in 2019–2020 for the corresponding period.
As per the Economic Survey 2020–2021, the contact-sensitive sectors, such as trade, transport, tourism, hospitality industry and so on, had an employment shock relative to the respective employment share, with informal workers liable to bear the bigger brunt. The construction and mining sectors, which employed a huge portion of informal sectors, had been seriously affected by the pandemic-induced lockdowns (GoI, 2021).
During the stringent lockdown of 2020, an estimated 14 crore (140 million) people lost employment while salaries were cut for many others. More than 45% of households across the country had reported an income drop as compared to 2019 (ET Bureau, 2020; Business Standard, 2020). People who were not working, meant that they were not getting paid which put additional dampener on their demand, which meant less productions and more people were forced to leave the job market.
The fiscal deficit and revenue deficit for 2020–2021 were budgeted at 3.5% of GDP and 2.7% of GDP, respectively. However, the Covid-19 pandemic drastically reduced the income of the government and exerted pressure to increase its expenditure. As a result, against an original BE revenue and expenditure of ₹22.45 lakh crore and ₹30.42 lakh crore, respectively for 2020–2021, RE estimates are ₹16.01 lakh crore and ₹34.50 lakh crore, respectively. The revised estimates of borrowing for the year 2020–2021 showed a growth of over 132% over the budget estimates. This resulted in the higher revised estimates of fiscal deficit and revenue deficit at 9.5% and 7.5%, respectively (Table 7).
Impact on States
The states with higher population and population density saw higher spread of cases and very few cases of deaths. According to the data maintained by covid19india.org, Maharashtra noticeably had the highest number of cases and deaths. The Economic Survey 2021-22 compared Maharashtra with Uttar Pradesh and Bihar. These three states had the highest population with Bihar and Maharashtra having nearly indistinguishable population. Nonetheless, Maharashtra had a lower population density than both Bihar and Uttar Pradesh. However, it was noticed that Uttar Pradesh and Bihar had lower number of cases while Maharashtra had a much higher number of cases than what was anticipated. In fact, the densely populated states like Uttar Pradesh (with a population density of 690 people/square km) and Bihar (with a population density of 881 people/square km)—as against the national average of population density of 382 people/square km—had been considered to have dealt with the pandemic relatively well. As far as overall deaths are concerned, it is seen that Kerala, Telangana and Andhra Pradesh managed it effectively.
The Covid-19 pandemic had varying impact depending on factors such as spread of the virus, demography of the state and the composition of the economy of each state. According to India Ratings & Research (Sinha, 2020), the states which had a higher share of agriculture suffered less compared to those where the share was low as overall agricultural activities were less impacted. Similarly, utility services such as electricity, gas, water supply and so on are essential services used by households, but states with large share in manufacturing units saw major decline in consumption of these services. Maharashtra is one of the highest contributors of output in the country. Since it is the focal point of the pandemic situation in the nation, therefore, the state had been struggling with the shock in contact-sensitive services sector (with 56% of its yield coming from that area). The labour market was also stressed given its higher share in MSMEs, and reverse migration had further accelerated the impact. While Tamil Nadu and Kerala had been struggling with the construction sector, Gujarat, Jammu and Kashmir were facing a slowdown in manufacturing sector. Although Punjab and Haryana were protected by the relatively resilient agricultural sector, they had to encounter casual labour shocks in the services sector. Additionally, Delhi and Telangana had also experienced services led informal sector shocks. However, the comfortable fiscal situation of Delhi, one of the key Covid-19 hotspots raised high expectation from the Government of NCT of Delhi to take liberal measures combating the crises.
Fiscal Consolidation and the Road Ahead
Exceptional time needs extraordinary measures. The government cannot keep the same fiscal rules and would have to rethink about the magnitude of debts and deficits due to ambiguity created by coronavirus pandemic. As per the mandate of FRBM Act, the Centre needed to achieve a fiscal deficit of 3% of GDP by 31 March 2021. However, the pandemic had affected the fiscal deficit of India both by increasing the government expenditure to provide essential relief to vulnerable sections of the society and by decreasing the total receipts due to fall in capital receipts, tax and non-tax receipts.
The Economic Survey of 2020–2021 called for a more active, counter-cyclical fiscal policy to enable growth during economic downturns. The GoI was expected to set up internal working group to redraw the country’s fiscal consolidation road map following the sharp slippage caused by coronavirus pandemic (Sikarwar, 2021).
In view of the pandemic, both Union government and the Finance Commission gave their estimates for economic indicators for the forthcoming years. As per the projected estimates given by Union government to Fifteenth Finance Commission (2021), the real GDP growth will be on path of improvement. After an estimated 7.7% pandemic-driven contraction in 2020–2021, the real and nominal GDP were projected to grow at 11.0% and 15.4%, respectively, in 2021–2022. This sharp recovery of 10–12% of real GDP growth was based on a low base effect and inherent strengths of the economy. Further, the real GDP was expected to gradually reach 8% in 2025–2026, with an inflation assumption of around 4%.
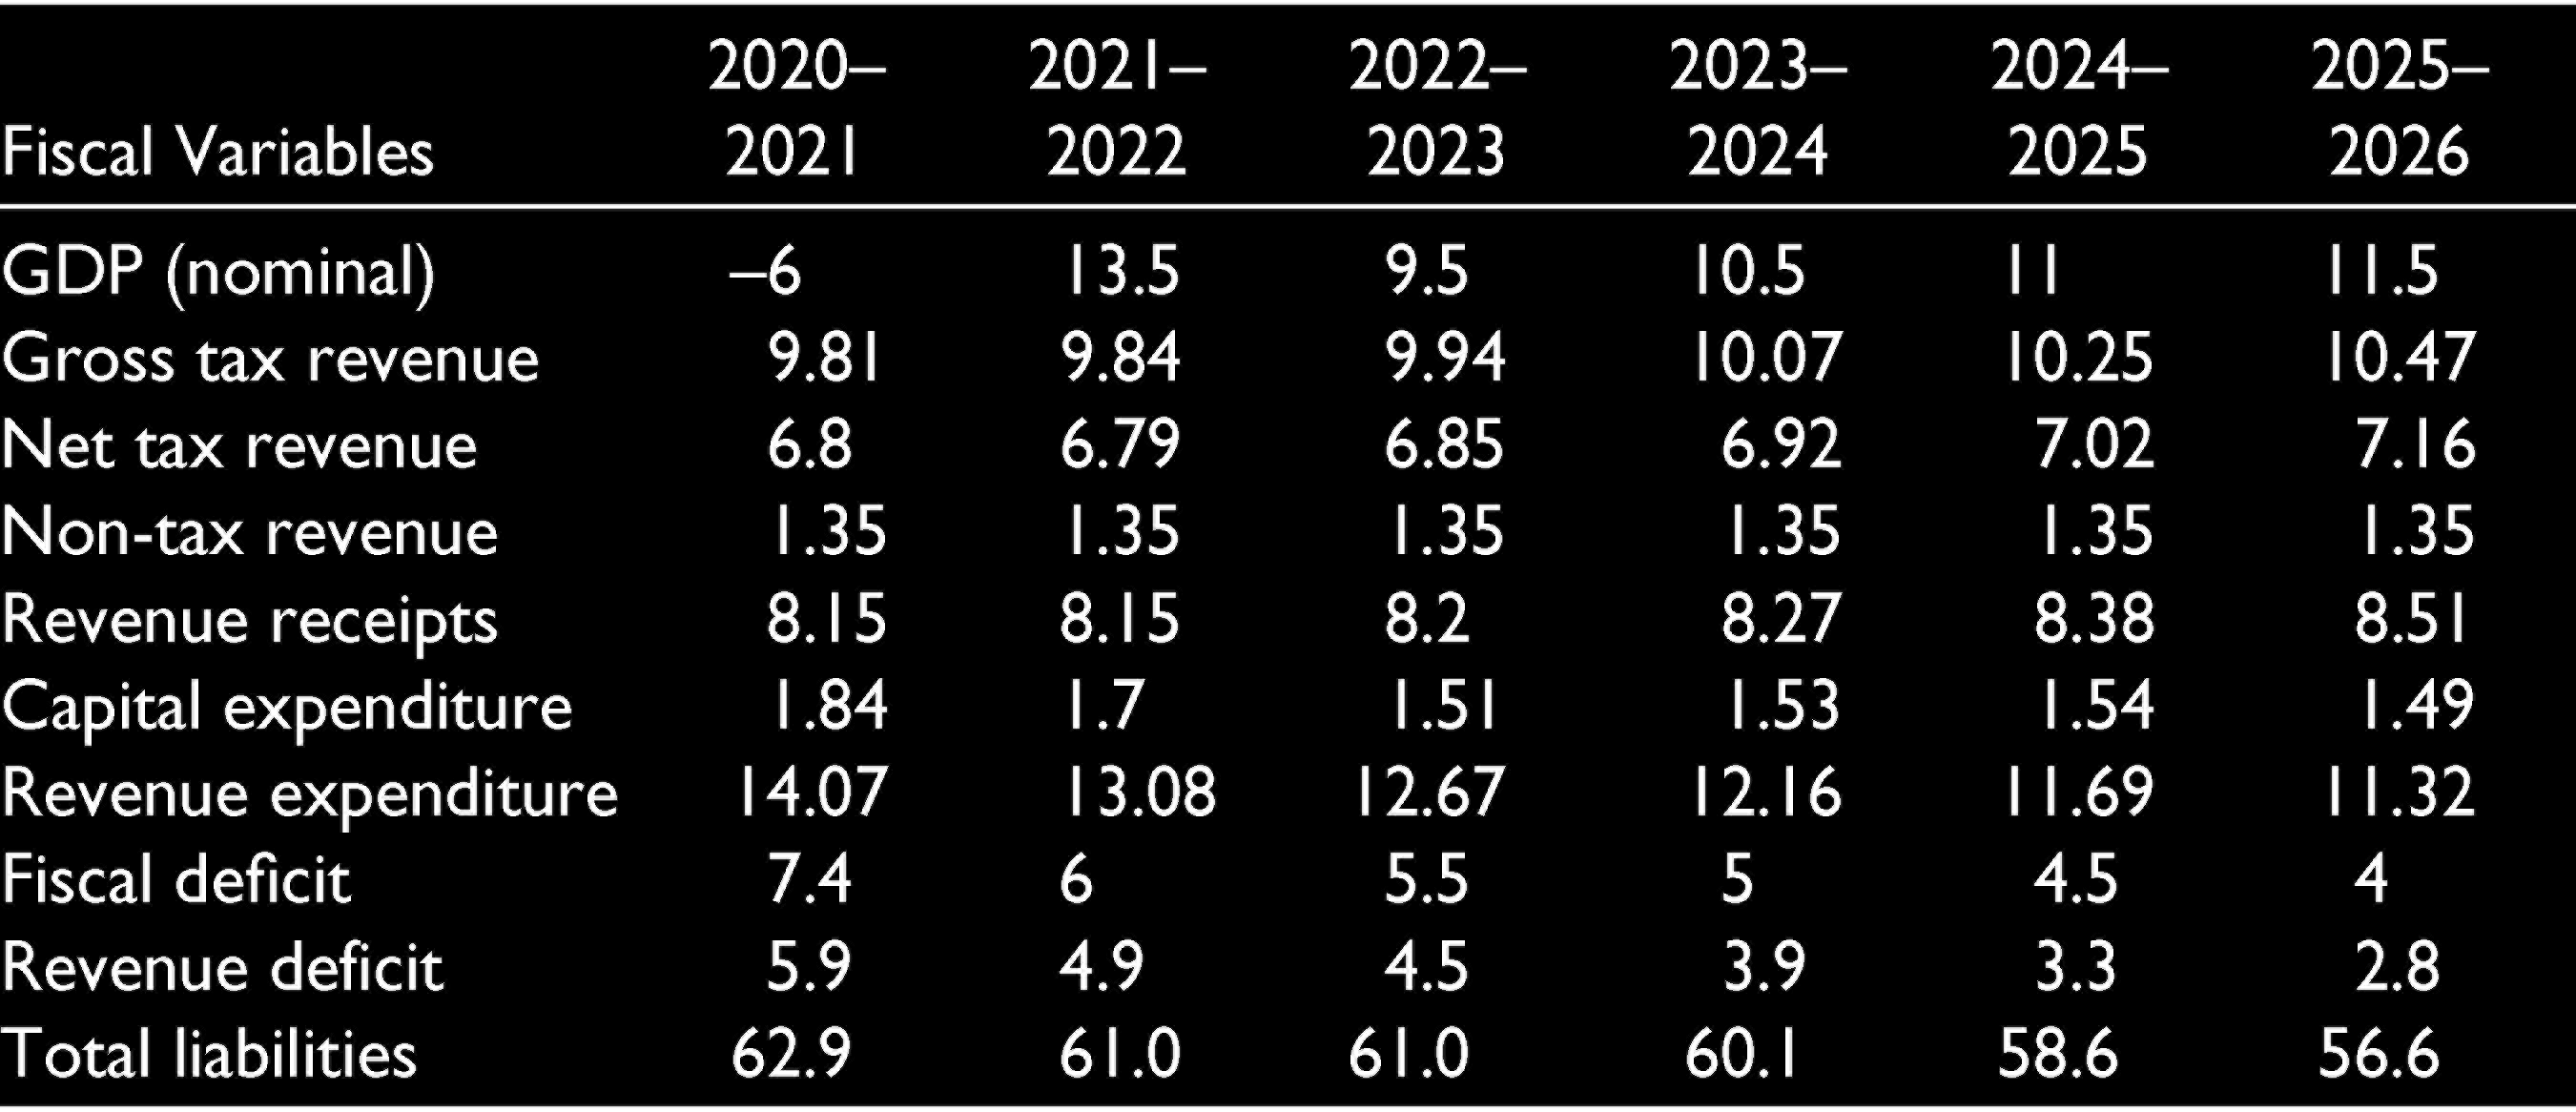
On the other hand, according to Finance Commission’s assessment, the recovery in 2021–2022 might not fully be to the level of real activity of 2019–2020. After a contraction of 6% in nominal GDP in 2020–2021, it projected nominal GDP to grow by 13.5% in 2021–2022. High growth in nominal GDP in 2021–2022 because of the low base in 2020–2021, followed by a growth of 9.5% in 2022–2023 and sustained expansion at 10.5%, 11.0% and 11.5% for the years 2023–2024, 2024–2025 and 2025–2026, respectively (Table 14). Although, RBI and IMF had cut the economic growth forecast to 9.5% for the fiscal year to 31 March 2022.
To achieve such levels, the government needs to streamline its income generation programmes and also control the government expenditure without much affecting fiscal support required for revival of economic activity. However, given the current situation, it was difficult to keep expenditure low, as the government was involved in many welfare activities to keep up with the political system of the country and the need for public expenditure for economic recovery. Nevertheless, the Union Government had projected that the revenue expenditure would decline from 13.7% of the GDP in 2021–2022 to 12.4% in 2025–2026, while capital expenditure would increase from 2.1% of GDP to 2.3%. In this respect, the Union’s commitments, including interest payments, pensions and salaries, subsidies, defence and others, were projected to decline from 9.4% of GDP in 2021–2022 to 8.6% in 2025–2026. In contrast, it assessed that the spending on national development priorities, including education, health, housing, employment, water supply and sanitation, social security and welfare, agriculture, rural development, power and digital technology would need to modestly increase from 2.5% of GDP to 2.7% during the period.
In order to reprioritise expenditure, the Fifteenth Finance Commission (2020) has estimated a decline in revenue and capital expenditure to 11.32% and 1.49% of GDP by 2025–2026 from 13.08% and 1.70% of GDP in 2021–2022, respectively.
On revenue side, the Union government projected gross tax revenue to grow at 13.4% per annum, with a rising buoyancy of 1.2, taking the tax to GDP ratio from 10.3% in 2021–2022 to 11.1% in 2025–2026. The Finance Commission, on the other hand, assessed the buoyancy of gross tax revenue to be 1.13 and the tax-GDP ratio to increase to 10.5% by 2025–2026 from 9.84% in 2021–2022.
In view of such assessments of revenue and expenditure, the government is aiming to bring down the fiscal deficit to 4.5% of GDP by 2025–2026 from 6.8% in 2021–2022. The government hopes to achieve the fiscal consolidation by first, increasing the buoyancy of tax revenue through improved compliance, and secondly by increased receipts from monetisation of assets, including public sector enterprises and land. The Fifteenth Finance Commission also has recommended a path for fiscal consolidation for the Union government by reducing fiscal deficit to 4% of GDP by 2025–2026 (Table 14).
Suggested Path for Fiscal Consolidation (% of GDP).
To conclude, India was already facing a tough situation in the pre-pandemic year due to slow growth and was walking on a tight rope as far as fiscal situation was concerned. The pandemic only made the matter worse. To take the road suggested by the Union government and the Fifteenth Finance Commission, growth is the key for fiscal expansion. It is important that the appropriate steps are taken to get a strong growth keeping checks on how debts and investments are used efficiently. It is also important to ensure compliance with administrative and tax policy changes.
Footnotes
Declaration of Conflicting Interests
The authors declared no potential conflicts of interest with respect to the research, authorship and/or publication of this article.
Funding
The authors received no financial support for the research, authorship and/or publication of this article.