
Abstract
This study is an ex-post analysis of household health expenditure for rural India in the presence of climate shock. Primary data from Odisha state, located on the east coast of India, are collected for empirical analysis. We have also used information from focus group discussions at the village level and the primary data. Further, an adaptive response measure is created to understand household spending behaviour on health better. Econometric techniques such as regression and propensity score matching explain sample households’ ex-post-health spending behaviour. Our findings indicate that mitigation and adaptation strategies must be heterogeneous among villages classified as near or far from the coast. Social status matters in the health spending behaviour of households. Hence, a particular focus must be given to socially backward castes or classes in designing health policies and information at the state and national levels.
Introduction
Human health and its variations are essential research interests for emerging economies like India. The influential factors in health outcomes include individual lifestyle, genetics, psychosocial, material, health in infancy and childhood, and access to medical care. These factors can be either studied in isolation or conditional on each other. Empirical studies confirm that health behaviour strongly correlates with higher social class (Blaxter, 2003). Blaxter addresses a topic of great interest among policy researchers such as Contoyannis and Forster (1999), which brings a general framework to analyse variation in the distributions of population health. Watts et al. (2015) document climate change as an unacceptably high and potentially catastrophic risk to human health. Climate change will be also likely to be associated with mortality. For instance, the WHO (2014) estimates an additional 250,000 deaths related to climate change annually by 2030. The health impact will be more significant for the emerging and developing economies, given less preparedness and health infrastructure in these economies. These adverse health impacts due to climate change will negatively affect the ecosystem and economic activities. Therefore, it is essential to research the effects of climate change on income and health inequalities in rural households in emerging economies. Bosello et al. (2006) concluded that healthcare expenditure would increase for regions with negative health impacts. Numerous studies estimating global costs of climate change adaptation, including the health sector, are presented in Hutton (2011). Besides climate change’s health impact, it is also prone to affect economic performance as labour productivity will decline due to bad health (Watts et al., 2015), damage to capital stock or loss in output (Stern, 2013). There have been numerous attempts to explain public health during and after disasters (Arcanjo, 2019; Bush et al., 2011; Dhara et al., 2013; Knowlton et al., 2014; Majra & Gur, 2009; Mishra, 2017).
The health of households also differs due to climatic conditions or changes in the climate. Islam and Winkel (2017) explain climate change and social inequalities to understand the relationship between climate change and within-country inequalities. Adverse climate change impact on population, health, and poverty is undeniable and poses a significant challenge to poverty reduction, health, and development in many countries. Empirical and theoretical literature has confirmed that climate-induced disasters directly impact the people below the poverty lines, and the poverty-climate nexus exists (Tol et al., 2004). The adverse impacts of climate change are most striking in developing nations because of their geographical and climatic conditions, high dependence on natural resources, and limited capacity to adapt to the changing climate. As per the 2014 report of Intergovernmental Panel on Climate Change (IPCC), people with low incomes with the least resources and the ability to adapt are the most vulnerable in countries. Coastal areas in low-income countries are susceptible to infrastructure and public health facilities.
Within India, Odisha, an eastern state of India, is a prime example of vulnerability to an erratic climate. Odisha state has historically been highly prone to climate change and multiple hazards like cyclones, droughts, and floods (Bhatta, 1997). Odisha is the land of numerous disasters and is an underdeveloped state in India. This state has been teetering from extreme climate events, from heat waves to cyclones and drought to floods. The state of Odisha sustained the most catastrophic damage associated with the supercyclone of 1999. Twelve districts of Odisha, including Balasore, Bhadrak, Cuttack, Dhenkanal, Jagatsinghpur, Jajpur, Keonjhar, Kendrapara, Khurda, Puri, Mayurbhanj and Nayagarh, suffered severe damage. Along the Odisha coast, the cyclone generated 16–20 feet of storm surge that brought water up to twenty miles inland, inundating a large swath of coastal areas (India Meteorological Department, 2000). Nearly 1.4 million people from the district of Kendrapada were directly affected, including 469 deaths, due to this powerful cyclone, which also damaged around 279,091 houses in the district.
This study focuses on the determinants of health expenditure for the households of rural Odisha, located on the east coast of India. We aim to identify the vulnerability of households due to climate change, inequality among the households, and intra-household differences in health expenditure. This research is in line with Blaxter’s (2003) framework for assessing variation in health expenditure of households. The following section presents a brief background and the empirical setting for this study, followed by information on the study area and descriptive statistics. The empirical results are presented next. The last section summarises the main conclusions and offers policy recommendations.
Background and Empirical Setting
Neoclassical production function approaches can calculate the effect of differential individual health production functions on the expected population at each income level. This distribution and the shape will have potential implications for health policies. To illustrate the framework for health production function, we can assume that health response to a change in an individual’s income is conditional upon the healthiness of individual behaviour. In turn, the healthiness of an individual is related to the willingness and the ability to work and be employed and is associated with higher income and higher spending on food expenses and health-related expenses. This condition is not homogenous for the entire population; hence, sub-groups differ based on socio-economic, cultural, geographic and other classifications. These sub-groups may be defined by observable characteristics, such as education (Kenkel, 1991) or unobservable characteristics, such as an association between health and education (Fuchs, 1982). All required for the framework to be applicable is that individual production functions are non-separable in their inputs.
Household income and health-related expenses are interrelated. Higher income leads to higher spending on health. A climate-related disaster is an exogenous shock to the health behaviour of household members and, hence, brings higher health expenditure for any affected population. Thus, a link exists between income, health expenditure and climate shocks. We assume immediate health expenditure is not a direct health shock for a household. One of the reasons for this assumption is that the authorities of the Indian state take primary health-related expenditure during the disaster. This makes the prime reason for our study to exclude the impact of such support during and after disasters.
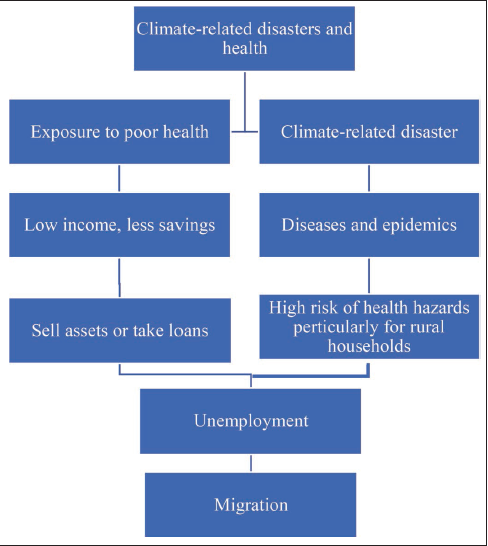
Climate-related disasters and health impacts can be presented as consequences of each other. Further, health impacts can be classified in two ways. One is general health-related problems, and the other is health issues related to climate change disasters. Exposure to poor health correlates with low income and lower potential for household savings. Most of India’s rural households fall into this category as households’ income is spent on food-related expenditures, and health expenditure remains marginal. The availability of quality food for good health is also one of the significant concerns for rural households, related to a productive and healthy labour force. Rural households depend on loans or selling assets for higher health expenses if household income or savings are inappropriate. Changes in the ecosystem due to climate change also make entire households or one or more of the individuals of the family migrate for better employment. This migration behaviour is related to hazardous and risky health conditions for migrating labour (Burrows & Kinney, 2016; Patrica, 2017). The immediate impact of any climate-related event (a flood or a cyclone) is damage to household assets, including the house, human life, and livestock and the diseases and epidemics in the impacted villages. This, in turn, leads to a considerable risk of health hazards and, hence, loss of income and employment. Loss of income and job lead to dependency on loans at the household level. We present the outcome of a focus group meeting in Figure 1.
As in Contoyannis and Forster (1999), we assume that, for a given population of i = 1,…, n households, a household’s health
Therefore, for any income distribution, the functional form can be written as:

Hence, for continuous income distribution, the mean for a population will be:

where,
The Lorenz curve can be used to describe the distributions of relative health and income along with climate change factors in terms of loss and damage. The Lorenz curve for a continuous distribution is defined as

where
The Lorenz curve gives, for any proportion of the population q, the proportion of total income held by that proportion, those with income less than or equal to y. The effect of climate-related disasters on the health and income status of the household will be estimated using linear regression with income, health expenses of the households and other household characteristics as variables. There are two sets of econometric specifications. The first econometric specification (model 1, without the climate shock) can be represented as

The second econometric specification (model 2; capturing equation 4 and climate shocks) can be presented as

Once we estimate the determinants of health expenditure at the household level using Equations (4) and (5), we create household adaptation levels and explain the sample households’ health spending behaviour. The following equation is used to estimate the adaptation level of households:

Adaptive responses are a counterfactual outcome of the Average Treatment Effect (ATE). Different methods are suggested to estimate ATE, including matching methods based on propensity scores and parametric methods based on instrumental variable methods. We use propensity score matching as the preferred technique in arriving at the estimate for our sample. The propensity score, the conditional probability of receiving treatment, is denoted as
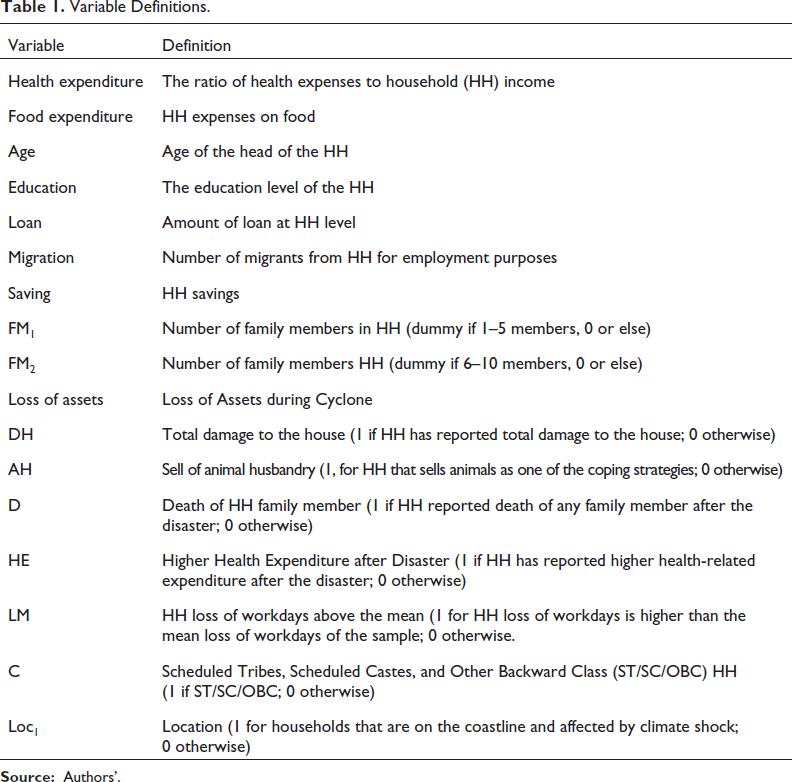
A poverty line is the threshold level of welfare that distinguishes low-income and non-low-income households. The Government of India (2014) report of the export group to review the methodology for measuring poverty chaired by the Rangarajan committee estimated the poverty line to monthly per capita consumption expenditure of ₹972.00 or consumption expenditure of ₹4,860.00 for a household with five members in rural India. Using information from this report, we classify the poverty line of sample households and identify households Below the Poverty Line (BPL). The Indian Constitution refers to ‘Other Backward Castes’ and ‘Scheduled Castes and Scheduled Tribes’ as historically and currently disadvantaged groups. Since the 1950s, an affirmative action policy has been designed to reserve seats in higher education, employment, and politics.1 We use this information to see if this group is more vulnerable to health impacts than the households categorised as unreserved. Table 1 presents the definitions of variables used in the empirical analysis.
Variable Definitions.
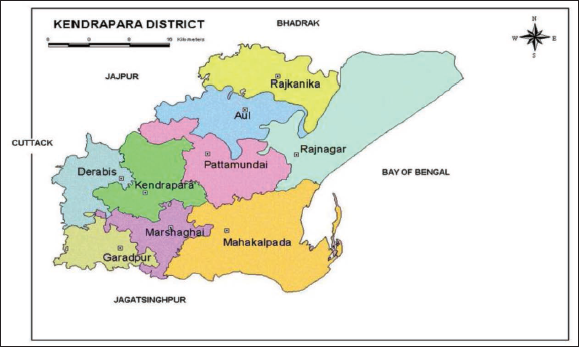
Odisha’s coastal zone extends 480 km from the district Balasore in the north to Ganjam in the south. This coastal area constitutes 16% of the state’s geographical location, with 33% of the population (Census, 2011). This region experienced 128 cyclonic storms from 1804 to 2000 and remained one of the most vulnerable regions to climate-induced natural disasters in the Indian sub-continent. It is estimated that the Odisha coast witnessed 37% of the total cyclonic storm landfalls in the eastern coastline of India over the past 109 years, making this area necessary to study. We use primary data collected at the household level from the Kendrapada district of Odisha. For this study, two blocks are selected, (a) Mahakalapada and (b) Rajanagar, collated during 2011–2012.
We present the district map in Figure 2. Studies conducted by the Ministry of Environment, Forest and Climate Change, Government of India, show that this district has been classified as one of the most vulnerable districts of Odisha due to climate change. The primary data was collected after the super cyclone in 1999 and coincidentally just months before the significant cyclone hit the Odisha coast in October 2013.2 The approach to primary data collection was initiated by focus group discussions with various stakeholders such as villagers, representatives of NGOs, local government workers and institutions involved in disaster risk reduction in the study area. Interviews with the heads of households followed focus group discussions. Since a census of all the households from the study area was not feasible, a sample of households was surveyed. Twenty-five households from each village (six villages in two blocks) represent this study’s sample. Each household was selected using a random sampling method. The following strategies were used for the selection of households in each village. Each village was divided into:
Three zones represent each social class.
Two zones to classify the distance from a household from the actual coastline.
In each zone, every 10th household was selected.
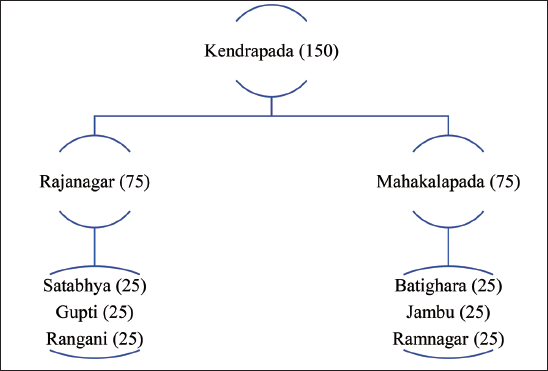
Our sample comprises 150 households from the Kendrapada block, representing 75 households each from Rajanagar and Mahakalpada blocks. The list of villages from each block is presented in Figure 3. For the Mahakalpada block, the minimum household size is three members, and the maximum is 26 members. This sample comprises 170 males, 167 females, 118 male and 131 female children. The average age of the head of the household is around 50 years old. The literacy rate is 68%, and 64% of the sample are classified as BPL households. Some 47% of households are microfinance group members, such as Self-Help Groups (SHG), and 54% of the sample are migrants for income-generating activities. Most importantly, 32 households lost at least one member due to floods/cyclones during the last ten years.
Selection of Households for the Primary Survey.
The minimum household size for the Rajanagar block is two members, and the maximum is 20 members. Our Sample consists of 170 males, 167 females, 118 male children and 131 female children. The average age of the head of the household is around 50 years old. The literacy rate is 76%, and 63% of the sample are in the BPL category. Some 48% of households are microfinance group members, such as SHG, and 62% of the sample members are migrants for income-generating activities.
Most importantly, 36 households lost at least one member due to flood/cyclone in the last ten years. Our survey found that respondents from the Rajanagar block have a higher literacy rate than those from the Mahakalpada block. From the standpoint of employment, agricultural labour is one of the significant primary income sources for the sample, irrespective of blocks. Only 14% of all respondents owned the land they farmed, and only 2% of the samples were engaged in a business of any kind as the primary source of income. Therefore, this area is highly dependent on agriculture as one of the primary sources of income. Within agriculture, most respondents are engaged in agricultural labour, as land ownership is highly skewed.
The 1999 supercyclone completely damaged around 23% of houses in the study area. This constitutes 18% of fully damaged houses in the Mahakalpada block and 28% in the Rajanagar block. However, most of the houses in these areas are partially damaged. The distribution of household income, expenditure on food health, and the ratio of health expenditure to consumption expenditure are presented graphically in Figure 4. The minimum household annual income of the sample is ₹15,000, and the maximum is ₹67,000. This reveals income inequality even among these low-income households surveyed in the eastern districts of Odisha. As the income is skewed, so are the consumption expenditures, particularly health. Higher health expenditure is recorded only for households with higher annual income. Most of the other households depend on government support for health-related facilities. Therefore, any natural disaster makes these households more vulnerable during and after the event. We use the Lorenz curve to explain this phenomenon using equation 6. Figure 5 confirms that income inequality is more significant than health inequality for the sample households of Odisha.
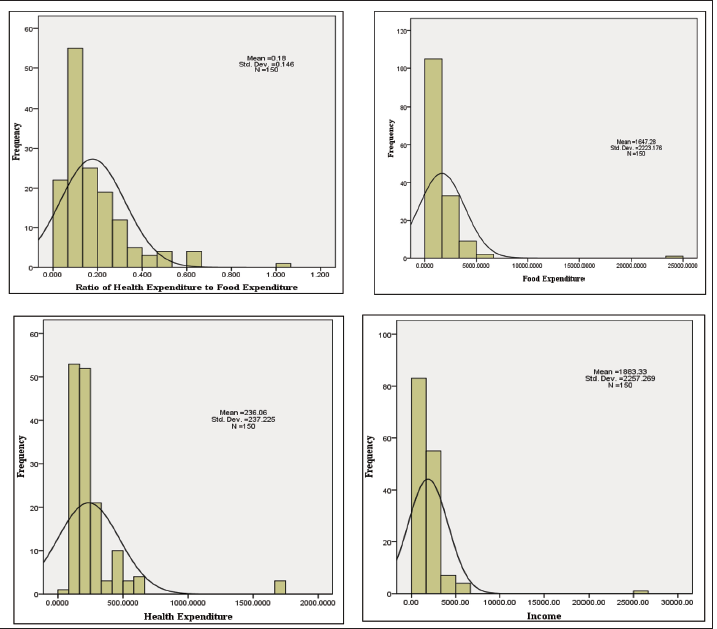
Household-level information is further used to understand the effect of climate change on health expenditure in the sample. The average food expenditure for the sample is ₹1,647/month, which is less than $1/day (at an average rate of $1= ₹70) with a high standard deviation of 2223.18. In contrast, the average health expenditure is ₹236/month with a standard deviation of 237.30. The need for sustainable healthcare policy is the need of the hour based on the data on households per month health expenditure (minimum of ₹24 and a maximum of ₹1,667). However, current health policies such as ‘Ayushman Bharat’ are helpful to be evaluated at the household level.
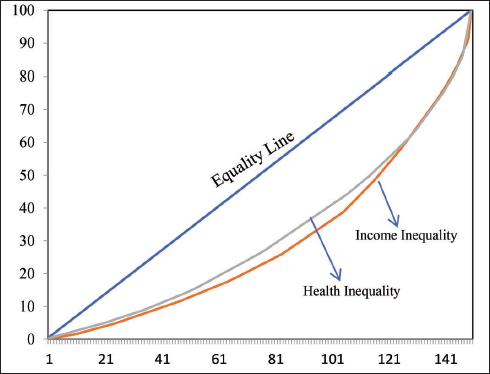
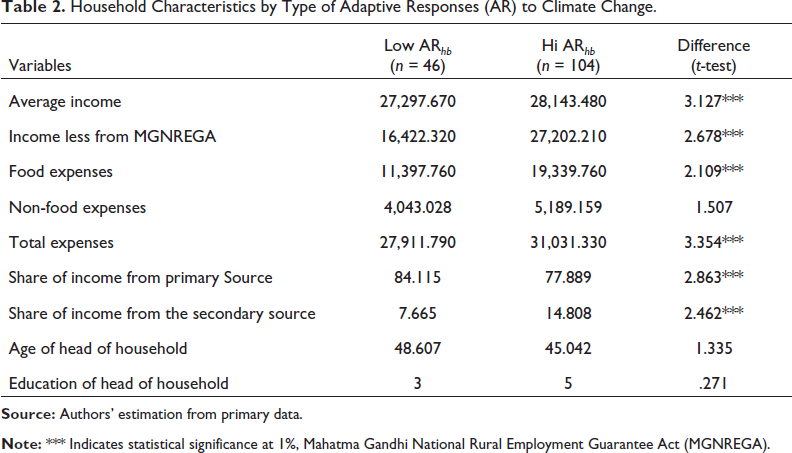
Table 2 compares some of the critical indicators at the household level, distinguishing between high and low adaptive responses of households. One of the essential sources of income in rural India is the Mahatma Gandhi National Rural Employment Guarantee Act (MGNREGA), launched in 20053, guarantees at least 100 days of paid employment a year. The survey data show that average income, income less from MGNREGA, expenses related to food and total expenses, and the share of income from primary and secondary sources are statistically significant and different between the high and low adaptive groups. However, expenses related to non-food, age, and education of the head of households are insignificant.
Table 2 displays significant differences between households with high and low adaptive responses. Calculating the poverty measure using household consumption data, it becomes clear that 78.9% of households can be classified as BPL. In this case, it is essential to mention that the high adaptive response households are better off than the low adaptive response households, which are more likely to fall into poverty. The incidence of poverty is higher among low-adaptive households (78%) than in high-adaptive households (65%). Based on this background information on the sample, the empirical results of a model of determinants of health expenditure are presented in the next section.
Household Characteristics by Type of Adaptive Responses (AR) to Climate Change.
We divide the empirical results into two sections. The first section of the empirical analysis uses the ordinary least square estimation technique with robust standard errors. The estimated models represent results with and without climate shocks at the household level. First, we discuss determinants of household health expenditure, with and without loss and damage due to the cyclone. Next, the differences in health spending as a ratio to income are discussed using propensity score matching for the high and low adaptive households due to climate change.
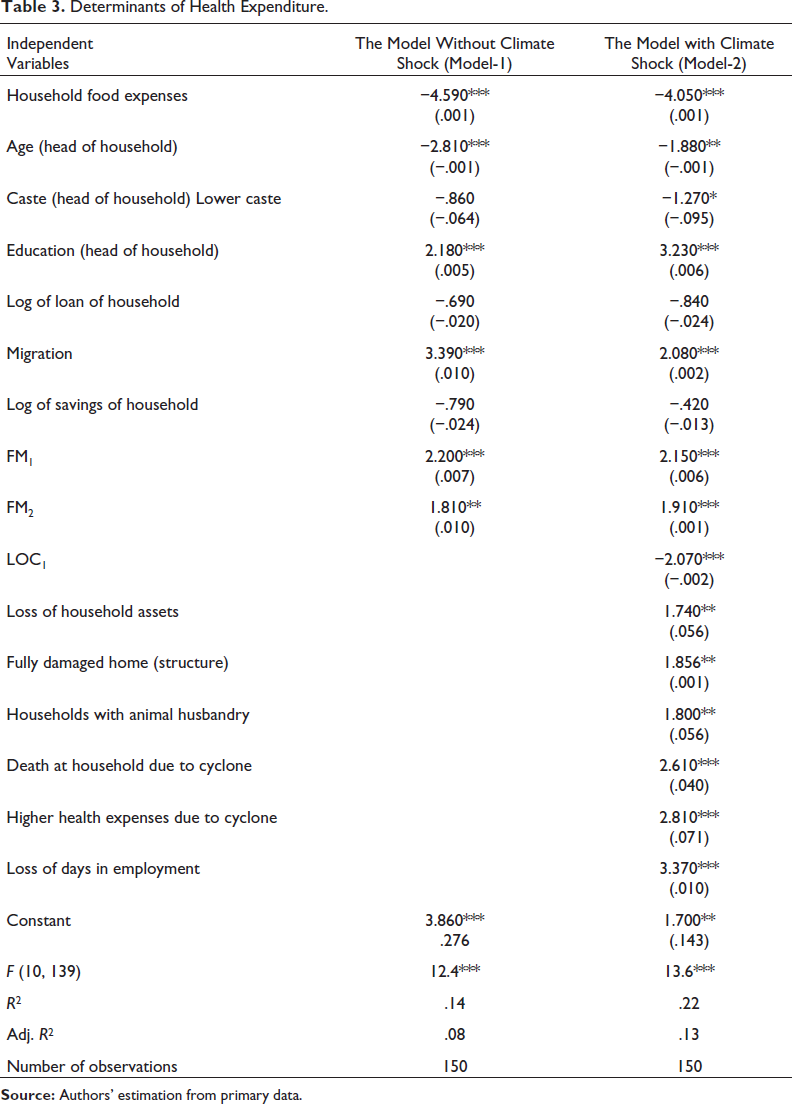
Model 1 in Table 3 shows that food expenses and the age of the head of the household are inversely related to the health expenditure of the household. This implies that households that spend more on food have less to pay for health-related activities such as additional medicine, hospital visit costs, and illness costs during and post-cyclone. As the income of these households is heterogeneous across households, the relationship will also be heterogeneous across households depending on their income and spending habits on the food basket. Younger heads of households tend to spend more on health than older heads. Educated heads and households with at least one migrant member spend more on health. This means higher health expenditures are associated with the education of the head of the household and the migration status of the household. Hence, higher-educated heads of households can better decide on higher health-related expenses at the household level. As empirical evidence suggests, migration enhances a household’s income; the additional income can be spent on health-related expenditures. The model also considers the distribution of family size and their relationship with health expenditure. Our empirical evidence suggests that large households spend more on health than small households.
The model output with climate shock is presented in model 2 in Table 3. Model 2 includes climate shock variables at the household level with other household characteristics as in model-1such as asset loss, house damage, selling of animal husbandry (post-cyclone), death reported during the disaster, higher health expenses after cyclone and loss of workdays due to climate-related disasters. Comparing the results of model 2 with model 1, we can observe that the estimated relationship of variables used in model 1 has a similar direction in model 2; however, the level of statistically significant changes in a few cases. For example, the social identity (caste of the head of the household) is statistically significant, indicating that backward class households or those belonging to the ST, SC and OBC categories spend less during post-cyclone on health. In the case of the climate shock variables, loss of assets is positively correlated to health expenditure, indicating that houses that have reported a loss of assets also have higher health-related spending. A similar result is found for the higher damage to the house structures due to the disaster. Death due to disasters is statistically significant and positive to the ratio of health expenses to income. Loss of workdays is positively related to the household’s health expenditure, indicating that the loss of workdays is due to unavailability of employment and the bad health of working individuals, the more vulnerable to health hazards and hence predictive of higher health expenditure.
Determinants of Health Expenditure.
Determinants of Health Expenditure.
Although the unconditional summary statistics presented above suggest that climate shocks impact the health expenses of rural households, these results are based only on observed mean differences in outcomes of interest. They may not be due to climate shocks alone. They may also be due to other factors, such as differences in household characteristics. To measure the impact of climate shocks and household characteristics, we have created the adaptive response of households and classified households into high and low adaptive responses due to climate shocks and household characteristics. Having two groups of households within the sample, we can apply the propensity score matching method that controls for these observable characteristics to isolate the intrinsic impact of adaptive responses on household health expenses as a ratio to income.
Impact of Climate Change Adaptive Response on Health Expenditure.
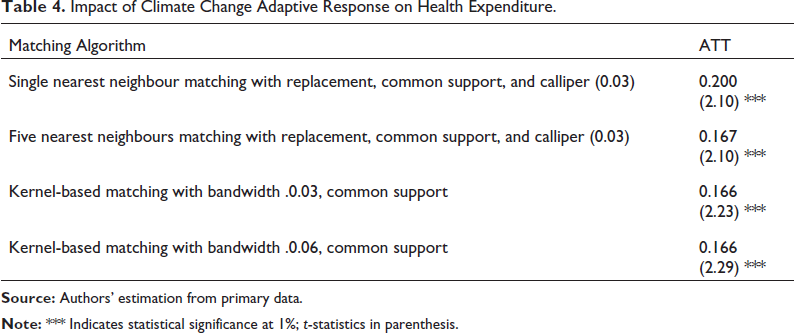
Table 4 reports the average adoption effects estimated using nearest-neighbour matching and kernel-based matching methods. All the analyses were based on implementing common support and calliper so that the distributions of low and high adaptive response households are in the same domain. As Rosenbaum and Rubin (1985) suggested, a calliper size of one-quarter of the standard deviation of the propensity scores was used. The results indicate that higher adaptive response households have a lesser share of health expenditure post-cyclone than lower adaptive response households. This result aligns with our assumption that the higher adaptive households do not spend a higher percentage of their income on healthcare post-disaster; however, the lesser adaptive households spend a higher share of income on healthcare post-disaster. This is because the higher adaptive households are well connected with the health workers and informed of the negative externalities of climate change disasters. Hence, the preparedness is increased than the lesser adoptive household. This finding is important because it indicates that information and social networks are essential for preparedness. Therefore, the Government can use the health workers and institutions related to disaster mitigation and health facilities to educate the households. The adaptiveness of households can also be used as a policy instrument for the Government in designing sustainable health policies.
This research identifies the determinants of health expenditure at the household level for the sample households in Odisha state, located on the eastern coast of India. This research focuses on the ex-post analysis of the information collected using a primary survey of households. In this research, we create an adaptive response of households as an additional tool to determine the health expenditure after the disaster. We use models with and without climate shocks for the robustness of the results in our empirical models. Our results indicate that higher income is associated with health-related expenditure at the household level. However, this behaviour is not uniform across households in the sample villages. We use the Lorenz curve representing income and household health expenditure to understand household inequalities. The result suggests that health expenditure is less heterogeneous compared to household income. Significant findings of the study suggest that smaller family size, income share from migration, and the household head’s caste are major contributing factors to explaining inter-household differences in health expenditure in a post-disaster scenario. Households near the coast also have higher spending on health after the cyclone.
This study also found that households with higher adaptive responses to climate change have better health management as their expenditure during post-cyclone is less than the less adaptive households. The adaptive index measure includes information on climate variation at the household level. These factors increase the knowledge about the impact of cyclones on health; hence, households are better prepared during/post-disaster such as a cyclone. The results of this study indicate the need for an integrated approach to explaining the poverty-inequality-health nexus in the context of climate change and related public policy. Mitigation and adaptation strategies must be heterogeneous among villages classified as near and far from the coast. Social status matters to the health spending behaviour of households. Hence, a particular focus must be given to people belonging to the socially backward castes in designing health policies at both state and national levels. The Government of India introduced free health insurance to the low-income population of around 500 million people, known as the Ayushman Bharat, which is one way to improve health among the BPL population. However, as this study demonstrates, to reach those in greatest need, the Ayushman Bharat policy should be further differentiated based on the climate disaster hot spots, such as the rural areas of the eastern coast of India. The household’s income matters for attaining better health, as measured by higher expenditure on healthcare. Therefore, rural employment programmes such as the MGNREGA and similar employment schemes should be linked with health policies to benefit the labour force in these rural areas. One of the limitations of this study is related to the generalisation of the empirical results. Yet, with so much of the Indian population living in coastal areas that are increasingly prone to extreme weather and flooding, this research can be used to design investigations into many other cases on the country’s east and west coasts.
Footnotes
Declaration of Conflicting Interests
The authors declared no potential conflicts of interest with respect to the research, authorship and/or publication of this article.
Funding
The authors received no financial support for the research, authorship and/or publication of this article.