
Abstract
Corporates have traditionally been modelled for their investment rather than saving behaviour. However, in recent times the firm-level saving has displayed an unprecedented behaviour across developed and developing economies. Corporate saving behaviour in India has also witnessed fluctuations, and this study captures a mix of aggregate and firm-level variables that may explain this behaviour. This article has three objectives (a) to understand the firm and macroeconomic factors that drive firm-level saving; (b) to examine whether the firm saving is affected by savings in preceding years; (c) to identify whether this saving behaviour of firms is for precautionary motives or not. The data set used in this article includes panel data of 2,109 publicly listed, manufacturing and service sector firms for the financial years 2004–2018. The data analysis has been done using dynamic panel-data models employing system GMM estimation with multiple robustness checks. The study findings show that firm-level saving in India is mainly driven by lagged corporate saving, Tobin’s Q, GDP growth rate, CPI inflation, and financial depth, among other factors. Additionally, empirical evidence supports the presence of dynamic persistence effect and precautionary motives for savings by firms.
Keywords
Introduction
In recent years, the composition of aggregate savings has observed a significant change across developed and developing economies. Traditionally, household saving has been the main contributor to aggregate private saving. Lately, private corporate saving has started contributing a significant part of the total domestic saving (Begenau & Palazzo, 2021; Brufmanet al., 2013; Chen et al., 2017; Falato et al., 2020). This trend of rising corporate savings contradicts the traditional macroeconomic thoughts, where companies are assumed to be the primary borrowers while households are assumed to be the primary savers.
On this phenomenon of rising corporate saving, Wessel (2005:02) says
Companies, which normally borrow other folks’ savings in order to invest, have turned thrifty. Even companies enjoying strong profits and cash flow are building cash hoards, reducing debt and buying back their own shares—instead of making investment bets.
Further, this corporate saving glut might have been caused due to inappropriate policies, favouring retention than investment (IMF, 2006; Prasad, 2011). There is, however, dearth of research in understanding the key drivers of such fluctuations especially in the context of developing economies, like India, where firms have been considered as the primary drivers of economic growth (Bosworth et al., 2007).
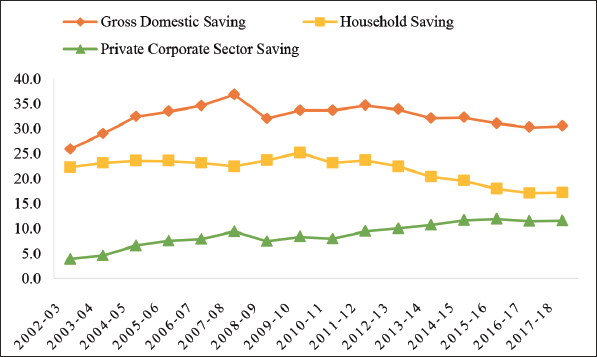
Since the early 2000s, the composition of India’s aggregate domestic saving rate has also undergone considerable changes with an increasing contribution of private corporate saving compared to household sector saving. Private corporate sector saving in India has been showing a rising trend (see Figure 1), reaching its highest value ever of 11.9% of GDP (in 2015–2016). This trend is however not in line with household saving which has decreased from nearly 25.2% of GDP (in 2009–2010) to 18% of GDP (in 2015–2016) and further to 17.2% of GDP (in 2017–2018). It would be interesting to understand the factors determining corporate savings in India and the motivations behind firm-level savings behaviour. Our literature review suggested that there could be two sets of factors that could influence the savings behaviour of firms. One set of factors could be external to the firm such as macroeconomic conditions and another set of factors are firm specific like financial constraints, profitability, and cost of funds. Understanding the factors determining corporate savings behaviour in India could have interesting implications for policymakers.
In this article, we try to explore the behaviour of firm-level savings in India using data of 2,109 firms over a period of 14 years (2004–2018). The article has three objectives (a) to understand the firm and macroeconomic factors that drive firm-level saving; (b) to examine whether the firm saving is affected by savings in preceding years; (c) to identify whether this saving behaviour of firms is for precautionary motives or not. In the following sections, we discuss the review of literature, followed by the empirical framework and data sources. The next section discusses the results with the robustness checks, followed by the conclusion section.
Keynes (1936) suggested that in the presence of financing frictions, firms exhibit a precautionary demand for holding funds. Firms perform cost-benefit analysis of financing sources (trade-off theory) and prioritise between internal funds generated from previous periods and external funds from capital markets (debt or equity) (Modigliani & Miller, 1958). A firm’s saving decision depends on the firm’s ability to generate profits and its access to the external sources of financing. If firms face financing constraints due to asymmetric information in capital markets, their external financing will be costly (Kaplan & Zingales, 1997). In such a scenario, it is useful for financially constrained firms to save for future investment activities. The pecking order theory also suggests that a firm’s internal funds (retained earnings) are the least costly source of financing (Myers & Majluf, 1984). Thus, in the presence of financial constraints (high cost of borrowing and less developed financial markets), there are incentives for firms to hold precautionary savings and to utilise the internal funds for future investments at favourable times. Lately, there have been research to explore other factors for corporate saving decision at firm level and aggregate level.
At the firm level, Karabarbounis and Neiman (2013) found a global trend of rising share of corporate savings in the total aggregate level of domestic savings. They mentioned that the share of corporate savings has exceeded 20% in total domestic savings. Few other country specific studies are available such as Hsieh and Parker (2006) for Chile; Bayoumi et al. (2012) for China; Hnatkovska and Armenter (2012) for the United States; and Brufman et al. (2013)—all these have focused on understanding this behaviour of corporate saving (gross savings as retained earnings plus depreciation) in one country.
At the aggregate-level, Grigoli et al. (2014) explained the determinants of total saving and Loayza et al. (2000) explained the determinants of private savings (household plus corporate saving). Ang (2009) and Horioka and Wan (2007) among other studies have explained the determinants of household saving using theories on life-cycle hypothesis, precautionary motives, uncertainty (Carroll, 1997; Deaton, 1989; Modigliani, 1986). However, research is scant on the determinants of corporate saving in emerging economies such as India, especially at firm level. In the Indian context, Bhole and Mahakud (2005) and Jangili and Kumar (2011) have studied the determinants of retention ratio (retained profit divided by profit after tax) which may be considered as a proxy for saving, however, existing literature includes a much broader definition of corporate saving.
This article addresses this gap by first, examining the extant literature on savings to understand the firm and macroeconomic factors that may drive firm-level saving and second, empirically testing the identified variables using the firm-level data in India by employing panel data models.
We examined the extant literature in detail and a set of hypotheses were developed with specific aggregate- and firm-level variables that may drive corporate saving in India. Corporate saving is the dependent variable for this study. To have a broader and appropriate definition of firm-level saving, we have constructed the ‘corporate saving’ as ‘retained profits minus prior-period and extraordinary income plus prior-period and extraordinary expenses plus depreciation’. 1 It was normalised by total assets at the beginning of the year. 2 The extant literature provided the following macroeconomic factors which may drive corporate saving (a) economic growth rate (GDP), (b) price levels (inflation), and (c) availability of credit in the financial markets (financial depth). The company specific factors, identified from the literature which may drive corporate saving includes previous year’s corporate saving, profit margins (profitability), taxes paid by the firm, future investment opportunities (Tobin’s Q), size of the firm, cost of external financing (cost of borrowing), debt taken by the firm (leverage ratio), financial constraints faced by the firm.
Post the detailed literature review, following are the construction of hypotheses related to the identified variables.
GDP growth rate: Annual real GDP growth rate has been used as a proxy for total aggregate demand of the economy, representing the economic growth. High GDP growth indicates favourable and increasing demand conditions in the economy (Grigoli et al., 2014), supporting the internal saving at firm level. It is expected to have a positive relationship with corporate saving. Inflation rate: An increase in prices led to the increase in firm-level profits that further increases the firm-level savings (Kalecki, 1955). Inflation rate defined for the study is the percentage change in CPI (Consumer Price Index). For this study, CPI is a better measure of inflation because services account for more than 50% of GDP (Ministry of Statistics and Programme Implementation, 2021) in India. High level of inflation signals macroeconomic uncertainty that may encourage firms to save for precautionary motives (Grigoli et al., 2014). Inflation rate is expected to have a positive relationship with corporate saving. Financial depth: This has been defined as ‘domestic credit to private sector by banks as a per cent of GDP’. High levels of financial depth in the economy implies that enough credit is available from the banking sector for private sector firms for borrowing purpose. With higher financial depth in the economy, firms have greater access to external borrowing and have a lesser incentive to save (Grigoli et al., 2014; Sahay et al., 2015). Financial depth is expected to have a negative relationship with corporate savings. Lagged
3
corporate saving: In order to examine the presence of dynamic persistence effect, this variable has exclusively been added on the requirement of empirical model, this is the dependent variable itself at the preceding periods. In the presence of persistence effect, previous year’s saving positively affects the current year’s saving (Bhole & Mahakud, 2005). Number of lags for ‘corporate saving’ were empirically tested based on the post-estimation specification test. Profitability: Profitability (profit margin) has been defined as ‘profit after tax (PAT)’ divided by ‘sales’. An increase in profit margins reflects an increase in the pool of funds for saving. It is expected that the current year’s profitability may have a positive relationship with corporate savings (Bhole & Mahakud, 2005; Jangili & Kumar, 2011). Effective corporate tax rate
4
: This has been defined as ‘corporate taxes paid’ divided by ‘profit before tax’. Corporate tax ratio may be positively related to corporate savings because a higher incidence of corporate tax makes companies retain more savings than distribute them as dividends (Hsieh & Parker, 2006). Prior empirical evidence also supports this traditional viewpoint that in presence of relatively higher taxes, firms prefer avoidance of double taxation and prefer saving rather than distributing (Poterba & Hubbard, 1987). Tobin’s Q: Tobin’s Q has been incorporated as a proxy of future investment opportunity (Chandra, 2019). This has been defined as ‘Market capitalisation plus book value of total debt’ divided by ‘total assets’. This variable is expected to have a positive relationship with corporate saving because increased future investment opportunities will motivate firms to increase internal funds (Brufman et al., 2013; Horioka & Terada-Hagiwara, 2013; IMF, 2006; Özmen et al., 2012). Firm size: This has been computed as log of total assets (Horioka & Tereda-Hagiwara, 2013; Nguyen, 1985). Firm size is expected to be positively associated with corporate saving. Cost of borrowings: This has been defined as ‘interest payments’ divided by ‘total outstanding borrowings’. As per the trade-off theory (Modigliani & Miller, 1958), if the external financing is costly then the internal financing becomes the preferred source of financing. If a firm is experiencing high ‘cost of borrowings’ with the existing set of borrowings then ‘cost of borrowings’ shares a negative association with corporate saving (Jangili & Kumar, 2011). Payments outflow towards high cost of borrowings leaves less firm-level savings. This is expected to have a negative relationship with corporate savings. Leverage ratio: This has been captured by debt-to-equity ratio and is expected to have a negative association with corporate saving (Brufman et al., 2013; Özmen et al., 2012). A highly leveraged company depends more on internal sources of financing because already having a high debt to equity ratio does not facilitate firm to seek further external financing (Kaplan & Zingales, 1997). An increase in debt-to-equity ratio will further increase the debt servicing cost and effectively reduce the firm-level saving. This is expected to have a negative relationship with corporate savings. Dividend pay-out ratio: Dividend pay-out ratio has been computed as ‘dividend paid’ divided by ‘profit after tax’. This has been incorporated as a proxy for financial constraint indicators (Brufman et al., 2013). A higher dividend pay-out implies lower financial constraints for the firm because it is able to distribute the dividends. Paying off dividends also signals that the firm can raise future financing needs from the market itself and it is less reliant on internal financing. This is expected to have a negative relationship with corporate savings. However, empirical studies found a mix of results suggesting that irrespective of their financial constraints status, firms either prefer sticking to their dividend policy routine (Das, 2017) or weigh the benefits of not distributing dividends higher than distribution (Reddy & Rath, 2005).
Empirical Framework and Data Sources
This study employed panel data models using the firm-level data of publicly listed non-financial firms and aggregate macroeconomic-level data from India for financial years 2004 to 2018. 5 Dummy variable ‘M-S’ was coded as ‘1’ for a manufacturing sector firm and as ‘0’ for a service sector firm. There is a dip observed in the year 2008–2009 (see Figure 1), so to identify the impact of the global financial crisis, a dummy variable ‘GFS’ was also introduced, coded as ‘1’ for the year 2008–2009, otherwise as ‘0’.
To test the proposition of ‘persistence effect of saving’, a dynamic panel data (DPD) model was employed. This model provides the advantage of introducing a dynamic nature to the dependent variable by including the lagged dependent variable as one of the regressors. The below equation was used for empirical estimation, under the assumption of a linear relationship among variables:
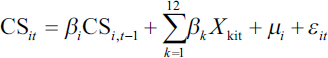
where CS = corporate saving, firms are represented by subscript, i = 1, 2…,n, with time, t = 1, 2…,T. X represents the explanatory variables; k represents the number of explanatory variables.
Functional Form (Model 1)
(CS)it = β0 + β1(CS)it-1 +β2(CS)it-2+ β3(CS)it-3+ β4(GDP growth rate)t + β5(CPI Inflation Rate)t–β6(Financial Depth)t + β7(Profit after tax/sales)it + β8(Corporate taxes paid/ profit before tax)it + β9(Tobin’s Q)it + β10(Log of total assets) – β11(Interest payments/ total outstanding borrowings) –β12(Debt/ equity) – β13(Dividend/ profit after tax) + β14(dummy M-S) –β15(dummy GFC))+µi+ εit
where, Corporate Saving (CS) is ‘retained profits minus prior-period and extraordinary income plus prior-period and extraordinary expenses plus depreciation’ divided by ‘total assets at the beginning of the year’. Financial Depth is ‘Domestic credit to private sector by banks as a per cent of GDP’. Tobin’s Q is ‘Market capitalisation plus book value of total debt divided by total assets’.
Two techniques have been used in the literature to conduct DPD analysis, namely difference GMM estimation and system GMM estimation (see Appendix A). Arellano and Bond (1991) proposed the different GMM estimation method, which employs additional instrumental variables (IV) to solve the correlation issues of the regressor and time invariant error term
Blundell and Bond (1998) proposed the system GMM estimator, which increases efficiency by estimating a system of two simultaneous equations, one in levels (with lagged first differences as instruments) and the other in first differences (with lagged levels as instruments). This two-step variant presents estimates of the standard errors that tend to be severely downward-biased (Blundell & Bond, 1998). However, to resolve this issue, Windmeijer (2005) proposed the finite-sample correction of the two-step covariance matrix, which produces unbiased standard errors. Flannery and Hankins (2013) and Wintoki et al. (2012) established the estimation superiority of two-step, finite-sample correction and the robust standard errors of system GMM. This study used the system GMM model with two-step estimation method under finite-sample correction and robust standard errors.
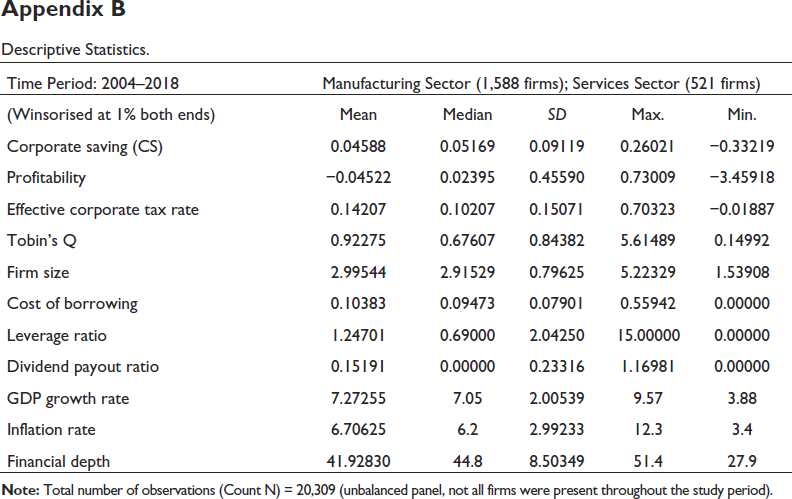
Relevant data was captured from the database of CMIE Prowess and Reserve Bank of India. The data cleaning and filtering process 6 resulted in 1,588 unique manufacturing firms and 521 unique services firms for sample years 2004–2018, which led to an unbalanced panel with the number of firms varying with time. To handle extreme outliers, data was winsorised at 1% at both ends. Descriptive statistics (see Appendix B) suggest that the median corporate saving of sampled firms is 0.05, which is lower than the median value for Asia (except China and Japan), reported as 0.06, and higher than the median value for China, reported as 0.04 (Bayoumi et al., 2012).
We employed DPD models with system GMM estimation to empirically test our objectives. The analysis was carried out for the full period (2004–2018), including all firms, using suitable estimation procedures. 7 The model was found to be well-specified in terms of the respective specification tests. 8 The results were robust to a series of robustness tests, wherein we used different proxies to measure the identified independent variables (see the section on ‘Robustness Checks’).
Results and Discussion
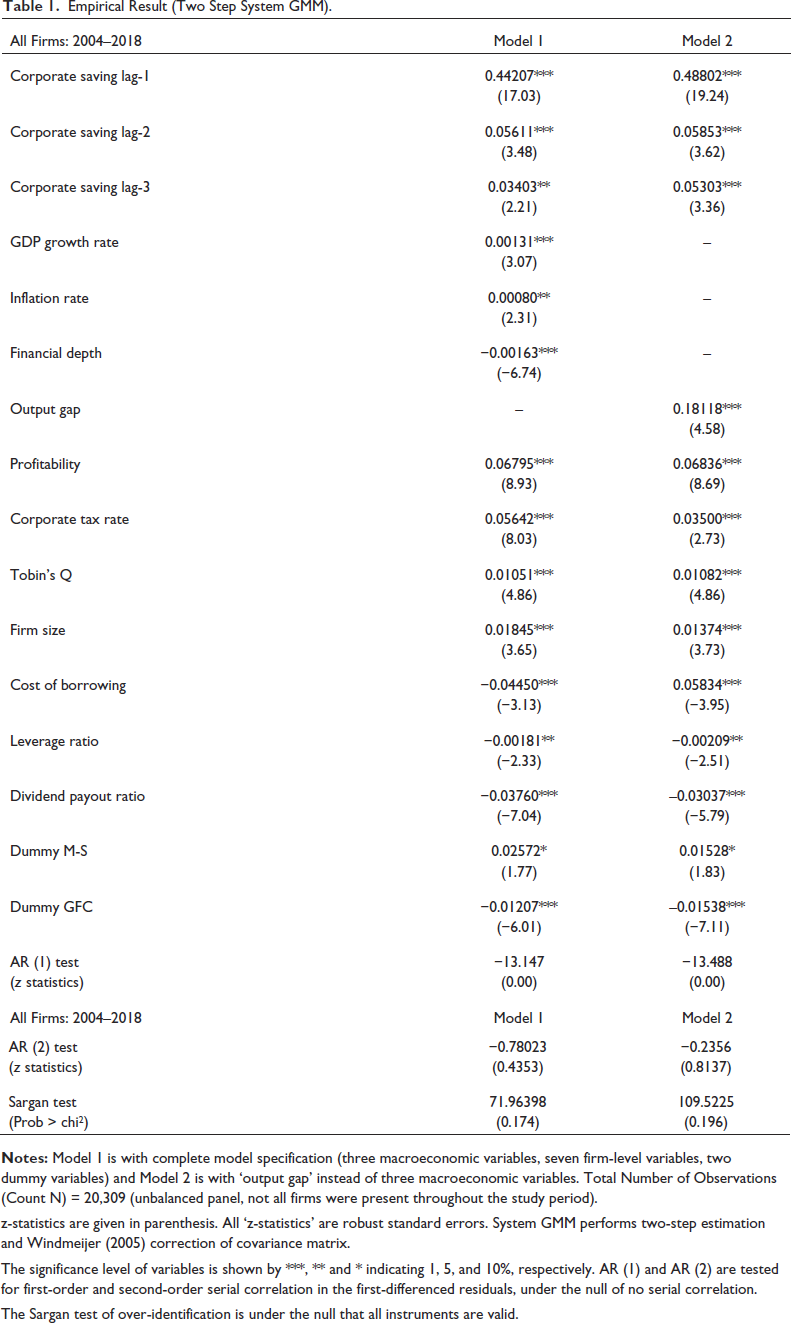
System GMM estimation of DPD model (see Table 1) for years 2004–2018 suggests the significant determinants of corporate saving. Lagged corporate saving, profitability, corporate tax, Tobin’s Q, 9 firm size, inflation rate, and GDP growth rate positively affect firm-level saving in India. On the other hand, cost of borrowing, leverage ratio, dividend pay-out ratio, and financial depth were found to negatively affect firm-level saving in India.
Empirical Result (Two Step System GMM).
Empirical Result (Two Step System GMM).
z-statistics are given in parenthesis. All ‘z-statistics’ are robust standard errors. System GMM performs two-step estimation and Windmeijer (2005) correction of covariance matrix.
The significance level of variables is shown by ***, ** and * indicating 1, 5, and 10%, respectively. AR (1) and AR (2) are tested for first-order and second-order serial correlation in the first-differenced residuals, under the null of no serial correlation.
The Sargan test of over-identification is under the null that all instruments are valid.
In the empirical model, the number of lags of corporate saving was determined by AR test, and three lags of the dependent variable were found to be positive and significant. Findings suggest that a 1% increase in the first lag of corporate saving (scaled by total assets) increases the current year’s saving (scaled by total assets) by 0.44% (see Table 1). We found the presence of dynamic persistence effect at firm level while examining the effect of preceding years on saving decisions of current year. This implies that saving decisions from previous years are influencing the saving decision of current year. This study found that the dynamic persistence effect prevails for firms in India. Fluctuations in year-on-year firm-level saving are explained by a set of determinants including the saving strategy adopted by the firms in preceding years.
With respect to other firm-level factors, findings are consistent with the constructed hypothesis and are in-line with the extant literature. On profitability front, we found that a 1% increase in profitability will increase corporate savings by around 0.07% (Bhole & Mahakud, 2005; Jangili & Kumar, 2011). This can be attributed to income effect that with increasing levels of profits, firms tend to save. The relationship between the effective corporate tax rate and firm-level saving is found to be positive and significant. One of the explanations for this positive effect is attributed to the reduction in effective corporate tax rates in India. Over these years, effective corporate tax rates have been reduced, and companies are paying much lower amounts as tax (Ananthanarayanan, 2018). Also, the higher tax incidence is associated with higher profitability and higher levels of corporate saving (Celestine, 2014). Thus, companies avoid the incidence of double taxation by not paying dividends in the presence of higher taxes. This empirical finding seconds the traditional view, according to which, firms balance the dividend tax burden against the benefits of paying dividends and any change in the relative tax burden on dividends and capital gains will affect corporate savings (Poterba & Hubbard, 1987).
Tobin’s Q (future investment opportunities) and size of the firm were found to be significant and positive with firm-level savings. This is consistent with previous studies (Brufman et al., 2013; Horioka & Terada-Hagiwara, 2013; IMF, 2006; Özmen et al., 2012). The positive relationship between Tobin’s Q and corporate saving highlights that firms observing the future investment opportunity tend to increase their internal funds.
However, cost of borrowing and leverage ratio are found to negatively affect the corporate saving. This negative effect can be attributed to a dual burden caused by high cost of external financing and exhaustion of firm’s internal funds translating to large debt. These findings are consistent with the previous literature (Brufman et al., 2013; Jangili & Kumar, 2011; Özmen et al., 2012).
Inflation, captured with CPI inflation rates, was found to have a positive and significant impact on corporate saving. This finding is consistent with the earlier studies (Grigoli et al., 2014). During 2004–2018, mean value of inflation was 6.70% with a standard deviation of 2.99% (see Appendix B). High range of inflation signals an unstable macroeconomic environment and firms start saving with precautionary motives, to hedge against this (Grigoli et al., 2014). Another explanation for positive association comes from the Kalecki’s framework suggesting that increasing price-levels increases the profit-levels and hence corporate saving increases (Kalecki, 1955). The study period has observed relatively higher levels of inflation rates suggesting the increasing profit-levels and corporate savings.
The coefficient of financial depth was found to be significant and negative, which suggests that with a rise in financial deepening, firm-level saving will decrease (Grigoli et al., 2014). Higher financial depth indicates sufficient availability of credit in the banking sector for firms to avail external bank borrowings. With increasing financial depth that is with relatively easier access to external bank borrowings, firms tend to decrease their reliance on internal saving.
Negative and significant association of dividend pay-out ratio (see Table 1) with saving was found, suggesting that firms paying dividends are financially constrained (Brufman et al., 2013). Another explanation could be sticky dividend policies. Evidently, there are large numbers of such firms in India that are not making good profits but pay seemingly good dividends (Kant & Gupta, 2013), demonstrating huge inconsistency between their profits and dividend pay-outs (Dubey, 2015).
The coefficient of dummy M-S was found to be significant and positive, which implies that firms in the manufacturing sector have a higher level of corporate saving compared to those in the services sector. Dummy GFC (see Table 1) was found to be significant and negative, which signified the negative impact of financial crisis on corporate saving.
Robustness Checks
Robustness of DPD model was checked by estimating pooled ordinary least square regression (OLS) and static panel data model with fixed effects (FE) with ‘lagged corporate saving’ as an independent variable. Results (see Table 2) found the appropriateness of employing DPD model, where coefficient of lagged corporate saving in dynamic panel (DPD) model that is, 0.44 came in between OLS, being upper bound that is, 0.54 and FE, being lower bound that is, 0.29.
Empirical Result (Robustness of Models).
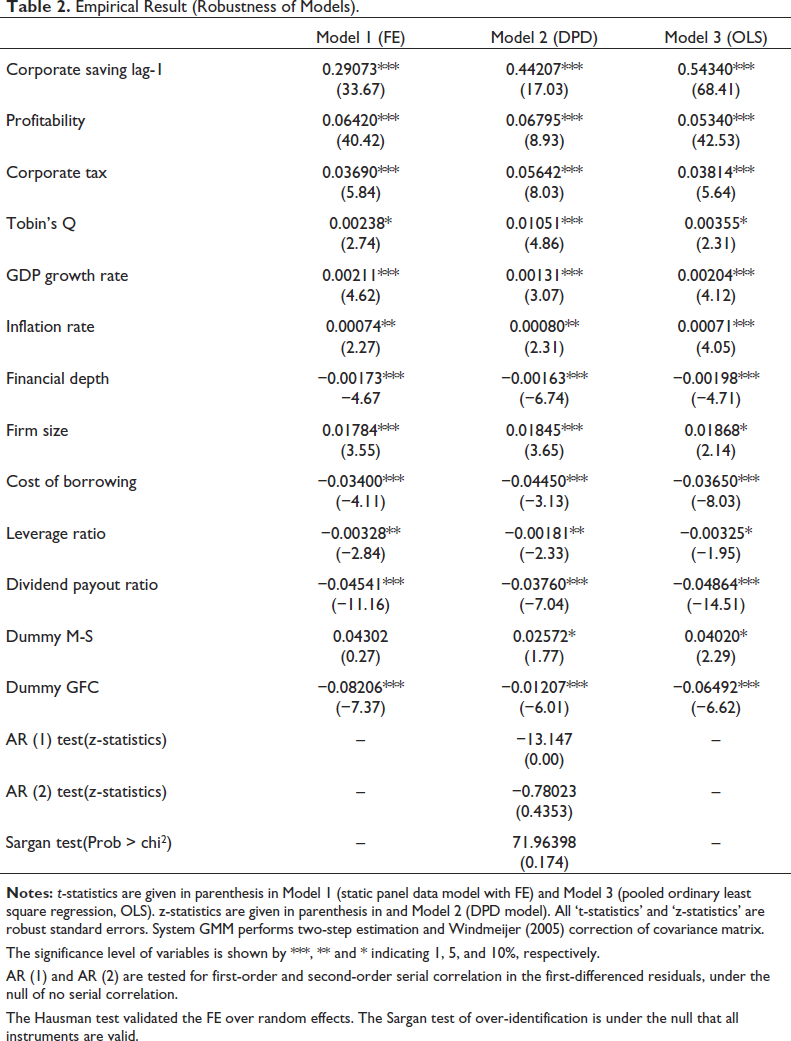
The significance level of variables is shown by ***, ** and * indicating 1, 5, and 10%, respectively.
AR (1) and AR (2) are tested for first-order and second-order serial correlation in the first-differenced residuals, under the null of no serial correlation.
The Hausman test validated the FE over random effects. The Sargan test of over-identification is under the null that all instruments are valid.
Robustness of results was checked using proxies for select individual variables (firm size, leverage ratio, Tobin’s Q, output gap), but no significant deviations from the reported results 10 were found. Output gap 11 was considered a proxy for all the macroeconomic variables, to illustrate the business cycle effect. Output gap has been found positive and significant (Kukk & Staehr, 2017) (see Table 1, Model 2). Time FE have been incorporated in the analysis using year dummies with and without macroeconomic variables 12 and there was no significant difference found in the estimation results.
Robustness checks were performed with alternative definitions of the dependent variable, as suggested in the existing literature (see Appendix C): retained profits by total assets (t−1), (Karabarbounis & Neiman, 2013) and retained profits plus depreciation by total assets (t−1) (Aron & Muellbauer, 2000). Noteworthy results of this exercise include the presence of dynamic persistence in corporate saving behaviour in India from the preceding 2 years in both models (see Appendix C). There was no significant deviation found in the results for other explanatory variables.
This study has identified firm-level and aggregate-level drivers of corporate saving in India. Inferring from the literature on aggregate domestic savings, this article has explored the corporate saving behaviour in India. In doing so, the article has analysed the firm-level data and examined the presence of (a) effect of macroeconomic and firm-level variables on corporate saving, (b) dynamic persistence effect, and (c) precautionary motives in the saving behaviour of firms.
Overall, the findings suggest that GDP growth rates, inflation rates, previous year firm-level savings, firm-level profits, taxes, size of the firm, and future investment opportunities explain the positive fluctuations in firm-level savings in India. Whereas, financial depth, cost of borrowings, leverage ratio, and dividend pay-out ratio explains the negative fluctuations in firm-level savings in India. These empirical findings support the contemporary discussion in advanced economies (Begenau & Palazzo, 2021; Chen et al., 2017; Falato et al., 2020). However, the study provides a greater scope for future research to explore the heterogeneity in the patterns of private corporate saving in advanced and developing economies.
Appendices
A dynamic relationship characterized by the presence of lagged dependent variable among the right-hand side regressors is discussed below

where 
where
The dynamic panel data regression is characterized by two sources of persistence over time:
Autocorrelation due to presence of a lagged dependent variable among regressors Individual effects characterising the heterogeneity among the individuals
Since
For the FE estimator, the within transformation wipes out the
Arellano and Bond (1991) argued that additional instruments can be obtained in a dynamic panel data model if one utilises the orthogonality conditions that exist between lagged values of 
where 
and note that 
In this case, 
In this case,
Arellano and Bover (1995) developed a unifying GMM framework for looking at efficient IV estimators for dynamic panel data models. In order to obtain improved precision and better finite-sample properties, Arellano and Bover (1995) and Blundell and Bond (1998) use an additional condition
Note: This description has been prepared by authors, which is based on their understanding of sources below:
Baltagi, B. H. (2013) ‘Econometric Analysis of Panel Data’, Chapter 8, Fifth Edition. John Wiley & Sons Ltd. New Delhi, India. Arellano, M. (2013) ‘Panel Data Econometrics’, Chapter 7, Revised Edition. Oxford University Press. United Kingdom. Hsiao, C. (2014) ‘Econometric Society Monographs: Analysis of Panel Data’, Chapter 4, Third Edition. Cambridge University Press. New York, USA. Cameron, A. C., & Trivedi, P. K. (2010) ‘Microeconometrics Using Stata’, Chapter 9, Revised Edition. A Stata Press Publication. Texas, USA.
Descriptive Statistics.
Descriptive Statistics.
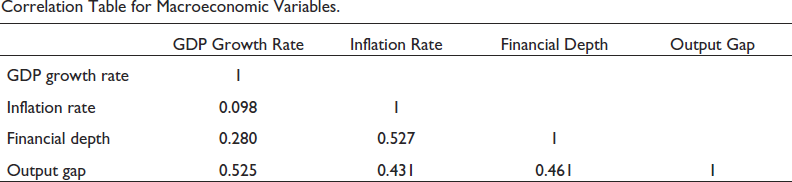
Correlation Table for Macroeconomic Variables.
Robustness Tests (Proxies for Dependent Variables).
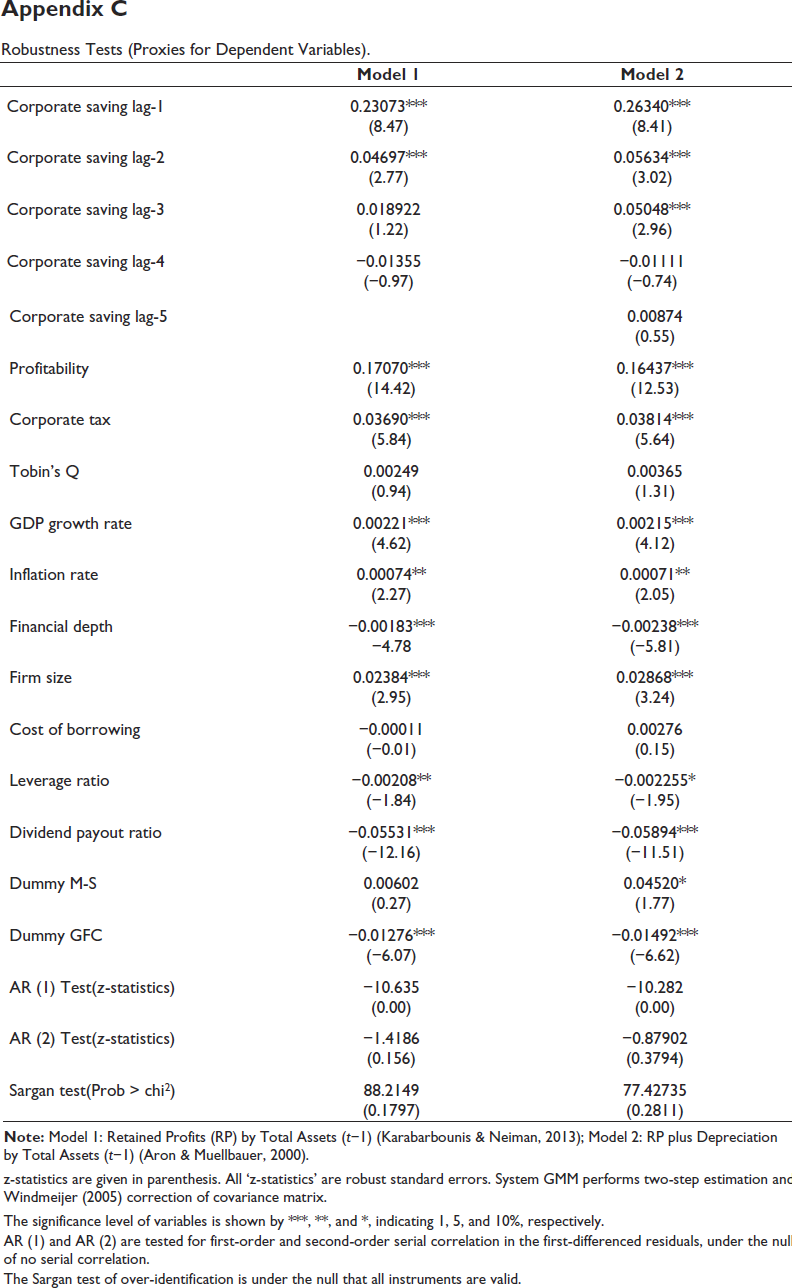
z-statistics are given in parenthesis. All ‘z-statistics’ are robust standard errors. System GMM performs two-step estimation and Windmeijer (2005) correction of covariance matrix.
The significance level of variables is shown by ***, **, and *, indicating 1, 5, and 10%, respectively.
AR (1) and AR (2) are tested for first-order and second-order serial correlation in the first-differenced residuals, under the null of no serial correlation.
The Sargan test of over-identification is under the null that all instruments are valid.
Footnotes
Acknowledgement
The authors sincerely thank the editor and anonymous reviewers for their comments that have strengthened the study.
Declaration of Conflicting Interests
The authors declared no potential conflicts of interest with respect to the research, authorship and/or publication of this article.
Funding
The authors received no financial support for the research, authorship and/or publication of this article.