
Abstract
Using the PLFS 2018-19, this study intends to analyse current labour market from the perspective of COVID-19 pandemic, subsequent lockdown and the expected slowdown in the Indian economy. We explore the questions such as: What share of workers will be able to work from home? Which are the vulnerable groups of workers in the labour market, that are likely to be the most affected? We show that 18-19% of non-farm workers are engaged in work from home (WFH) occupations, with women and urban areas having larger share of these workers. We find that 32 (10) % of non-farm workers in rural (urban) areas are vulnerable and face higher risk of job loss during a lockdown.
Introduction
COVID-19 has overpowered the ability to earn a living for many people, rendering the world economy to a standstill, and bringing a myriad of social and economic changes. The situation in India is no different. With the number of COVID-19 cases increasing significantly, the Indian government announced a complete lockdown between March 2020 and May 2020 to practice social distancing like many other countries. During the lockdown, unemployment increased from 8% to 24.3% between March and May [CMIE]. 1 According to the Ministry of Statistics and Programme Implementation, India’s Industrial Production fell by 16.7% year-on-year in March 2020. 2 It is the steepest decline since 1994. A plausible reason could be that the lockdown has closed many businesses either temporarily or permanently eventually exposing many workers to job loss. Against this background, this study intends to explore, how will the pandemic and the slowdown affect the Indian labour market? Who will be the most and the least vulnerable workers in the current labour market if a long-term shock or slowdown of systemic nature is observed?
On 3 May 2020, the government partially opened up the economic activities, suggesting workers to continue working from home to ensure social distancing. This kind of work flexibility is not ubiquitous across all jobs and the plight of migrants is conspicuous through the media. Moreover, there is not much information about the extent and estimates of actual individuals being adversely affected by the lockdown. 3 Interestingly, the district level estimates of migrants from Census 2011 are not yet fully released. 4 Gita Gopinath, chief economist at the International Monetary Fund (IMF), in a blog 5 (dated 14 April 2020) suggested that the coronavirus-led slowdown across the world is likely to be bigger than financial crisis of 2007–2008 and the Great Recession with more geographic outreach.
In light of the detrimental effects of COVID-19 on the global and the national economy, this study explores three key aspects of the Indian labour market. First, we intend to understand what sort of occupations and workers will be able to cope with the aftermath of the lockdown and following slowdown. For this, we analyse the task content of the occupations to explore flexibility of jobs. Workers employed in occupations that enable spatial flexibility or working from home are likely to be the least affected and one of the first to adapt to the changing need of the time. Based on our estimates from Periodic Labour Force Survey (PLFS) 2018–2019, approximately 18%–19% of non-farm workers are engaged in work from home (WFH) occupations, with women and urban areas having a larger share of these workers.
Second, given the nature of the pandemic, many of the occupations are categorised as risky due to high exposure to human interaction. We show that almost half of the workers are employed in high-risk and medium-risk occupations. Since social distancing is the key element of this pandemic, how it will affect a certain set of industries based on their occupational composition, is also important to understand. For example, the tertiary-sector activities such as tourism, hospitality, repairs and related services are likely to get more affected than others.
Third, we identify the set of workers who are the most vulnerable in the current labour market. The vulnerability in the labour market is defined as per the definition of International Labour Organization (ILO, 2009) based on the concept of social safety nets. We find that 32 (10)% of non-farm workers in rural (urban) areas are vulnerable and face higher risk of job loss during a lockdown.
The rest of the study is organised as follows. In the next section, we present the conceptual framework and related literature on labour markets and crisis. The subsequent section discusses in detail the dataset and methodology used in the analysis. The fourth section provides the main findings about the various aspects of labour market, that is, workers in WFH jobs, high-risk jobs and vulnerable workers. The last section concludes the study.
Conceptual Framework and Related Literature
The effect of macroeconomic slowdown on labour market agents varies with labour market institutions prevalent in different countries. Developing countries, such as India, house a large informal sector and informal workforce that co-exists with limited social security and other safety nets. However, in developed countries labour market institutions and policies are well placed and the fiscal cover for citizens by the governments is bigger due to the small size of their population and higher per capita tax collection. For example, the Danish government has assured that private sector workers who would lose their jobs due to coronavirus pandemic shall be paid 75% of their salaries. 6 Although the literature on the performance of labour market during the crisis/slowdown is largely confined to developed countries, it is still useful to outline a conceptual framework to understand various channels through which labour markets and especially workers are affected. 7
The first channel is through direct job loss on account of reduced aggregate demand in the economy and reduction or closure of production activities. The economic downturn leads to longer durations of unemployment (Kroft et al., 2016). Falling revenues and rising costs of firms leads to job loss for workers (Fairlie, 2013; Von Wachter et al., 2009). Unlike regular times, when a business fails during recession, many firms simultaneously lose demand, making it difficult for former employees to be rehired. Hoynes et al. (2012) showed that in the US economy from 1979 to 2011, men, blacks, younger age cohort and workers with the low education level suffer the most in terms of employment loss. They argued that manufacturing and construction sectors are more cyclical and most affected during the recession, whereas services and government sector remain less exposed to cyclical fluctuations. Most of these studies are ex post facto analysis. In the case of current situation, where slowdown is induced by a global pandemic and the response of the economies in terms of universal lockdown of countries and social distancing, the affected group of workers can be different than in the past.
The second channel discusses the skills and jobs that would be affected by the slowdown and crisis. Recession or slowdown may lead to huge churning in the labour market in the favour of highly skilled workers and non-routine jobs (Hershbein & Kahn, 2018). Jaimovich and Siu (2020) showed that most of the jobs lost during recession are in-routine occupations and are never recovered.
The third channel explores the role of government interventions using various active and passive labour market policies targeting firms and workers. Recessions are believed to be the best time to introduce large-scale labour market reforms. It becomes essential for countries to make comprehensive changes in their approach to tackle labour market woes, explained by Turrini et al. (2015) as the ‘back against the wall’ hypothesis. Adascalitei and Morano (2015) provided a detailed account of labour reforms across countries after the 2008 crisis. Eichhorst et al. (2010) showed how labour market institutions provide buffer to the labour market at the time of crisis (financial crisis 2008). In the case of Germany, stringent employment protection laws limited the dismissals. At the same time, policies on work hour regulations allowed firms to adjust their costs and efficiently cope with the economic downturn. Taking lessons from this literature, smartly taken labour market reforms can provide some stability to the labour market in India.
Lastly, coming to the relationship between slowdown and decent work for the workers, it can be argued that slowdown would not affect the workers if they are employed in jobs which provide cushion in terms of social security, paid leaves and other benefits. And if at all they are affected, the slowdown would have less severe impact on them. The discussion on decent work is complementary to the discussion on formal and informal jobs, where it is argued that informal jobs are the first one to be negatively affected by slowdown and therefore more comprehensive insurance/ protection is needed for them through goals of decent work. There should be stimulus targeted towards workers who are not provided any decent work. We will discuss this in detail in the relevant section later. Interestingly, to the best of our knowledge, this aspect of relationship between slowdown/labour market shocks and the resilience of workers employed in decent work remains largely unexplored in formal studies.
Drawing motivation from these various strands of literature on economic slowdown and labour market outcomes, we discuss various groups of agents who are likely to be affected in the aftermath of economy-wide lockdown and imminent slowdown of the Indian economy.
Data and Methodology
This study uses data from the PLFS conducted by National Sample Survey Office (NSSO), India for the period July 2018 to June 2019. The PLFS data provide the socio-economic and demographic information for a sample of 101,579 households comprising 420,757 individuals in rural and urban areas across all Indian states. The primary focus of the survey is to provide information on the economic activity status of all household members including their occupation and industry of work. This dataset also enables us to look at the status of workers from multiple perspectives such as enterprise type, location of work and social security benefits. The occupation codes are available at three-digit level based on National Classification of Occupations (NCO)-2004 and the industry of work codes are available at five-digit level based on National Industrial Classification (NIC)-2008. The information on non-farm 8 workers in the working age (15–59 years) 9 is based on their usual principal and subsidiary status of work. Sample weights provided in the dataset are used to derive population estimates.
Identifying WFH Occupations
Given the nature of COVID-19 pandemic and its implications on the nature of interaction among individuals, social distancing is indispensable. For many of the occupations, working in close proximity and face-to-face communication along with similar other aspects are key tasks to be carried out on day-to-day basis. This leads to a natural question, what are the occupations that can be carried out from remote locations.
One can always conduct a survey of the workers and ask them direct questions whether their day-to-day activities require interacting face to face or require some complement technology which is difficult to access from the remote location 10 (Nakrošienė et al., 2019). For example, a machine operator in a manufacturing plant would not be able to work from the remote location due to machine being complement to his primary task requirement. On the other hand, a teacher would require just a communication device, a mobile phone or laptop with internet connection for him/her to conduct teaching sessions from the remote location. 11 One can also analyse the task content 12 of various occupations, to classify them as being teleworkable or not. This is one of the traditional ways to analyse and categorise various occupations along different lines, such as for offshorable occupations (Goos et al., 2014), routine and non-routine tasks (Autor et al., 2003). The second approach allows using secondary sources of data unlike the first approach that requires the primary data collection from workers. For our analysis, we use the second, task-based approach to identify WFH jobs and corresponding labour force.
To this end, we use the classification proposed by Dingel and Neiman (2020, hereafter DN) and extended by Yasenov (2020). DN used the O-NET 13 classification of occupations (an extensive job survey covering various aspects of jobs and workers suitable for them). It is a US-based dataset. Since the relative position and essential characteristics of occupations are likely to be similar in any country, O-NET is one of the most standard and widely used datasets for countries other than the US. We use it due to the absence of a dataset that quantifies attributes of occupations in India. 14
DN identified 17 attributes from O-NET covering multiple aspects of an occupation such as requirement of physical activity, working with machine and equipment, virtual or physical contact with other people and exposure to outdoor environment, infection or injury to decipher which occupations can be categorised as WFH. Yasenov (2020) added another 11 attributes to this list to make the criterion more stringent. Both these methods classify an occupation as WFH only if none of the requirements hold. 15
We first identify the WFH occupations among the NCO 2004 four-digit occupations. If all the four-digit occupations within a three-digit occupation are classified as WFH, we classify the latter also as WFH. 16 To check the sensitivity of our estimates of WFH occupations and workers, we also follow the method by Yasenov (2020). Following DN (Yasenov) method 16 (12) three-digit occupations out of 113 can be done from home in India. The WFH occupations employ 18–19% of working age non-farm workers in India but their distributions are rather skewed across major occupation groups. Skill-intensive occupation groups have a higher share of workers who can WFH, explained in detail later in the study.
Measuring Riskiness of Occupations
Given that the current crisis is also a health hazard and the virus spreads through human interaction, jobs that expose workers to infections or make social distancing impracticable are riskier than others. Thus, the risk level of an occupation has bearing on the continuity of the worker’s employment. For measurement of the risk factor, we categorise occupations based on the following attributes from O-NET: ‘performing or working directly with public’, ‘physical proximity’ and ‘exposed to disease or infections’ 17 (Barbieri et al., 2020; Bhorat et al., 2020). The value for each attribute ranges from 1 to 5 and is rescaled on a scale of 0–100. The three attributes are added and further standardised on a 0–100 scale to calculate an integrated risk factor. Occupations are categorised as high, medium and low risk if their risk factor is greater than or equal to 70, less than 70 but greater than or equal to 50 and less than 50, respectively. Out of 108 three-digit occupations, 21 are high-risk, 29 are medium-risk and 58 are low-risk occupations.
While using WFH and risk-level classifications, a few caveats are important to mention to understand the limitations of this approach. These measures are only indicative of the actual characteristic of the occupations as workers may actually not be able to WFH for multiple reasons. For example, teachers may not be able to practice it in the absence of electricity, proper internet and electronic equipment among many other things with them or the students. Similarly, if a firm stops running on site, then its share of WFH workers will also not have any work to do from home. The structure of the job and sector may modify to mitigate the human interaction, for example, by automation, which may lower risk factor of the occupation. Therefore, these measures at best give an upper bound of number of workers in occupations based on WFH and risk-level classification.
Vulnerability in Labour Market
ILO (2009) defined a worker to be vulnerable if (a) the earnings from the employment is not able to lift the person and his/her household out of the poverty; (b) the economic activities carried out by the workers is not able to provide them any social safety nets in terms of social security benefits, paid leaves, formal contracts and so on, and (c) a combination of both (a) and (b) criteria. These workers are the most vulnerable to any shock in the labour market and ILO (2009) report argues that their employment cannot be counted as decent work (sustainable development goal 8). Saunders (2003) added one more criterion to identify vulnerable workers which is workers who though are eligible to receive social security benefits but are either unaware to avail such benefits or are not given such benefits (evaded by the firms). We can identify these groups from the PLFS dataset that collects information on nature of economic activity, social security benefits (based on questions asked to the survey respondents), employment contracts as well as the consumption expenditure of the corresponding household to ascertain the poverty status.
Main Results
We will first discuss the estimates and characteristics of the WFH workers followed by the distribution of workers in occupations of different risk levels. Lastly, we will address the vulnerable group of workers in the labour market.
Workers in WFH Occupations
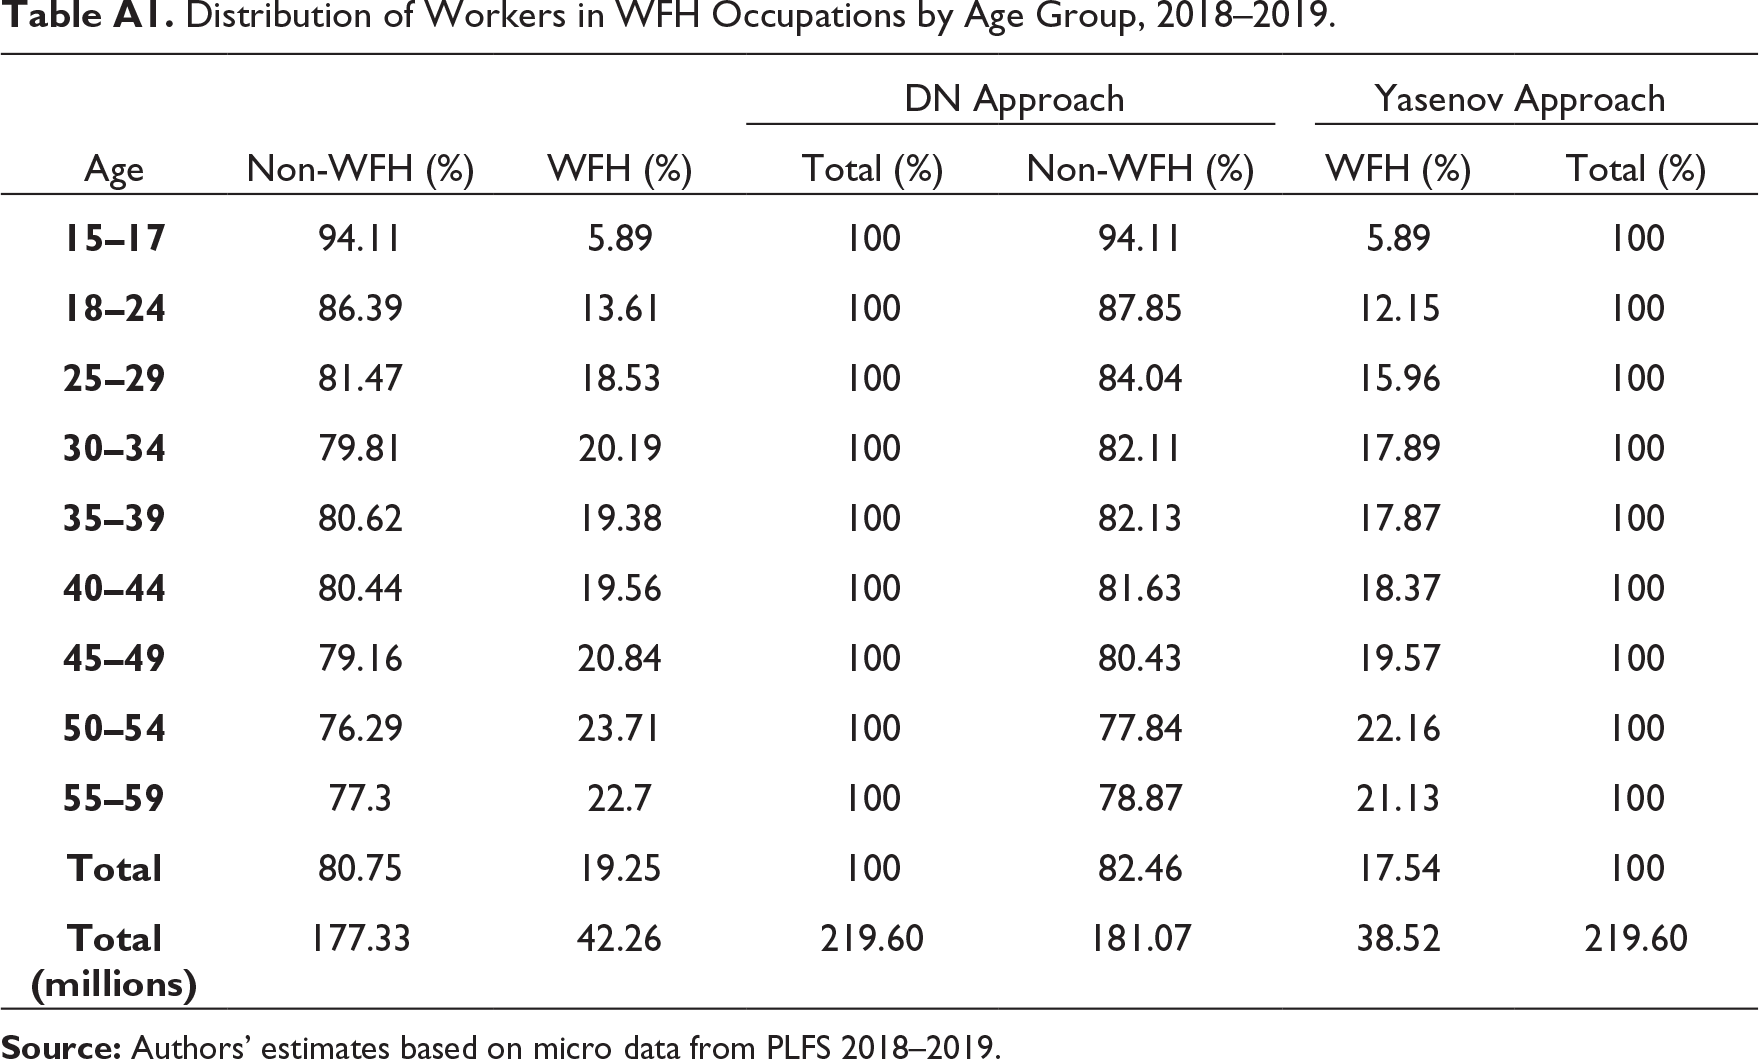
As per the PLFS, the potential WFH workers constitute 19% of the workforce which is an increase from 16% in 2011–2012 (Chatterjee et al., 2020). It is comparable to the estimate of 13% workers for developing countries but is way less than the USA (34%) and China (28% based on Yunnan Province estimates; Saltiel, 2020).
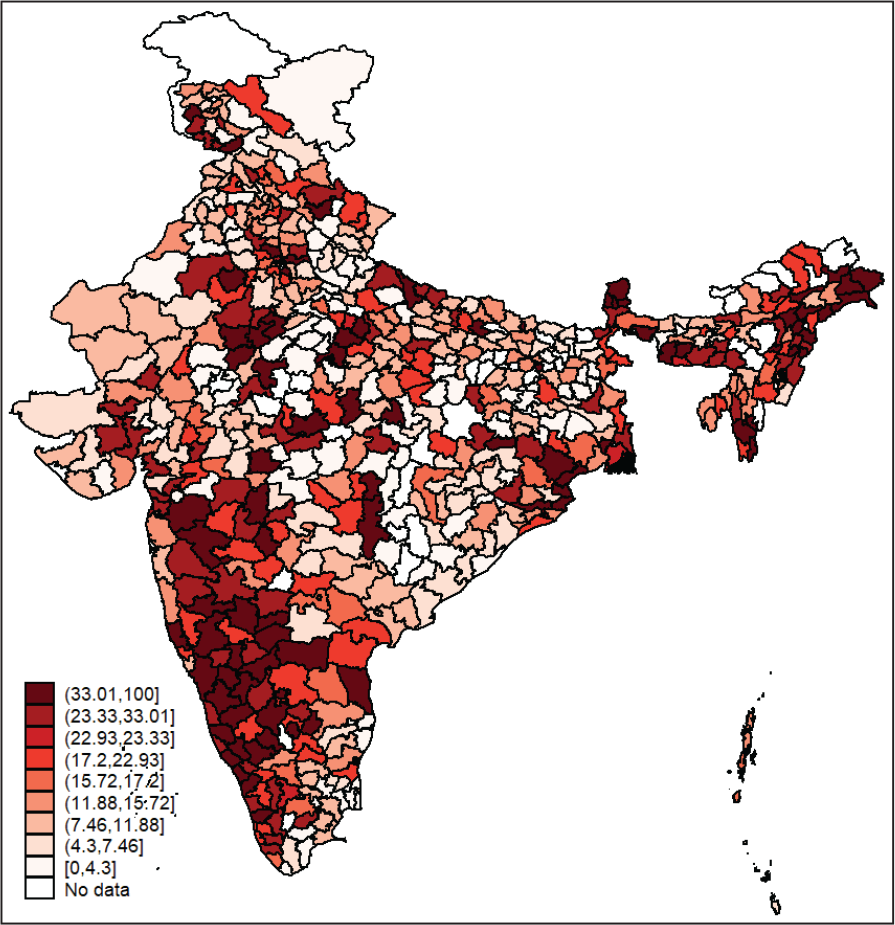
Share of Workers in the Working Age Group (15–59 Years) in WFH Occupations, 2018–2019.
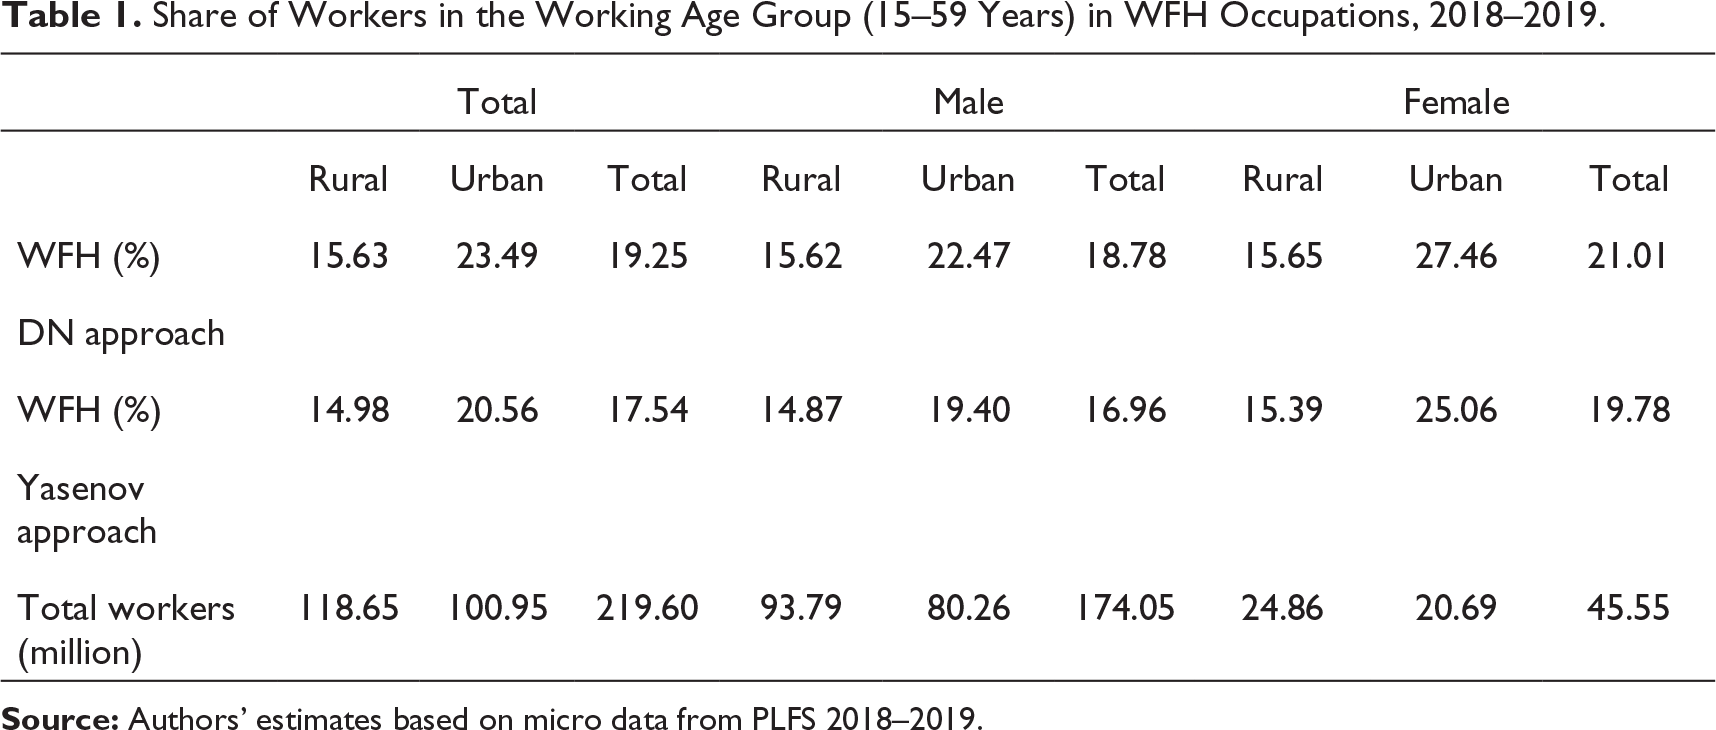
Share of Workers in the Working Age Group (15–59 Years) in WFH Occupations, 2018–2019.
The 42.26 million workers (by DN approach) in India who can potentially WFH are concentrated in few major occupation groups. Based on one-digit occupational classification, following DN approach, legislators, senior officials and managers (Category 1), professionals (Category 2), associate professionals (Category 3) and clerks (Category 4) have 89%, 43%, 45% and 55% of WFH workers, respectively. 19 Service-related occupations and other elementary occupations or those that require working on site or outdoors have negligible percentage of workers who can WFH. This is in line with the evidence found for other developing countries by Gottlieb et al. (2021) with only 1 percent of workers in elementary occupations doing WFH compared to 24 percent in managerial jobs. They also find significant heterogeneity across occupations in terms of the share of WFH workers. Based on this, we can say that WFH occupations are generally associated with cognitive tasks, which are also corroborated by the fact that a larger share of workers (44%) in WFH jobs have above higher secondary level of education. The same holds for rural and urban workers, where 33% and 53% of the workers in WFH jobs belong to above higher secondary level of education, respectively. On the other hand, only one-fifth of the entire workforce falls in this category of the education level, and the share is even lower for non-WFH workers.
In an economy with around 75% of workers engaged in the informal sector, it is not surprising that a large share of workers engaged in self-employed activities are in the WFH category (31%) as compared to wage and salaried employees (20%). This seems counterintuitive in comparison to the existing literature (Saltiel, 2020). But exploring further, a justification can be provided. First, the self-employed category is not a homogenous category and includes own-account workers, employers and helpers. The incidence of WFH is lower among own account workers (30%) and helpers (19%) as compared to employers (64%). Employers largely perform delegating tasks which can be done from the remote location, while workers work from the site. Also, own-account workers do not have to engage with other workers which may facilitate remote working. Looking at the occupational composition of the self-employed, waged and salaried further confirms this argument. The occupation ‘Directors and Chief Executives’ which is a WFH occupation by DN and Yasenov approach constitutes 29% of the total employment of self-employed (own-account and employers) workers. In case of waged and salaried workers, two of the largest occupations employ only 16% of these workers and fall under the non-WFH category.
Next, we come to the spatial distribution of workers in WFH jobs. Figure 1 displays the share of WFH workers in twenty of the largest Indian states. Karnataka and Kerala clearly stand out with the highest share of WFH workers among these states. Around 40% of non-farm workers in Karnataka and 30% in Kerala are employed in jobs that can be potentially done from home. It is not surprising given that Karnataka also houses the IT hub of the country. We find that almost 19% of the all non-farm workers in information and communication sector, a highly teleworkable sector, are in Karnataka. Looking at the industrial distribution of workers in Kerala, it is possible that education and wholesale and retail, two of the biggest sectors with a large share of WFH workers (as shown in next section) could be behind this pattern. Other states that have share of WFH workers higher than the all India average are Maharashtra, West Bengal, Rajasthan and Haryana. We also generate the district level share of workers who can WFH using PLFS data to understand the patterns at a disaggregated spatial level. In Figure 2, it seems clear that regions in some states have higher concentration of WFH workers. This includes states of Karnataka, Kerala, parts of Tamil Nadu, coastal Maharashtra (including Pune), national capital region of Delhi and nearby districts, parts of Haryana and Punjab and substantial part of north-eastern states, Kolkata and nearby districts. Further, we also see a clear difference in the rural and urban areas. The concentration of workers in WFH jobs in rural areas that is largely in the outskirts of major agglomerations (see Figures A1 and A2).
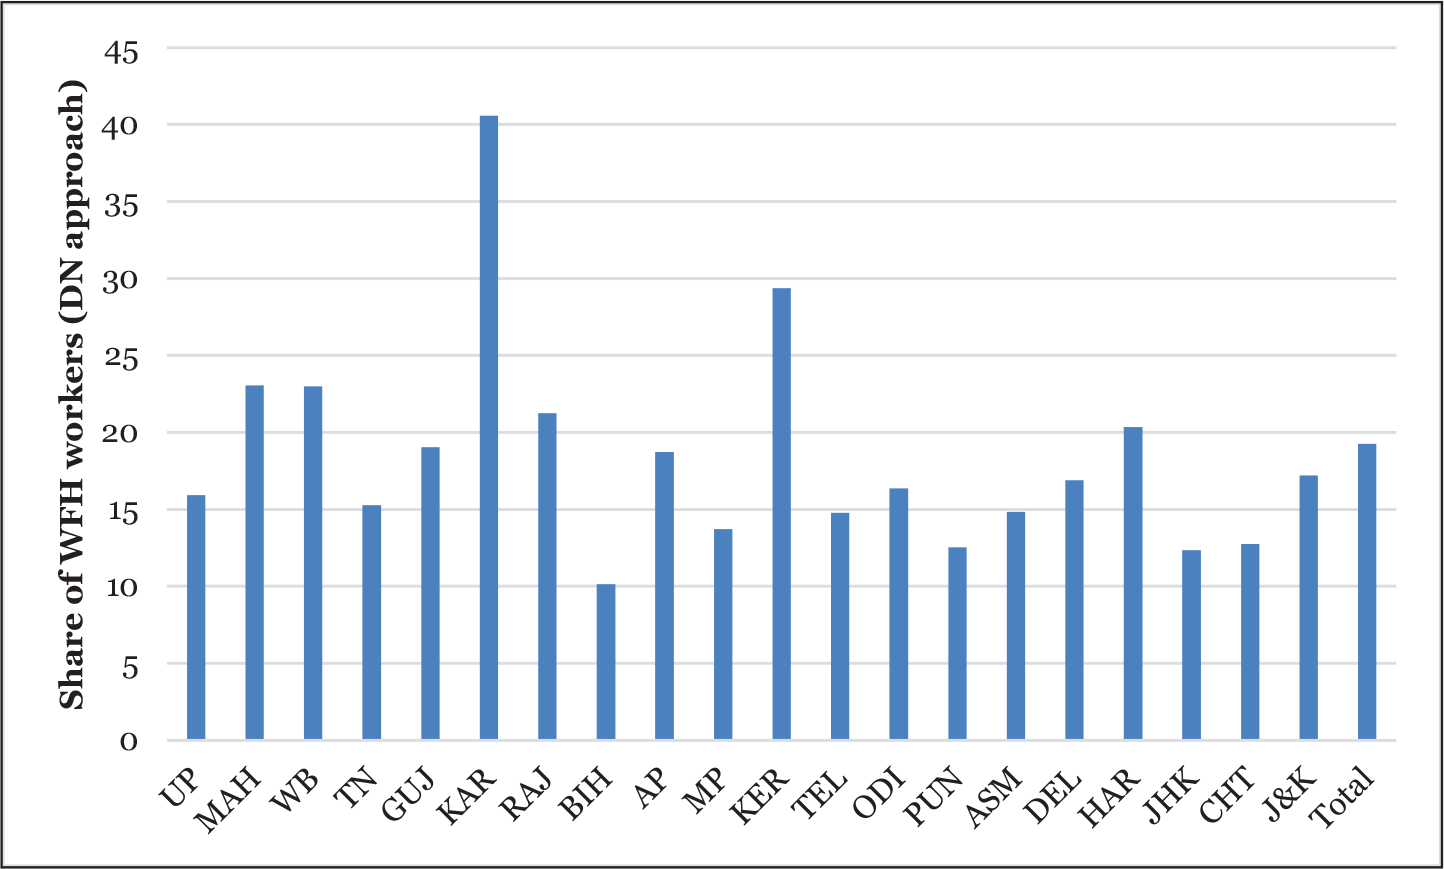
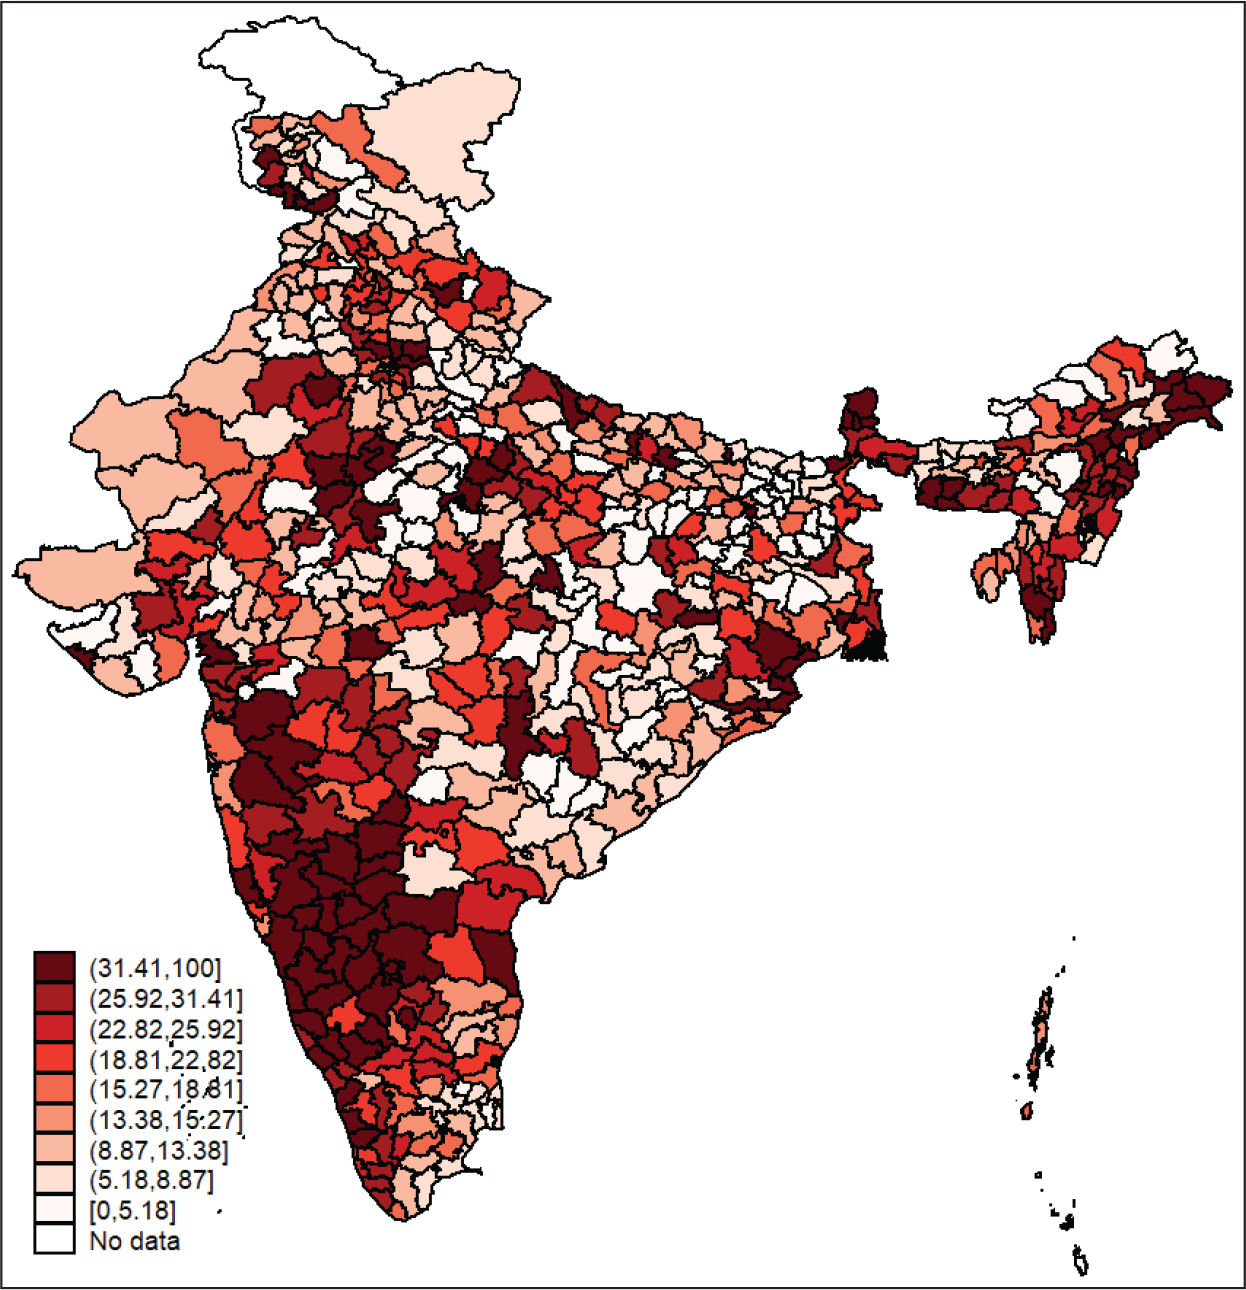
One key takeaway from this distribution is that we can make some calculated predictions about which regions would be able to better cope with the wrath of the lockdown and which regions would be the most affected by it. Regions highlighted above gives the flexibility of the local labour market in terms of teleworkable workforce are less likely to see a large dip in economic activities as well as in dismissal and discontinuation of employment, compared to other regions. Before moving on, we would like to caution about the fact that in the PLFS data, we get information about the geographical location of the residence of the worker and not the workplace. Therefore, one should understand that effect of commuting is not accounted for in our calculations. We can always argue that the distance of commuting generally is not more than crossing a district/cluster region in India.
Workers in High, Medium and Low risk Occupations
During the lockdown on account of COVID-19 pandemic, on the opposite spectrum of WFH workers are the individuals who are part of essential services and engaged in activities which can be classified risky, as the concept of social distancing does not apply to them. Though many of the essential services come under the high-risk occupations, the reverse is not true. For example, a barber is a high-risk occupation, as social distancing cannot be maintained and further physical proximity with the clients also leads to exposure, but it is not characterised as essential services.
Workers in high-risk occupations are always going to be more exposed to infections by virtue of their jobs requiring them to deal with public, working in proximity with other workers or exposing them to disease or infections. Then, there are workers whose jobs are low risk but face the risk of job loss because they cannot go out and work. But these workers will find it least difficult to go back to work. Hence, returning to work post lockdown depends on the risk factor associated with the job and it is likely to be slower for workers in high-risk jobs. Therefore, industries that have a larger share of workers in low-risk occupations may find it easy to reopen.
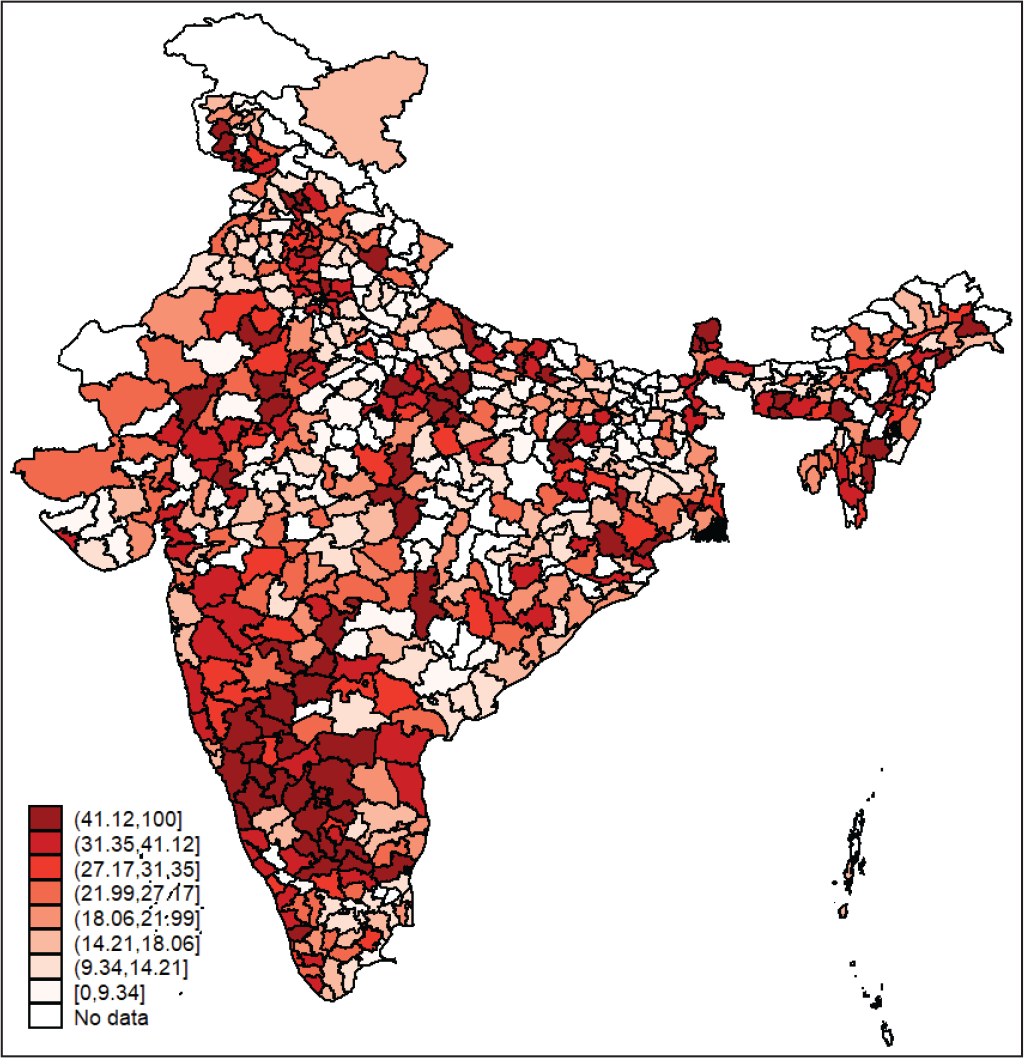
Share of Workers in the Working Age Group (15–59 Years) in Occupations by Risk Level, 2018–2019.
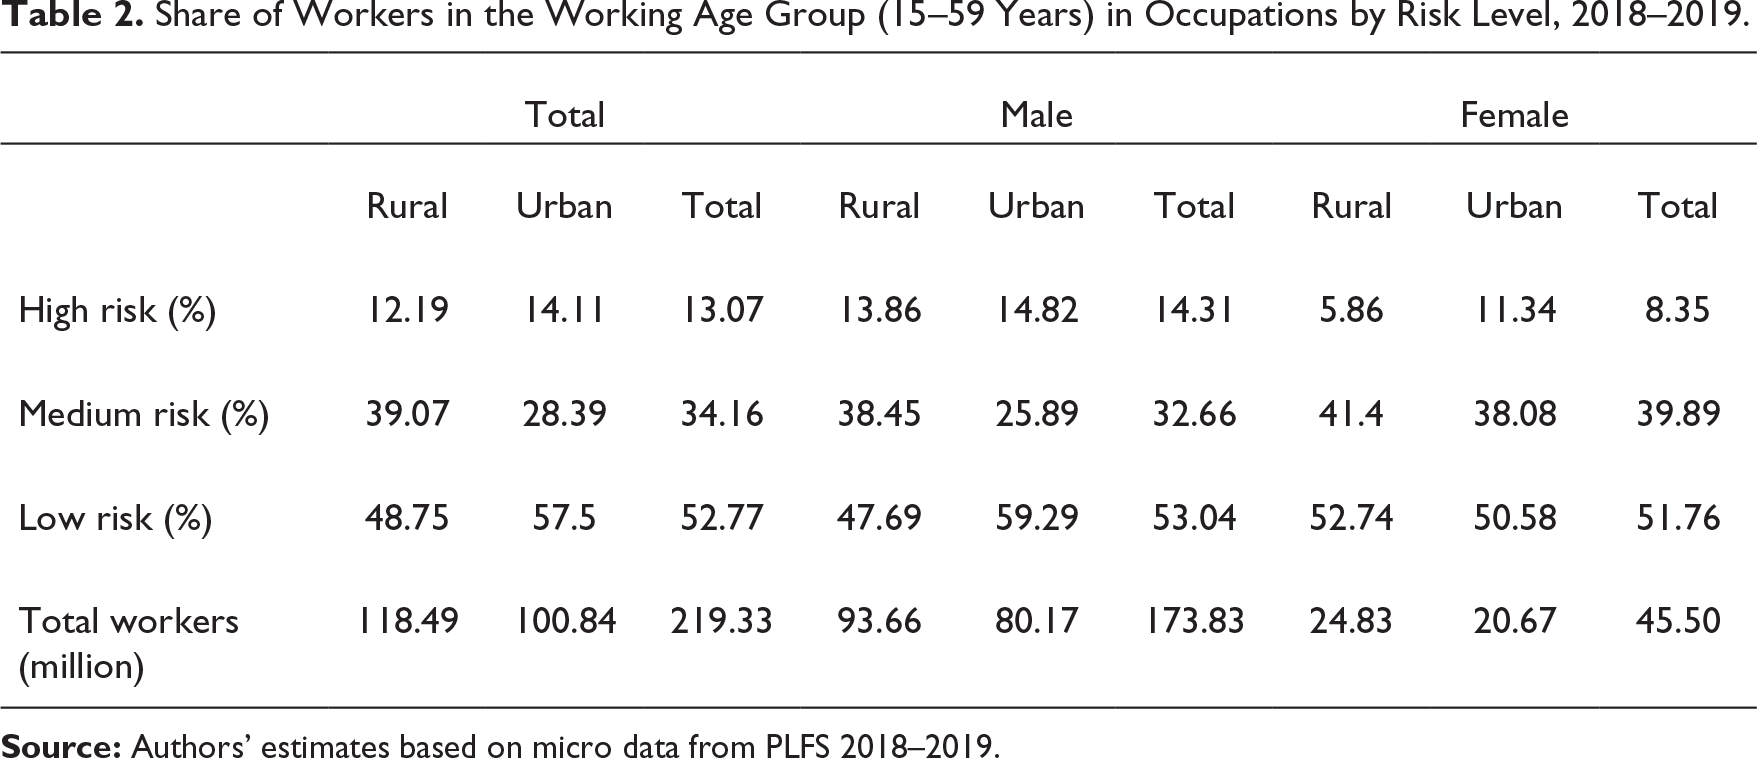
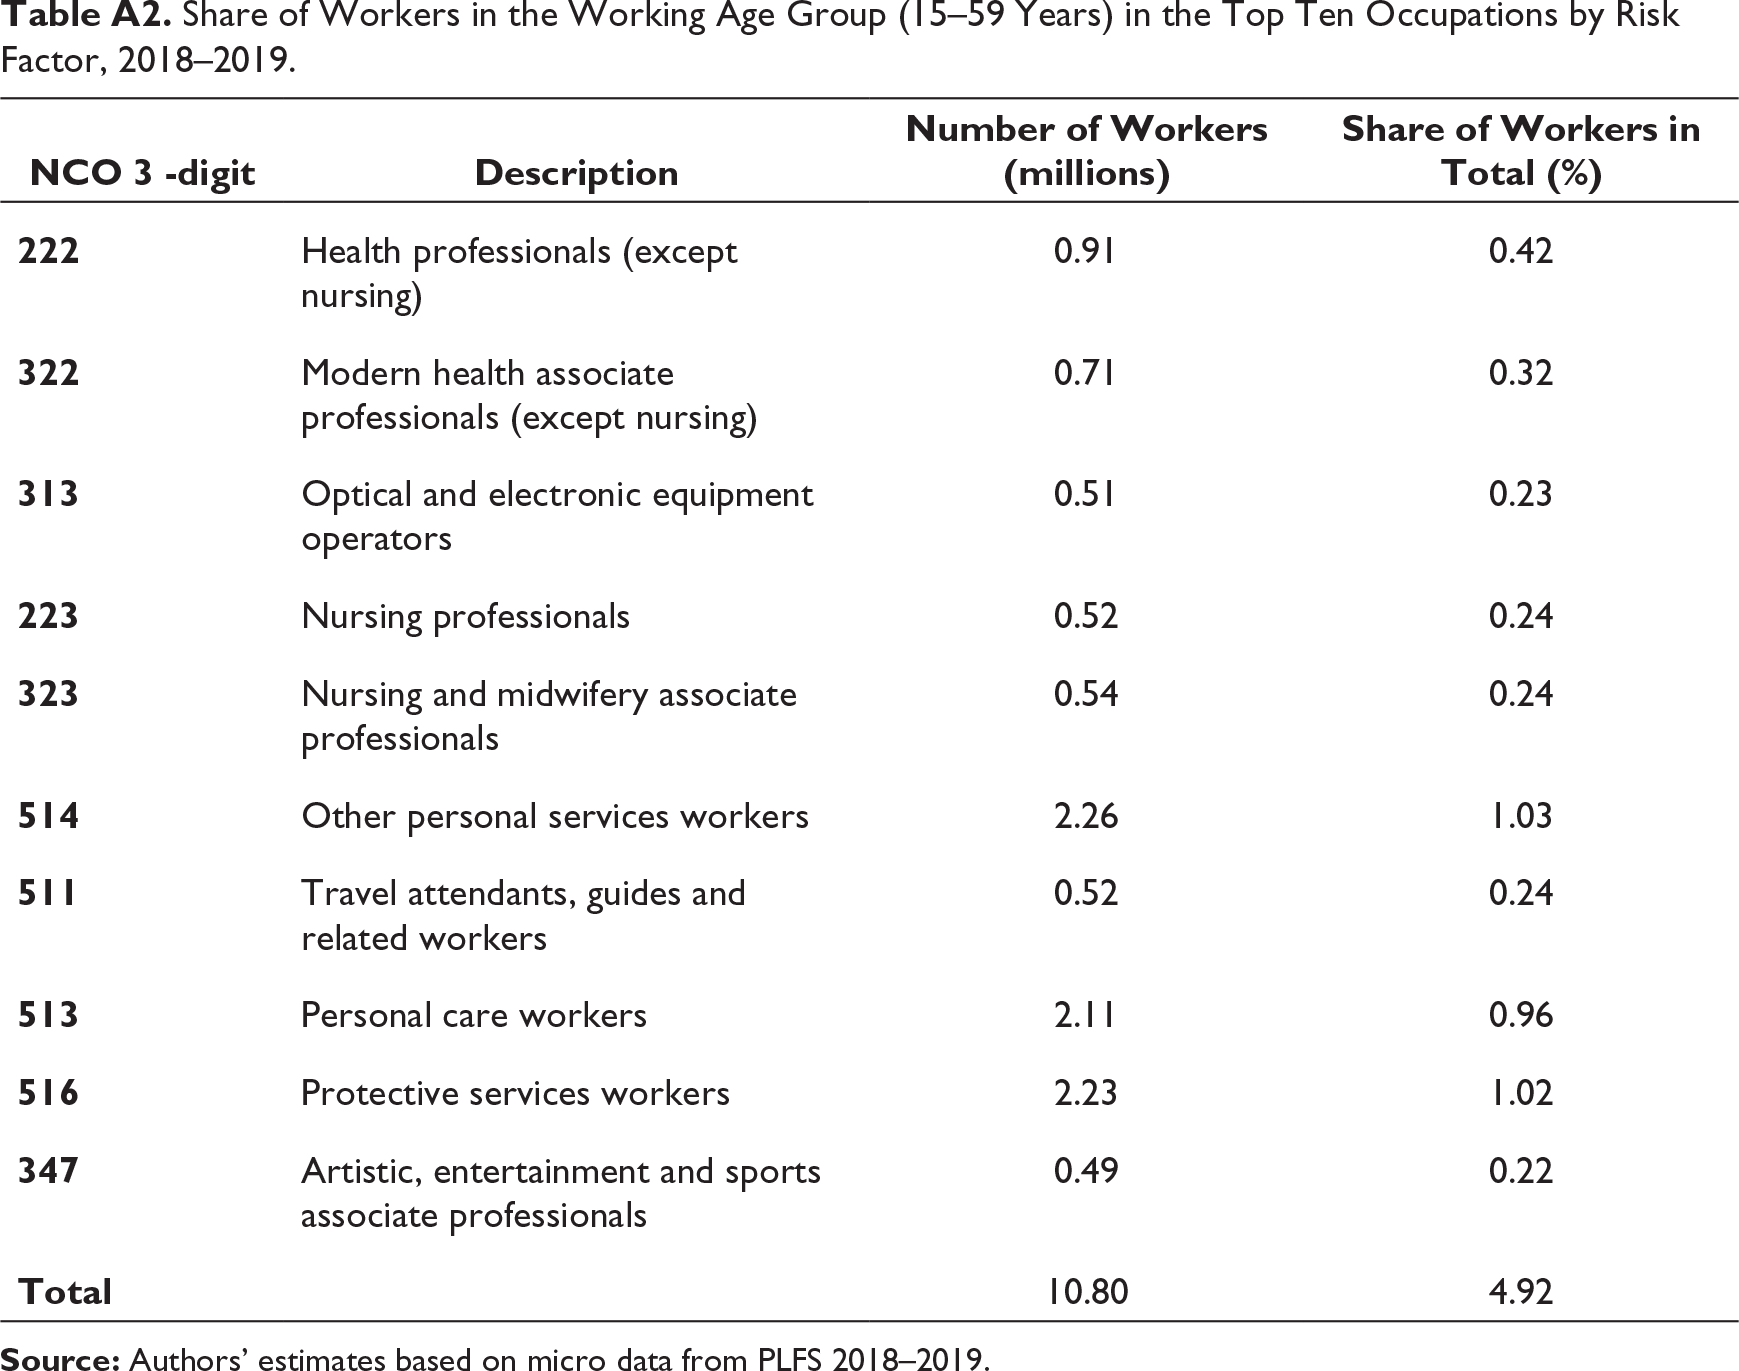
The ten most risky occupations employ 10.8 million workers comprising more than 5% of the non-farm workers (see Table A2) and none of these occupations fall in the WFH category of occupations. Health personnel and protective service workers which include police officers also belong to the essential services. Travel attendants and personal service workers such as barbers do not come under essential services and are also not able to perform their jobs at home. Hence, their services are suspended in view of social distancing making them vulnerable to a voluntary lockdown-like situation.
Distribution of Workers in the Working Age Group (15–59 Years) by Feasibility to WFH and Risk Level of Their Occupation Across Sectors, 2018–2019.
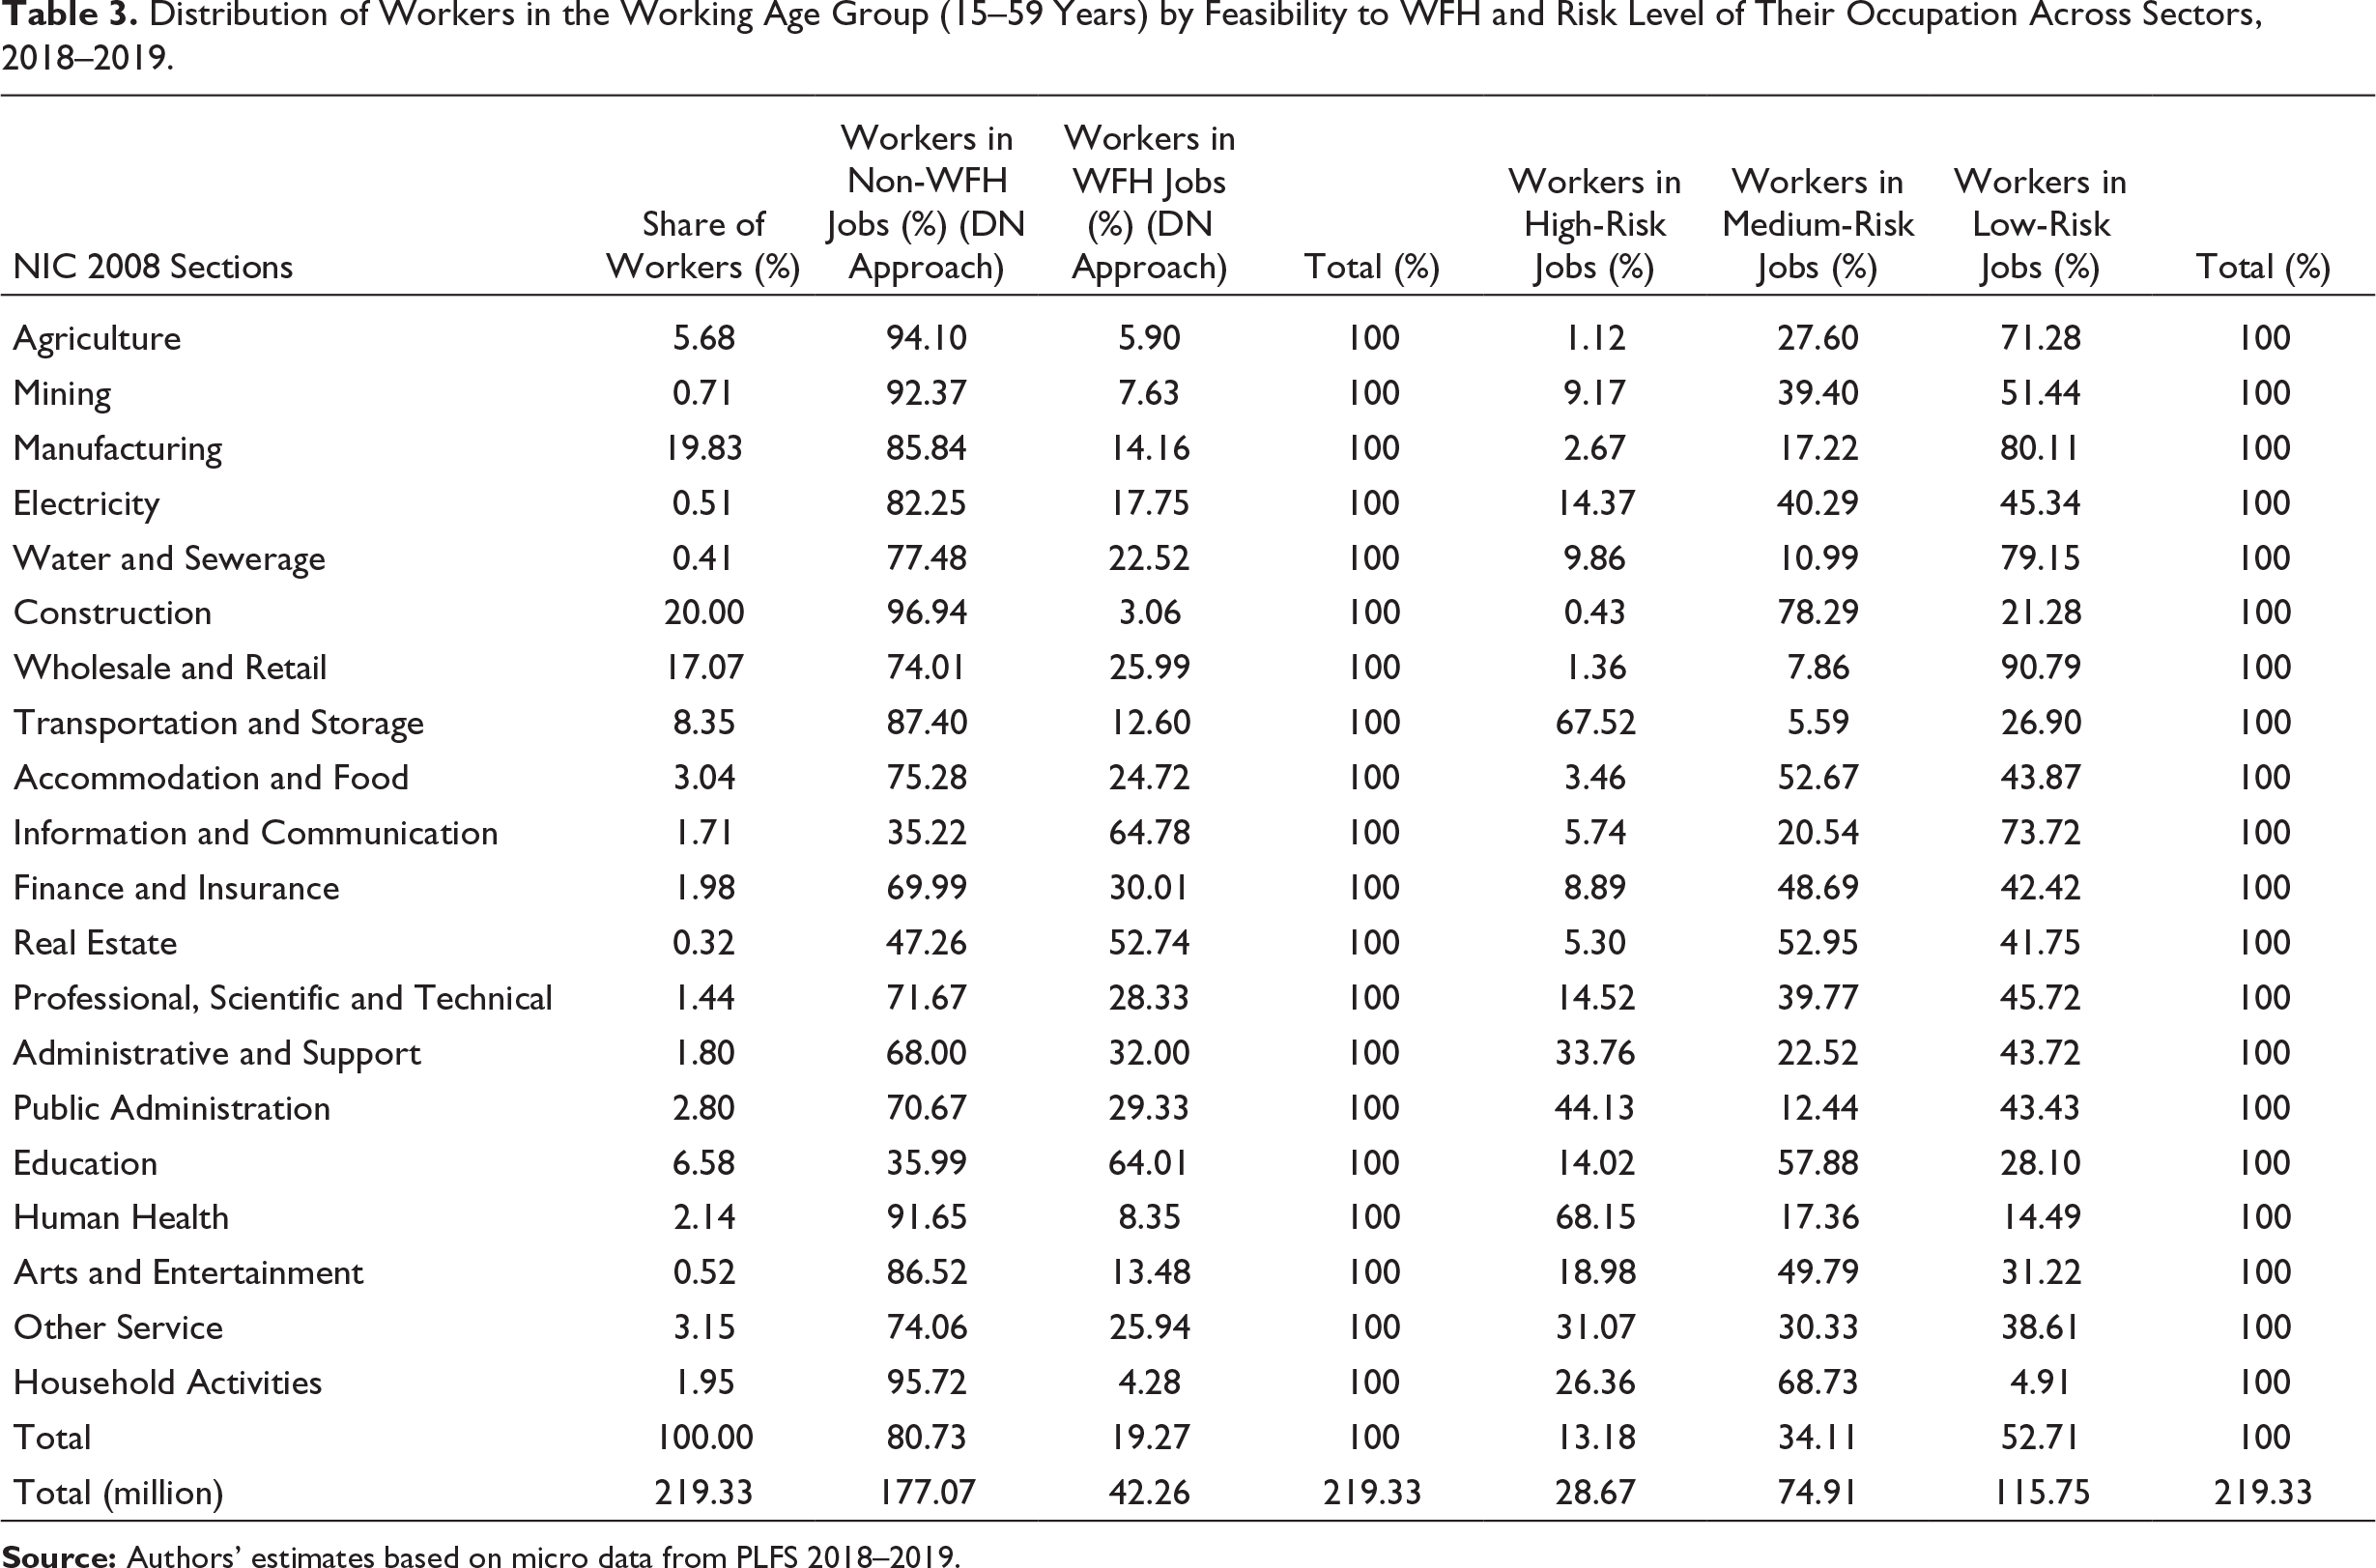
Three stark work environments emerge from Table 3. The first one is the safest work environment with a large share of workers employed in low-risk and WFH jobs. The information and communication sector is one such sector, where 65% workers can work from their homes and 74% of them also perform low-risk activities. In the education sector, most of the workers perform medium-risk jobs followed by low-risk jobs and can WFH also. The requirement to make interaction and work with close proximity to students may increase the risk factor of jobs in this sector. However, with remote learning most of the workers in this sector can shift to the low-risk category. The second work environment consists of low-risk jobs that cannot be performed remotely. The sectors that fall in this category are manufacturing, water and sewerage and wholesale and retail. Only the essential services that fall under these sectors can function in a lockdown-like situation since most of the workers in these sectors need to go on site to work. This makes these workers vulnerable not only to health risk but also to a voluntary lockdown. The third category of the work environment consists of jobs that are at high risk and cannot be done from home. Such sectors are transport and storage, public administration and human health. These sectors are also essential to keep the society running in the situation of a lockdown.
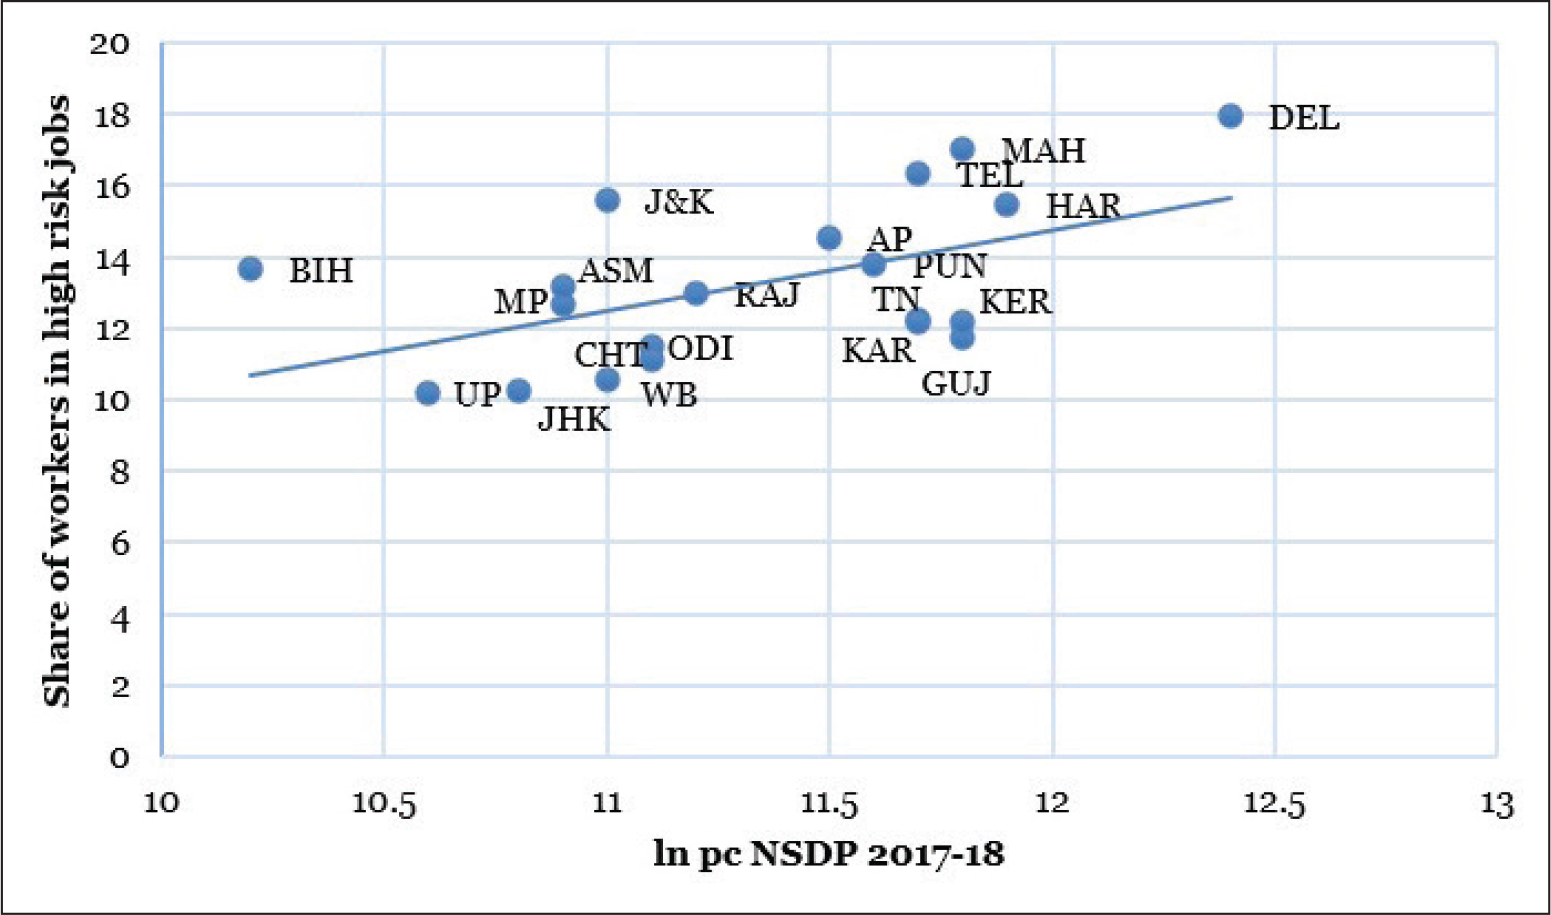
In the current situation, one might be interested in understanding whether regions which are better off in terms of economic activity and per capita income are also centre of high-risk jobs or not? Especially, when, in the current scenario, the worst-hit regions by coronavirus are the centres of the economic activity. A larger share of workers in high-risk jobs in these regions can make matters worse even when the lockdown is revoked. Using per capita state domestic product as a proxy for the economic activity, Figure 3 suggests that the share of workers in high-risk jobs in a state tends to bear a positive relation with its per capita net state domestic product. Figure 3 shows the position of the states in terms of risks faced by them while opening up.
This sub-section provides the policymakers a tool to understand the risks faced by the workers and in turn by the economy during the lockdown as well as during the process of opening up of the economy.
Vulnerable Workers in Labour Market
We use the indicators suggested by ILO (2009) to measure the vulnerable workers in the labour market. First set of workers are part of below poverty-line households. In India, the recent poverty-line estimates based on NSSO data for 2011–2012 are provided by Rangarajan Committee Report (Government of India, 2014). They show that in 2011–2012, the poverty rate was 22% for India. Since there are no official estimates of poverty after that, we use the bottom two deciles of households by their monthly per capita expenditure to identify below poverty-line households. 20 Based on this criterion, we find that 32% (38.5 million) of rural and 10% (10.6 million) of urban workers can be categorised as vulnerable and not part of the decent employment.
Moreover, in order to practice social distancing, these workers are likely to be out of work (among these workers only 8% in rural and 11% in urban areas can WFH) with their household most affected. Their chances of getting employment will also be gloomy in the succeeding slowdown. A further look into the economic activities done by these vulnerable workers reflects that in rural areas, they largely work as casual workers (47%), followed by self-employed (35%) and lastly waged and salaried workers (18%). In the urban areas, the situation is slightly better with 36% self-employed, 33% waged and salaried and 31% of casual workers. Also, among the vulnerable workers engaged in waged and salaried activities, 94(95)% of rural (urban) earn below ₹15,000 per month of salary, which is a threshold below which worker should be mandatorily eligible for social security benefits if the size of the firm in which they are employed is above 20 workers. 21 Only 17(18)% of rural (urban) vulnerable wage and salaried workers are part of enterprises above 20 workers. A cursory look highlights that majority of these vulnerable workers are engaged in economic activities outside the purview of social security benefits. Balde et al. (2020) in their study for Sub Saharan Africa found using real time data that informal workers are the hardest hit by pandemic in terms of job loss and reduction in earnings. Coming to whether they (wage and salaried vulnerable workers) actually receive any type of social security benefit (such as provident fund, pension, gratuity, maternity or health benefits) from their employer or not, we find that only 19% (1.34 million) in rural and 16% (0.54 million) in urban give the answer in affirmative. In addition, 13% (0.93 million) in rural and 10% (0.35 million) in urban areas are not aware, whether they will receive or are eligible for such benefits.
Interestingly, out of the 38.5(10.6) million vulnerable workers in rural (urban) areas, only 1.34 (0.54) million receive any type of social security benefit, that is, only 3–5% of these workers. Rest more than 95% of vulnerable workers do not have any cover for them during the situations such as lockdown or slowdown and recession. Their households are most vulnerable to the shocks in the labour market. In the current scenario, some of the direct policy interventions such as reduction in the deductions for Employee Provident Fund (EPF) for employees and employers from 12% to 10% would only benefit to a miniscule of these vulnerable workers (3–5%).On the other hand, increase in the allocation of Mahatma Gandhi National Rural Employment Scheme (MGNREGS) would surely benefit the casual workers and part of other workers who would be forced to work as casual labour in the rural areas. For urban vulnerable workers, no such direct schemes are announced which has been one of the triggers for worker’s mobility from urban to rural areas. 22
Another important safety net, which can reduce the impact of a voluntary lockdown for waged and salaried workers can be availability of paid leaves. In the PLFS, we do not have information on how many paid leaves a worker can take, but we can identify whether or not worker is at least eligible for such leaves. As compared to the overall incidence of the paid leave eligibility of 43 (48)% in rural (urban) areas, among the vulnerable waged and salaried workers, it is just 26(20)%. Further, only 16 (13)% of vulnerable wage and salaried workers in rural (urban) areas have any type of written contract with their employers.
After closely observing the characteristics of the vulnerable group of workers, we can say that majority of them do not even qualify for any type of social security net, but even those who qualify for such benefits do not have it, either due to informal nature of employment, avoidance or evasion by the employers or in some cases even the workers do not want to be part of the formal contracts in order to take higher earnings in the current period at home.
This study attempts to provide a timely analysis of the labour market with a focus on identifying the effect of COVID-19 pandemic induced lockdown and the subsequent slowdown. Using the PLFS 2018–2019, we identify various groups of workers in the labour market who would be largely unaffected, those who would be exposed to higher risk (especially in the wake of social distancing) and those who would be the most vulnerable set of workers in the current scenario. The key takeaways are as follows.
First, in the aftermath of the lockdown and with social distancing being the norm, the possibility of working from home or remote locations will be one of the most desired traits of the workers. We identify the WFH occupations and find that they employ less than 20% of the workers. Women have higher share than men in such occupations and they are largely concentrated in urban areas. We also find that some occupations are riskier than others in terms of exposure to human interaction. Almost half of the labour force is employed in high-risk and medium-risk occupations. Depending on the composition of workers by the risk level of their jobs, certain industries are more affected than others. Lastly, we identify the vulnerable group of workers as per the definition of ILO (2009) for the Indian labour market. Using the bottom two deciles as proxy for poor households, we find that 32% of rural and 10% of urban non-farm workers can be categorised as vulnerable, with no decent work. Most of them are either self-employed or casual workers and largely without any social protection.
The analysis in this paper provides a set of imperative results in the wake of COVID-19. It highlights very large inequalities in access to work from home jobs. It is pertinent to gauge the magnitude of workforce and the occupational structure of an industry by the feasibility of the jobs to be done at home, the associated risk level and vulnerability. This will enable the preparation of informed policy decisions that can facilitate workers to go back to work in a safe environment. Further, with the sudden need of working from home, digital transformation is also grabbing the attention of policymakers and academicians. To stand the unprecedented times, businesses are building technology and also developing the necessary human resources. Thus, it may suggest that work from home is here to stay as businesses might never go back to the old methods.23 This study, by identifying the demographics of workers who can and who cannot work from home, intends to provide inputs for the Indian policymakers to create focused and finer policies to reduce the negative impacts of COVID-19. It attempts to start a dialogue and discussion to design and implement labour market policies that utilise the strengths of the current labour market as well as is aware of the Achilles heel in the current scenario.
Appendix A
WFH Measure
Following are the attributes used by Dingel and Neiman (2020) from O-NET to create the WFH measure:
These attributes are defined on an important scale defined between 1 and 5 and a level scale defined between 0 and 7. Keeping in line with the literature and for the sake of consistency with other attributes that are also defined on a 1– 5 range, only importance scale is used here. The attributes are as follows:
Performing general physical activities Handling and moving objects Controlling machines and processes Operating vehicles, mechanised devices, or equipment Performing for or working directly with the public Repairing and maintaining mechanical equipment Repairing and maintaining electronic equipment Inspecting equipment, structures or material
The attributes under work context are provided as weighted average of the context category (1–5) and its corresponding percentage of respondents. The final number varies between 1 and 5.
Electronic mail Deal with physically aggressive people Outdoors, exposed to weather Outdoors, under cover Wear common protective or safety equipment such as safety shoes, glasses, gloves, hearing protection, hard hats or life jackets Wear specialised protective or safety equipment such as breathing apparatus, safety harness, full protection suits or radiation protection Exposed to disease or infections Exposed to minor burns, cuts, bites, or stings Spend time walking and running
The additional attributes added by Yasenov (2020) are as follows:
Very hot or cold temperatures Exposed to contaminants Cramped work spaces Exposed to radiation Exposed to high places Exposed to hazardous conditions Exposed to hazardous equipment Spend time climbing ladders, scaffolds, or poles Spend time kneeling, crouching, stooping, or crawling Spend time using your hands to handle, control, or feel objects, tools, or controls Responsible for others’ health and safety
Occupations are identified based on whether they have a high requirement of these attributes for which the threshold is mostly 4 and above. For all of them, a higher value indicates less potential for the work to be done at home except for electronic mail which represents the frequency of using electronic mail. Therefore, for this reverse value is used, that is, the threshold is 2 and less. The possibility of working from home is ruled out for an occupation if any of the aforementioned is true.
District-wise Share of WFH Workers Using DN Approach in Rural Areas, 2018–2019.
District-wise Share of WFH Workers Using DN Approach in Urban Areas, 2018–2019.
Distribution of Workers in WFH Occupations by Age Group, 2018–2019.
Share of Workers in the Working Age Group (15–59 Years) in the Top Ten Occupations by Risk Factor, 2018–2019.
Footnotes
Declaration of Conflicting Interests
Funding
The authors received no financial support for the research, authorship and/or publication of this article.