
Abstract
The productive sectors—agriculture, industry and services—are pillars of growth and enablers to the dream of India’s US$ 5 trillion economic target. The collective growth and contribution of these productive sectors have exhibited dynamic patterns in the history of Indian economy attracting attention of researchers and policy makers. The investigation of the growth trajectory of these productive sectors aligning with US$ 5 trillion GDP objective becomes more important at the challenging time of unprecedented COVID-19 pandemic and subsequent nation-wide lockdown in the economy. This study investigates the economy’s and sectoral growth trajectory considering the disruption caused by pandemic and answers the pertinent question: ‘Will India attain its dream of US$ 5 trillion economy, if yes, when and how?’ The results of empirical analyses reveal that India will join US$ 5 trillion club by 2027–2028, 3 years later than the original target of 2024–2025. This growth trajectory requires that the productive sectors be bolstered consistently by reforms and stimulus and thereby they exhibit recovery post-COVID-19.
Introduction
The Prime Minister of India has laid down a visionary target of making India a US$ 5 trillion economy by 2024–2025 (Ministry of Finance, 2019). It has stimulated debate and discussion among economists and policymakers to seek for the roadmaps to attain this optimistic economic goal. This discussion garners more significance given the current domestic and global economic slowdown coupled with domestic price instability, US–China trade war and more importantly prevailing pandemic (COVID-19). These unprecedented economic and medical challenges have adversely impacted the production, employment and global trade. Amid such global and domestic challenges, the questions arise: ‘Will India attain its dream of US$ 5 trillion economy, if yes, when?’ and ‘What should be done to propel Indian economy to US$ 5 trillion GDP club?’
The GDP of an economy is contributed by diverse economic activities broadly classified into three productive sectors—agriculture, industry and services—that govern GDP and its growth. With varying shares and growth patterns, the productive sectors impact GDP and its growth over a period of time. Historically, there has been a strong association between growth of dominant sectors (services and industry) with overall economic growth. Growth in a particular sector results in overall economic growth while increasing its contribution to the GDP. Emergence of COVID-19 pandemic has adversely impacted almost all the sectors from both supply and demand sides, dragging the overall growth number to its possibly unprecedented low level. Government of India has announced reforms and stimulus packages to address these macroeconomic setbacks. However, they are primarily considered a redresser more for supply shock than for demand shock which India is facing at present. A counterargument to this comes from J. B. Say’s eponymous law: ‘Supply creates its own demand’ (Segura & Braun, 2004). Stimulus and resultant growth in a certain productive sector are expected to create demand in the economy at large and lift-up the overall economic growth trajectory.
We attempt to empirically diagnose the composition, growth patterns and associated dynamics of the productive sectors and their anticipated contributions to meet the ambitious objective of US$ 5 trillion GDP from the current level of US$ 2.9 trillion in 2019–2020. In this direction, the following sections discuss the data considered for the analyses, scope, objectives, analyses and results of our study.
Data, Scope and Assumptions
This study explores the GDP growth patterns only from the broad perspective of growth of three productive sectors (agriculture, industry and services). It is a tenable assumption that these sectors largely encapsulate all the internal or external economic factors and activities, and thereby reflect their effects on Indian economy. To this end, the historical data of sectoral GVA and GDP have been sourced from the Economic Survey of India 2019–2020 (Ministry of Finance, 2020). The annual time series of sectoral GVA and GDP spans from 1950–1951 to 2019–2020 reflecting seasoned 70 years’ data.
The GVA and GDP data are available at factor cost (2004–2005 series) from 1950–1951 to 2011–2012; whereas, post this period, the data are available at basic prices (2011–2012 series). However, our analysis is largely unaffected by this heterogeneity in data measurement due to consideration of relative (year-over-year) growth in lieu of absolute values of GVA and GDP series. The sectoral contribution is available for GVA, not for GDP. However, the close concurrence of growth rates of GVA and GDP—the central pillar of our analyses—allows us to interchangeably use GVA and GDP as proxies for one another. This implies that sectoral GVA contributions and growth rates reflect sectoral GDP contributions and growth rates.
The available GDP data are reported in ‘crore rupees’, and to analyse this in terms of USD to align with the objective GDP figure (US$ 5 trillion), an appropriate currency exchange rate is considered. The exchange rate in early 2020 has spiked to about 75 rupees a dollar from 2019 average of about 70 rupees a dollar (Internal Revenue Services-US, n.d.). Fitch Solutions has projected an exchange rate of 77 rupees a dollar for 2020 given the ongoing global risk-off sentiment and likely steep monetary easing owing to COVID-19 impact on the economy (ET, 2020a). It is assumed that the future exchange rate will hover around the currently considered exchange rate of Rs. 77 per US$, with certain fluctuations due to global uncertainty. 1 Since the US$ 5 trillion GDP objective is given in nominal terms, we chose to perform the analyses in nominal terms to maintain consistency with the objective. 2
With these data, scope and assumptions, we present the specific objectives of our study in the following section.
Objectives
To analyse the growth patterns of productive sectors and economy at large and, thereby, postulate the sectoral growth rates to attain the US$ 5 trillion objective, we have made the following attempts for our empirical analyses:
Growth trajectory for US$ 5 trillion: estimation of overall growth rates and timeline. Analyses of sectoral and GDP growth patterns. Sectoral growth trajectory for US$ 5 trillion GDP.
At the onset, we analysed the overall GDP growth rate required to attain US$ 5 trillion along with impact of COVID-19 pandemic. In the second objective, the historical growth patterns and contributions of three productive sectors—agriculture, industry and services—are ascertained. This has helped us explore the growth trajectory of each productive sector in third objective. The following section elaborates the analyses and results for each of the above objectives.
Analyses and Results
Using the sectoral GVA and GDP data in nominal forms and applying the appropriate mathematical and statistical approaches, we analysed the dynamics and growth patterns of all the three productive sectors. Further, these individual growth patterns are linked to the US$ 5 trillion GDP objective. The following sections detail the exercise, objectively. The analyses are performed at a granular (annual) level and have been aggregated and summarised to decadal level for brevity.
Growth Trajectory for US$ 5 Trillion GDP
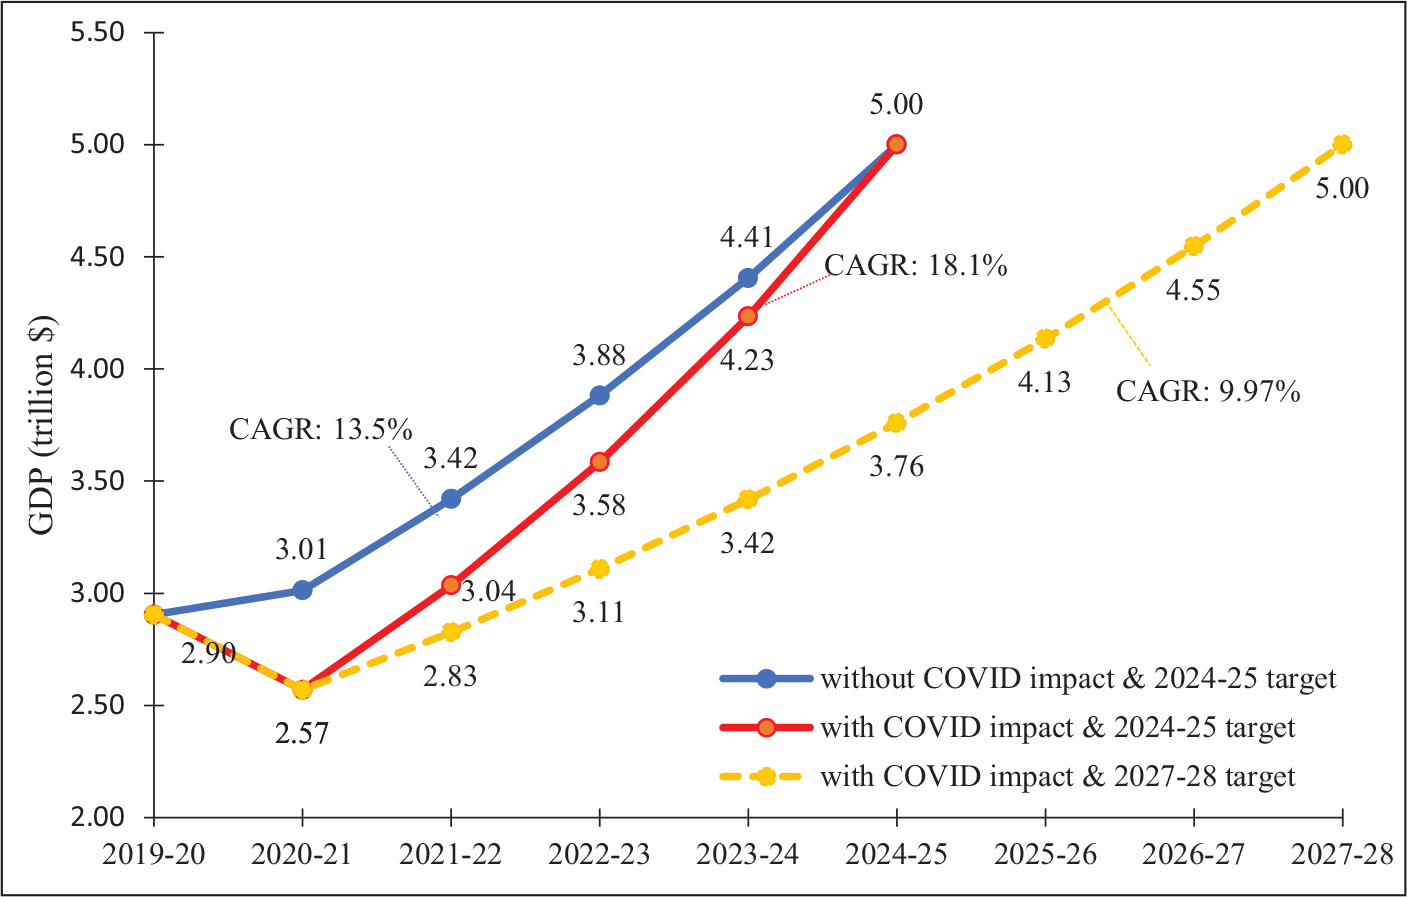
The latest estimate of GDP for the current 2019–2020 year and exchange rate of 70.39 rupees per dollar (average exchange rate of 2019–2020) yield US$ 2.9 trillion GDP that has to touch US$ 5 trillion level by 2024–2025 (i.e., within 5 years). This implies exchange rate adjusted compound annual growth rate (CAGR) of about 13.5% which is close to Sharma’s (2019) estimate of 12% and NITI Aayog’s projection of 11.5% (India Today, 2020). However, this must be heeded that this estimation of desired growth rate (CAGR) to attain the GDP objective is devoid of COVID-19 impact. In fact, the ambitious target of US$ 5 trillion GDP was originally set during pre-COVID-19 scenario without considering pandemic consequences that nation is facing today. The onslaught of COVID-19 pandemic followed by national lockdown starting in the first quarter of 2020 in India has made India’s US$ 5 trillion GDP target a surreal. Global uncertainty, disrupted trade and spiking exchange rate from 70.39 to 77 rupees per dollar swell the impossibility to achieve this target.
Amid the macroeconomic shocks and uncertainties, many national and international institutions and rating agencies have been releasing revised GDP growth forecast for the year 2020–2021. S&P and Fitch Solutions have projected India’s GDP growth rate for 2020–2021 as –5% (ET, 2020b, 2020c). The World Bank maintained –3.2% growth outlook for Indian economy for 2020–2021 (The World Bank, 2020). In contrast, Moody’s Investors Services and International Monetary Fund posited non-negative growth numbers of 0% and 1.9% for the current financial year (ET, 2020b; IMF, 2020). In the press conference on 22-May-2020, RBI postulated the GDP growth in the negative territory. It further released projection of –1.5% GDP growth for 2020–2021 in its Survey of Professional Forecasters report in June 2020 (Livemint, 2020; RBI, 2020). However, most of the projections from various institutions and agencies have consensus on above 7% growth outlook in the subsequent financial year, that is, 2021–2022 owing to the fiscal and monetary stimulus and reforms announced by the government accompanied by unravelling of pent-up aggregate demand in the economy.
Incorporating the adversity in GDP growth, due to pandemic and lockdown, we considered a GDP growth rate of –3.2% for 2020–2021 relying on The World Bank’s estimate and RBI’s negative territory forecast. This growth number, while being conservative, hovers around the other negative estimates and thus is a tenable representative of all the growth projections made by different multilateral institutions and agencies. It is inevitable that subdued growth for the initial year (2020–2021) of US$ 5 trillion target trajectory (2019–2020 to 2024–2025) will either devolve the growth pressure to subsequent years or push the target year to a later period. Our estimation for the post-COVID-19 remaining period, that is, from 2021–2022 to 2024–2025 yields a CAGR of 18.1%, incorporating –3.2% GDP growth for 2020–2021. This estimate indicates that Indian economy has to grow at an annual rate of 18.1% to attain GDP target of US$ 5 trillion by 2024–2025, which looks more surreal than real. We also observed that each 1% decrease in GDP growth rate for the current shocked year 2020–2021 yields an additional burden of 0.3% in CAGR for the subsequent years of the growth trajectory. The unrealistic-looking projected growth rate of 18.1% prompted us to investigate the alternative to attain US$ 5 trillion target which is, naturally, a postponement of the target year.
In the post-COVID-19 period, the economy is expected to recover and revive as argued by multilateral institutions, rating agencies and economists including chief economic adviser of Government of India (ET, 2020d). Economists have even gone ahead and contemplated that the Indian market will emerge stronger than ever, in post-COVID-19, given the liquidity support and future demand (ET, 2020e). This revival is attributable to stimulus and reforms announced by the government for all the productive sectors. These stimulus and reforms, which may attract investment and growth in industry and services sectors, primarily include labour and IBC (insolvency and bankruptcy code) reforms, decriminalization of violation of Companies act, change in the MSME definition for broader coverage, credit guarantees, increased borrowing limits to states (from 3% to 5%) and privatization of public sector enterprises (The Indian Express, 2020). On the other hand, agriculture sector is also not left untouched by stimulus and reforms that majorly include additional budget allocation to MNREGA (i.e., Mahatma Gandhi National Rural Employment Guarantee Act), Agricultural Market Produce Committee reform, contract farming, amendment in essential commodity act and many state-level packages announcements.
However, the effectiveness of these stimulus and reforms depends on their implementation and thus remains debatable. If not a big bang, a green-shoot is expected to knock the door of the economy in the next financial year 2021–2022 replicating a V-shaped recovery to some extent. Given this, from 2021 to 2022, we postulated that economy’s productive sectors—agriculture, industry and services—will follow their respective historical growth trajectory. Thus, we considered that these productive sectors, post-COVID-19 will grow at its historical average of the last 5 years. Therefore, agriculture, industry and services are expected to grow annually at their historical average of 7.5%, 9.0% and 11.4%, respectively, that look more realistic and acceptable than 18.1% of annual growth rate, derived and discussed earlier. This consideration and associated analyses revealed that Indian economy will attain only US$ 3.8 trillion by 2024–2025 and US$ 5 trillion target by 2027–2028 with CAGR of 9.97%. This implies that COVID-19 impact has pushed India’s US$ 5 trillion dream by 3 years farther. Our analyses with different GDP forecasts for shocked year 2020–2021 reveal that any projected GDP growth rate between –5% and 4% pushes the US$ 5 trillion objective by 3 years farther. However, a higher growth rate during 2020–2021 will lower the growth burden in the following years in the growth trajectory. For the purpose of our further analyses in our study, we are adhering to a conservative –3.2% growth rate during 2020–2021. The overall results will be merely impacted by change in 2020–2021 growth projection between –5% and 4%. The discussion on GDP growth trajectory with and without COVID-19 impact (–3.2% GDP growth in 2020–2021) is visualized in Figure 1.
Figure 1 illustrates different growth trajectories for US$ 5 trillion GDP target. The blue trajectory is devoid of COVID-19 impact and ceases to exist today. The red trajectory incorporates the COVID-19 impact during 2020–2021 with a V-shape recovery in the following year with CAGR of 18.1%, which looks unrealistic to attain. Finally, with a reasonable growth projection, the orange trajectory exhibits a moderate recovery post-COVID-19 after the shock and a tenable CAGR of 9.97% post-COVID-19. This projected annual growth rate of 9.97% post-COVID-19 is close to the ones projected by RBI, Fitch Solutions, S&P and Moody’s. Thus, Indian economy will join US$ 5 trillion club by 2027–2028 with a reasonable nominal growth rate of about 9.97% per year. The subsequent analyses follow the reasonable and reliable orange-coloured growth trajectory. Further discussions elicit the composition of GDP and roadmap of sectoral growth and contributions that help GDP adhere to this trajectory, and thereby, attain US$ 5 trillion objective by 2027–2028.
Analyses of Sectoral and GDP Growth Patterns
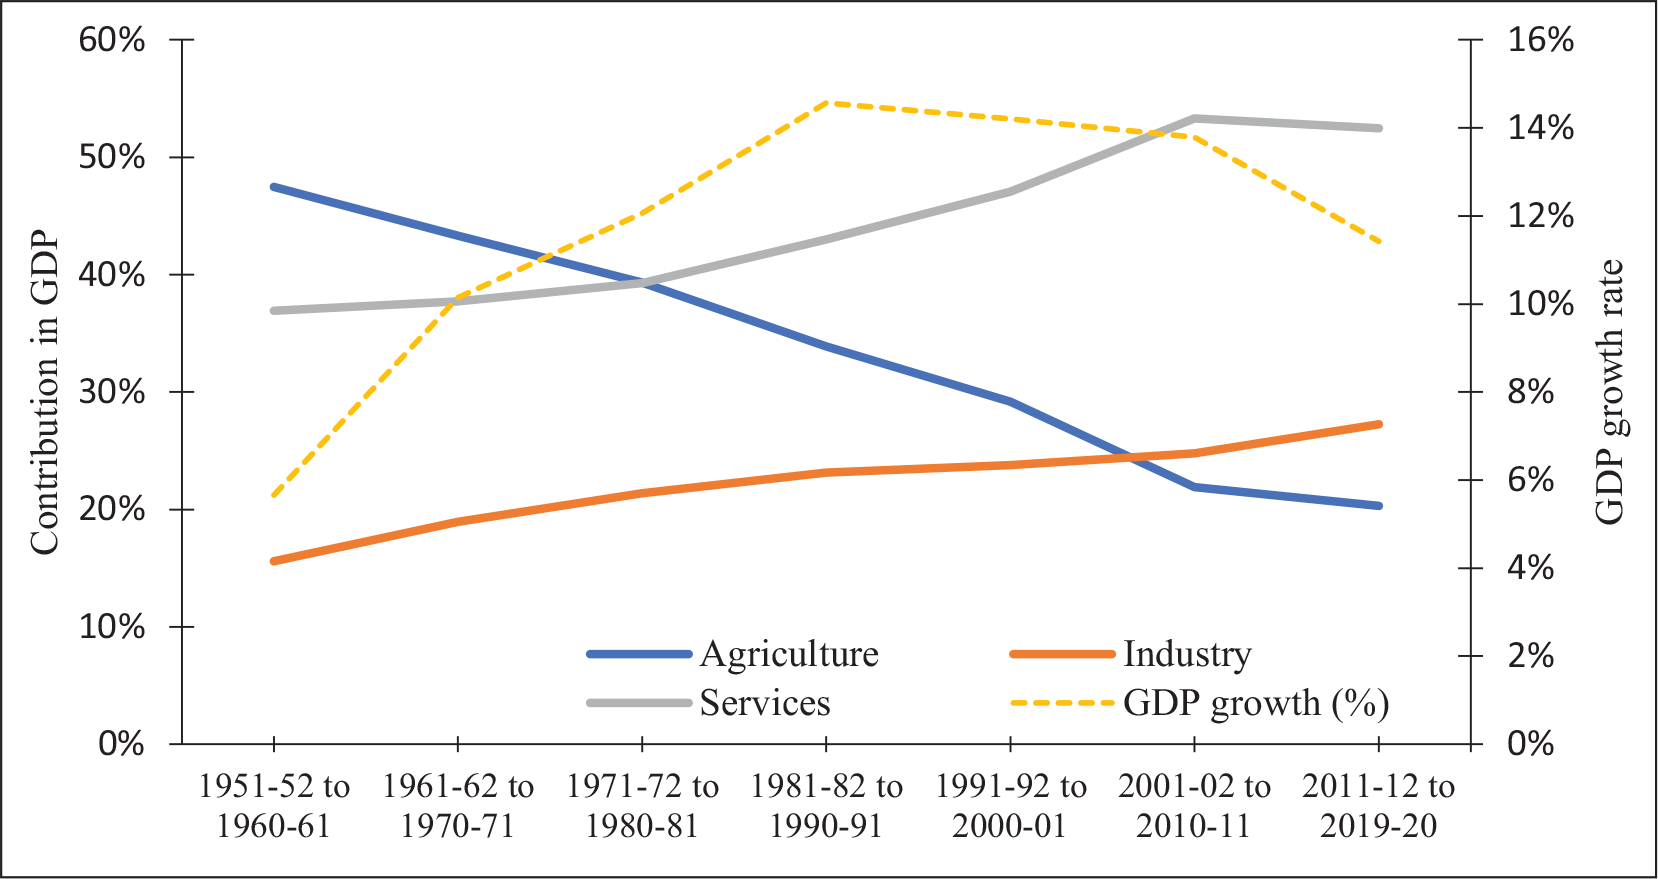
The productive sectors in India have exhibited a varying contribution to GDP over the last seven decades (1951–1952 to 2019–2020). Over the period, their contributions and growth patterns have influenced the overall growth of the economy as indicated by GDP growth as presented in Figure 2.
Following a typical growth path of a developing economy, India shifted gears from primary sector (agriculture)—a low productive sector—to relatively high productive sectors (industry and services). This is evident from Figure 2 that presents monotonically decreasing GDP share of agriculture which is compensated by the increasing shares of industry and services. However, in contrast to the conventional economic growth theory of Kuznets and Murphy (1966), India by-passed industrialization before turning into a ‘service-economy’. This is reflected by an ever-increasing GDP share of services more than that of industry. The GDP share of agriculture exhibited the highest downfall during 2001–2002 to 2010–2011, a decade when services exhibited the highest growth in share. This phenomenon of shift of GVA from primary sector to services is attributable to liberalization and burgeoning productivity, growth and employment opportunity in services sector during the first decade of twenty-first century. However, the decade after this, GDP share of services declined from 53.3% to 52.4% in the latest decade (i.e., 2011–2012 to 2019–2020), while the industry continued expanding its GDP contribution. During this period, economy experienced retarded growth which can be attributed to dawdling growth of all the three productive sectors, led by the services that enjoyed the lion’s share in GDP (Figure 3).
The individual growth of each sector contributes to the overall GDP growth depending on its share in GDP. A high growth in agriculture may not lead to a high GDP growth due to its relatively low share in GDP, whereas services, with its maximum share, influences GDP growth substantially. To find out the growth contribution of each productive sector to GDP growth, we derived the weighted growth rate of each sector using individual growth rate and share in GDP for the respective sector, as follows (OECD, 2018):

where
WGit is weighted growth rate of a sector i at a time t,
Gi,t is individual growth rate of a sector i at a time t,
Wi,t-1 is GDP share of a sector i in the previous time (t – 1), referred as weight.
Thus, weighted growth of individual sectors presents the decomposition of overall economic growth into the growth coming from the three contributing productive sectors, as follows:

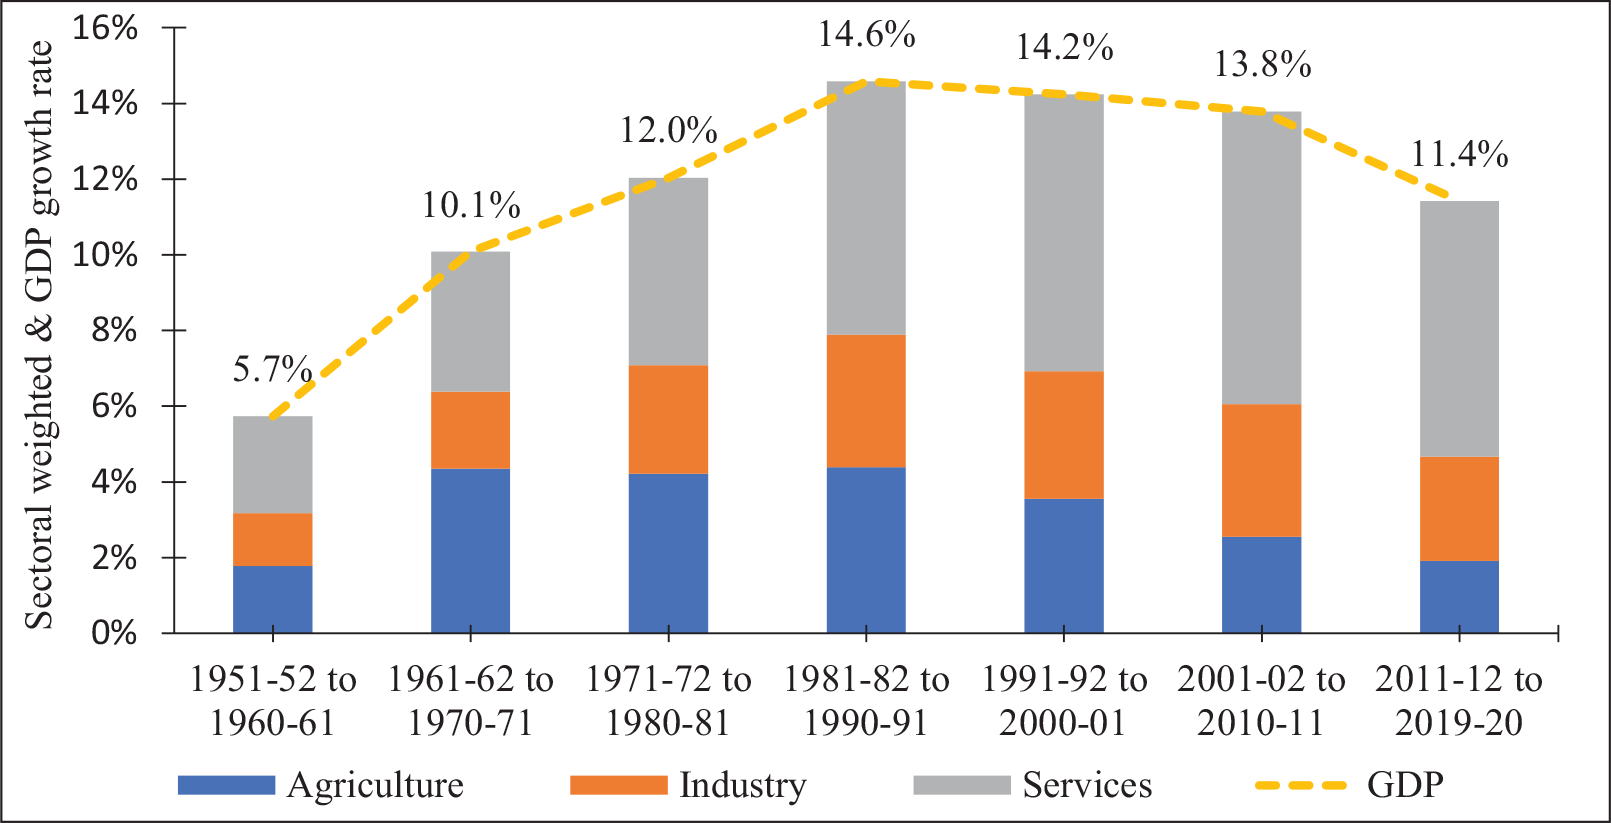
The equation above shows that the overall GDP growth rate is the sum of weighted growth rates of three productive sectors. Weight refers to the sectoral contribution to GDP in the immediate previous period of analysis. The results from growth decomposition for Indian economy for the last seven decades are summarised in Figure 3. 3
Among all the three productive sectors, services stands out to be the dominating one in terms of its individual growth and share in GDP. This results in services sector being consistently the highest growth contributor over the last seven decades in the economy. India’s services-led growth attained its peak during the 1980s followed by a monotonic decline in GDP growth thereafter. Supporting this finding, Nagaraj (1990) also found a significant structural break in GDP growth with a positive sign since 1979–1980. This implies that there is a significant upward shift of growth regime during the 1980s.
The highest GDP growth during the 1980s is attributable to industrial liberalization and the resultant industrial growth (Desai, 1999). This argument can be empirically validated by the fact that the industry also demonstrated its peak growth during the 1980s. Following this decade, GDP growth rate started to decline from 1990s onwards. The decline of GDP growth during 1990s indicates that liberalization, introduced in this decade, failed to significantly lift the economic growth, as articulated by Panagariya (2003). However, this postulated failure of liberalization during the 1990s was defended by Ahluwalia (2002). He argued that the high growth during the 1980s was unsustainable and was fuelled by high external debt that led to the macroeconomic crisis in 1991 which was addressed by economic reforms as a recourse.
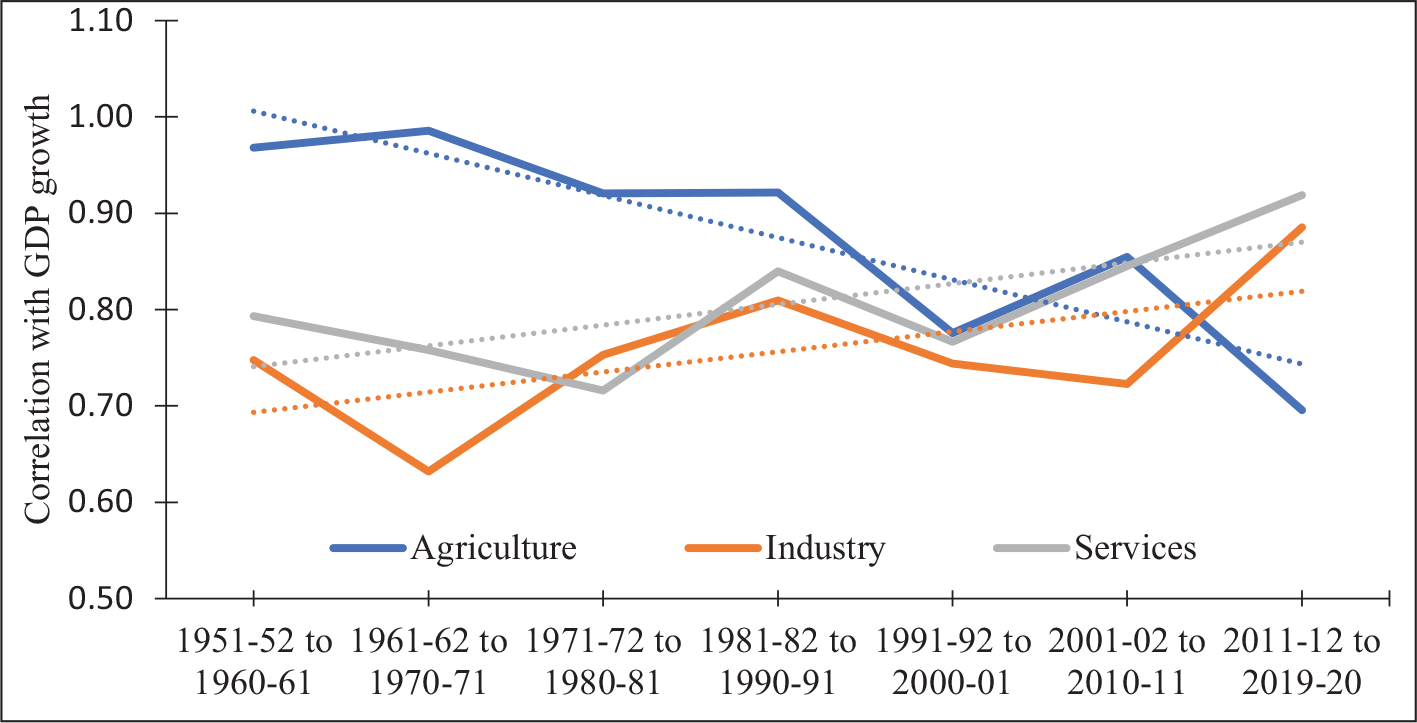
Following the declining growth trajectory from the 1990s, the most recent decade (2010s) too witnessed a relatively low services-led GDP growth rate as compared to the previous decade. The economic growth deceleration is driven by its productive sectors that also experienced significantly low growth contributing to dragging the GDP growth down. To diagnose this issue of retarding GDP growth and its association between growth of contributing sectors, we used the Pearson correlation metric. The tenability of usage of correlation in growth rate time series is supported by the fact that growth rate series is generally trend-free or time independent, and thus, are less prone to spurious analyses. For each of the seven decades, the correlations between annual growth rates of productive sectors and GDP are computed and presented in Figure 4.
Over decades, the association of growth of industry and services with GDP growth evolved to be stronger and statistically significant. 4 Agriculture sector loses its association with GDP growth due to its relatively lower share and subdued growth as compared to industry and services. Between services and industry, the former evinces its domination on its association with GDP growth owing to the higher share and growth.
Considering the duo findings observed above—dawdling GDP growth and dominance of services sector in the recent period—we extended our analysis by investigating the statistical causality between GDP and sectoral growth (Granger, 1969). 5 The results of multivariate time series models and causality tests suggest that services buttress the growth of industry and GDP, both. Given these dynamics of growth between productive sectors, their association with overall economic growth and its plummeting trajectory, the question arises: ‘How will the objective of US$ 5 trillion economy by 2024–2025, be fulfilled?’ Taking a cue from the above discussion and considering the optimistic objective of US$ 5 trillion economy, we postulate the sectoral growth rates and contributions required to attain the objective in various possible scenarios, as presented in the following section.
Sectoral Growth Trajectory for US$ 5 Trillion GDP
The preceding sections have discussed the growth trajectory of US$ 5 trillion economy (section ‘Growth Trajectory for US$ 5 Trillion GDP’) and growth dynamics between productive sectors and the overall economy (the section ‘Analyses of Sectoral and GDP Growth Patterns’). In this section, we intend to explore the GDP and sectoral growth trajectory based on various scenarios, making use of the findings from the earlier analyses and discussions.
A GDP growth rate at any given period is composition of weighted growth rates of all the productive sectors in that period, wherein, weight refers to the sectoral contribution to GDP in the immediate previous period [see Equation (2)]. Weight of a sector in a given period is computed by its share in GDP in the same period which, in turn, is computed by growth rate of that sector obtained from the immediate previous period. This implies that growth rate of a sector in a given period does not only influence the GDP growth but share of that sector also in the same period, which in turn, influences the future sectoral weighted growth and GDP growth—a synergy effect. Owing to this effect, a marginal increase in the growth rate of a dominating sector yields a higher overall economic growth in the future as compared to the one resulting from a similar increase in the growth rate of a non-dominating sector. Thus, considering the dominance and importance of services and industry sectors in Indian economy, they can be argued as the growth drivers of the economy without ignoring the contribution of other productive sectors. It is this dynamic that has to be diagnosed and understood in the context of US$ 5 trillion GDP objective.
We follow the above discussed mathematical approach for sectoral contributions, growth and their effects on overall GDP growth. With this, we intend to explore the growth trajectory of the economy and productive sectors, taking US$ 5 trillion objective into consideration. To this end, as a beginning lead for the analysis, a GDP growth rate forecast of –3.2% is considered for the COVID-19 impacted year 2020–2021, as discussed in the section ‘Growth Trajectory for US$ 5 Trillion GDP’. Post this, that is, from 2021 to 2022 onwards, a reasonable forecast for growth rate for each sector was made using historical growth patterns. This is done assuming that economy and productive sectors will revive and revert to historical average post-COVID-19 effect, given the stimulus and reforms by the government and unravelling of pent-up demand in the economy. The naive forecast that can be made is moving average of the historical data. Following this, we considered the average of the most recent five-years’ (2015–2016 to 2019–2020) growth rates as forecasts for growth rates for the respective sectors. The selection of last 5-year data for forecast is owing to its intrinsic advantages of recency and noise cancellation in data. In addition, this period of consideration for finding the historical average or forecast for sectoral growth rates addresses the issue of heterogeneity arising out of the change in the base year for GDP estimation. The 5-year historical averages of sectoral growth rates, which are considered for sectoral growth rate forecasts, are 7.5%, 9.0% and 11.4% for agriculture, industry and services, respectively.
The more complex forecasting techniques—ARIMA—also resulted in the forecasts that are largely similar to our naïve estimation of 5-year historical average. Further, these sectoral growth forecasts (5-year historical averages) are used for the analyses of GDP and sectoral growth trajectories, as presented in the following section.
Prescription of Single-Sectoral Growth Trajectory
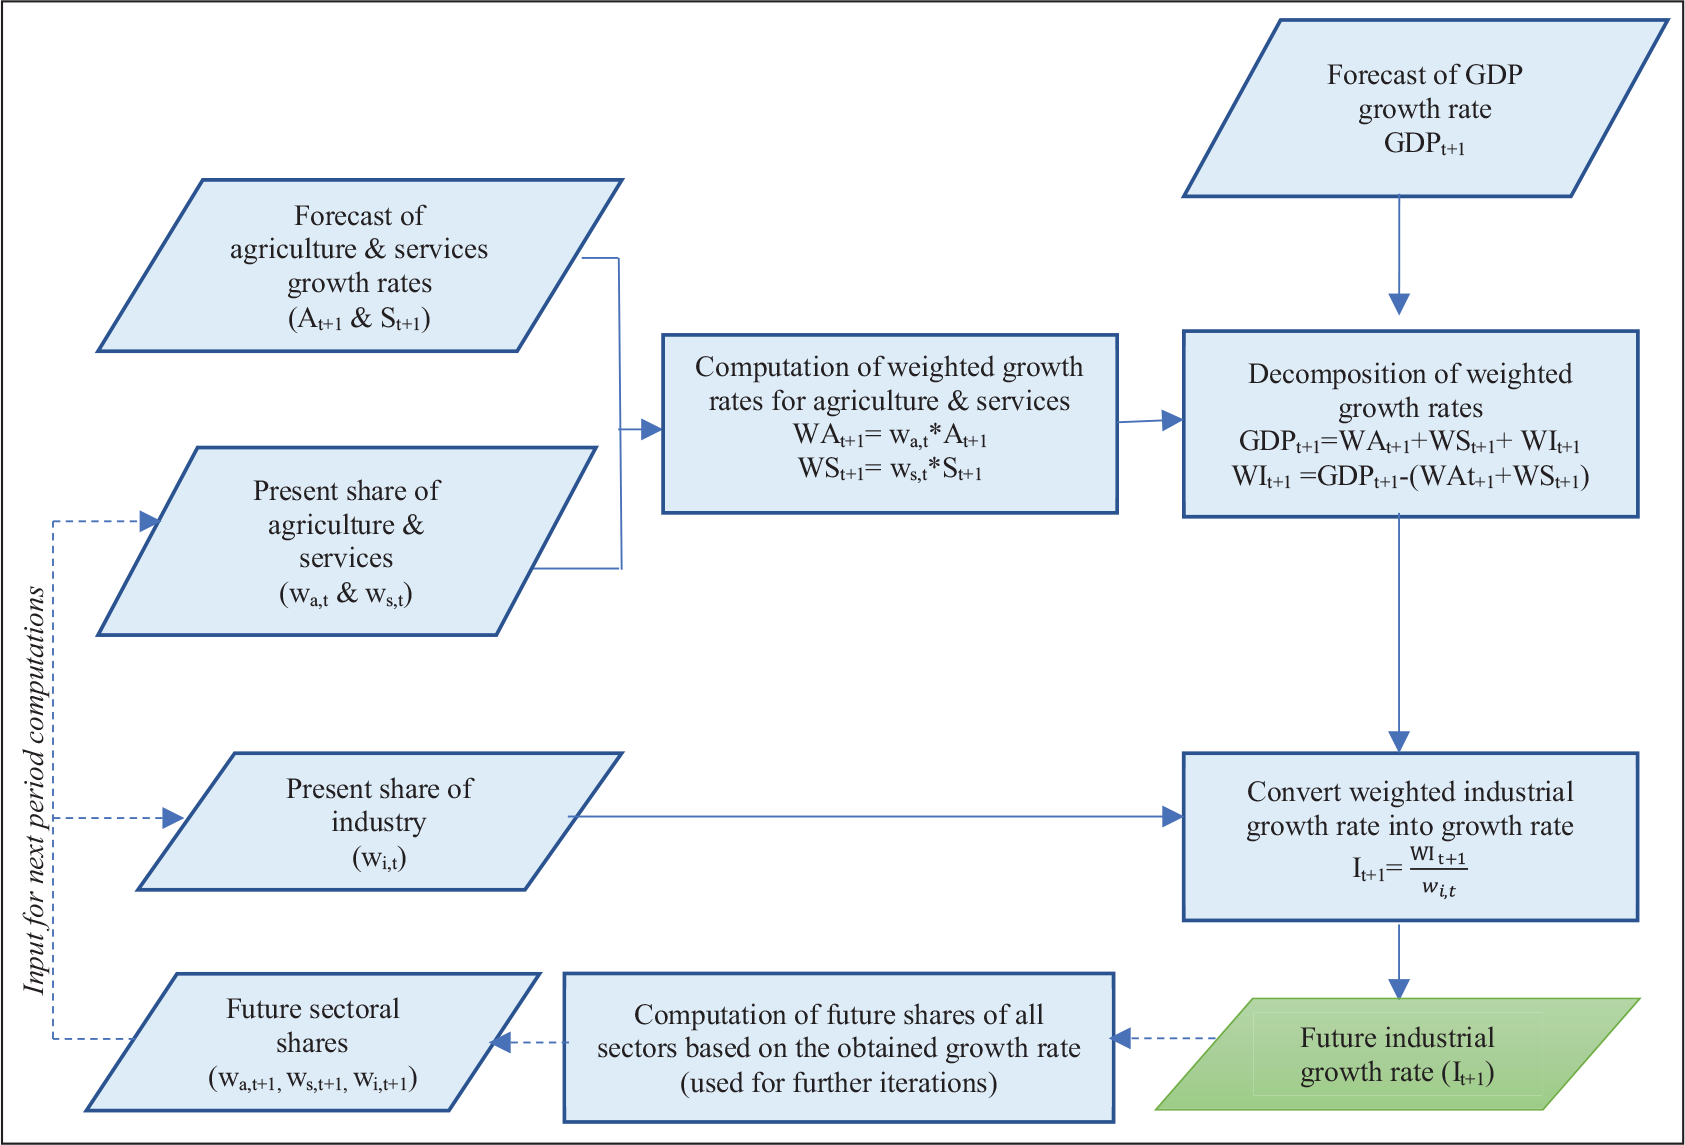
To project the growth trajectory of each sector individually, the forecasts (5-year historical averages) of growth rates of other two sectors were used in computation. The objective is to find the prescribed growth rate for a sector that is necessary to attain 9.97% (the section ‘Growth Trajectory for US$ 5 Trillion GDP’) annual GDP growth rate and US$ 5 trillion GDP by 2027–2028, given that the other sectors tread their historical growth patterns post-COVID-19. The mathematical approach of weighted growth rate and growth decomposition, as organized in Figure 5, are leveraged. The results for prescribed growth rates for industry, considering the historical growth rates of agriculture (7.5%) and services (11.4%), are summarised in Figure 6.
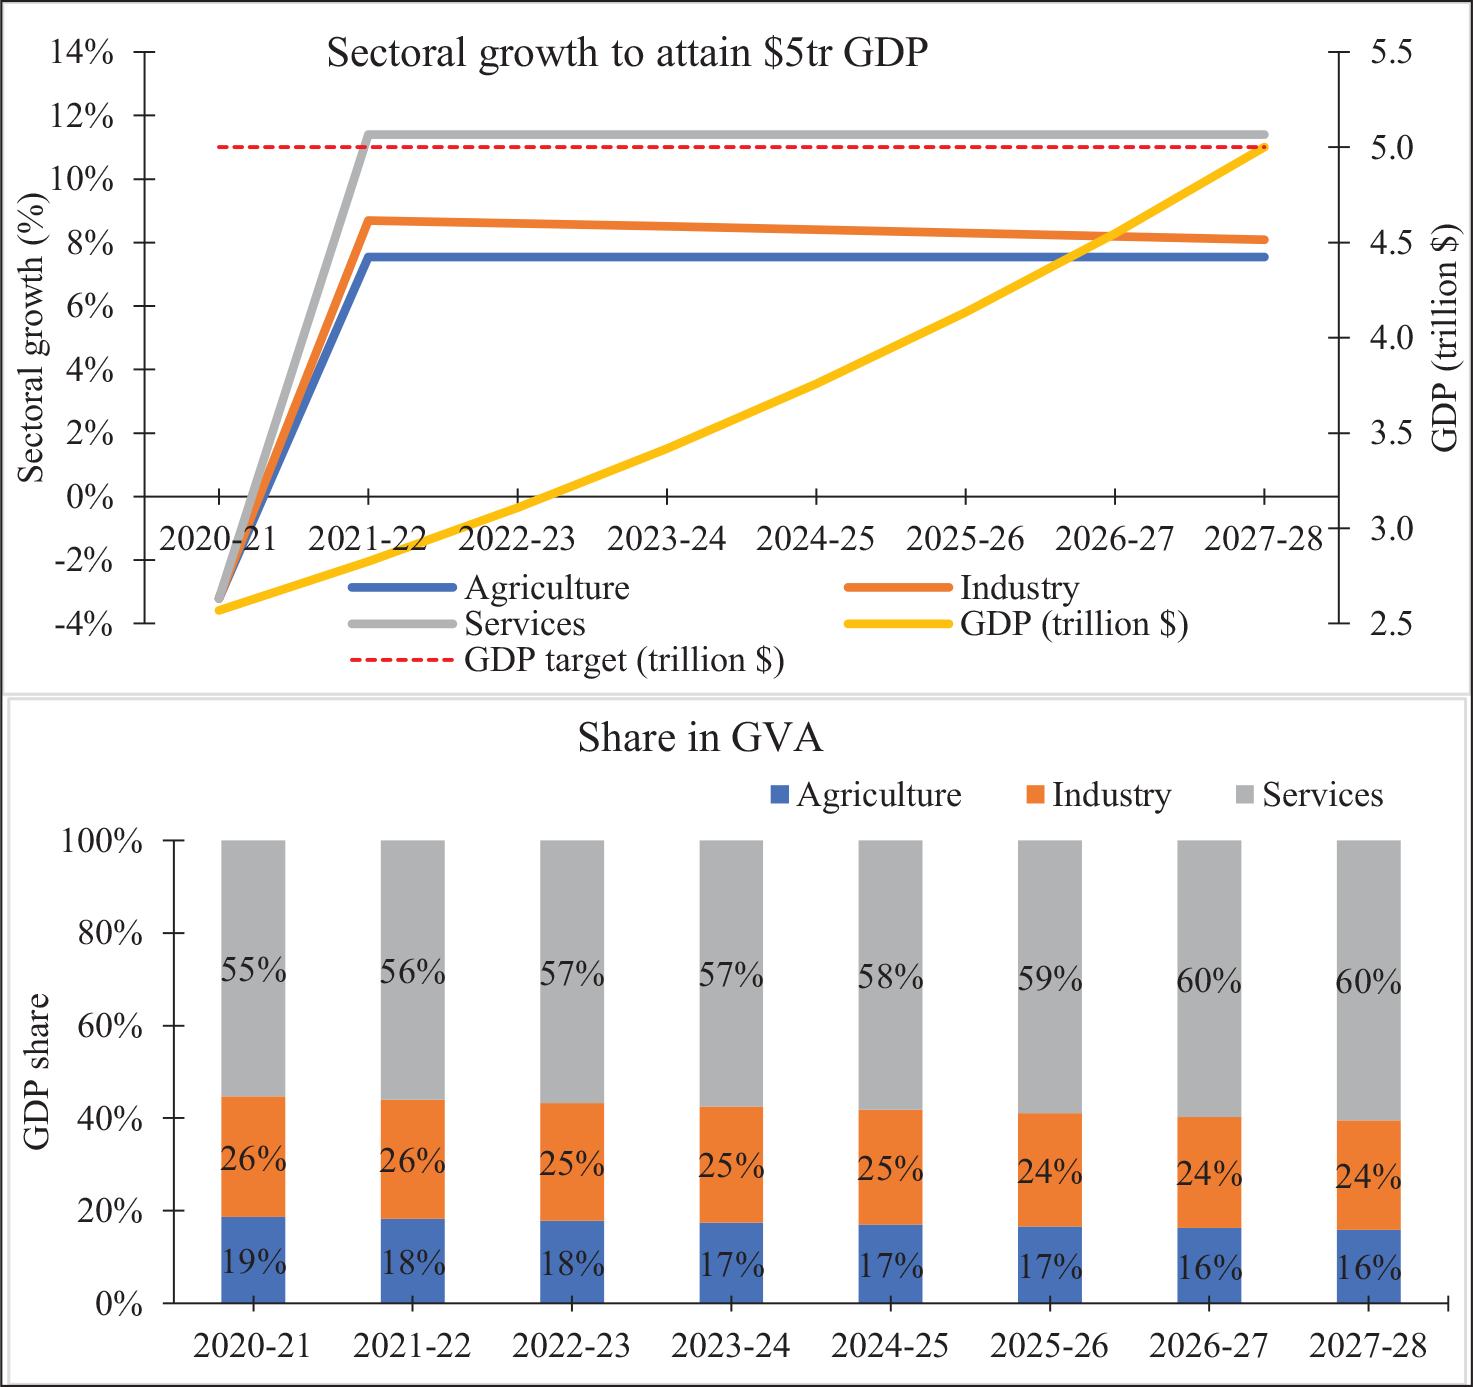
The results show that, after a downfall in 2020–2021 due to COVID-19, industry has to grow at around 8.5% a year to attain the US$ 5 trillion GDP by 2027–2028. The growth trajectory for industry has a monotonic decreasing trend over the years. The prescribed industrial growth rate at the beginning (2021–2022) of the year yields not only GDP growth, but also increased share of industry in the subsequent year. This increasing share of industry relaxes industrial growth rates required to maintain GDP growth rate of 9.97% over the years. Although, the US$ 5 trillion GDP objective is attainable with a stable industrial share in the economy, the prescribed growth rates (~8.5%) for industry is quite higher than the last 2 year’s growth rates but closure to its historical average of 9%. Furthermore, the growth rate of industry remains lower than that of services given the dominance and growth of the latter in the Indian economy. However, a significant push has been provided to domestic industries by promoting MSMEs and infrastructure, through ‘Make-in-India’ initiates (Anand et al., 2015).
To address the supply and demand shocks, the reforms and stimulus announced by the government in terms of definitional change of and credit support to MSMEs and land and labour law reforms, if effectively implemented, will act as COVID-19 vaccine to the industries and economy. This is evident by the fact that, post-COVID-19, many global manufacturing firms including Hero Motors, Teledyne and Amphenol, and Johnson and Johnson, are contemplating to shift the manufacturing facilities from China to India to overcome the supply chain constraints (Ghosh & Mukherji, 2020).
In a similar way, the above analysis is replicated for services and agriculture sectors. The results prescribe that services and agriculture sectors have to grow at about 11.2% and 6.6%, respectively. These growth trajectories for all the productive sectors, together, may fulfil the US$ 5 trillion GDP objective, yet may be challenging on pragmatic grounds given the economic and sector-specific constraints that need attention of the policymakers.
The optimistic US$ 5 trillion economic objective intends to provide stimulus in the economy while raising many pragmatic challenges to achieve it. This objective can be achieved by providing appropriate fillip to the growth of three productive sectors—agriculture, industry and services—that are drivers of the services-led Indian economy. The present structure and historical growth patterns of these sectors are expected to buttress the economic growth in the future with their varying contributions. However, our data-driven approach revealed that the growth, attained by the present GDP composition and sectoral growth patterns, is far away from the growth target required to attain the US$ 5 trillion objective. Emergence of COVID-19 impact adds to the peril and makes the US$ 5 trillion GDP target by 2024–2025 surreal, pushing it by 3 years farther. It is possible to attain this target by 2027–2028 when there is a recovery in the economy during the post-COVID-19 period, that is, from 2021 to 2022 onwards coupled with a consistent growth in productive sectors over the years. Agriculture, industry and services sectors have to recover post-COVID-19 and exhibit at least their respective five-year’s growth average of about 7.5%, 9.0% and 11.4%, respectively. This growth pattern portrays continuation of dominance of services sector’s GDP contribution. Historically, the services and industry sectors showed a high correlation with the overall GDP growth rate and need consistent stimulus for growth.
Growth retardation in any of the sectors leads to a growth pressure in other sectors with expected outlying growth number that may be away from reality, given the individual sectoral challenges. However, while all the productive sectors and their dynamics and composition are considered, a recourse can be discovered. The study presents that the productive sectors collectively can deliver viable growth rates that may put Indian economy to US$ 5 trillion club by 2027–2028, if not by 2024–2025. However, any moderate shock to any sector may be absorbed by the other sector, but adverse shock cannot be tackled and can derail the US$ 5 trillion growth trajectory. Thus, policymakers must focus on all the three sectors equally without resorting to a focus on any particular sector. Along with the individual growth of a sector, its dynamics with other sectors and its contribution to the economy are evenly important.
Our proposed mathematical framework for sectoral growth trajectory lays down the foundation to estimate the growth rates and contributions of individual sectors at any given scenario to attain the US$ 5 trillion objective. It helps the policymakers and government by measuring the distance from the current status to the objective over the years. This study focuses only on broad three productive sectors and their growth trajectories on an annual basis. Given the heterogeneity within each sector and limited timeline to meet US$ 5 trillion objective, a more granular sectoral focus with a higher frequency analysis can augment this study.