
Abstract
Objective
This study compared how numeric and configural visual displays affect reaction time (RT), accuracy, and workload during a simulated patient monitoring task.
Background
We previously showed that a configural display that maps vital sign variables in a two-dimensional space reduced RT to emergency events compared with a numerical display.
Method
Thirty participants monitored simulated patient vital signs using concurrently presented numeric and configural displays, which varied in relative position (numeric or configural on the left or right) and eccentricity (distance from the screen center) across trials. Participant RT and accuracy in identifying abnormal vital signs were measured. Participants simultaneously performed a secondary task (N-Back) to simulate multitasking, with performance assessed through RT and accuracy. Workload was measured using both pupillometry and NASA-TLX self-reports.
Results
Primary task RT and accuracy depended on emergency event. In the secondary task, positioning the configural display to the right of center and positioning close to center speeded task RT and improved accuracy. Secondary task accuracy was better at lower display eccentricity. Pupil dilation increased during emergency events, and NASA-TLX workload scores increased with greater eccentricity. NASA-TLX scores showed that participants found the task to be mentally demanding but not physically demanding.
Conclusion
Display configuration significantly affects primary and secondary task performance and NASA-TLX-measured workload. Right-positioned configural displays at low-eccentricity may better support multitasking in clinical environments.
Application
These findings highlight how spatial arrangement and eccentricity of displays influence multitasking performance and workload, informing interface designs that better support user efficiency under demanding conditions.
Keywords
Introduction
In hospital environments, clinicians must continuously monitor patients’ physiological status while managing multiple concurrent tasks. Standard patient monitors communicate patient status using the single-sensor-single-indicator (SSSI) format, presenting individual parameters such as blood pressure (BP), heart rate (HR), and blood-oxygen saturation (SpO2) as numerical values (Drews & Westenskow, 2006; Kiefer & Hoeft, 2010). While precise, this format increases visual clutter and does not support quick, integrative assessments, potentially delaying recognition of patient deterioration (Drews, 2008; Faiola et al., 2015; McDonnell et al., 2013; Tscholl et al., 2020; Webster & Weller, 2021). Auditory alarms are used in parallel to signal out-of-range physiological values but are not designed to convey detailed or integrated patient information (Drew et al., 2014). Alarms frequently exceed recommended hospital noise levels of 30–40 dB (Berglund et al., 1995), contributing to clinician workload and alarm fatigue (Lee et al., 2021). Thus, a need remains for integrative displays that align with clinicians’ real-time decision-making needs.
Theoretical Model of Patient Monitoring
Patient monitoring in the ICU can be conceptualized in a perception–cognition–action framework (“Applying Human Factors”, 2016; Hegarty, 2011). Clinicians must perceive relevant sensory inputs (e.g., auditory alarms and visual displays), integrate information into a coherent mental model of the patient’s physiological state, and take appropriate action based on that model (Doig et al., 2011). Early signs of patient deterioration often appear as subtle changes across multiple numerical parameters that require mental effort to integrate (Burns, 2000; McDonnell et al., 2013; Rich, 1999; Vicente et al., 1995). Displays that fail to highlight these trends or relationships can increase the risk of missed or delayed interventions (Buist et al., 2004; McGloin et al., 1999). Furthermore, clinicians often manage multiple patients, which requires frequent shifts of attention that can impair situational awareness and delay reaction time (RT) (Biron et al., 2009; Grundgeiger & Sanderson, 2009; Potter et al., 2005).
Configural displays, an alternative to numerical displays, integrate multiple vital signs and organize data spatially, creating a single visual representation that highlights higher-order relationships among variables (Agutter et al., 2003; Albert et al., 2007; Drews & Doig, 2014; Drews & Westenskow, 2006). These displays can reduce the mental effort required for integration and improve the speed and accuracy of patient assessments compared to numerical displays (Bauer et al., 2010; Drews & Doig, 2014; Reising & Sanderson, 2002).
Design of a Configural Vital Signs Display
Fleishman et al. (2021) extended the design of a configural display by Drews and Doig (2014), producing the display shown in Figure 1, which plotted BP (x-axis) and HR (y-axis) on a 2D graph with alarm thresholds denoted by a rectangular box (Drews & Doig, 2014; Fleishman et al., 2021). In an experiment, participants monitored patient displays for various abnormal vital signs (called “emergency events”) under three display configurations (numerical display only, configural display only, and both displays presented concurrently), while completing a secondary task to simulate multitasking (N-Back). Identification of abnormal vital signs was significantly faster when both the configural and numerical displays were present compared to when only the numerical display was shown; additionally, identification was faster but not statistically significant compared to when only the configural display was shown. Presenting both displays concurrently also triggered the fewest threshold alarms for participants to correctly identify emergency events, a statistically significant difference compared to when only the numerical or configural display was presented. The configural display. BP is plotted on the x-axis and HR is plotted on the y-axis. Alarm thresholds are denoted by a rectangular box. Fleishman et al. (2021) introduced two innovations: pre-alarm thresholds (thresholds indicating abnormal values that do not trigger an auditory alarm) denoted by the dashed-line box and color coding of the square (i.e., the patient marker) to indicate SpO2. Normal SpO2 levels (93–100%) were shown in shades of pink, while abnormally low values (below 93%) were indicated by the transition from shades of blue to purple, to mirror the color change observed in a person’s mucous membranes during the transition from oxygenation to deoxygenation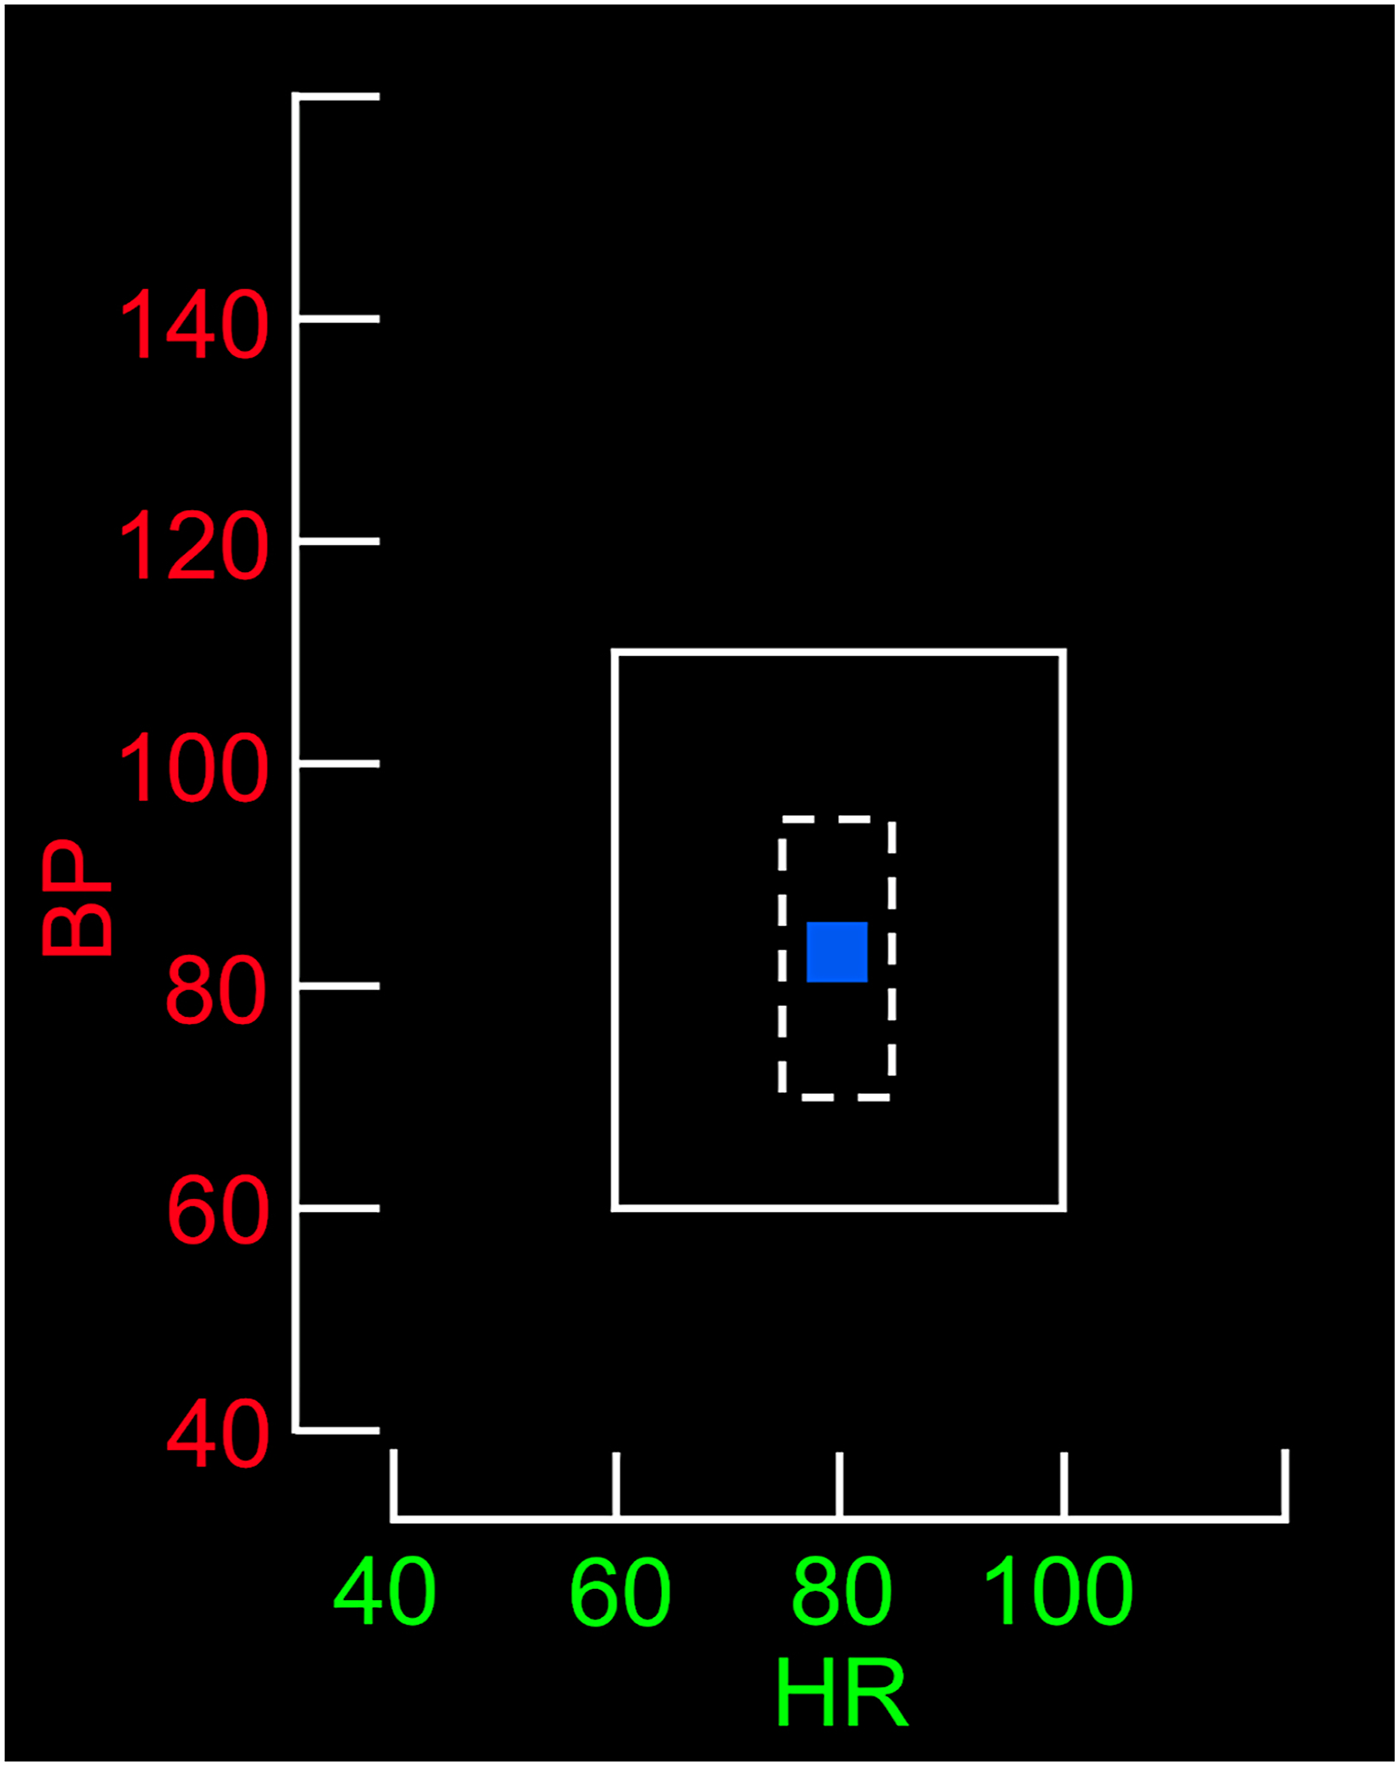
Spatial Considerations for Display Design
Display positioning can affect how quickly and easily users locate information. Visual search time increases with eccentricity from the focal point (Reis et al., 2011; Staugaard et al., 2016; Steelman et al., 2013). Grouping related items can improve integrative tasks like patient monitoring (Hegarty, 2011; Wickens & Carswell, 1995). Users tend to favor the left visual field when scanning cues such as faces or images (Everdell et al., 2007; Guo et al., 2012; Otterbring et al., 2013), reflecting both right-hemisphere dominance in spatial processing and cultural reading habits (Afsari et al., 2016; Smith et al., 2015; Verosky & Turk-Browne, 2012). Beyond these perceptual tendencies, the relative positioning of time-shared tasks (e.g., spatial and verbal tasks) engages the principle of task-hemispheric integrity, where assigning one hemisphere exclusive responsibility for the central processing and response components of each task produces a performance advantage (Wickens & Sandry, 1982).
Mental Workload
Workload refers to the physical, temporal, and environmental demands on an individual during the execution of a task utilizing a finite pool of mental resources (Longo et al., 2022). Accurately assessing workload is essential in high-demand environments where cognitive strain can impair decision making and performance (Ma et al., 2024).
Workload can be inferred from behavioral measures (e.g., RT and accuracy), physiological measures (e.g., pupil diameter), and subjective measures (e.g., self-report) (Das Chakladar & Roy, 2024; Longo et al., 2022). Combining behavioral, physiological, and subjective workload measures may enhance the reliability of conclusions regarding the overall workload imposed by different visual displays. In the current study, we used both physiological and subjective measures to evaluate workload during participants' interactions with numerical and configural displays.
Pupillometry and Workload
We used pupillometry to obtain a physiological measure (i.e., pupil diameter changes) of workload. Pupil diameter often increases in response to both gradual and sudden shifts in task difficulty (Zagermann et al., 2018). Variations in pupil dilation have reliably reflected the relationship between task difficulty and subjective measures of workload and performance (Mauriz et al., 2023). Our analyses of additional eye-tracking indicators measured in the current study (i.e., eye fixations, viewing time, and saccades) are reported in Cummins et al. (2024).
Evaluating Subjective Workload
We use the NASA-Task Load Index (NASA-TLX) to assess subjective workload, including perceived mental, physical, and temporal demands, performance, effort, and frustration levels (Hart, 2006). This measure is often used in medical research to evaluate physician workload with digital displays and assess the usability of visual technologies in surgery (e.g., Lim et al., 2022; Ramkumar et al., 2017).
Study Objectives
In the current study, we examined how the spatial configuration of patient information displays affects dual-task performance in a simulated patient monitoring situation. Participants performed a primary task (monitoring a simulated patient’s vital signs on configural and numerical displays and responding when emergencies occurred) while performing an ongoing secondary task (an N-Back working memory task to simulate multitasking). This work builds on the display design by Fleishman et al. (2021) to test how the relative location of the configural and numerical primary task displays affected participants’ performance on the two tasks, as well as their workload.
We hypothesized that (H1) screen configurations placing the configural display on the left of the secondary task display would reduce task RT, increase task accuracy, and reduce workload compared with configurations with the configural display on the right. We further hypothesized that (H2) screen configurations with displays positioned at low eccentricity would reduce primary and secondary task RT, increase accuracy, and reduce workload compared with configurations at high eccentricity.
Methods
Participants
Thirty Vanderbilt University undergraduate students ages 18 to 23 with normal or corrected to normal vision were enrolled through campuswide subject recruitment. Because the configural display contained color information, participants with self-reported color blindness were excluded. This study did not involve complex medical decision making, and participants were provided with vital sign ranges, so participants were not approved or rejected based on their prior experience with medical environments. This research complied with the American Psychological Association Code of Ethics and was approved by the Vanderbilt University Medical Center Institutional Review Board (IRB #230011). Informed consent was obtained from each participant.
Materials
Visual Display
Participants monitored the simulated patient vitals using a computer display that contained both the numerical and configural display (Figure 2). Both displays showed the same patient information in different formats. The numerical display presented physiological variables of HR, BP, and SpO2, using Arabic numerals in a 1 × 3 table. The configural display integrated the patient’s HR, BP, and SpO2 data into a two-dimensional graph. A square moved continuously across the graph, its color indicating the patient’s physiological values. When a vital sign exceeded its alarm threshold, an auditory alarm (the crisis red alarm sound from Philips monitors; Amsterdam, The Netherlands) played at approximately 60 dB for up to 5 s or until the participant identified the vital sign(s) and the direction of change. A sample experimental display, showing possible display positions and eccentricity combinations. In this screen configuration, the configural display is positioned to the left of fixation, the numerical display is positioned to the right of fixation, and the centers of both displays are at approximately 9.5°. The numeric display text underwent the same color transitions as the configural display. As a reference tool, a second table positioned at the bottom of the monitor continuously displayed the pre-alarm and alarm threshold values for these three physiological measurements. The degree markings at the top of Figure 2 have been added to show that eccentricity was measured from the display center. These markings were not present during the experiment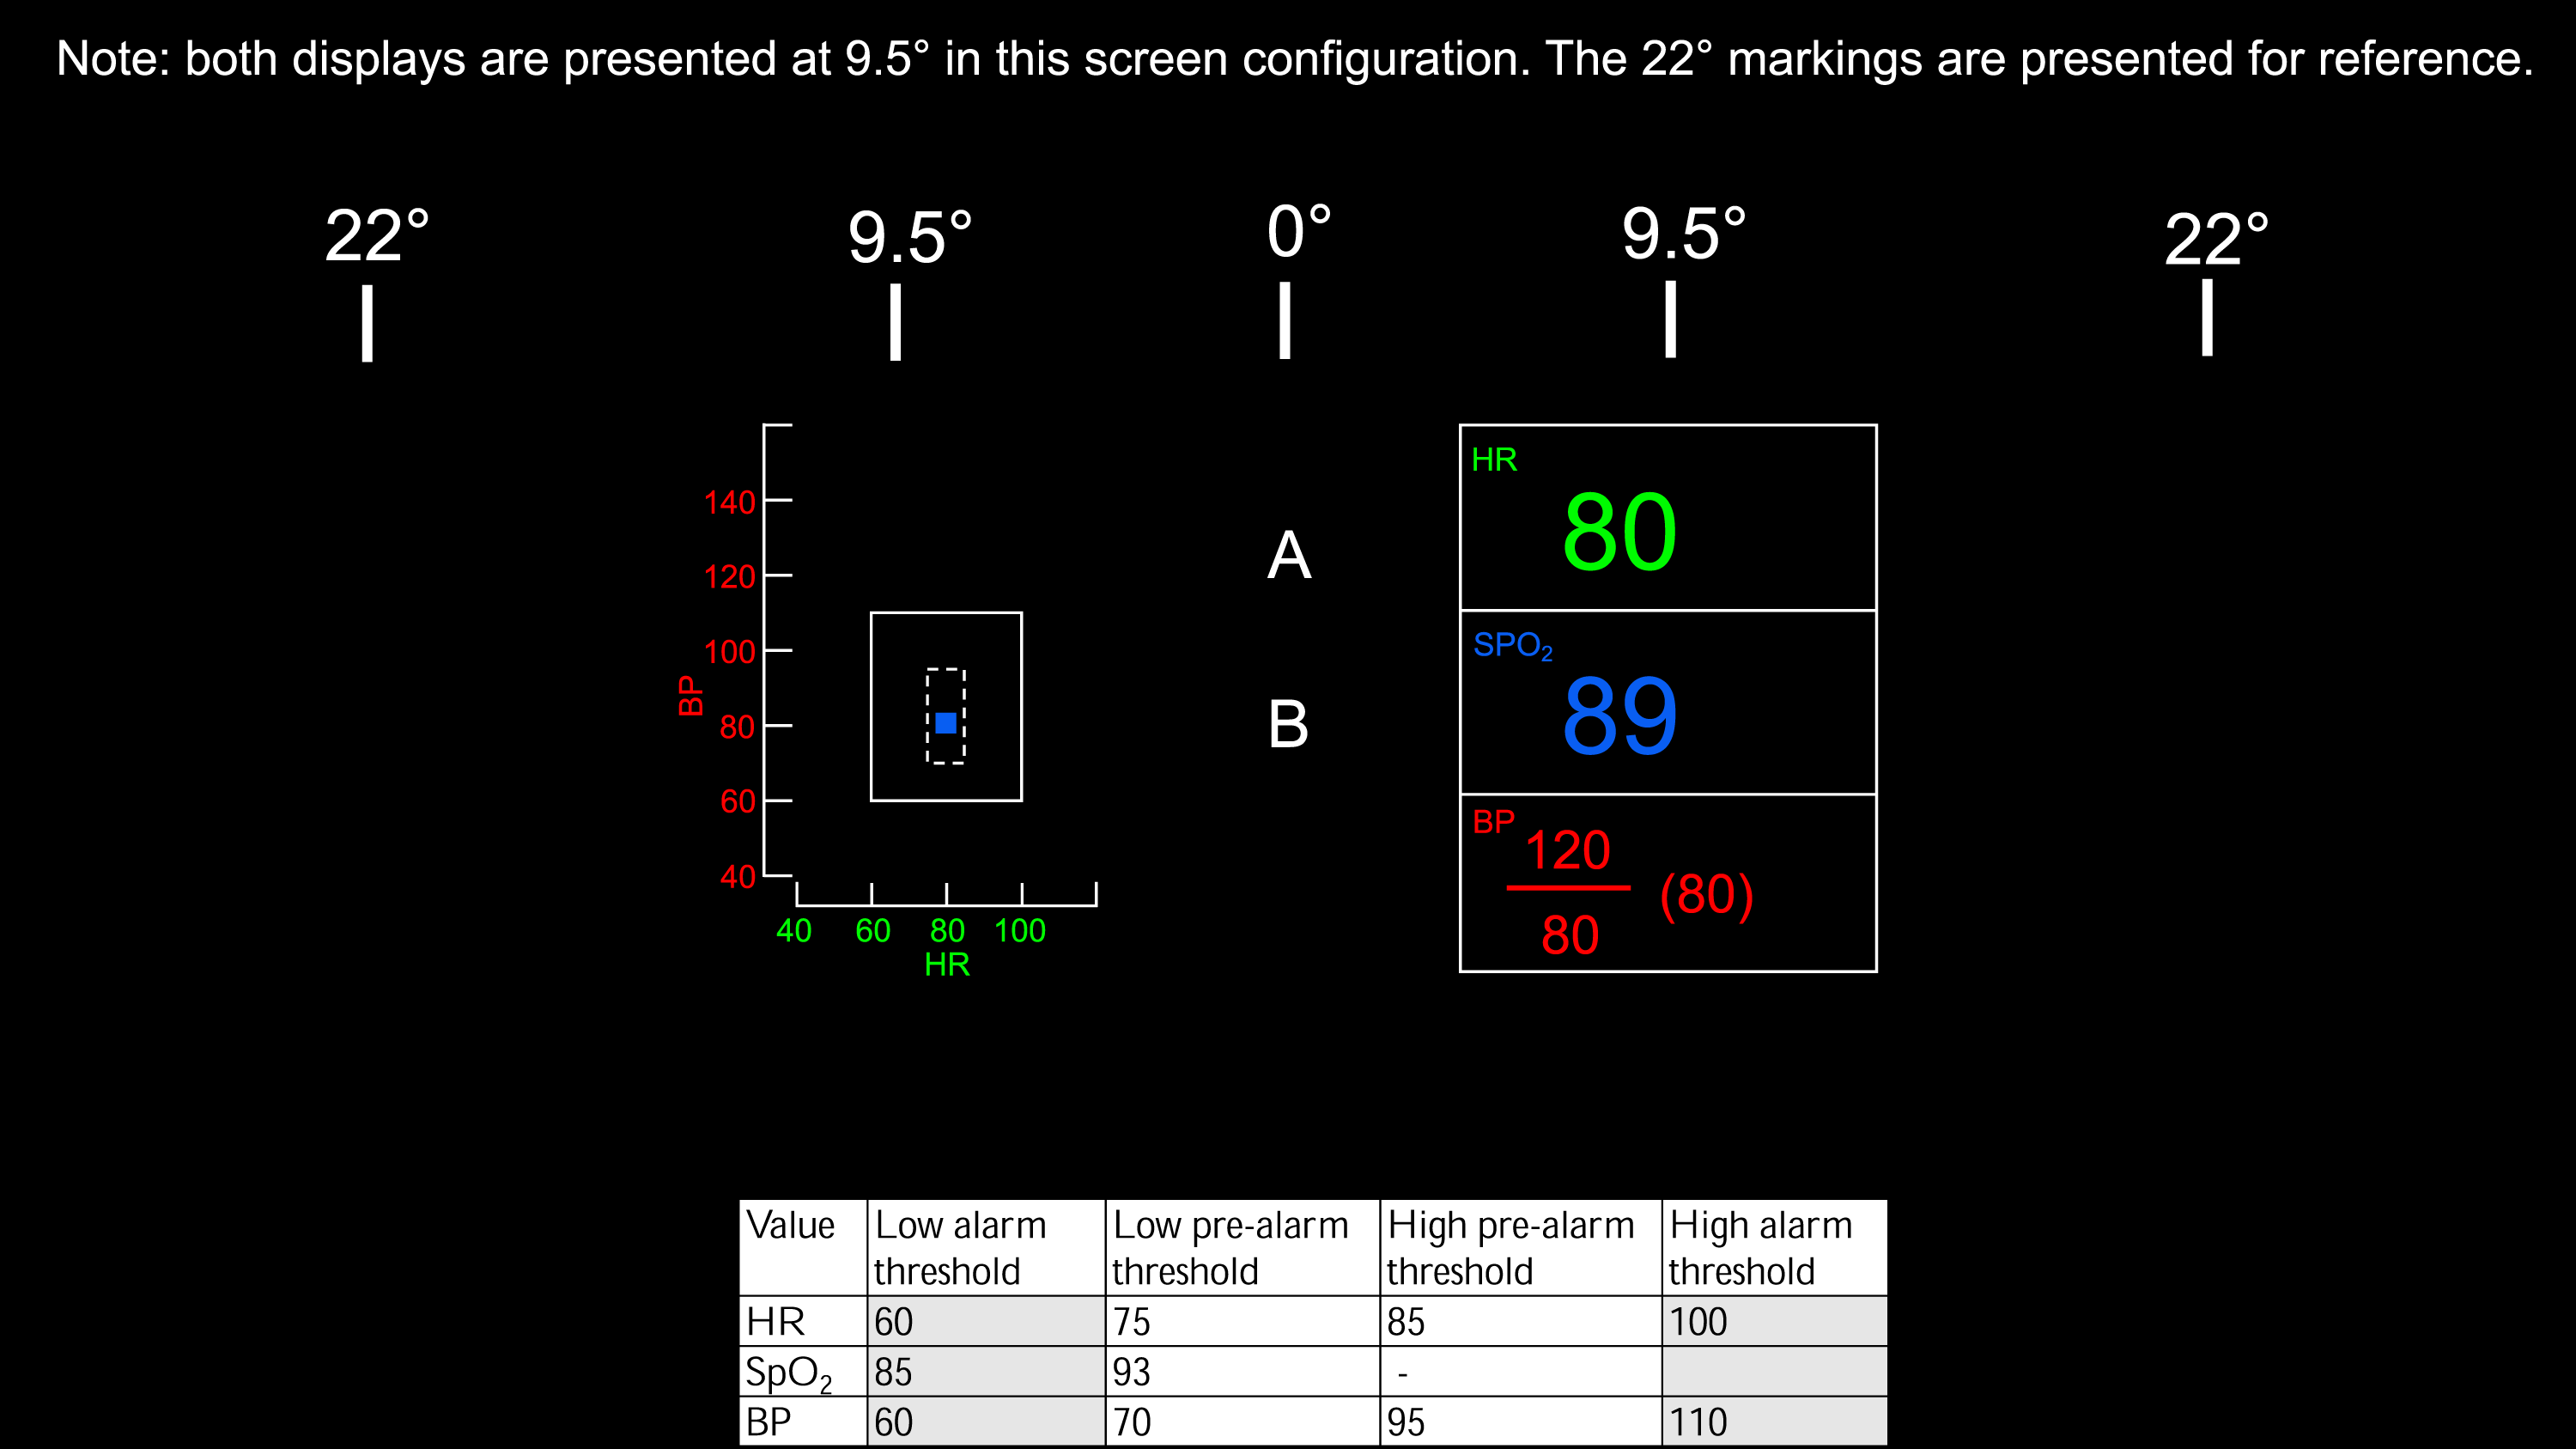
Design
This within-subjects study used a 2 (Display Position) × 2 (Eccentricity) × 6 (Emergency Event) blocked design to examine the speed and accuracy of emergency event identification, secondary task responses, pupil dilation, and NASA-TLX scores.
Display Position and Eccentricity
The concurrently presented configural and numerical displays alternated between blocks between the left and right sides of the screen and were centered horizontally at 9.5° or 22° (Figure 2). The numerical display was always positioned opposite the configural display. This resulted in four configurations: (1) numerical left/configural right, both 9.5°; (2) numerical left/configural right, both 22°; (3) numerical right/configural left, both 9.5°; and (4) numerical right/configural left, both 22°.
Emergency Event
Six types of emergencies were tested: high or low HR, high or low BP, low SpO2, high BP with high HR, high HR with low BP, and low BP with low HR. These events were selected due to their immediate threat to morbidity or mortality.
Procedure
Equipment
Participants sat approximately 76 cm from the primary monitor, an HP 24-dd0010 Desktop Computer with a 1920 × 1080 pixel resolution. The numerical and configural displays were each 310 pixels wide and 409 pixels tall, occupying about 5.25°×6.91° of visual angle at fixation. A secondary monitor, a Thinlerain 17-inch PC with 1280 × 1024 pixel resolution, was positioned next to the primary monitor, with the screen visible only to the experimenter. This monitor displayed the Gazepoint GP3 Eye Tracker application (Gazepoint, Vancouver, BC) to verify that the eye tracker was recording valid data. The Gazepoint eye tracker was positioned on the desk 35 cm from the participant, without obstructing the primary monitor, and recorded pupil size at a rate of 60 Hz.
Secondary Task
During each block of the study, participants completed a secondary task, a variation of the dual N-Back task by Jaeggi et al. (2008), to simulate multitasking in a clinical environment (Jaeggi et al., 2010). Participants compared two streams of letters, with the possible letters being any of the 26 letters in the English alphabet. Each letter pair appeared at the center of the screen for 2 s with a 1 s gap between pairs. For each pair, participants were instructed to press the “s” key if the bottom letter was the same as the previous top letter (N = 1) and the “d” key if the bottom letter was different from the previous top letter. Accuracy and reaction time (RT), the difference in time between the appearance of a new pair of letters and the time when the correct response key was pressed, were recorded for all letter pairs. All experimental conditions used N = 1.
Emergency Events During Patient Monitoring
During simulated patient monitoring, emergency events occurred every 30 ± 1 to 6 s, with the specific timing determined randomly. Each event involved parameter change at a constant linear rate. These events were embedded in a continuous stream of activity, and participants were not explicitly informed about the onset or number of individual events.
For each block, we created two random orderings of the six events and combined them for the final sequence. Thus, each of the six emergency events occurred twice per block. The direction of the emergency (increasing or decreasing) was randomly selected. Participants used five designated number keys on the keyboard to indicate high HR, low HR, low SpO2, high BP, or low BP. For emergency events that required more than one key press (e.g., high HR with high BP), participants could input the responses to each of the component events in any order. If an incorrect response was entered, the vitals continued to deviate, and the alarm sounded for 5 s, or until the correct response was provided. After each emergency event, vital signs automatically reset to normal values, and the auditory alarm was silenced. Accuracy and RT were recorded for each emergency event.
Study Procedures
After giving consent, participants previewed the configural and numerical displays and secondary task, and then practiced identifying the six emergency events and the secondary task. Afterward, participants practiced completing the patient monitoring and secondary task on the integrated computer screen at the same time for 1 min (Figure 2).
Participants then began four continuous 10-min experimental blocks, each using a different screen configuration. The order of the four screen configurations was randomized across participants. Participants were instructed to concurrently monitor the displays for changes in vital signs and complete the secondary task. No other specific instructions to look at particular displays or prioritize responses were given. After each monitoring block, all participants completed the NASA-TLX assessment then took a 2-min break to mitigate fatigue.
Results
Primary Task Accuracy
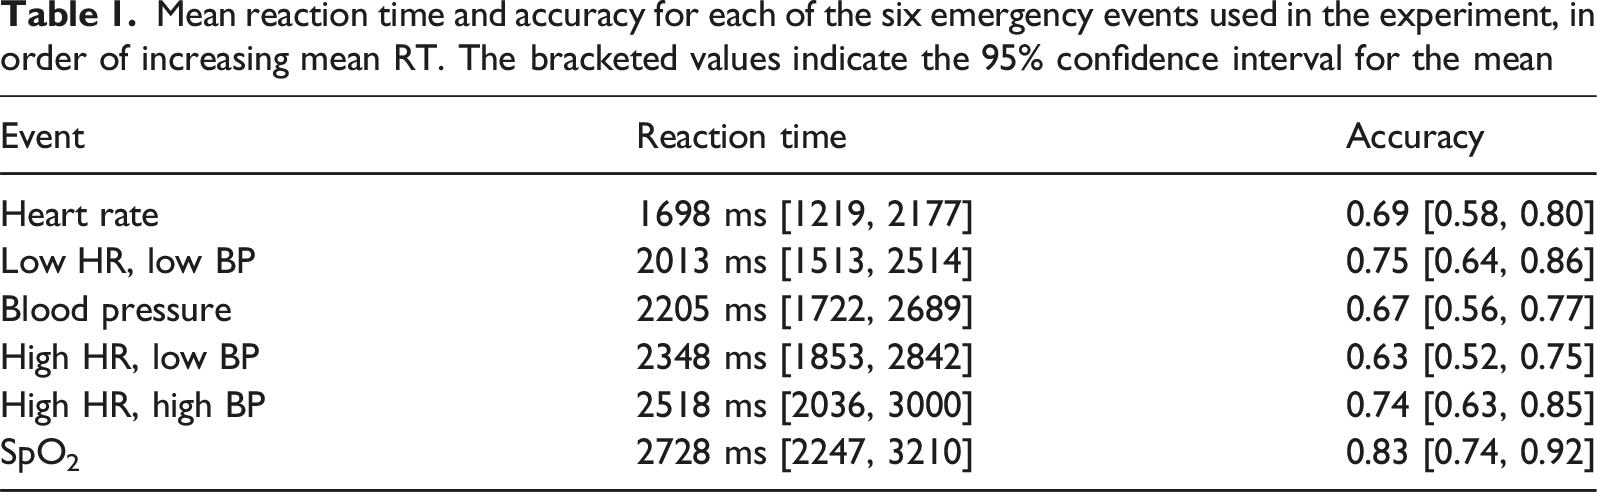
Mean reaction time and accuracy for each of the six emergency events used in the experiment, in order of increasing mean RT. The bracketed values indicate the 95% confidence interval for the mean
Primary Task Reaction Time
Next, we compared reaction times for correctly-identified events across experimental conditions. First, reaction times shorter than 250 ms were removed. Then, we averaged reaction times across both presentations of each of the six emergency events at each of the four combinations of display position and eccentricity.
Twenty-eight out of thirty participants had at least one missing RT, owing to situations where they did not correctly identify an emergency event on either of the two presentations during a block. On average, 24.03% of data were missing across participants. Ten rounds of multiple imputation using predictive mean matching were performed to replace missing reaction time values. Repeated-measures ANOVA was performed using each of the ten imputed data sets, with RT as the dependent variable and display position, eccentricity, and emergency event used as factors. F-tests and post-hoc comparisons were pooled across imputations using Rubin’s rules using an algorithm written in SPSS (van Ginkel, 2010; van Ginkel & Kroonenberg, 2014).
We found a main effect of emergency event (F(5,129.35) = 4.57, p < 0.001, η2 p = 0.15). The middle column of Table 1 displays the means and confidence intervals for the six emergency events. Post-hoc comparisons using the Bonferroni correction showed that responses to HR were significantly faster than responses to all other events except for low HR + low BP events. Responses to low SpO2 events were significantly slower than responses to all other events except for high HR + high BP events. In addition, responses to low HR + low BP events were faster than responses to high HR + high BP events. There was not a main effect of display position (F(1,22.22) = 0.49, p > 0.05, η2 p = 0.02) or eccentricity (F(1,25.02) = 1.03, p > 0.05, η2 p = 0.04). No interactions were significant.
Across all participants, auditory alerts were required on only 5% of trials. This indicates that participants were unlikely to have relied on the alarm as the primary cue for detecting emergency events.
Secondary Task (N-Back) Performance
Secondary Task Response Accuracy
To examine whether display position, display eccentricity, and emergency status affected accuracy of secondary task responses during monitoring, we first calculated the proportion of correct responses to N-Back stimuli for each combination of the three factors for each participant (i.e., the proportion of total correct responses during each block of monitoring). A three-way repeated-measures ANOVA using accuracy as the dependent variable and display position, eccentricity, and emergency status as factors revealed main effects of display position and emergency status. As shown in Figure 3, the proportion of correct responses was higher when the configural display was on the right (M = 0.70, 95% C.I., [0.65, 0.75]) than on the left (M = 0.67, 95% C.I., [0.62, 0.72], F(1,29) = 5.29, p = 0.03, η2
p
= 0.15). Furthermore, accuracy was lower during patient emergencies (M = 0.57, 95% C.I. [0.51, 0.63]) than during normal monitoring (M = 0.80, 95% C.I. [0.75, 0.84], F(1,29) = 179.88, p < 0.001, η2
p
= 0.86). There was no effect of eccentricity (F(1,29) = 0.07, p > 0.05, η2
p
= 0.00). No interactions between factors were significant (all p > 0.05). Secondary task accuracy (y-axis) as a function of eccentricity (x-axis) during emergency events and nominal monitoring when the configural display was (A) on the left and (B) on the right. N-back accuracy was higher during normal monitoring and when the configural display was positioned on the right of fixation. Error bars represent 95% confidence intervals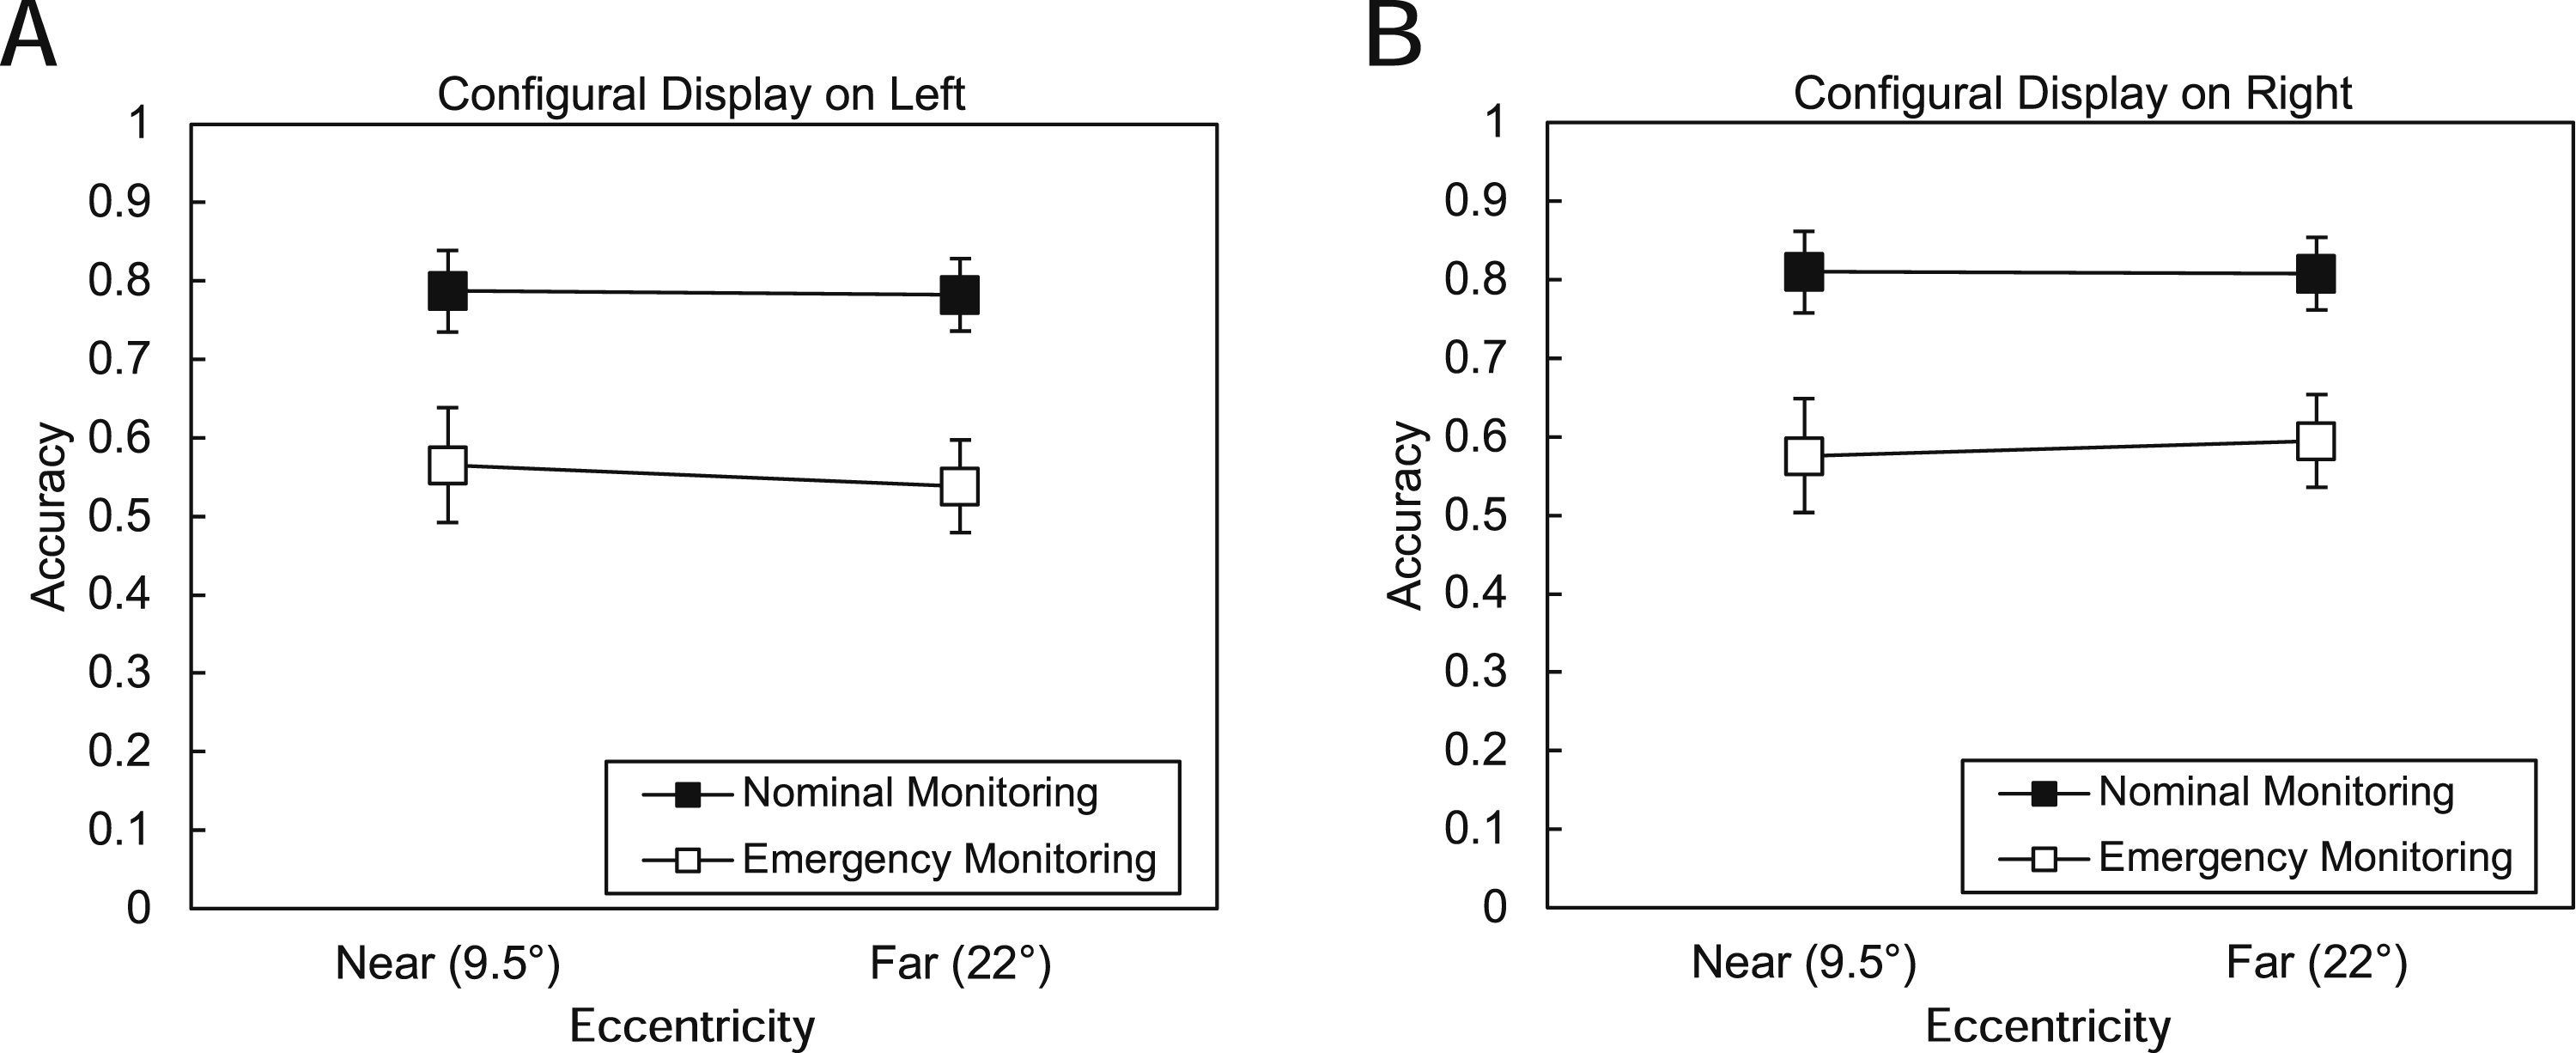
Secondary Task Reaction Time
We performed a three-way repeated-measures ANOVA using display position, eccentricity, and emergency status as factors and RT for correct N-Back responses as the dependent variable. There was a main effect of display position (F(1,29) = 23.66, p < 0.001, η2p = 0.45). Correct responses were faster when the configural display was on the right (M = 772 ms, 95% C.I. [715, 828]) than when it was on the left (M = 840 ms, 95% C.I. [777, 903]). There was a main effect of eccentricity, where participants took longer to make correct responses when the primary task displays were farther from fixation (i.e., at 22°) (M = 826 ms, 95% C.I. [764, 887] than when they were closer to fixation (M = 786 ms, 95% C.I. [725, 846], F(1,29) = 5.15, p = 0.03, η2p = 0.15). There was also a main effect of emergency status, with correct responses taking longer while an emergency event was occurring (M = 876 ms, 95% C.I. [818, 933]) than during normal monitoring (M = 736 ms, 95% C.I. [674, 799], F(1,29) = 85.63, p < 0.001, η2p = 0.75). Finally, as Figure 4 shows, there was a significant interaction between distance and emergency status (F(1,29) = 7.38, p = 0.01, η2p = 0.20), with the slowest correct responses to secondary task stimuli occurring when an emergency was happening and the displays were farther from fixation. No other interactions were significant (all p > 0.05). Secondary task reaction times (y-axis) as a function of eccentricity (x-axis) during emergency events and nominal monitoring when the configural display was (A) on the left and (B) on the right. Reaction times increased with greater eccentricity, and responses were slower during emergencies compared to normal monitoring. In addition, there was an interaction of eccentricity and emergency status. Error bars represent 95% confidence intervals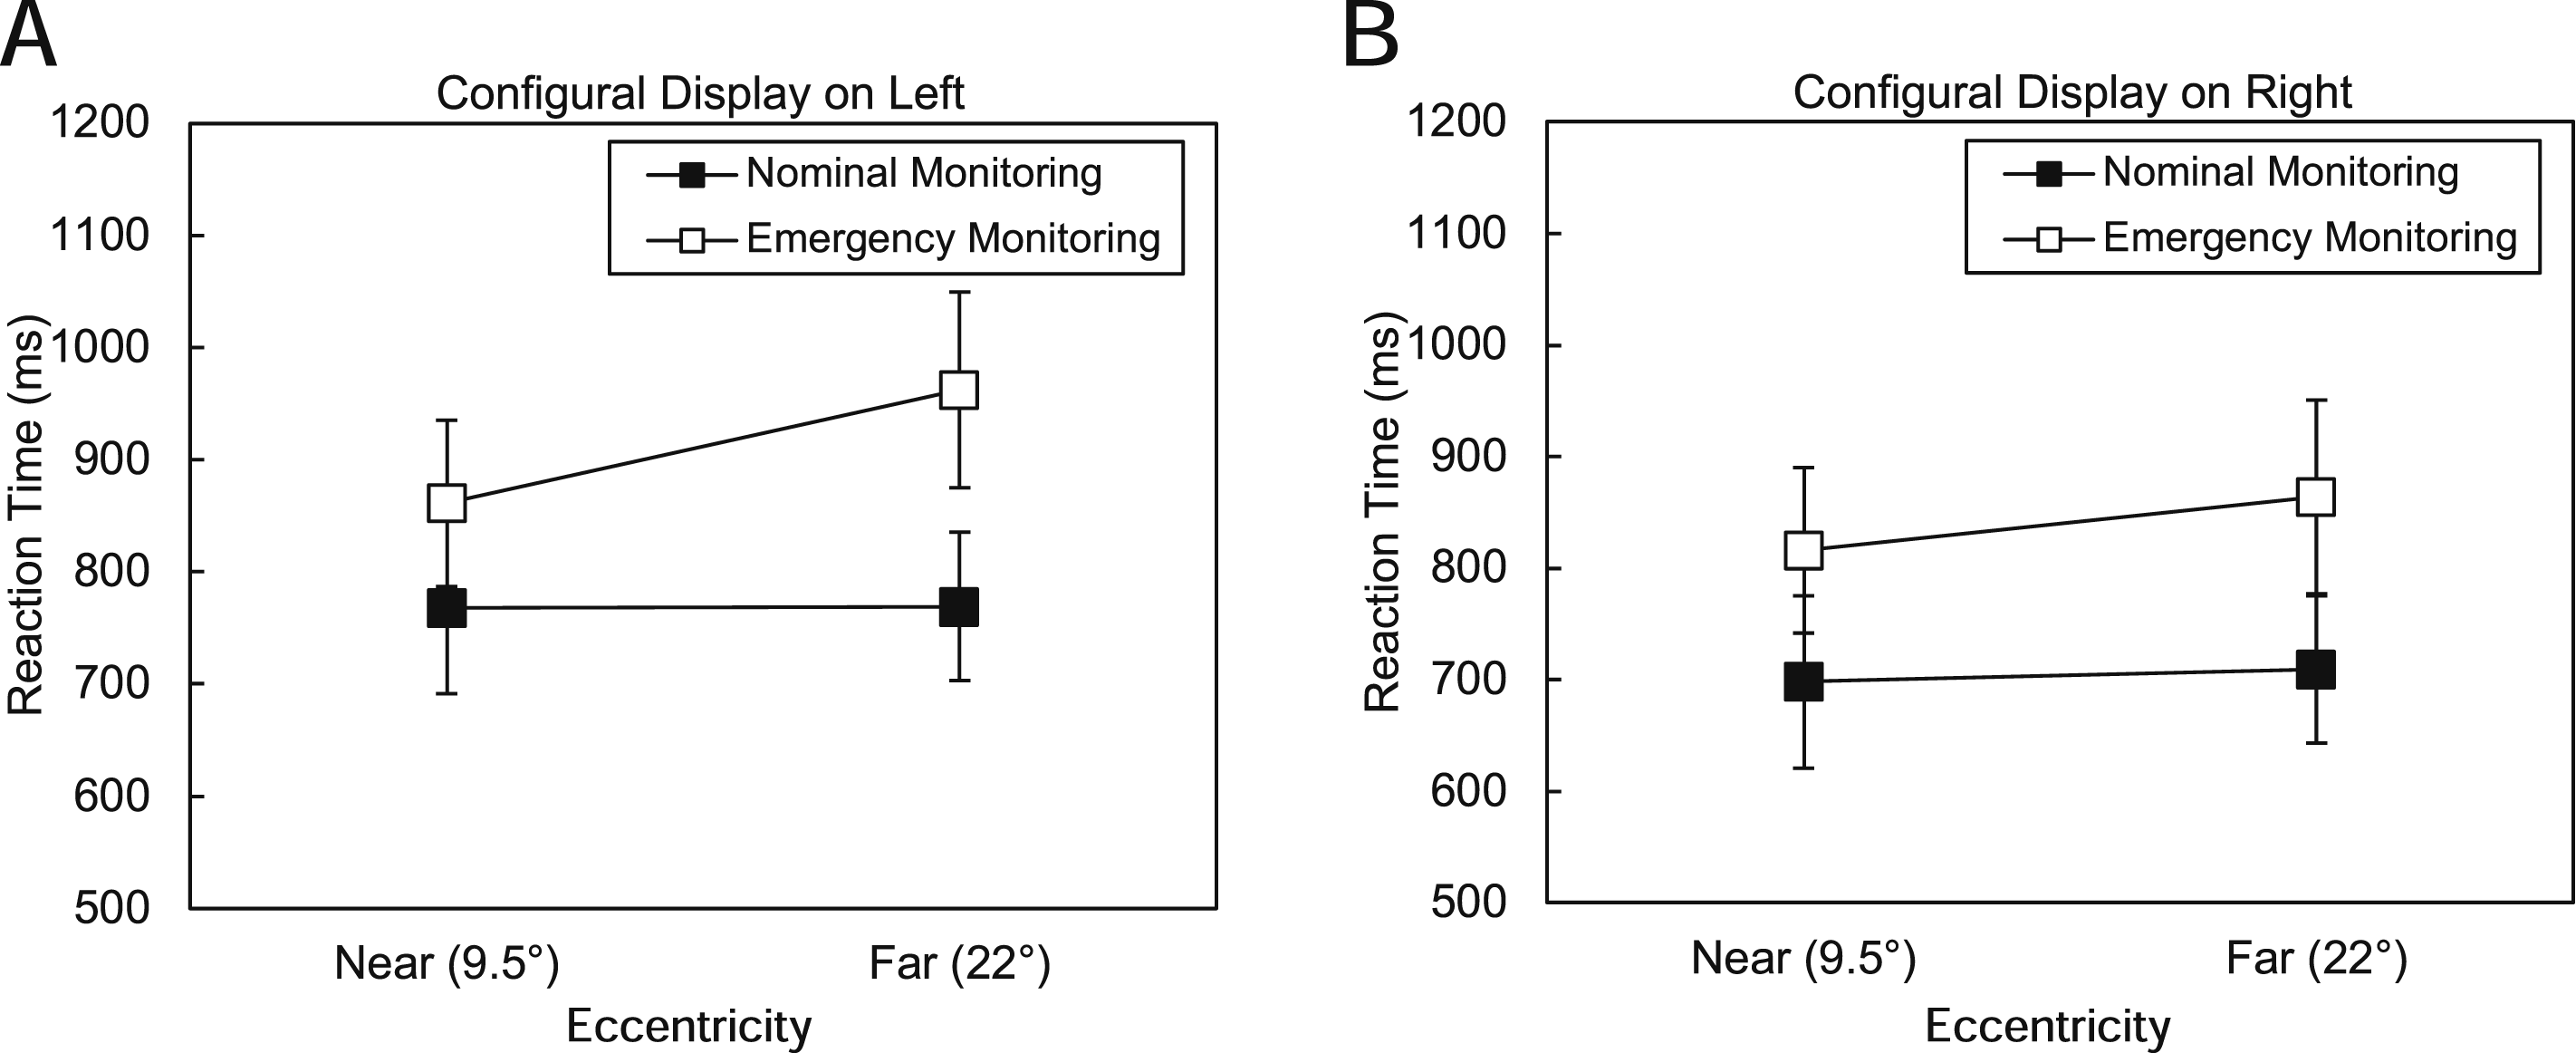
Mental Workload
Pupillometry
Across all 30 participants, the mean number of samples per block was 20,478.68 (SD = 4,856.65). For each participant, we first calculated the average pupil diameter during valid samples (where the eye tracker recorded pupillometry data for both eyes) across each of the four blocks. An average of 83.61% of samples were valid (95% C.I. [83.09%, 84.13%]).
We performed a three-way ANOVA using pupil diameter as the dependent variable and display location, eccentricity, and emergency status (nominal monitoring and emergency monitoring) as factors. This ANOVA revealed a main effect of emergency status (F(1,29) = 34.25, p < 0.001, η
2
p
= 0.54). As Figure 5 shows, pupil diameter during emergencies was larger (M = 20.02 pixels, 95% C.I. [17.49 pixels, 22.55 pixels]) than pupil diameter during normal monitoring (M = 19.26 pixels, 95% C.I. [16.84 pixels, 21.67 pixels]). We did not find evidence for main effects of display position (F(1,29) = 0.53, p > 0.05, η
2
p
= 0.02) or eccentricity (F(1,29) = 0.02, p > 0.05, η
2
p
= 0.00). No interactions were significant (p > 0.05). Pupil diameter (y-axis) as a function of eccentricity (x-axis) during emergency events and nominal monitoring when the configural display was (A) on the left and (B) on the right. Pupil diameter increased during emergencies compared to normal monitoring. Error bars represent 95% confidence intervals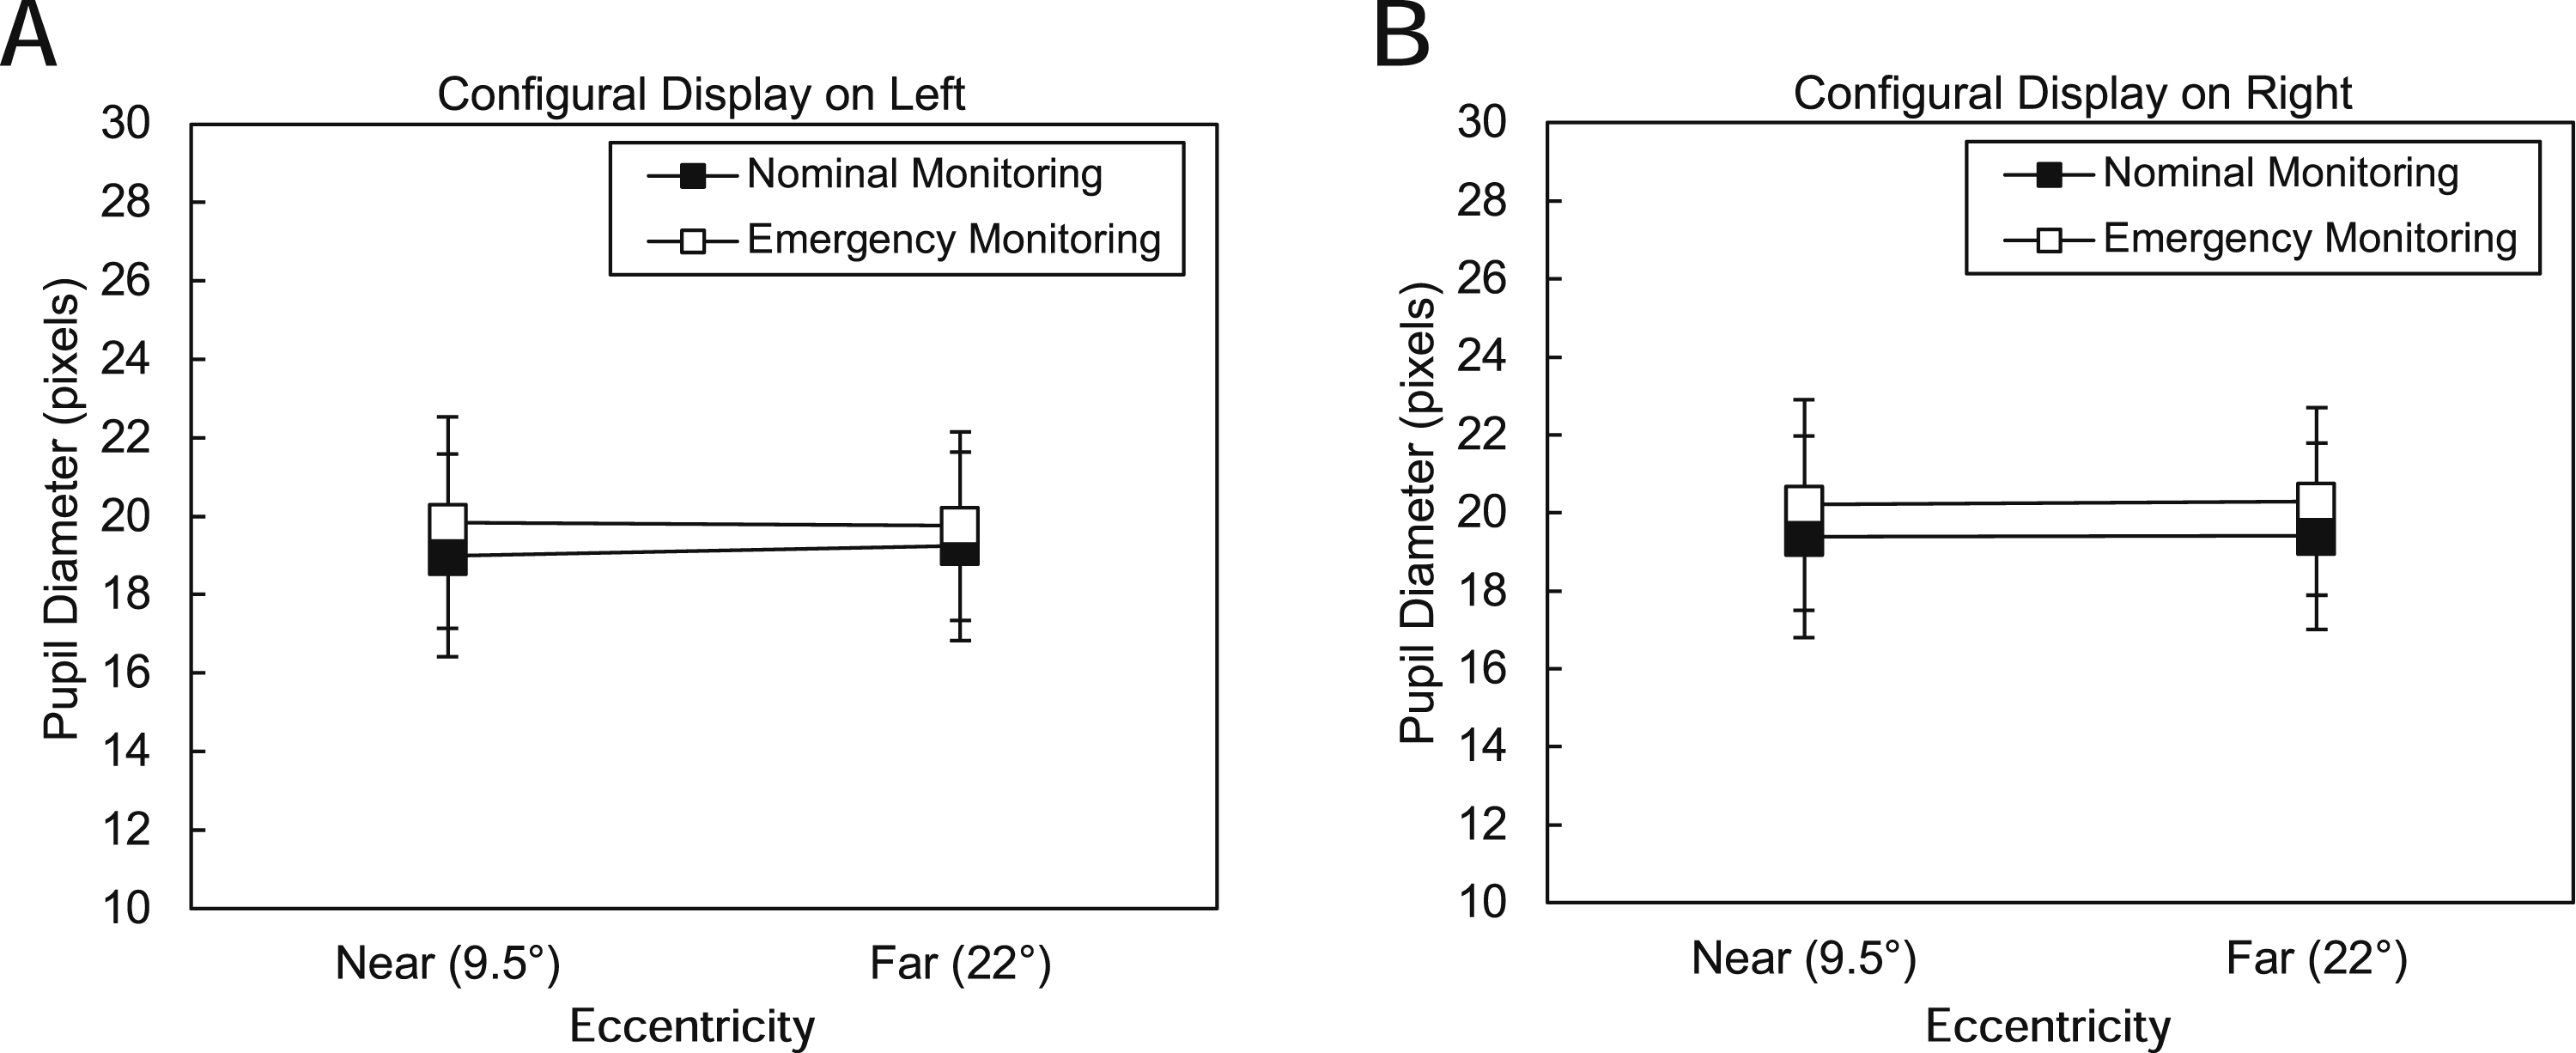
NASA-TLX
We tested for differences in NASA-TLX ratings for the four combinations of display position and eccentricity. As described in the Methods, we obtained four measurements for each of the six NASA-TLX items per participant, with one measurement at the end of each block. We performed a three-way repeated-measures ANOVA using TLX score as the dependent variable and TLX item, display position, and display eccentricity as factors. Average NASA-TLX ratings from across all six items were higher when the displays were further from fixation (M = 4.15, 95% CI [3.82, 4.49]) than when they were closer to fixation (M = 3.72, 95% CI [3.31, 4.13], F(1,28) = 5.09, p = 0.03, η2 p = 0.15). We also found a main effect of TLX item (F(5,140) = 15.79, p < 0.001, η2 p = 0.36). Mental task demand (TLX 1: M = 4.56, 95% CI [4.12, 5.00]) was rated higher than physical demand (TLX 2: M = 2.67, 95% CI [2.19, 3.15]) or temporal demand (TLX 3: M = 3.97, 95% CI [3.54, 4.40]). Likewise, physical task demand was rated lower than any other task load component. We did not find a main effect of display position (F(1,28) = 1.58, p > 0.05, η2 p = 0.05) or an interaction between any of the variables.
Next, we examined whether measures of workload were correlated with pupil diameter. For each participant, we calculated the average TLX rating across the six questions for each combination of display position and eccentricity, resulting in four mean TLX ratings. The correlation between these four ratings, with one for each of the four experimental conditions, and the mean pupil diameter for that condition across participants, was r = −0.12, indicating that only 1% of the variance in TLX ratings was explained by the relationship of TLX rating and pupil diameter.
Discussion
This study examined how spatial configuration of displays affects primary task performance, secondary task performance, and workload. H1, which predicted that placing the configural display on the left of the centrally presented secondary task display would improve primary and secondary task performance and reduce workload, was not supported. Instead, we showed that secondary task performance was faster and more accurate when the configural display was presented to the right of the secondary task display.
This effect could be due to spatial proximity: with the configural display on the right, its y-axis was closer to the N-Back task, allowing participants to switch attention between the N-Back task and configural display more easily than when it was on the left. Eye-tracking data from this study (reported in Cummins et al., 2024) showed that participants looked at the configural display more often and longer than they looked at the numerical display, supporting this possibility. Alternatively, in line with multiple resource theory (Wickens, 2002), our version of the N-Back task may have consumed spatial resources required for primary task performance, requiring participants to determine whether the bottom letter of the current pair matched the top letter of the previous pair. Spatial resources are associated with right hemisphere functioning, so placing the configural display in the right visual field may have reduced resource competition for spatial processing resources compared with configurations in which both tasks drew on right hemisphere functioning.
In contrast, H2 was partially supported. Secondary task performance was consistent with H2, with faster RTs at low display eccentricity. These results align with other findings showing that visual search time increases with eccentricity (Reis et al., 2011; Staugaard et al., 2016; Steelman et al., 2013) and that increasing task demands hinders perception of peripheral stimuli (Nikolic et al., 2004; Wickens, 2005). Future work should test whether explicitly prioritizing the secondary task increases eccentricity effects in the primary task.
Responses to emergency events differed in accuracy and response time. Participants responded to HR emergency events faster than all other events except for low HR + low BP events. This may be because of the higher contrast between the green used in the HR representation and the black background and the other colors on the display. Furthermore, responses to SpO2 events were more accurate than responses to other events (HR, BP, high HR with low BP), even though they were slower than responses to other events except for high HR + high BP events, suggesting that the color change cue offered accurate information but did not speed event detection. While the effects of search time and accuracy obtained in these controlled lab settings were small, the added complexity of actual clinical work is likely to increase these effects. Future work should continue to incorporate principles of display design to improve both displays.
N-Back performance demonstrated the effects of task interruption. The N-Back task required a response every 2 s. During emergency events, which occurred approximately every 30 s, N-Back accuracy fell by 23%, while RT slowed by an average of 140 ms. However, N-Back RT and accuracy were best when the configural display was on the right side at the lower eccentricity, suggesting greater resource availability in these conditions.
Subjective and objective workload measures captured different aspects of behavior. Participants rated the task as mentally demanding but not physically demanding. Average NASA-TLX ratings increased with display eccentricity, whereas pupil dilation was unaffected by eccentricity but increased during emergencies. Subjective ratings may be more sensitive to display features, while pupil diameter remains a valuable indicator of acute workload shifts and subtle shifts in cognitive load, although its sensitivity can be affected by visual tasks (Chin et al., 2024; Filipa Ferreira et al., 2024; Nguyen et al., 2022).
Conclusions
Overall, the results of this study align with a theoretical framework of patient monitoring that emphasizes the importance of information processing in responding to emergency events. As we have shown, certain spatial arrangements, such as configural display right-of-fixation positioning and reduced eccentricity improve secondary task performance and accuracy under cognitively demanding conditions. While our results are consistent with previous findings (e.g., Reis et al., 2011; Wickens & Carswell, 1995; Wickens & Sandry, 1982), they also demonstrate that display design affects performance on secondary tasks that do not rely on those displays, as well as cognitive load during patient monitoring.
Limitations
Study participants were not clinicians and likely unfamiliar with vital sign ranges. Clinicians familiar with these ranges may be better at identifying patient emergencies from a numerical display than a graphical display due to their experience with normal vital sign ranges.
The order of the four display configurations was randomized between participants but not counterbalanced. Future work using this methodology should use a Latin square design to control for order effects.
Each emergency event was presented twice per block to keep experimental sessions under an hour, resulting in missing data when both were missed. Adding additional presentations of each emergency event would have reduced the number of missing values.
Also, because the configural and numerical displays were always presented concurrently, the effects of the secondary task on each display type could not be isolated, limiting conclusions about their relative robustness to secondary task demands.
Finally, separate BP events were not included among the emergency conditions, which precluded direct comparison of the relative effectiveness of the two axes of the configural display, and with the more complex numerical representation of systolic, diastolic, and mean blood pressure.
Key Points
• Primary task reaction time and accuracy depended on the emergency event. • Positioning the configural display to the right of fixation enhanced secondary task performance (reaction time and accuracy), indicating that spatial layout choices can reduce workload and improve efficiency in dual-task interface design. • Lower display eccentricity supported faster secondary task responses, reinforcing theories of visual search efficiency and highlighting the value of minimizing peripheral processing demands in display design. • NASA-TLX ratings showed that participants found the task to be mentally demanding but not physically demanding. Average NASA-TLX ratings increased with display eccentricity, whereas pupil dilation was unaffected by eccentricity and only increased during emergency events. This pattern suggests that subjective ratings may be more sensitive to display features, while pupil diameter may be a better tool to capture acute workload shifts.
Footnotes
Acknowledgments
The authors would like to thank Grace Delmonte and Skylar Wechsler for their efforts with participant recruitment and data acquisition and Jemal Gishe for helpful conversations regarding the project.
Funding
The authors disclosed receipt of the following financial support for the research, authorship, and/or publication of this article: This work was financially supported by the Office of Naval Research Grant N00014-22-1-2184. The funders had no role in the study design, data collection and analysis, decision to publish, or preparation of the manuscript.
Declaration of Conflicting Interests
The authors declared no potential conflicts of interest with respect to the research, authorship, and/or publication of this article.