
Abstract
Objective
We investigated how various error patterns from an AI aid in the nonbinary decision scenario influence human operators’ trust in the AI system and their task performance.
Background
Existing research on trust in automation/autonomy predominantly uses the signal detection theory (SDT) to model autonomy performance. The SDT classifies the world into binary states and hence oversimplifies the interaction observed in real-world scenarios. Allowing multi-class classification of the world reveals intriguing error patterns previously unexplored in prior literature.
Method
Thirty-five participants completed 60 trials of a simulated mental rotation task assisted by an AI with 70–80% reliability. Participants’ trust in and dependence on the AI system and their performance were measured. By combining participants’ initial performance and the AI aid’s performance, five distinct patterns emerged. Mixed-effects models were built to examine the effects of different patterns on trust adjustment, performance, and reaction time.
Results
Varying error patterns from AI impacted performance, reaction times, and trust. Some AI errors provided false reassurance, misleading operators into believing their incorrect decisions were correct, worsening performance and trust. Paradoxically, some AI errors prompted safety checks and verifications, which, despite causing a moderate decrease in trust, ultimately enhanced overall performance.
Conclusion
The findings demonstrate that the types of errors made by an AI system significantly affect human trust and performance, emphasizing the need to model the complicated human–AI interaction in real life.
Application
These insights can guide the development of AI systems that classify the state of the world into multiple classes, enabling the operators to make more informed and accurate decisions based on feedback.
Keywords
Introduction
Consider the following hypothetical scenario: Sarah, a highly skilled pharmacist, is responsible for filling the medication bottles for each prescription order. Recently, the pharmacy Sarah works for has introduced an AI computer vision system
1
that can scan the filled bottle and identify the specific medication that has been filled. The AI system is introduced as another layer of verification before medication dispensing. Today, Sarah receives a prescription order for one patient, Noah, who needs to take medication
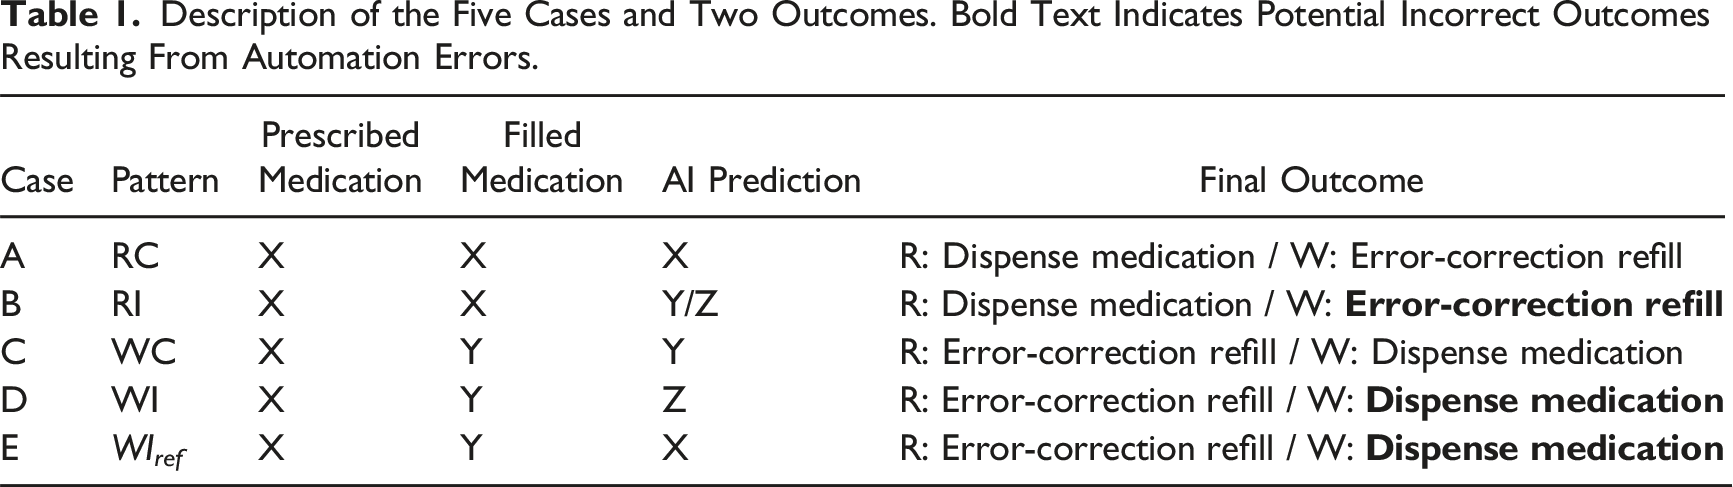
Upon receiving the order, one of the following five cases could happen: Case A: Sarah correctly fills the bottle with medication Case B: Sarah correctly fills the bottle with medication Case C: Sarah has a lapse when filling the bottle and incorrectly fills it with medication Case D: Sarah has a lapse when filling the bottle and incorrectly fills it with medication Case E: Sarah has a lapse when filling the bottle and incorrectly fills it with medication
This hypothetical scenario, which reflects recent developments in medical dispensing (Q. Chen et al., 2024; J. Y. Kim et al., 2025; Lester et al., 2021; Tsai et al., 2025; Zheng et al., 2023), presents unique characteristics that are largely overlooked in existing research on trust in and dependence on automation/autonomy and AI systems. Existing research typically involves a human subject performing tasks, with certain tasks being automated. For example, an automated combat identification (CID) aid can scan the environment, identify a friend or a foe, and make recommendations to soldiers (Guo et al., 2023, 2024; Du et al., 2020; Neyedli et al., 2011; Wang et al., 2009). To model the performance of the automation, most studies used the signal detection theory (SDT) (Hautus et al., 2021; Tanner & Swets, 1954). However, SDT categorizes the world into binary states—signal present or absent—which oversimplifies the complex dynamics and variances observed in real-world scenarios.
Let’s examine the five cases presented in the hypothetical scenario, focusing particularly on Case D and Case E shown in Figure 1(b), which are especially thought-provoking. In Case D, although the AI erroneously identifies medication Y as Z, this error can be considered beneficial from a utilitarian perspective. The incorrect identification differs from the prescribed medication X, which rightly triggers a safety alert. Conversely, Case E also involves an error by the AI, but this mistake could potentially lead to catastrophic results, as it mistakenly confirms the incorrectly filled medication as correct, misleading the human operator and providing false reassurance. Interestingly, as shown in Figure 1(a), if we assumed the prediction of the AI is only binary, Cases D and E would be combined into a single case. Difference in the performance patterns when choices are binary or nonbinary. In the 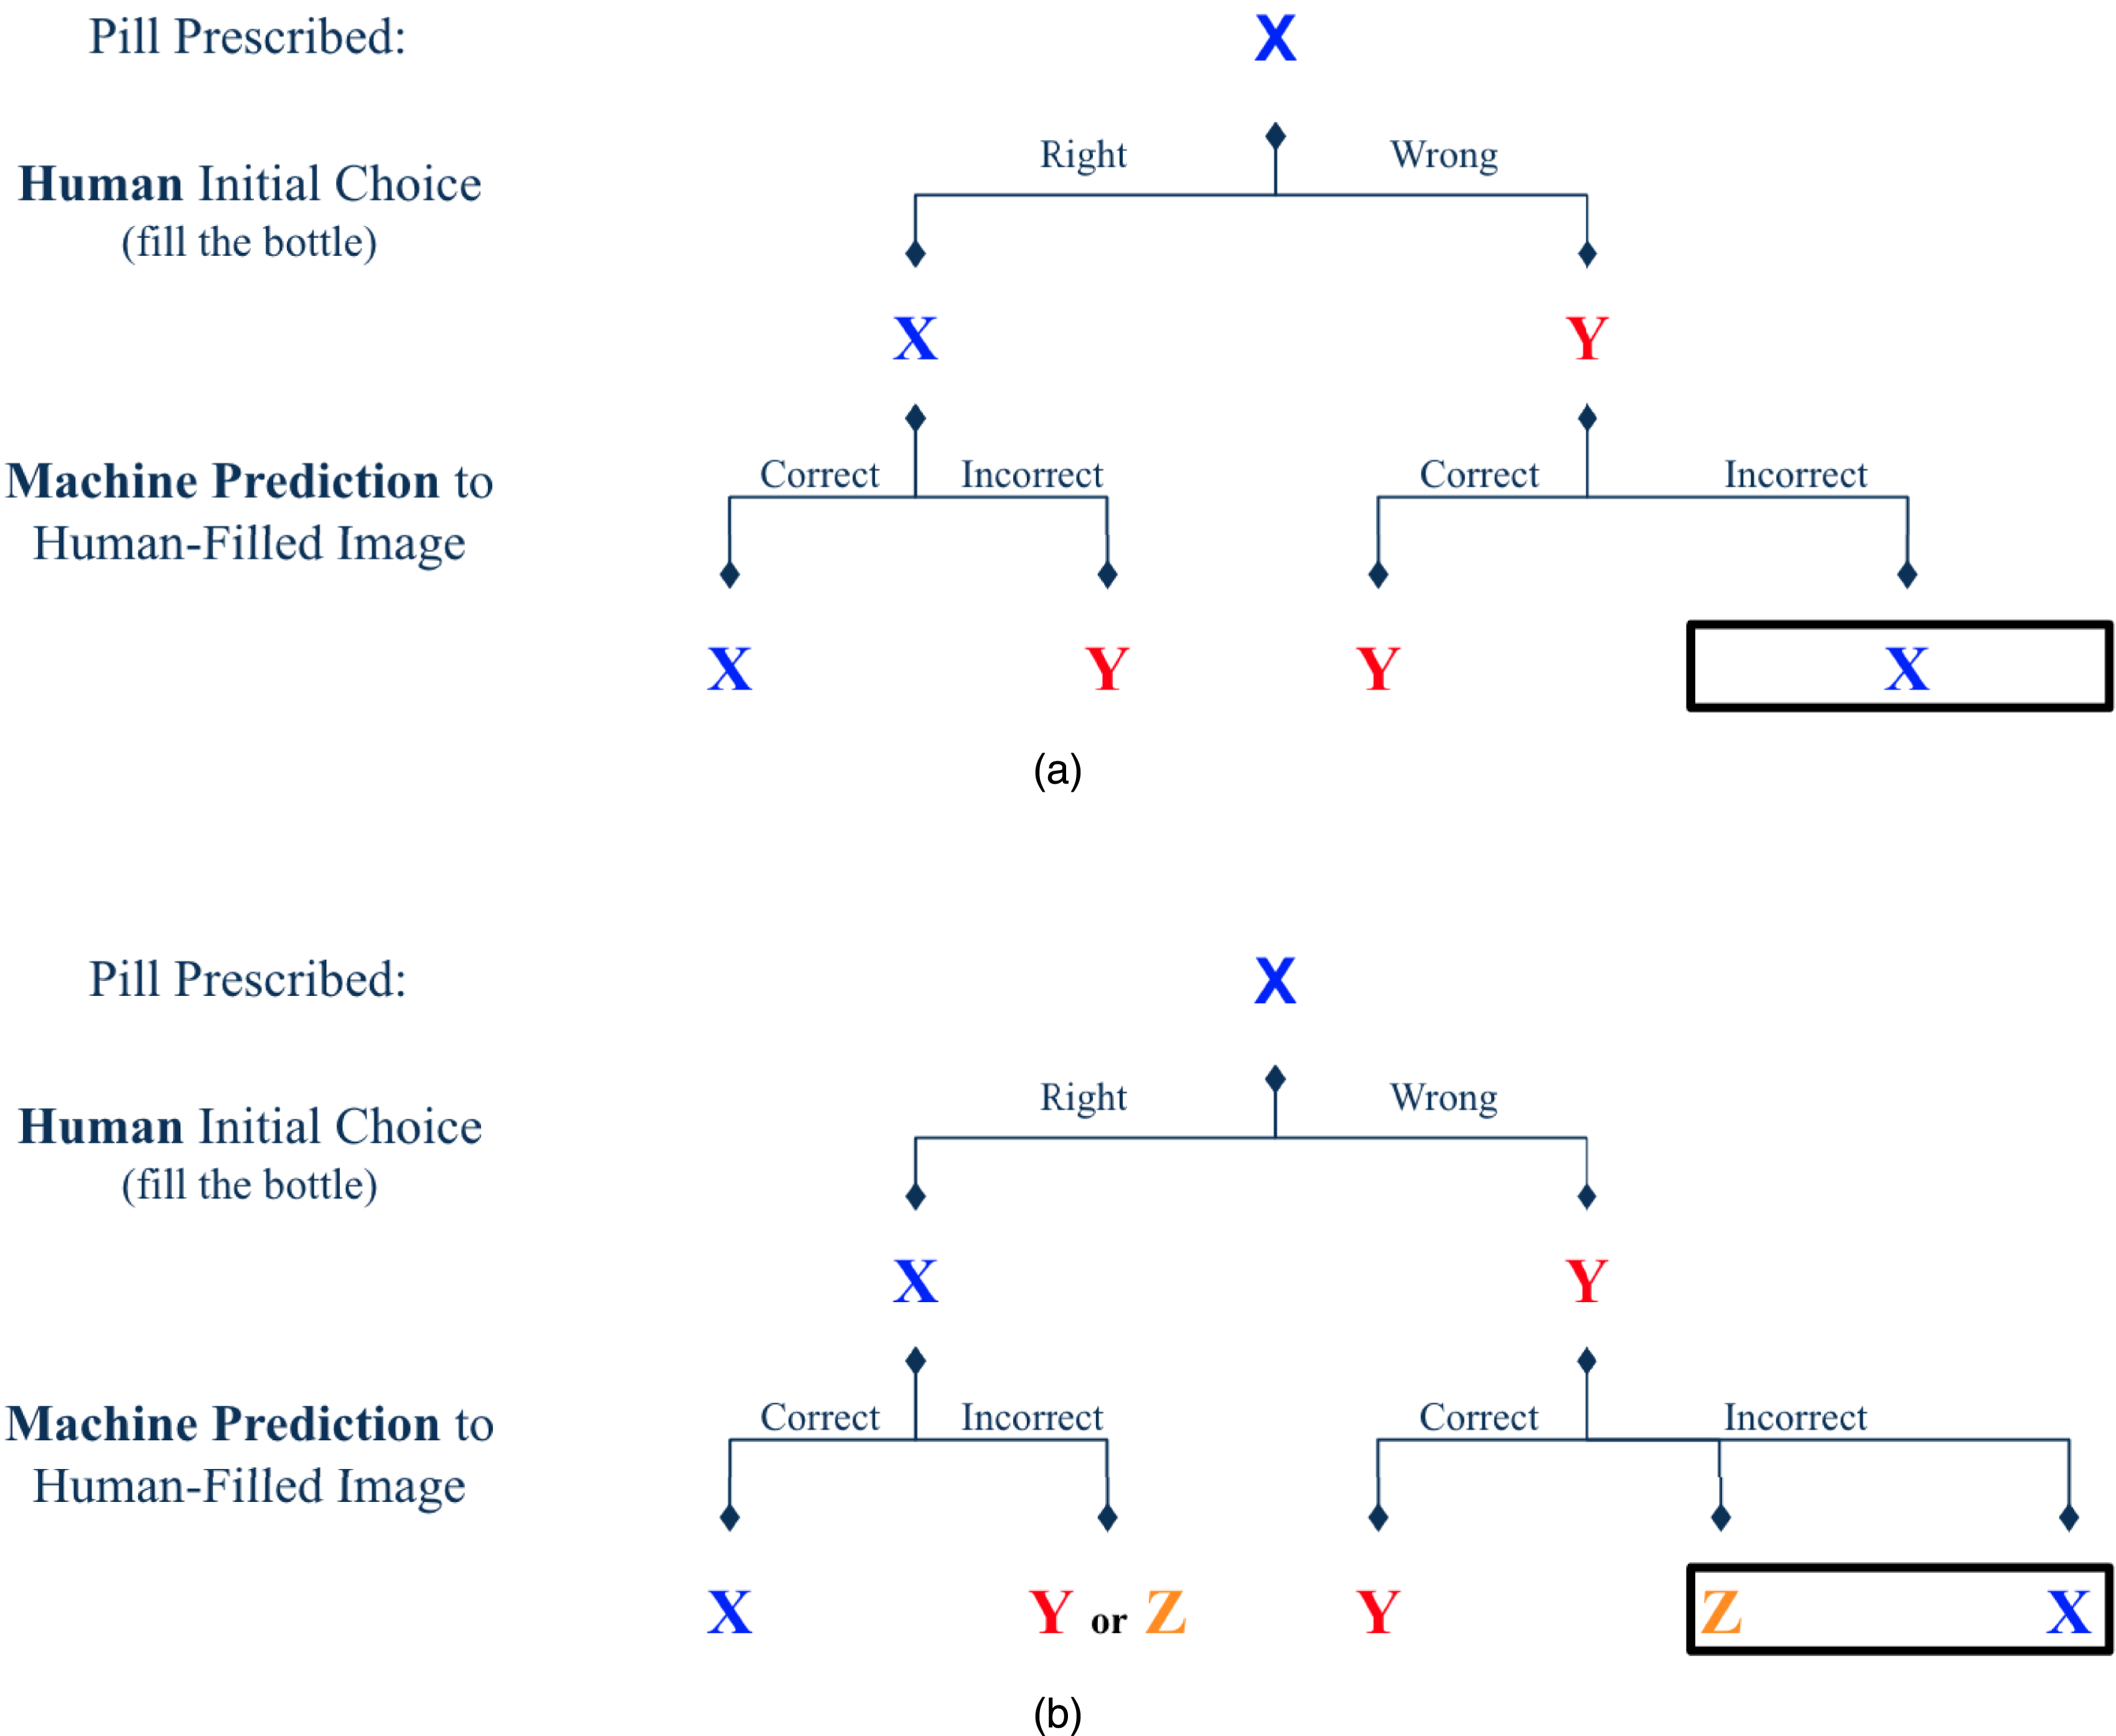
This research aims to explore how people trust and depend on automation/autonomy when the predictions made by these systems extend beyond simple binary decisions. We first review the SDT, followed by existing studies on trust and dependence that utilize SDT within both single- and dual-task frameworks. After that, we introduce and detail the current study.
SDT, Trust, Automation Compliance, and Reliance
SDT models the relationship between signals and noise, as well as the automation’s ability to detect signals among noise (Sorkin & Woods, 1985; Tanner & Swets, 1954). The state of the world is characterized by either “signal present” or “signal absent,” which may or may not be identified correctly by automation. The combination of the state of the world and the automation’s detection results in four possible states: hit, miss, false alarm (FA), and correct rejection (CR) (see Figure 2). Signal detection theory (SDT).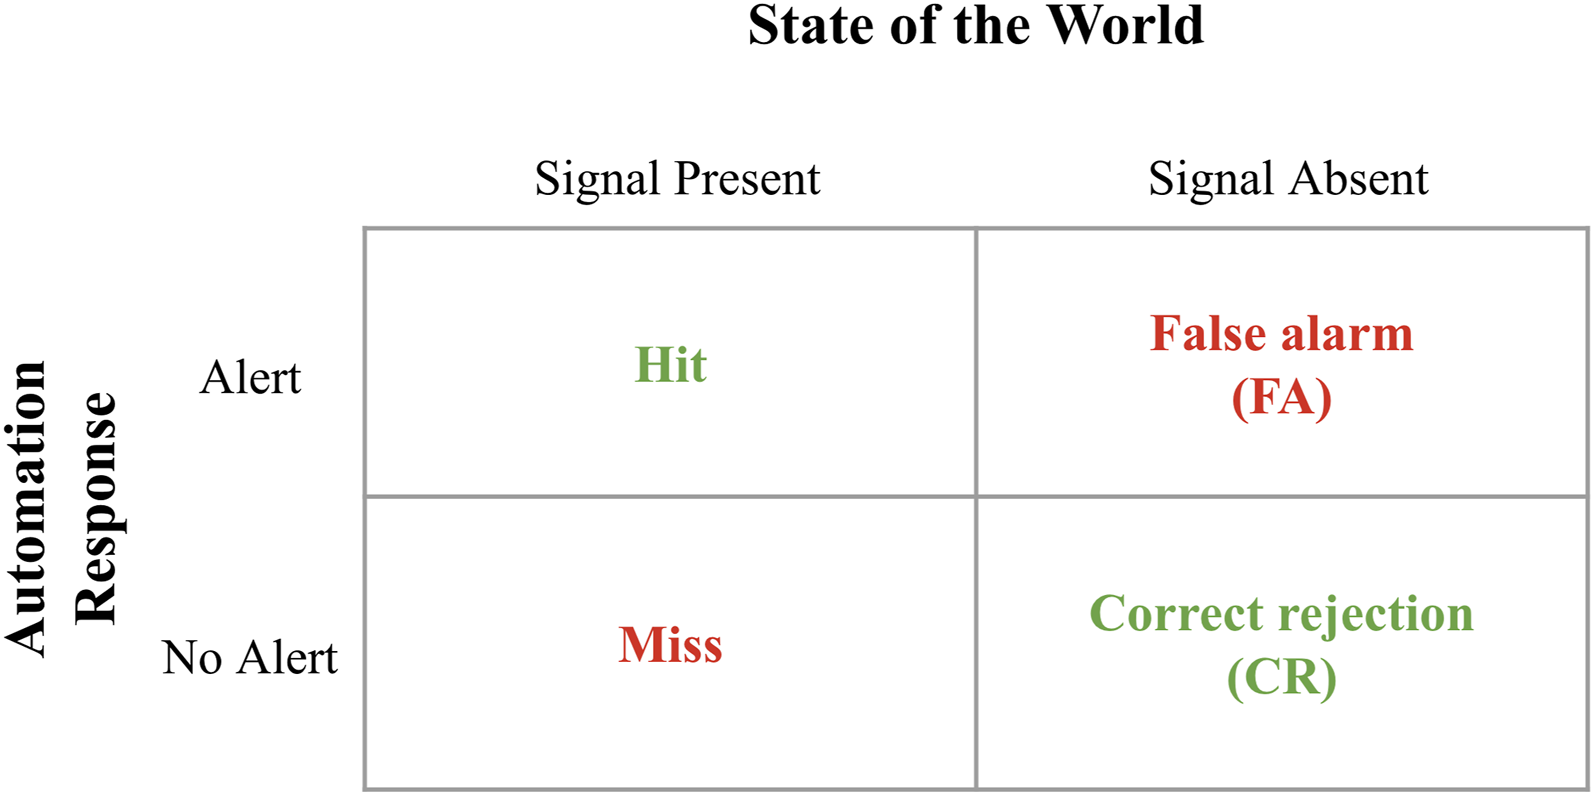
SDT is widely employed to examine trust in and dependence on automation/autonomy and AI systems. Typically, SDT is used to model the reliability of automation with which the human operators interact in both single-task (Bhat et al., 2022, 2024; Lacson et al., 2005; Madhavan et al., 2006; Neyedli et al., 2011; Wang et al., 2009; Wiegmann et al., 2001) and multi-task paradigms (Chung & Yang, 2024; Du et al., 2020; McBride et al., 2011; Wiczorek & Manzey, 2014; Yang et al., 2017). The general findings indicate that as automation reliability increases, trust and dependence on automation increase accordingly.
When error types (FAs and misses) are examined more closely, findings suggest they lead to distinct behavioral patterns (Chancey et al., 2017; Meyer, 2001, 2004). Dependence on automation can be categorized into compliance and reliance. Compliance is characterized by operators responding as though the error exists when the system indicates an error. FAs often result in commission errors when the operator follows the automation’s false indication. Reliance, by contrast, occurs when operators believe the automated system’s indication of safety. When operators fail to respond to events due to automation misses, omission errors arise (Meyer, 2001, 2004; Skitka et al., 1999). Research suggests that FAs primarily influence compliance, though some studies indicate they may also affect reliance, whereas misses predominantly impact reliance (Chancey et al., 2015; Chancey et al., 2017; Dixon & Wickens, 2006; Dixon et al., 2007; Meyer, 2001).
For example, Chancey et al. (2017) investigated automation reliability and error types (FA-prone vs. miss-prone) in a simulated flight task. Participants performed a primary task of maintaining level flight and a secondary resource management task supported by automated aids with high (90%) and low (60%) reliability. Trust was measured at an aggregate level halfway through each session. The results showed that reliability significantly affected compliance in the FA-prone condition, with participants more likely to comply with the highly reliable systems. In contrast, in the miss-prone condition, reliability primarily affected reliance, with greater reliance observed on highly reliable systems. Additionally, FAs had a stronger impact on trust than misses; trust mediated the relationship between FAs and compliance but not between misses and reliance (Chancey et al., 2017).
Other research indicates that misses may cause operators to trust automation less. For instance, in a study simulating an unmanned aerial vehicle mission with an automation-assisted secondary weapon-deployment task, Davenport and Bustamante (2010) investigated participants’ trust, reliance, and compliance following FA-prone and miss-prone aid. Trust was assessed through postsession questionnaires, revealing a greater trust decrement for systems with more misses compared to FAs. Compliance was greater for the miss-prone aid, while reliance was greater for the FA-prone aid (Davenport & Bustamante, 2010). Conversely, other studies indicate that operators may exhibit lower trust in systems with a high frequency of FAs, which may be attributed to the heightened prominence of FAs that reduces the credibility as operators need to actively verify the presence of errors, making the error more salient (Breznitz, 2013; Johnson et al., 2004).
Some studies implicitly assessed compliance and reliance using performance and reaction time metrics. Dixon et al. (2007) examined error types in tracking and system monitoring tasks. Participants were grouped by automation aid type: no help, perfectly reliable aid, FA-prone aid (60% reliability), and miss-prone aid (60% reliability). Reliance was evaluated through performance deficits, while compliance was measured by comparing response times to those observed in the perfectly reliable aid condition. Results indicated that the FA-prone system reduced both compliance and reliance, while the miss-prone system only reduced reliance. In the FA-prone condition, failure detection rates and response times in the monitoring task were worse than in the perfectly reliable automation condition, reflecting reduced compliance. Both error types affected reliance as evidenced by poorer tracking task performance after silent automation trials. Notably, the FA-prone condition resulted in lower performance and longer detection times compared to the miss-prone condition (Dixon et al., 2007). In Sanchez et al. (2014)’s multi-task simulation experiment, participants performed a collision avoidance driving task supported by 94.5% reliable automation and a secondary tracking task. Reliance was assessed based on whether participants chose to double-check after receiving support from the automated aid. Results revealed a trend of increasing reliance in the FA condition as participants became more familiarized with automation, whereas reliance decreased in the miss condition (Sanchez et al., 2014).
In high-stakes scenarios where the consequences of missing critical events could be catastrophic, automation thresholds are often calibrated to favor FAs to minimize the chance of overlooking abnormalities (Sanchez et al., 2014; Sorkin & Woods, 1985). However, excessive FAs may affect trust more than misses, leading to disuse (neglect or under-dependence), deviating from the original purpose (Chancey et al., 2017; Dixon & Wickens, 2006; Parasuraman & Riley, 1997). These studies treated the error type (FA-prone and miss-prone) as a between-subject variable. Future research could benefit from evaluating within-subject differences to provide a more comprehensive understanding of human behavioral patterns in response to automation errors.
Properties of Trust Dynamics
Over the past 30 years, many researchers have investigated people’s trust in automated/autonomous and AI systems. Historically, most studies have approached trust from a snapshot view, typically using end-of-experiment questionnaires to evaluate trust levels. Research within this view has identified many factors that can influence people’s trust in these systems (Hoff & Bashir, 2015; Kaplan et al., 2023). More recently, acknowledging that a person’s trust can change dynamically while interacting with automated/autonomous technologies, there is a shift of research focus from snapshot trust to trust dynamics—how humans’ trust in autonomy forms and evolves due to moment-to-moment interaction with automated/autonomous technologies (de Visser et al., 2020; Wischnewski et al., 2023; Yang, Guo, & Schemanske, 2023; Yang, Schemanske, & Searle, 2023).
One body of research on trust dynamics explores how trust can be violated and restored after trust violation. Trust violations happen after negative experiences (false alarms and misses), which substantially decreases trust to a level below the original trust level (Baker et al., 2018; Esterwood & Robert, 2022; Esterwood & Robert, 2023; P. H. Kim et al., 2004; T. Kim & Song, 2021; Lewicki & Brinsfield, 2017; Sebo et al., 2019). Some trust violation research suggests that misses may lead to lower trust in automation. For example, Azevedo-Sa et al. (2020) investigated how failures in semi-autonomous driving systems influence drivers’ trust. Participants engaged in a nondriving task in a semi-autonomous vehicle, which occasionally provided FAs or missed obstacles. Trust dynamics were evaluated after each interaction, revealing that misses had a more harmful effect on trust than FAs (Azevedo-Sa et al., 2020). In contrast, other studies suggest no differences between error types. For instance, Guzman-Bonilla and Patton (2024) investigated participants’ responses to automation errors (FAs or misses) during a block pair matching task. Trust was measured after each block, and their findings indicated that error type did not affect the participants’ trust (Guzman-Bonilla & Patton, 2024). After trust violations occur, efforts can be made to restore trust, and these efforts often involve various actions/strategies such as apologies (Kohn et al., 2019; Mahmood et al., 2022; Natarajan & Gombolay, 2020), denials (Kohn et al., 2019), explanations (Ashktorab et al., 2019; M. Faas et al., 2021; Natarajan & Gombolay, 2020), and promises (Albayram et al., 2020).
The second body of research is focused on developing real-time trust prediction models (Bhat et al., 2022; M. Chen et al., 2018; Guo & Yang, 2021; Xu & Dudek, 2015). Examples of trust prediction models include the online probabilistic trust inference model (OPTIMo) by Xu and Dudek (2015), the Beta random variable model by Guo and Yang (2021), and the Bayesian model combining Gaussian processes and recurrent neural networks by Soh et al. (2020). For a detailed review, please refer to Kok and Soh (2020).
The third body of research, which is examined in this study, uncovers general properties that govern how a person’s trust in automated/autonomous and AI systems changes over time. Recently, Yang, Guo, and Schemanske (2023) summarized three key properties of trust dynamics: continuity (Trust at the present moment i is significantly associated with trust at the previous moment i − 1.), negativity bias (Negative experiences due to autonomy failures have a greater influence on trust than positive experiences due to autonomy successes), and stabilization (A person’s trust will stabilize over repeated interactions with the same autonomy). The first two properties have been reported consistently in prior research (Lee & Moray, 1992; Manzey et al., 2012; Yang et al., 2017; Yang, Schemanske, & Searle, 2023). The last property, stabilization, was first empirically found in Yang, Guo, and Schemanske (2023). Using these properties, a predictive computational model was developed, which claims that trust at any point follows a Beta distribution (Guo & Yang, 2021). This model surpasses previous models in prediction accuracy while ensuring generalizability and explanatory power, indicating the importance of the three properties of trust dynamics.
The Present Study
Description of the Five Cases and Two Outcomes. Bold Text Indicates Potential Incorrect Outcomes Resulting From Automation Errors.
The aims of the study are multifaceted. The primary interest of the study is to investigate the influence of AI predictions following wrong initial decisions. Specifically, to compare between patterns WC (i.e., Case C), WI (i.e., Case D), and WI ref (i.e., Case E).
Both patterns WI and WI
ref
involve the wrong medication being filled and subsequently misidentified by the AI system. The critical difference emerges in the outcome of the AI’s error: in pattern WI, the AI’s mistaken identification of medication Y as Z prompts a reevaluation of the dispensed medication, potentially averting a mistake. Conversely, in pattern WI
ref
, the AI incorrectly identifies medication Y as X, misleading the human operator and providing false reassurance, thereby compounding the error. Therefore, we hypothesize:
In terms of trust change, we hypothesize both pattern WI and pattern WI
ref
will lead to trust decrement compared to trust increment for pattern WC. In addition, there will be a more significant trust decrement for pattern WI
ref
.
Regarding the time taken to make a final decision after receiving the AI’s prediction, we hypothesize an interaction between the three patterns and the final outcome. As mentioned earlier, pattern WI
ref
misleads the human operator and provides false reassurance. Therefore, we speculate that when participants are indeed tricked by pattern WI
ref
, they would react very fast. On the contrary, it would take the longest time for a participant to recognize and rectify the error in pattern WI because the incorrect prediction does not align with either the reference or the initial answer.
Along with the primary interest, we wish to provide further evidence for the continuity (
Method
This research complied with the American Psychological Association code of ethics and was exempt from the Institutional Review Board oversight at the University of Michigan (HUM00230326). Informed consent was obtained from each participant.
Participants
A total of 35 University of Michigan undergraduate and graduate students (average age = 22.43 years, SD = 3.27) participated in the experiment. Participants were required to have a normal or corrected-to-normal vision. Participants received a compensation of 10 dollars base rate with a bonus of up to 10 dollars based on their performance. Participants completed a three-dimensional spatial visualization and recognition task (J. Kim et al., 2023; J. Y. Kim et al., 2024; Vandenberg & Kuse, 1978), assisted by an AI. In each trial, participants were presented with a reference image selected from a pool of 30 images. They were then shown five options and asked to choose the one that matched the reference. Following their selection, the simulated AI predicted the shape of the participant’s chosen image. Finally, participants indicated whether their initial selection was correct. This workflow mirrors a medication dispensing task, where a pharmacist first receives a prescription (e.g., vitamin C) and retrieves the corresponding medication from an inventory containing hundreds of options. The retrieved medication is then verified for accuracy by pharmacy technicians or an AI system, comparing it to the prescription order. Based on the verification, the pharmacist decides whether to dispense the medication or to rectify errors by retrieving the appropriate item.
Experimental Apparatus and Stimuli
Stimuli Development
The study employed a simulated mental rotation task (MRT) and we followed the study of Shepard and Metzler (1971) to develop stimuli. We created 30 three-dimensional (3D) objects, half with 10 cubes and another half with 8 cubes. For each object, we created a reference two-dimensional image of the object, positioned at a specific rotation (see Figure 3). Subsequently, for each reference, we created 14 rotated images by rotating the 3D object every 45 degrees along the horizontal and vertical axes. This resulted in 30 reference images, each with 14 corresponding rotated images, denoted as correct alternatives (of the reference). Illustration of stimuli development. After creating the (a) reference images, one (b) mirrored image, fourteen 45 degree (c) horizontal axis rotated figures, and fourteen 45 degree (d) vertical axis rotated figures were created for each reference image.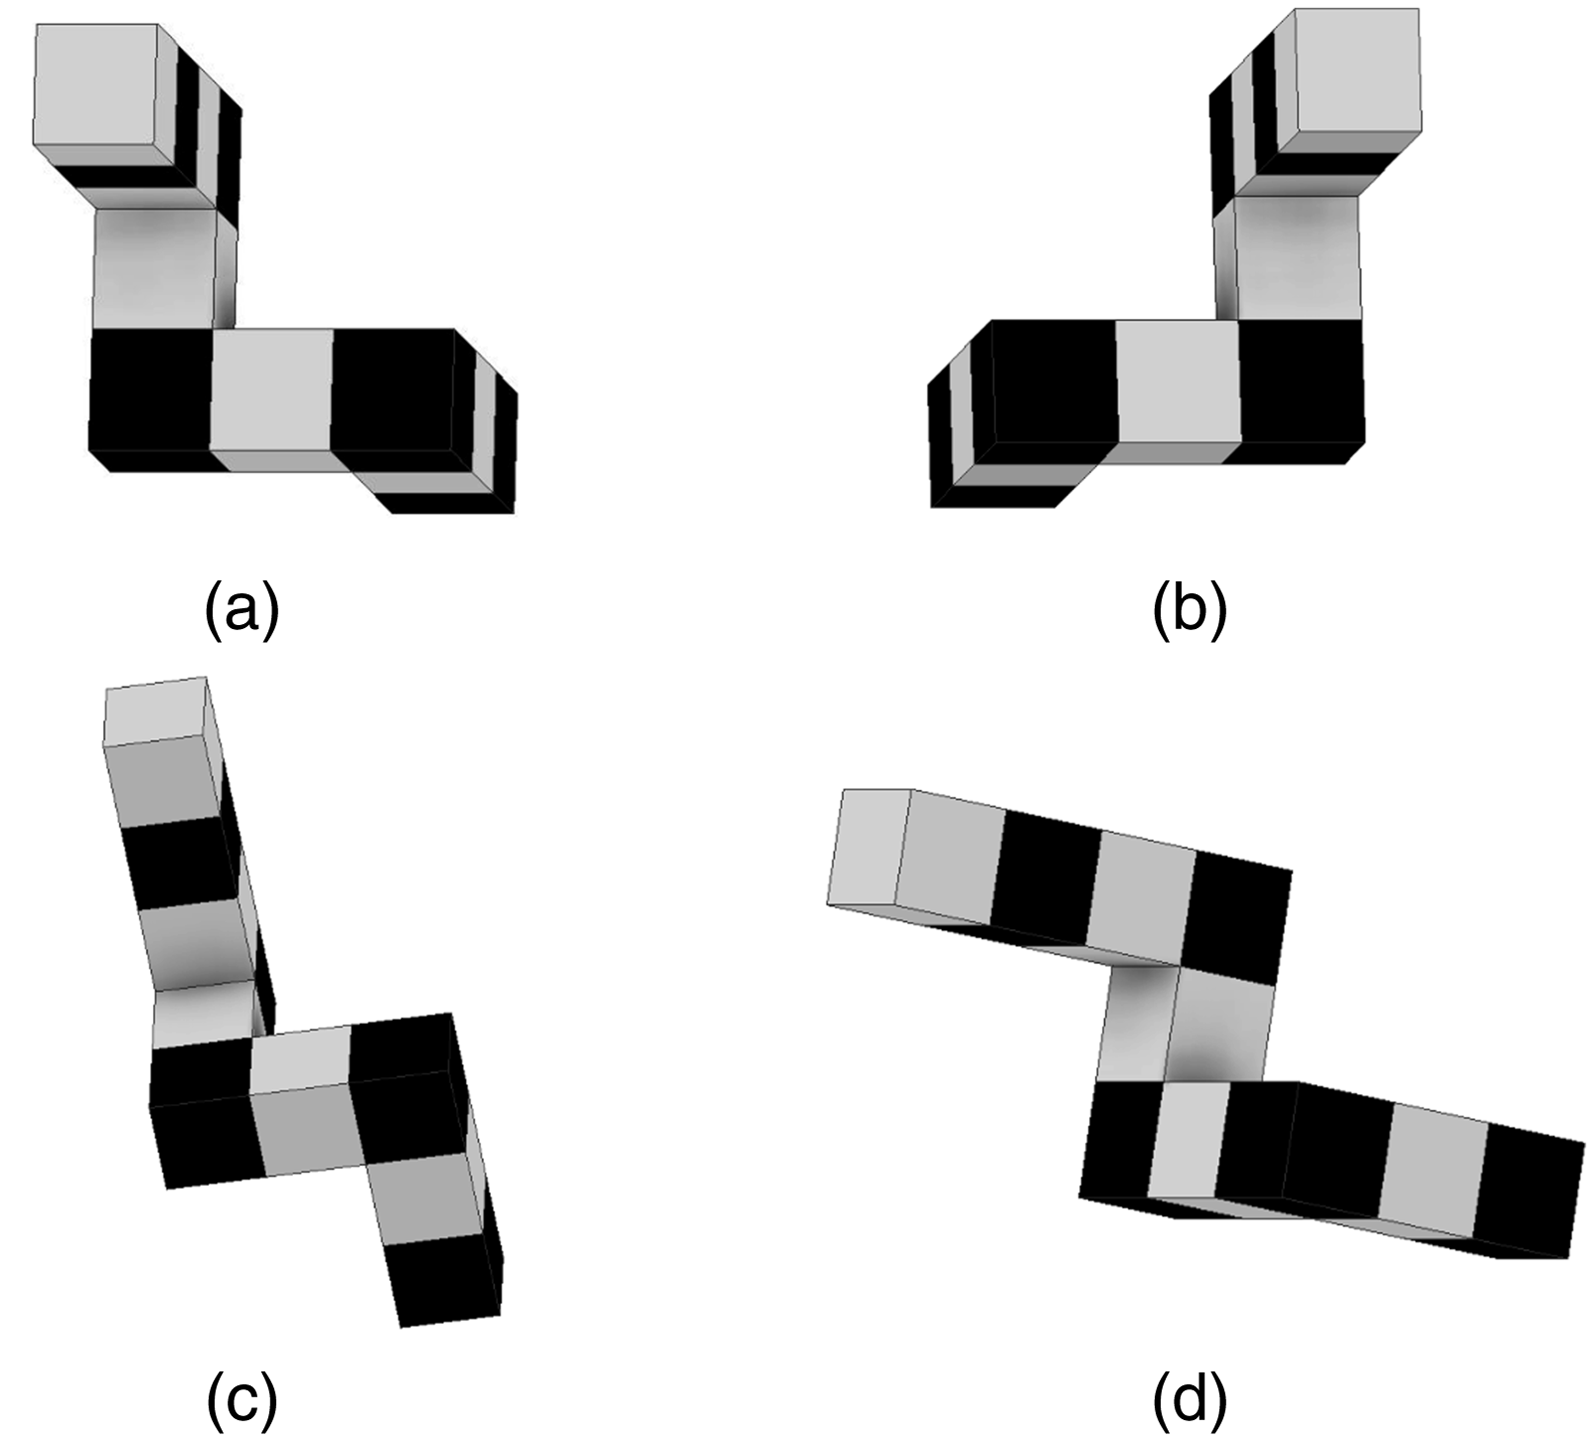
The difficulty of the stimuli was determined through a separate study using Qualtrics, and the participants were recruited via Amazon Mechanical Turk (MTurk). Following Shepard and Metzler (1971)’s mental rotation study, participants viewed multiple image pairs. Each left image was a randomly chosen reference image, and the right image was either a correct alternative, a distractor, or the reference image itself (Figure 4). Distractors were randomly chosen from the remaining 29 reference images, which included 14 images with the same cube amount as the reference image (i.e., 8 or 10) and 15 images with a different cube amount. Participants had 10 seconds to identify whether the image pairs were the same or different. Data from participants who failed to match the validation pairs (reference-reference image pairs) correctly were discarded. The mean hit rate determined stimuli difficulty. For the beta test, participants were asked to determine whether the image pairs are the same items in different rotations (by clicking “Yes, they are the same item”) or different items (by clicking “No, they are different”) within 10 seconds.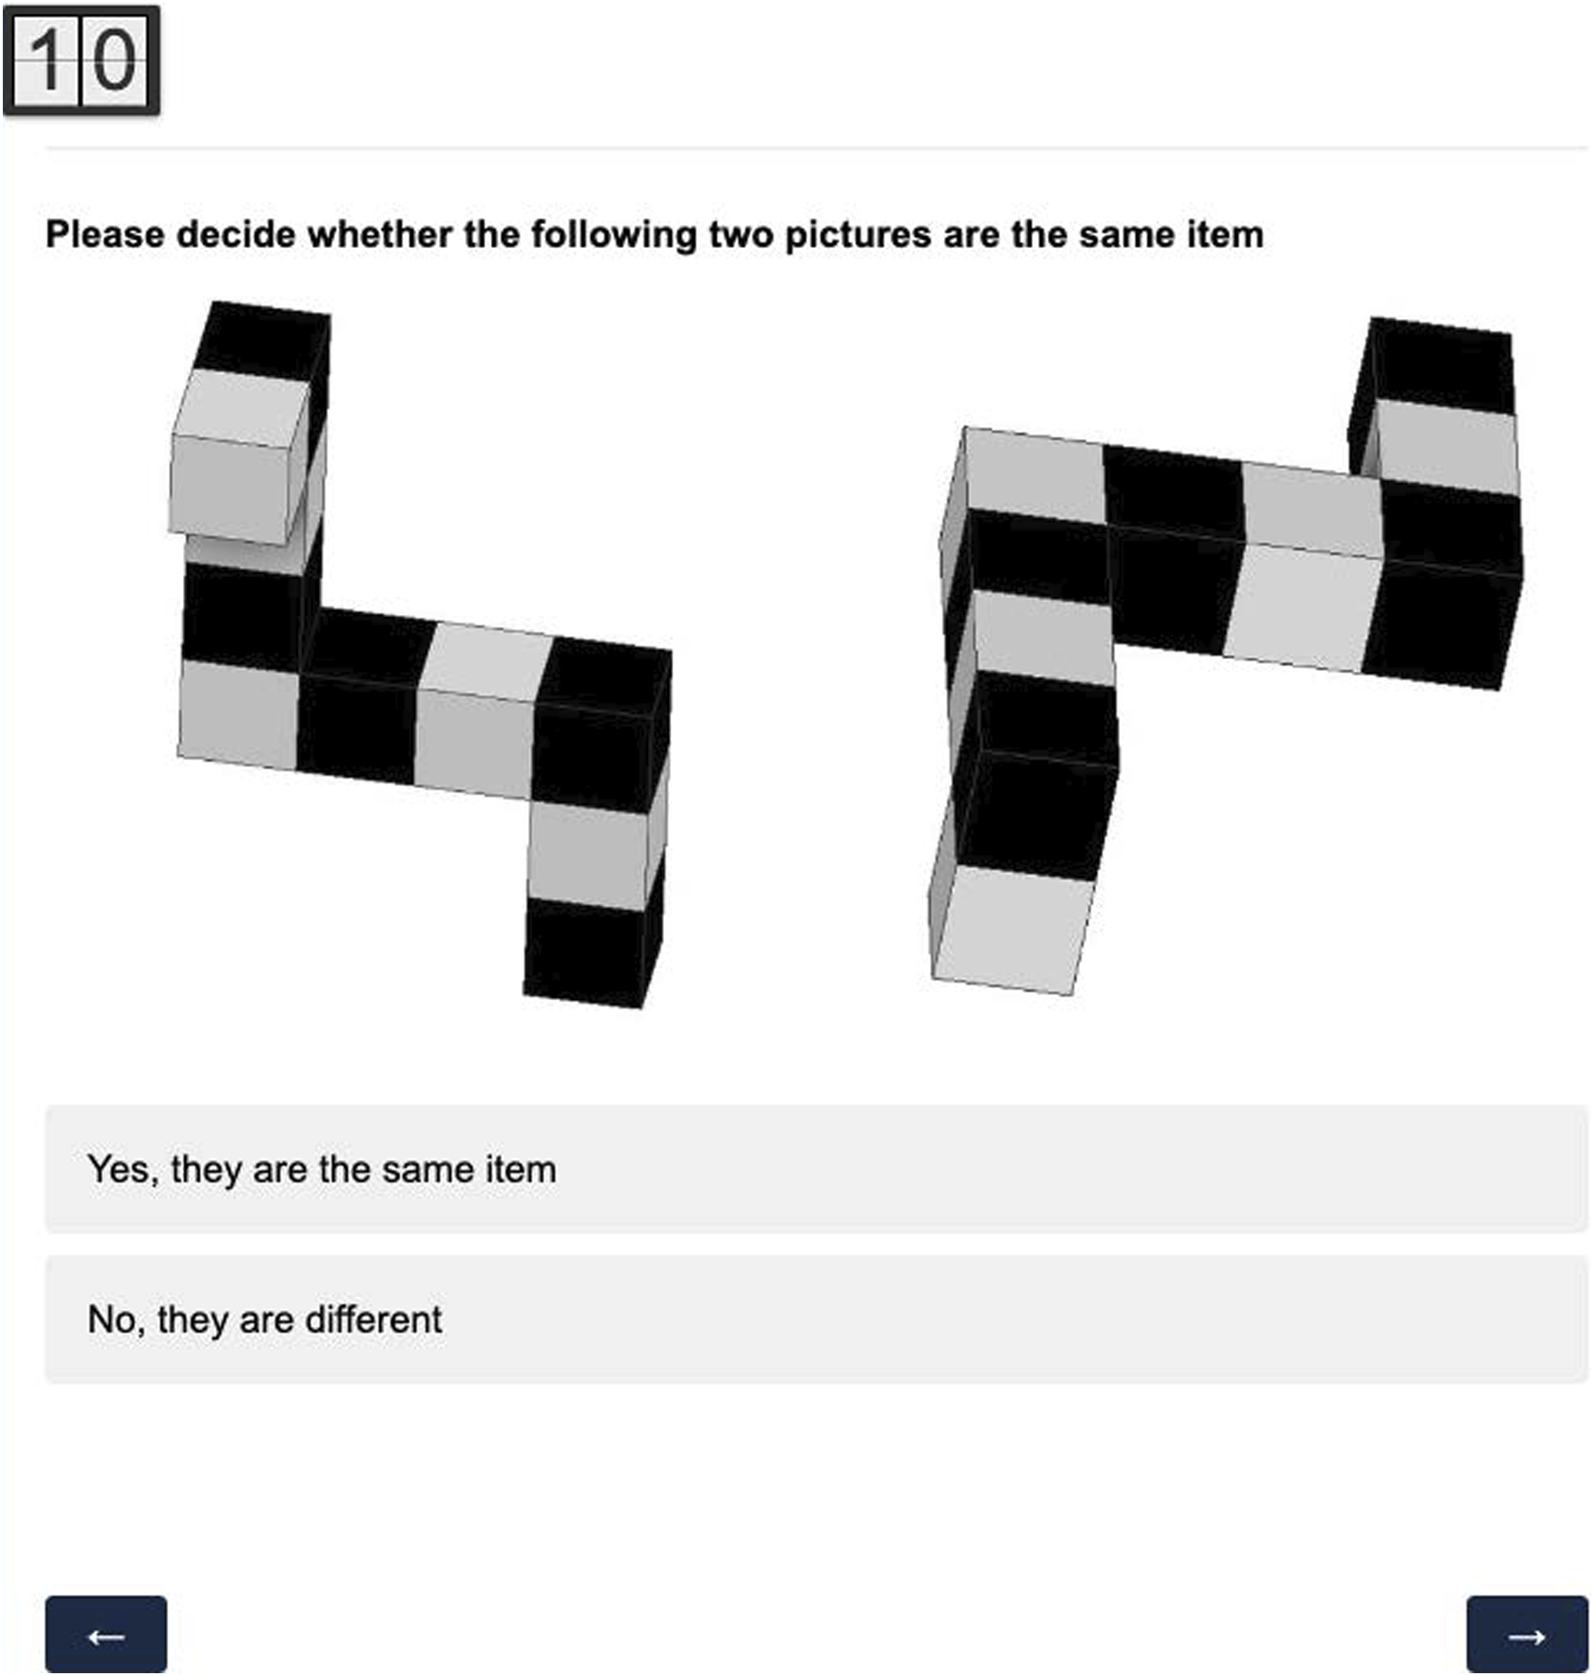
Experimental Task
The task was adapted from a three-dimensional spatial visualization test (Vandenberg & Kuse, 1978) and was developed using the Python Tkinter package. Figure 5 shows the flowchart of the experimental task. Flowchart of the experiment.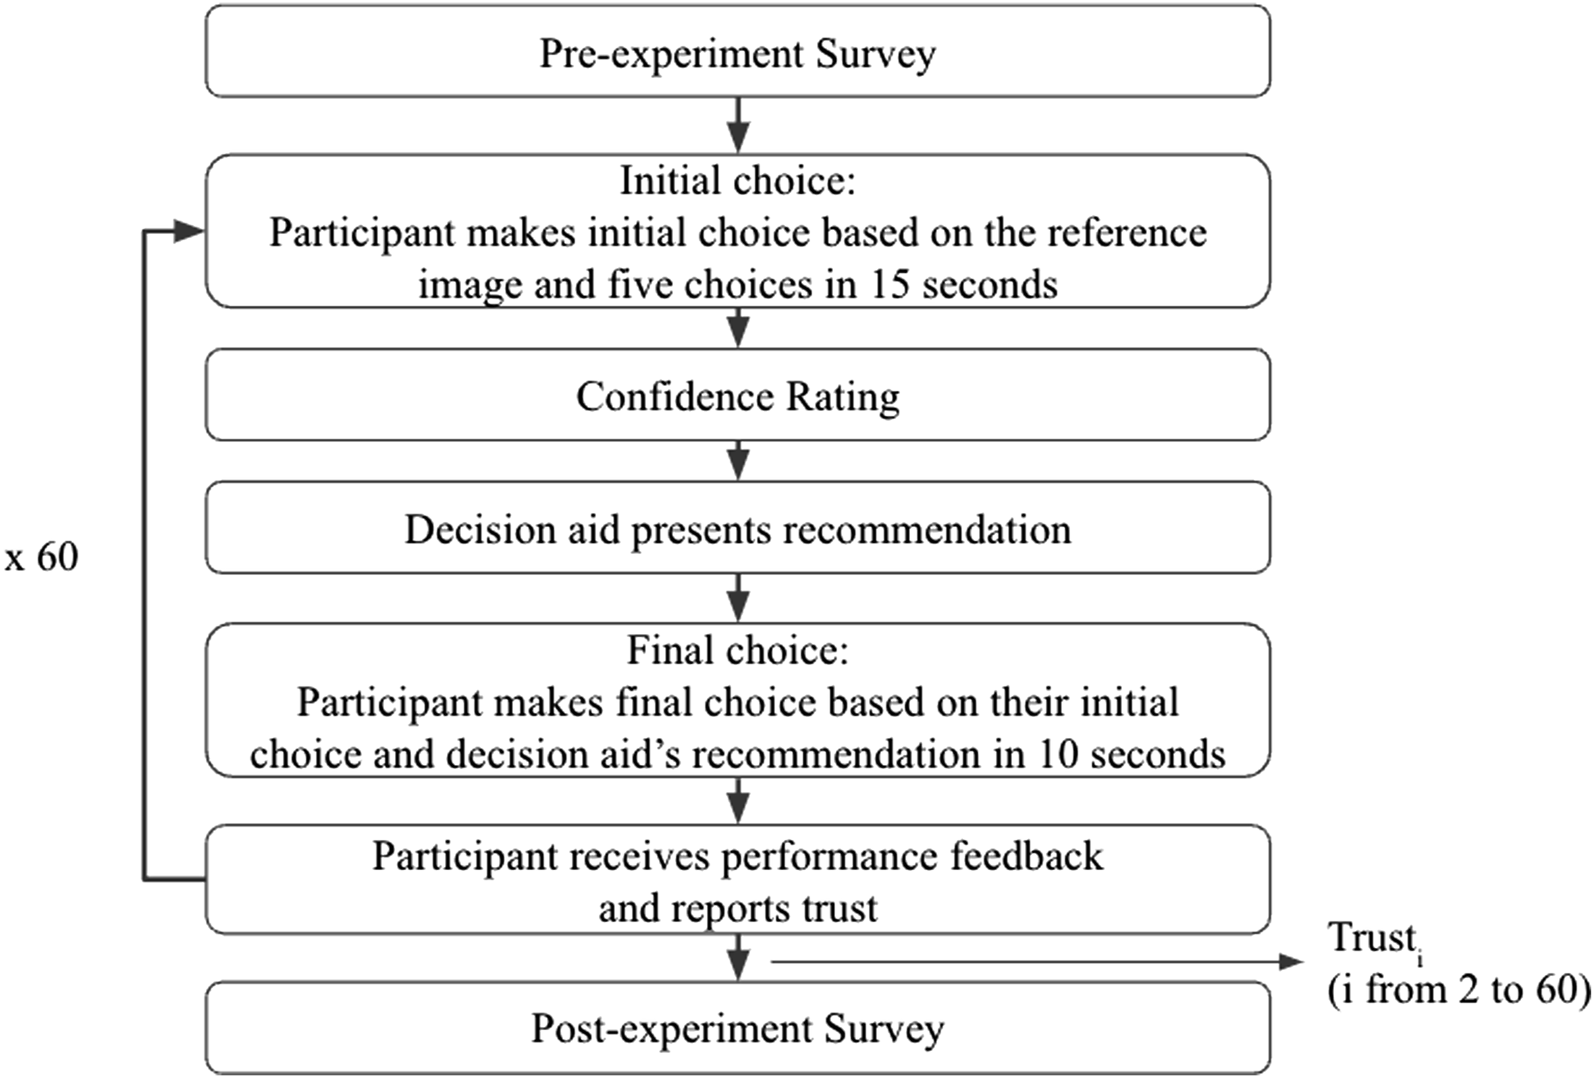
Before the experiment, participants completed a demographics survey (i.e., age and gender) and a trust propensity survey estimating their propensity to trust automation (Merritt et al., 2013).
During the experiment, participants performed the MRT, which consisted of 60 trials presented in random order. Each trial contained several steps. First, participants were shown a reference image and five choices, containing one correct alternative and four distractors (Figure 6(a)). The correct alternative was identical to the reference image in structure but was shown in a rotated position. Two distractors were randomly chosen from rotated mirrored images of the reference and the other two were randomly chosen from rotated images of other reference images. Participants were asked to choose the image that portrayed the same 3D object as the one portrayed in the reference image, as accurately as possible and within 15 seconds, then to click the “Next” button. The 15 second duration was determined based on pilot testing. If no selection was made within the time limit, the text on the initial choice page displayed “You did not make a selection within the time limit” (Figure 6(b)), and participants needed to click the “Next” button to start the next trial. Participants were asked to (a) make their initial answer choice within 15 seconds. (b) If no selection was made within the time limit, participants needed to skip to the next trial.
After making the initial choice, participants rated their confidence in their initial choice using a visual analog scale, with the leftmost point labeled “Not confident at all” and the rightmost point “Absolutely confident” (Figure 7). Participants rated their confidence using a visual analog scale.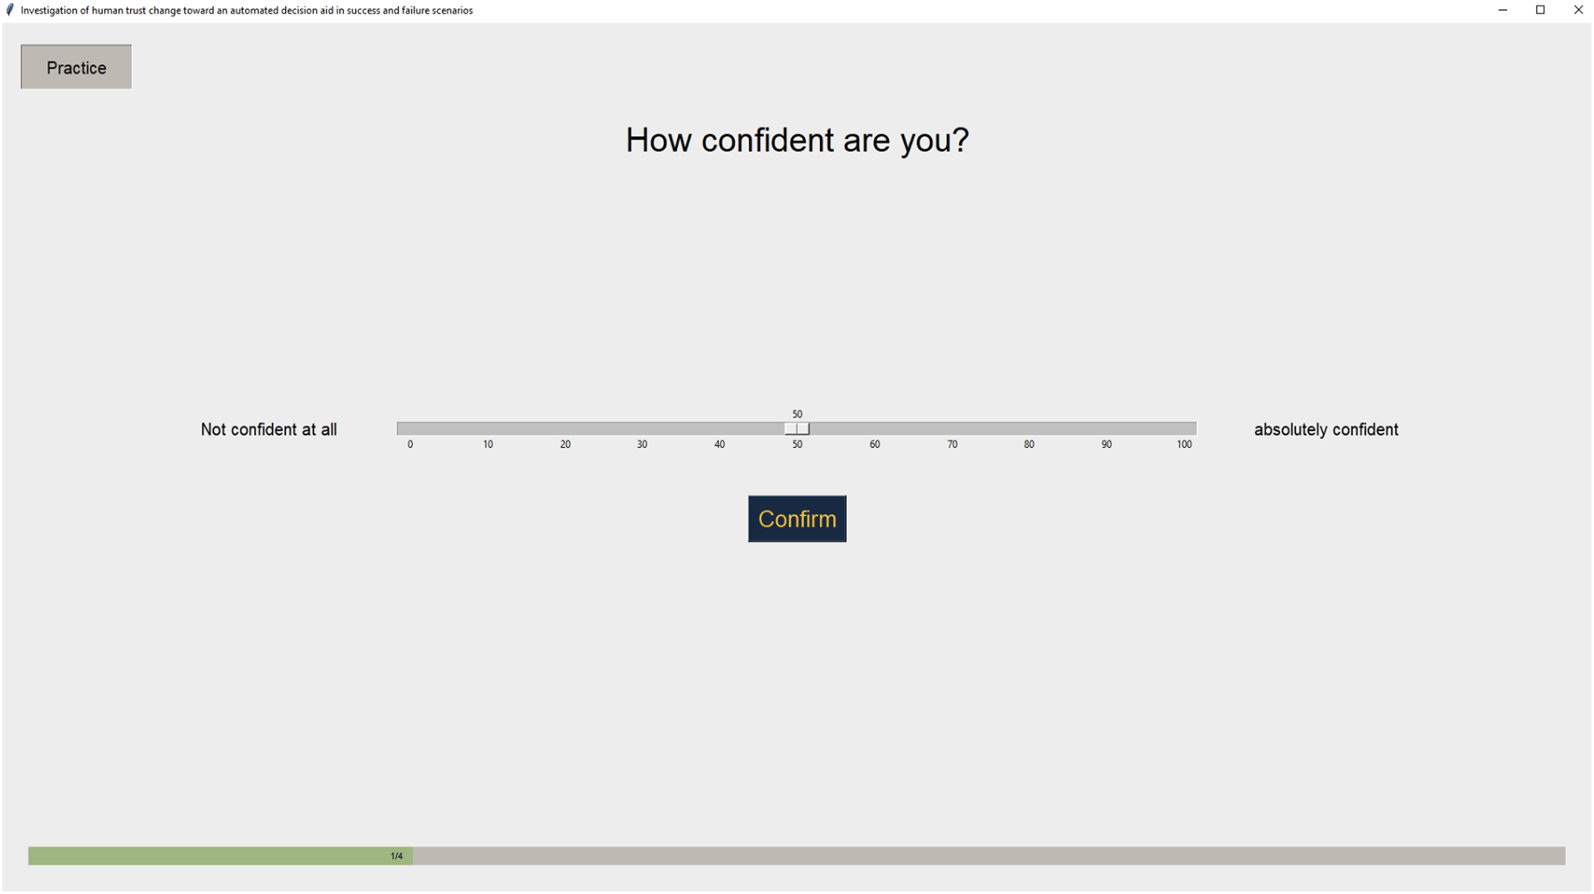
Next, participants were shown the AI’s prediction, displayed below their initial selection to illustrate the rotation of the AI-predicted shape. In Figure 8(a), the participant initially selected the third image (indicated by an arrow), but the AI misidentified the initial selection and presented the reference image of its predicted shape (i.e., Case B described in the Introduction section). In contrast, in Figure 8(b), the participant initially selected the fifth image (indicated by an arrow). The AI misidentified the initial selection and displayed the reference image of the correct alternative (i.e., Case E described in the introduction). Participants were presented with the AI system’s recognition and chose between sticking with or rejecting their initial choice within 10 seconds. If no selection was made, they were skipped to the next trial. (a) Right initial choice, incorrect AI prediction (Case B, Pattern RI). (b) Wrong initial choice, incorrect AI prediction (Case E, Pattern WI_Ref).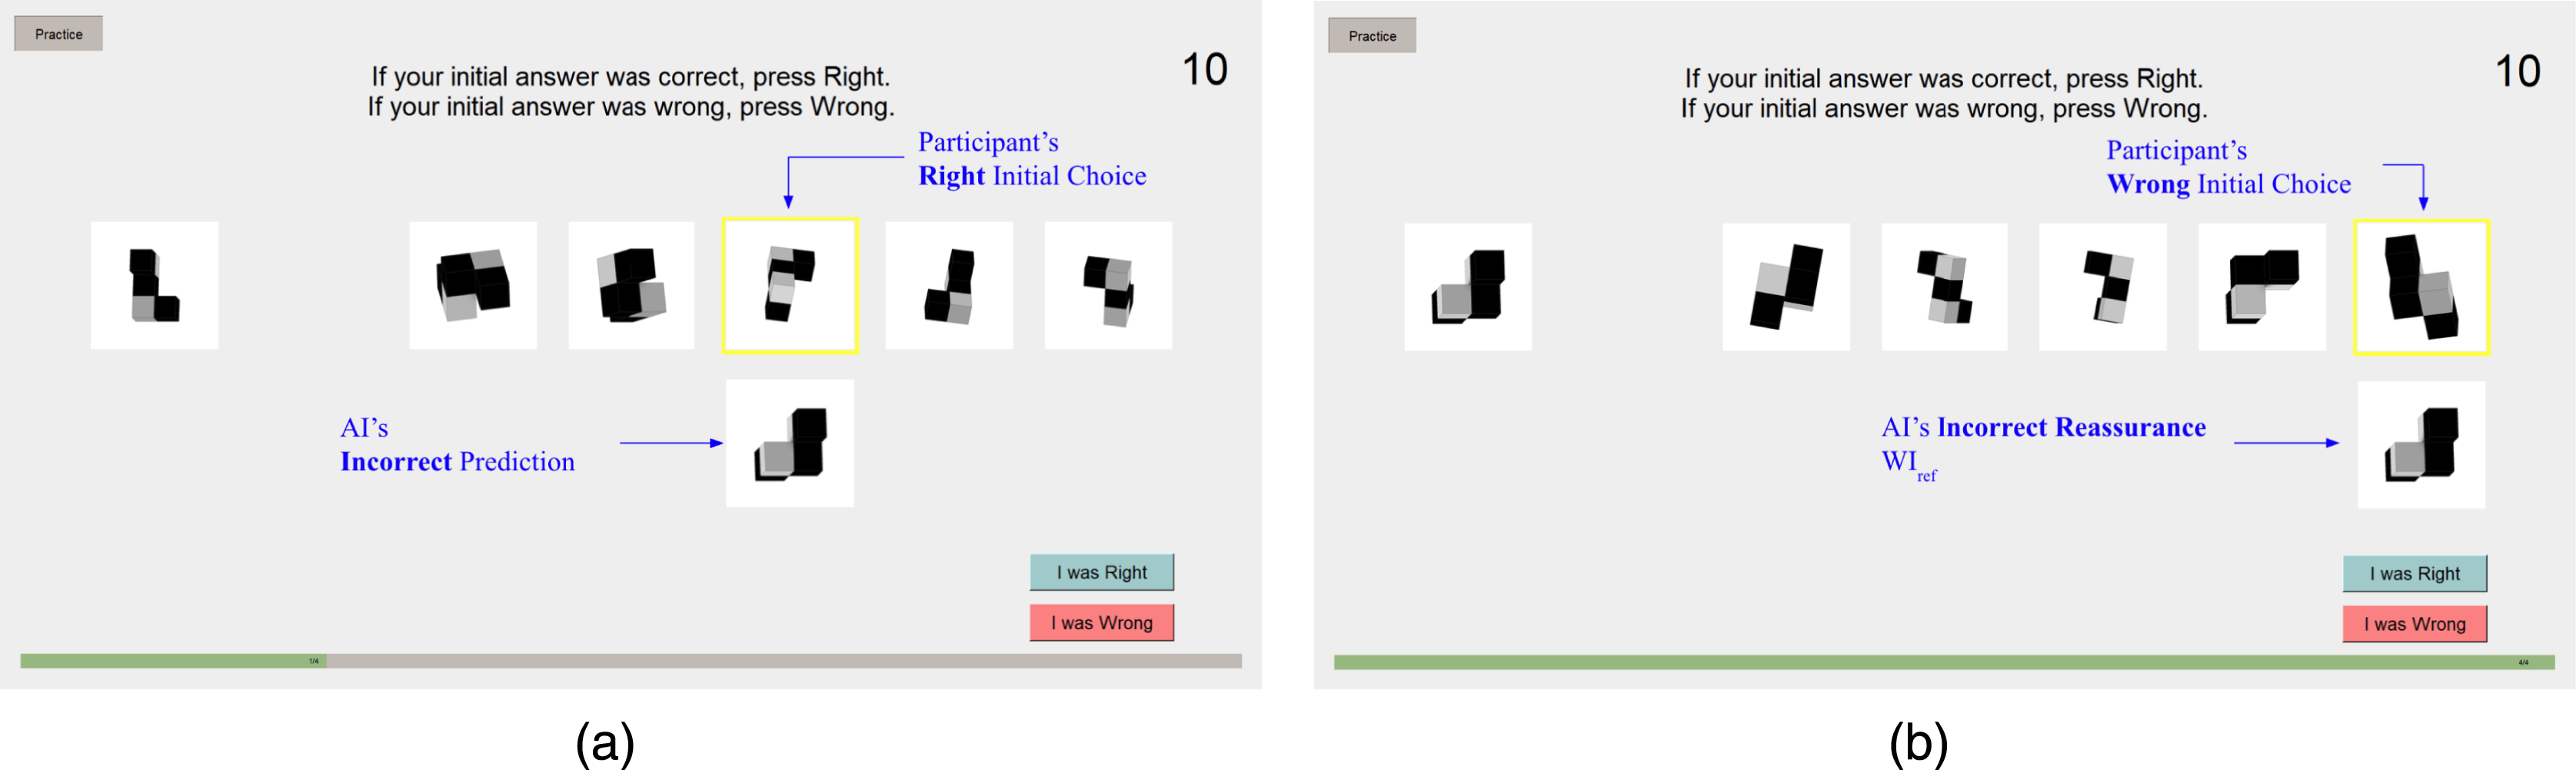
After viewing the AI’s prediction, participants chose between sticking with their initial answer by clicking “I was right” or rejecting their initial answer by clicking “I was wrong” within 10 seconds. Similarly, the duration was determined based on a pilot study. If no selection was made in 10 seconds, the text on the final choice page displayed a message similar to Figure 6(b), and participants needed to press the “Next” button to move to the next trial.
Participants were then presented with their performance feedback and the validity of AI’s prediction (Figure 9). Participants were presented with the performance feedback page, showing their performance on the initial and final answer choices and the validity of the AI’s prediction. (a) Correct AI prediction. (b) Incorrect AI prediction.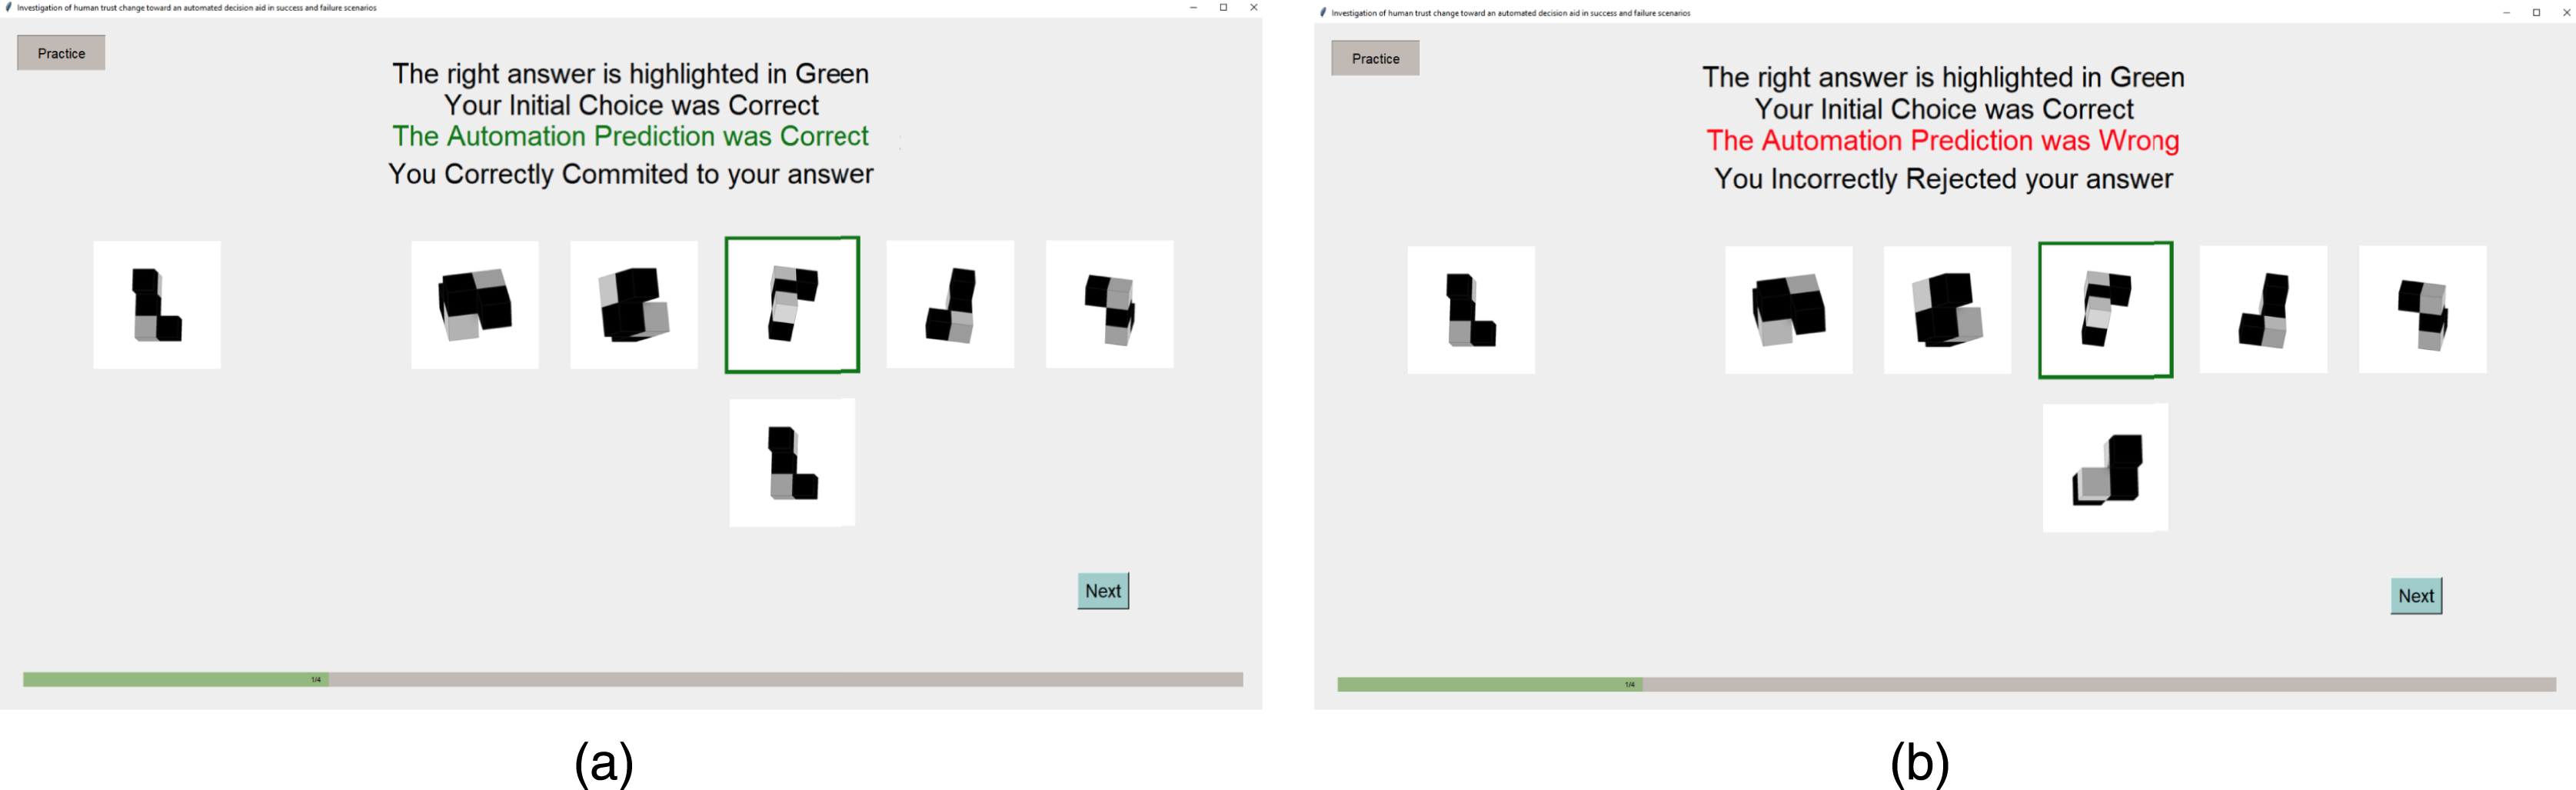
At last, participants rated their trust in and perceived reliability of the AI system using a visual analog scale (Figure 10). Following Yang, Schemanske, and Searle (2023)’s approach, participants of this experiment were asked to rate their trust after each trial. The leftmost anchor of the trust scale was labeled “I don’t trust the decision aid at all” and the rightmost anchor of the trust scale was labeled “I absolutely trust the decision aid.” The perceived reliability rating was on a 0 to 100 scale. Participants rated their trust and perceived reliability using a visual analog scale.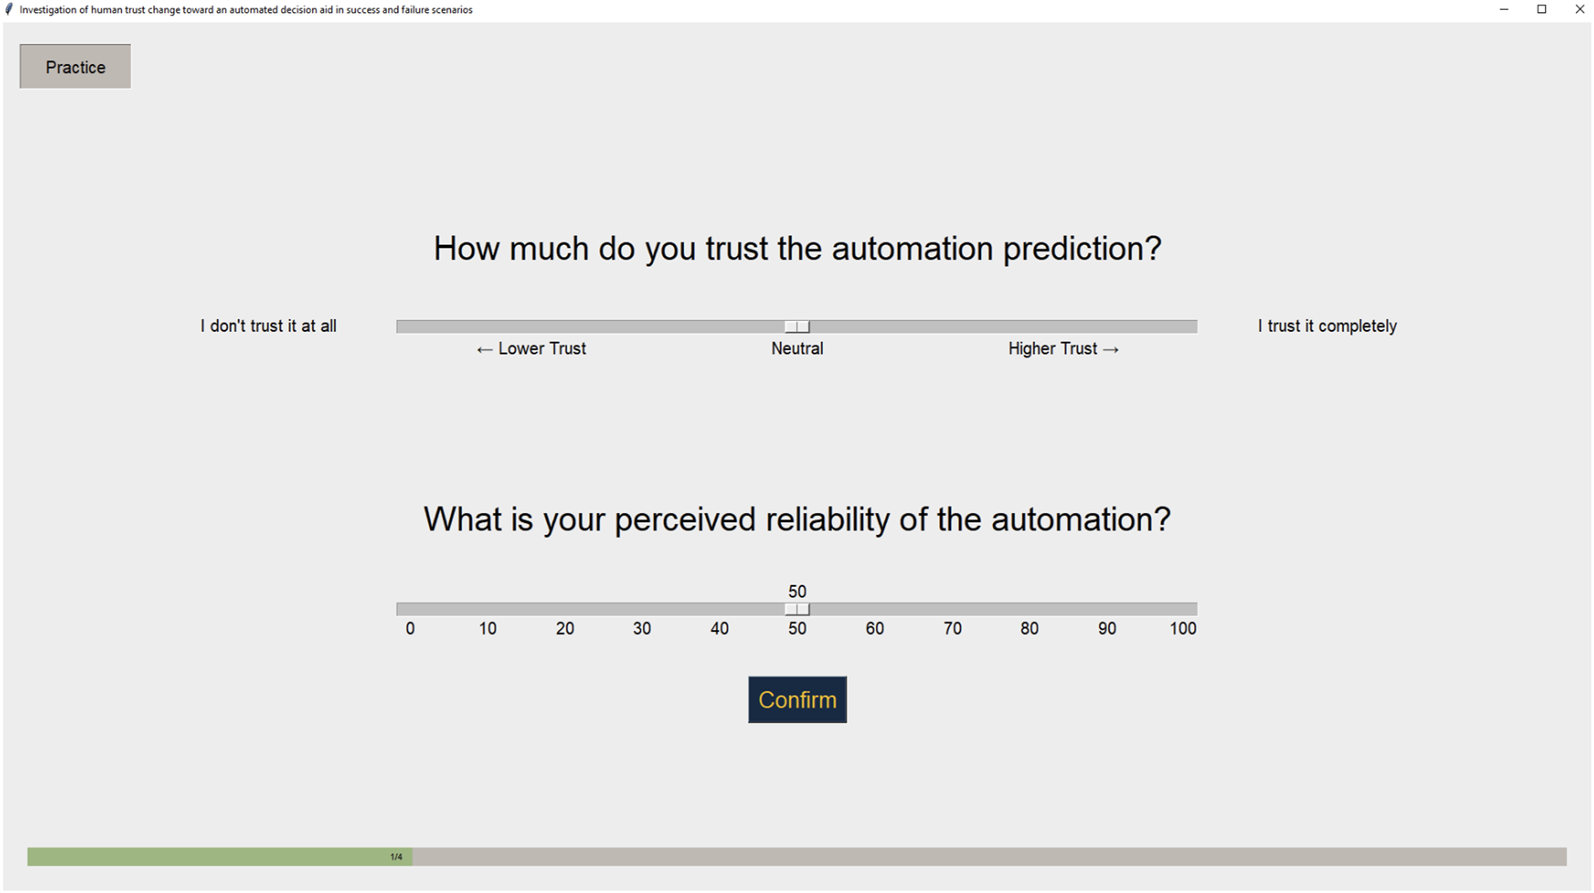
Experimental Design
Mean and SD of Confidence Rating, Trust Adjustment, Final Performance, Final Reaction Time, Number of Patterns, and Number of Participants Grouped by Patterns and Outcomes of Performance.
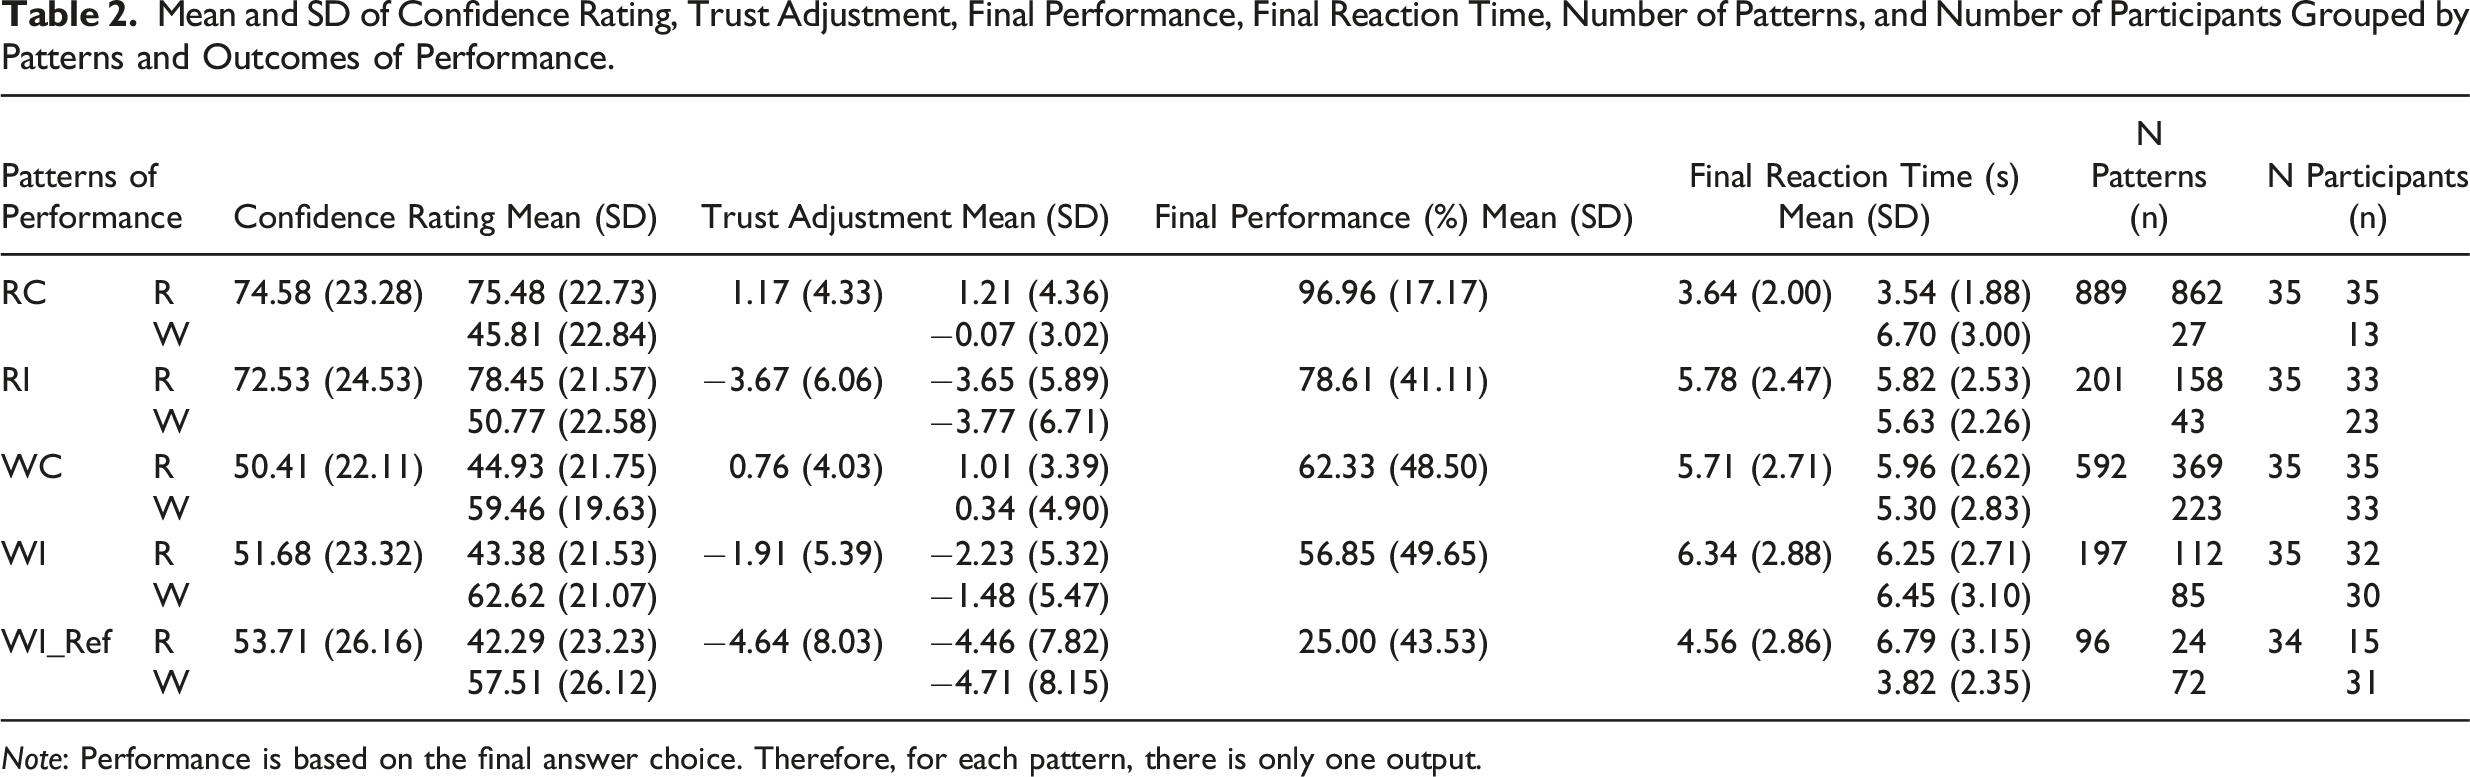
Note: Performance is based on the final answer choice. Therefore, for each pattern, there is only one output.
To induce the occurrence of different patterns, the AI system is set as follows: The AI system made correct recognition 70% of the time, irrespective of whether the participant’s initial choice was right or wrong. Pattern RC (Case A) occurred when the participant’s initial choice was correct, coupled with a correct recognition from the AI system; Pattern WC (Case C) occurred when the participant’s initial choice was wrong, coupled with a correct recognition from the AI system. The AI system made incorrect recognition 20% of the time by recognizing the participant’s selected choice as another shape other than the reference shape. This led to pattern RI (Case B) if the participant’s initial choice was correct and pattern WI (Case D) if the participant’s initial choice was wrong. The AI system recognized the participant’s initially selected choice as the reference shape 10% of the time. This led to pattern RC (Case A) if the participant’s initial choice was right and pattern WI ref (Case E) if the participant’s initial choice was wrong. Therefore, depending on each participant’s initial choice, AI reliability ranged from 70%–80%. This reliability is above the baseline threshold level of around 70% to be perceived as useful (Wickens & Dixon, 2007). In the present study, participants were informed that the AI aid’s recommendations were imperfect, but they were not provided with specific information about its reliability level.
Measures
We are interested in the following measures.
Confidence
After participants completed step 1 of each trial, they rated their confidence in their initial selection on a Visual Analog Scale from 0 to 100. The leftmost anchor was labeled “I am not confident in my answer at all,” and the rightmost anchor was labeled “I absolutely trust the decision aid.”
Trust Adjustment
After each trial i, participants reported their trust(i) in the decision aid. We calculate a trust adjustment as:
Trust adjustment(i) = Trust(i) − Trust(i − 1), where i = 2, 3, …, 60
Since the moment-to-moment trust is reported after each trial, only 59 trust adjustments are obtained from each participant.
Performance
Another dependent variable was the final performance of the experimental task, which was calculated as the percentage of correct final answers (determining the validity of the initial answers) for each pattern for each participant (Figure 8(a)).
Reaction Time
The reaction time was measured in seconds from when the AI prediction appeared until the participant pressed either the “I was right” or “I was wrong” button (Figure 8(a)).
Experimental Procedure
After participants signed the consent form and completed the online demographics and trust propensity surveys (Merritt et al., 2013), they watched a video explaining the experimental task. Participants were informed that the AI aid’s recommendations were imperfect and may or may not be correct. Each participant completed 60 trials. Upon completion, participants completed a postexperiment survey.
Statistical Analysis
We constructed linear mixed-effects models, accounting for random effects of participants, to examine our hypotheses using the “lme4” package in R (Bates et al., 2014). Mixed-effects models have advantages in dealing with repeated measures and missing values and are, therefore, particularly appropriate for our analysis. We used an iterative approach to construct the models. Following the standard procedure for building mixed-effects models (Field et al., 2012), we started simple and gradually added complexity to our models. Using the likelihood ratio test (LRT), comparisons of models were conducted, and the simpler models were used when no significant differences were found. The level of significance for this study was set to α = 0.05.
The mixed-effects model equation is: y
ij
: The outcome variable for participant j under case pattern i. β0: The fixed effect intercept. u0j: The random intercept for the jth participant. CaseB
ij
, CaseC
ij
, CaseD
ij
, CaseE
ij
: Dummy variables for the case patterns, comparing each case to the reference case (i.e., Case A). β1, β2, β3, β4: The fixed effect coefficients for the case patterns (B, C, D, and E) relative to the reference case A. ϵ
ij
: The residual error for participant j in case pattern i.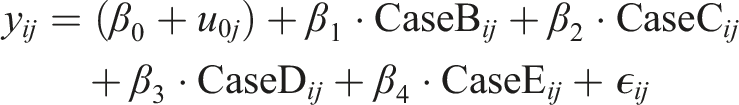
Post hoc t-tests were conducted to analyze the differences between the patterns. The Kenward-Roger method of estimating degrees of freedom was used, which adjusts the variance-covariance matrix of the fixed effects using a Taylor series expansion, then calculates degrees of freedom (Kenward & Roger, 1997). This method is widely recognized in mixed-effects models for its ability to mitigate Type 1 errors, generate precise p-values, and maintain reliability across varying sample sizes (Kuznetsova et al., 2017; Luke, 2017; McNeish & Stapleton, 2016).
Results
After all trials were completed, the number of occurrences for each pattern coupled with the outcome was calculated. As the occurrence of each pattern can only be determined posteriorly, participants might not necessarily display each performance pattern. Table 2 shows the number of occurrences for each performance pattern and the descriptive statistics of all the measurements.
Confidence
Analyzing participants’ data on confidence can be regarded as a check of data quality. We expected that participants would have higher confidence when their initial choices were correct. We organized the patterns into two classifications: right human initial choice (RC, RI) and wrong human initial choice (WC, WI, WI ref ). The confidence rating revealed significant differences between the right (Mean = 72.74, SD = 1.98) and the wrong (Mean = 56.77, SD = 2.00) initial choices (t(1962.72) = −20.20, p < .001).
Comparing Patterns WC, WI, and WI ref
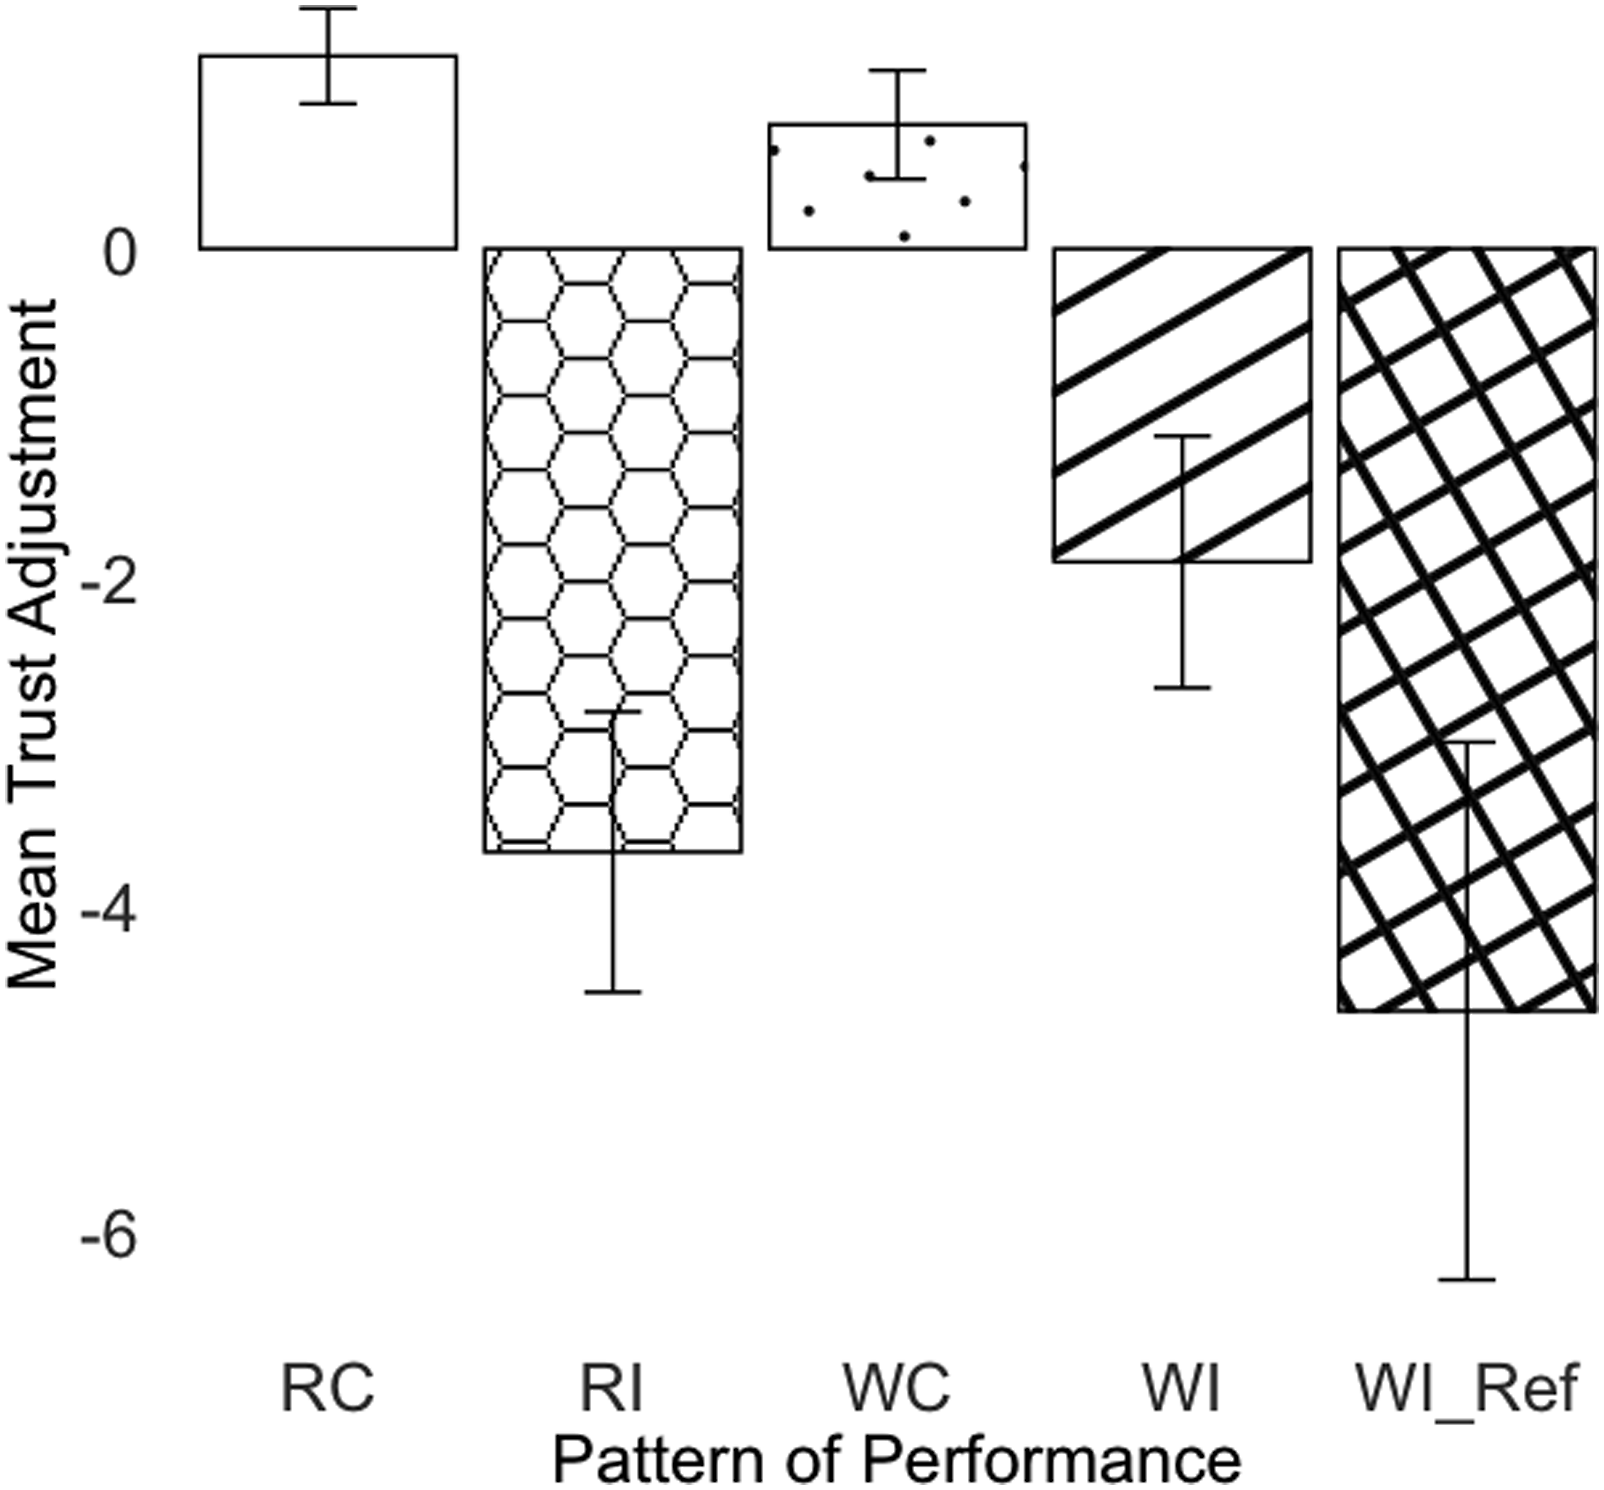
Significance indicators are displayed on figures to highlight the statistical significance between patterns of performance.
Trust Adjustment
There was a significant difference between the three patterns on trust adjustment (F(2, 875.68) = 61.2, p < .001). Pattern WC had a significantly larger trust increase than pattern WI (t(875) = 6.57, p < .001) and pattern WI
ref
(t(878) = 9.96, p < .001). Pattern WI
ref
had a significantly greater trust decrement than pattern WI (t(876) = −4.46, p < .001) (Figure 11). Trust adjustment by patterns of performance. The error bars represent +/− 2 standard errors.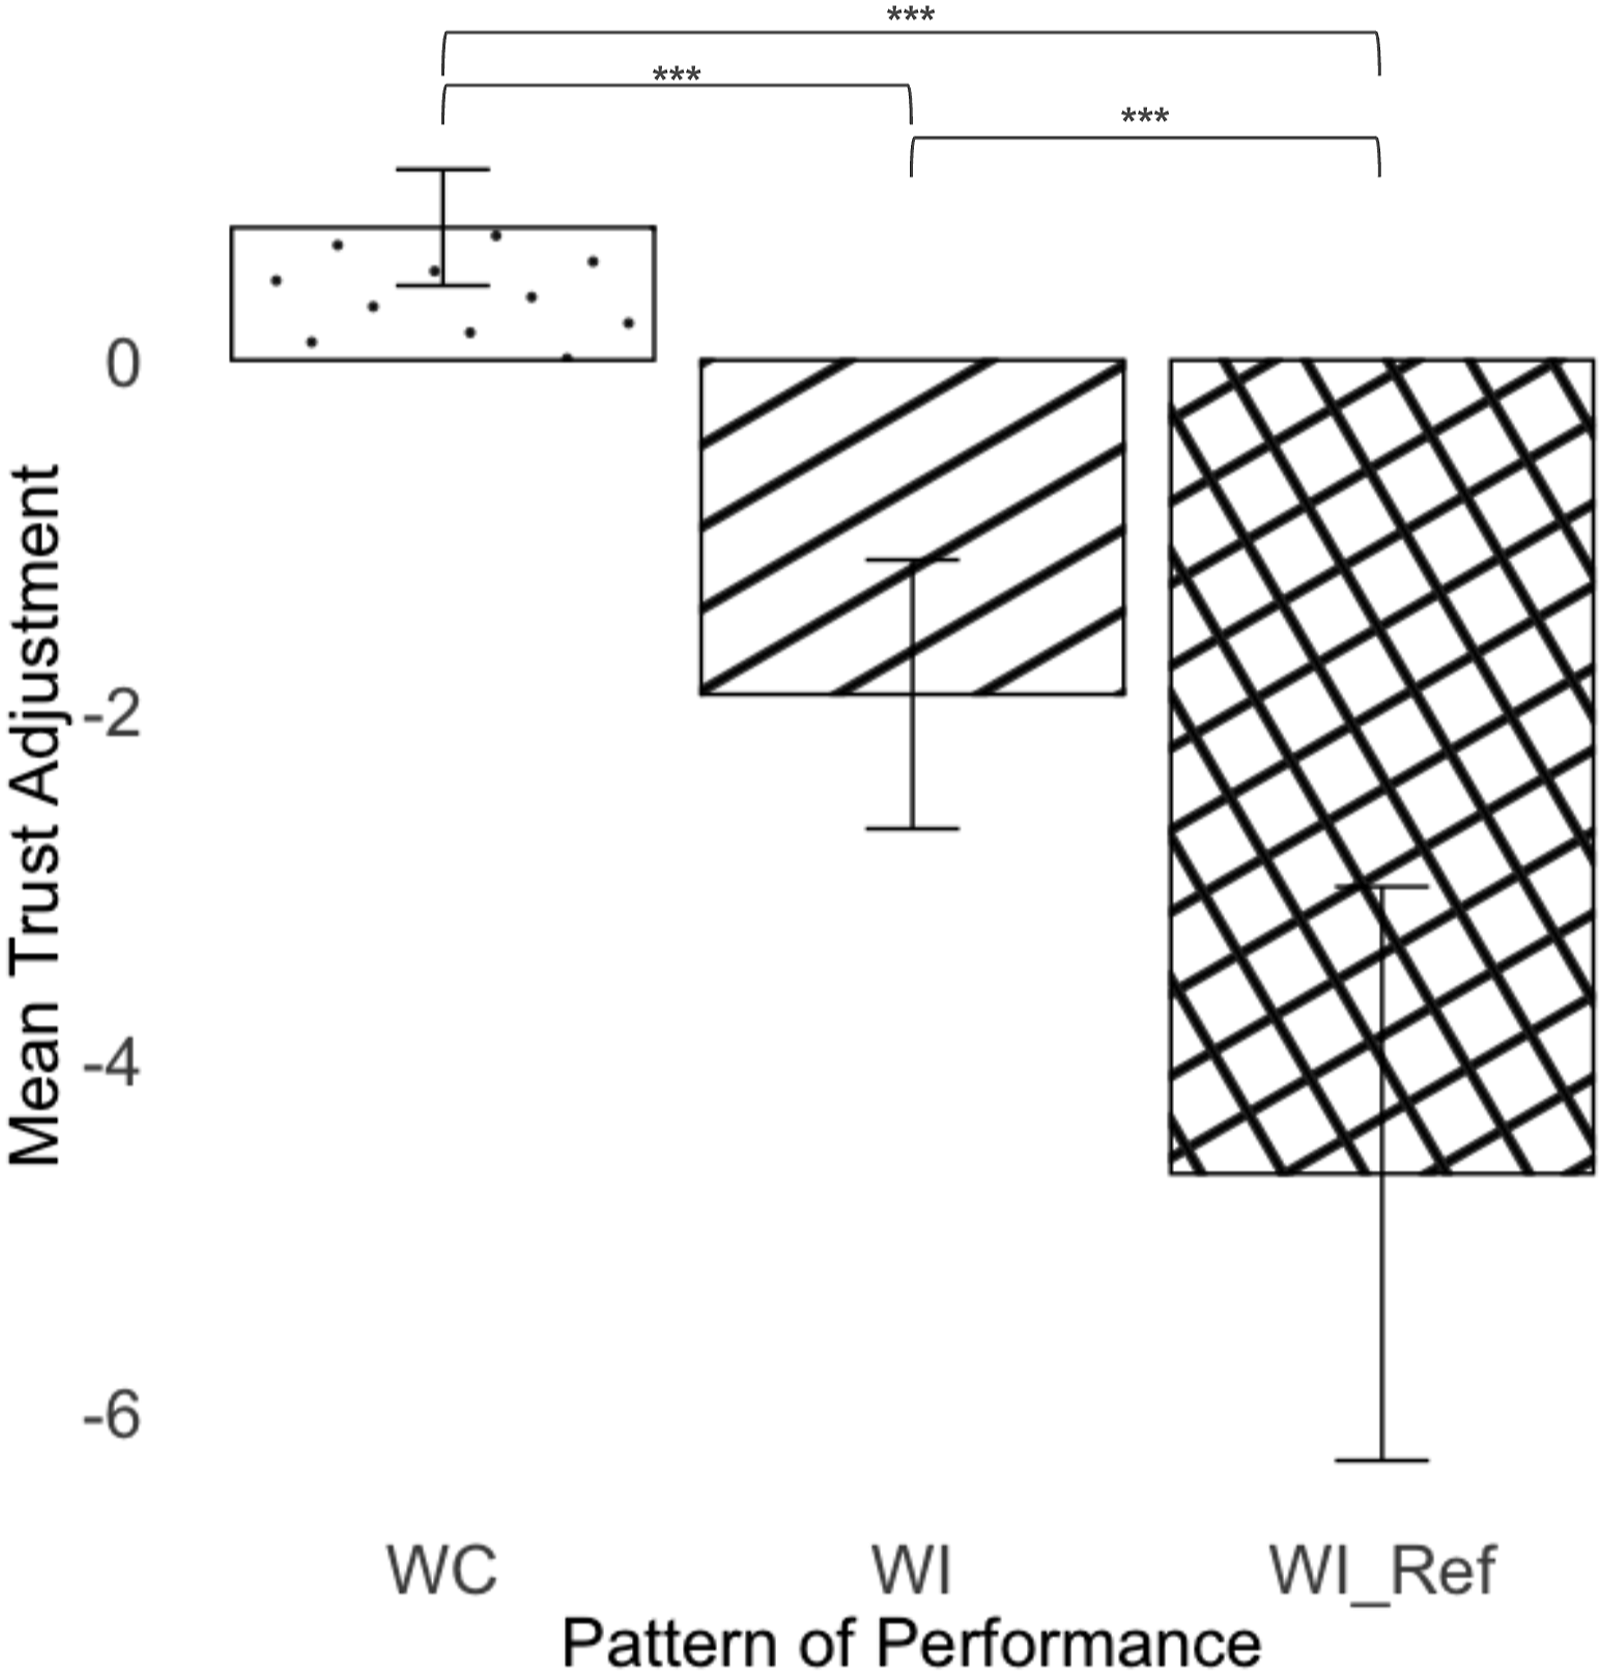
Performance
There was a significant difference between the three patterns in the final performance (F(2, 858.11) = 29.43, p < .001). Post hoc results show that pattern WI
ref
had a significantly worse performance compared to WC (t(856.62) = −7.67, p < .001) and to WI (t(856.47) = −5.73, p < .001) (Figure 12). Performance by patterns of performance. The error bars represent +/− 2 standard errors.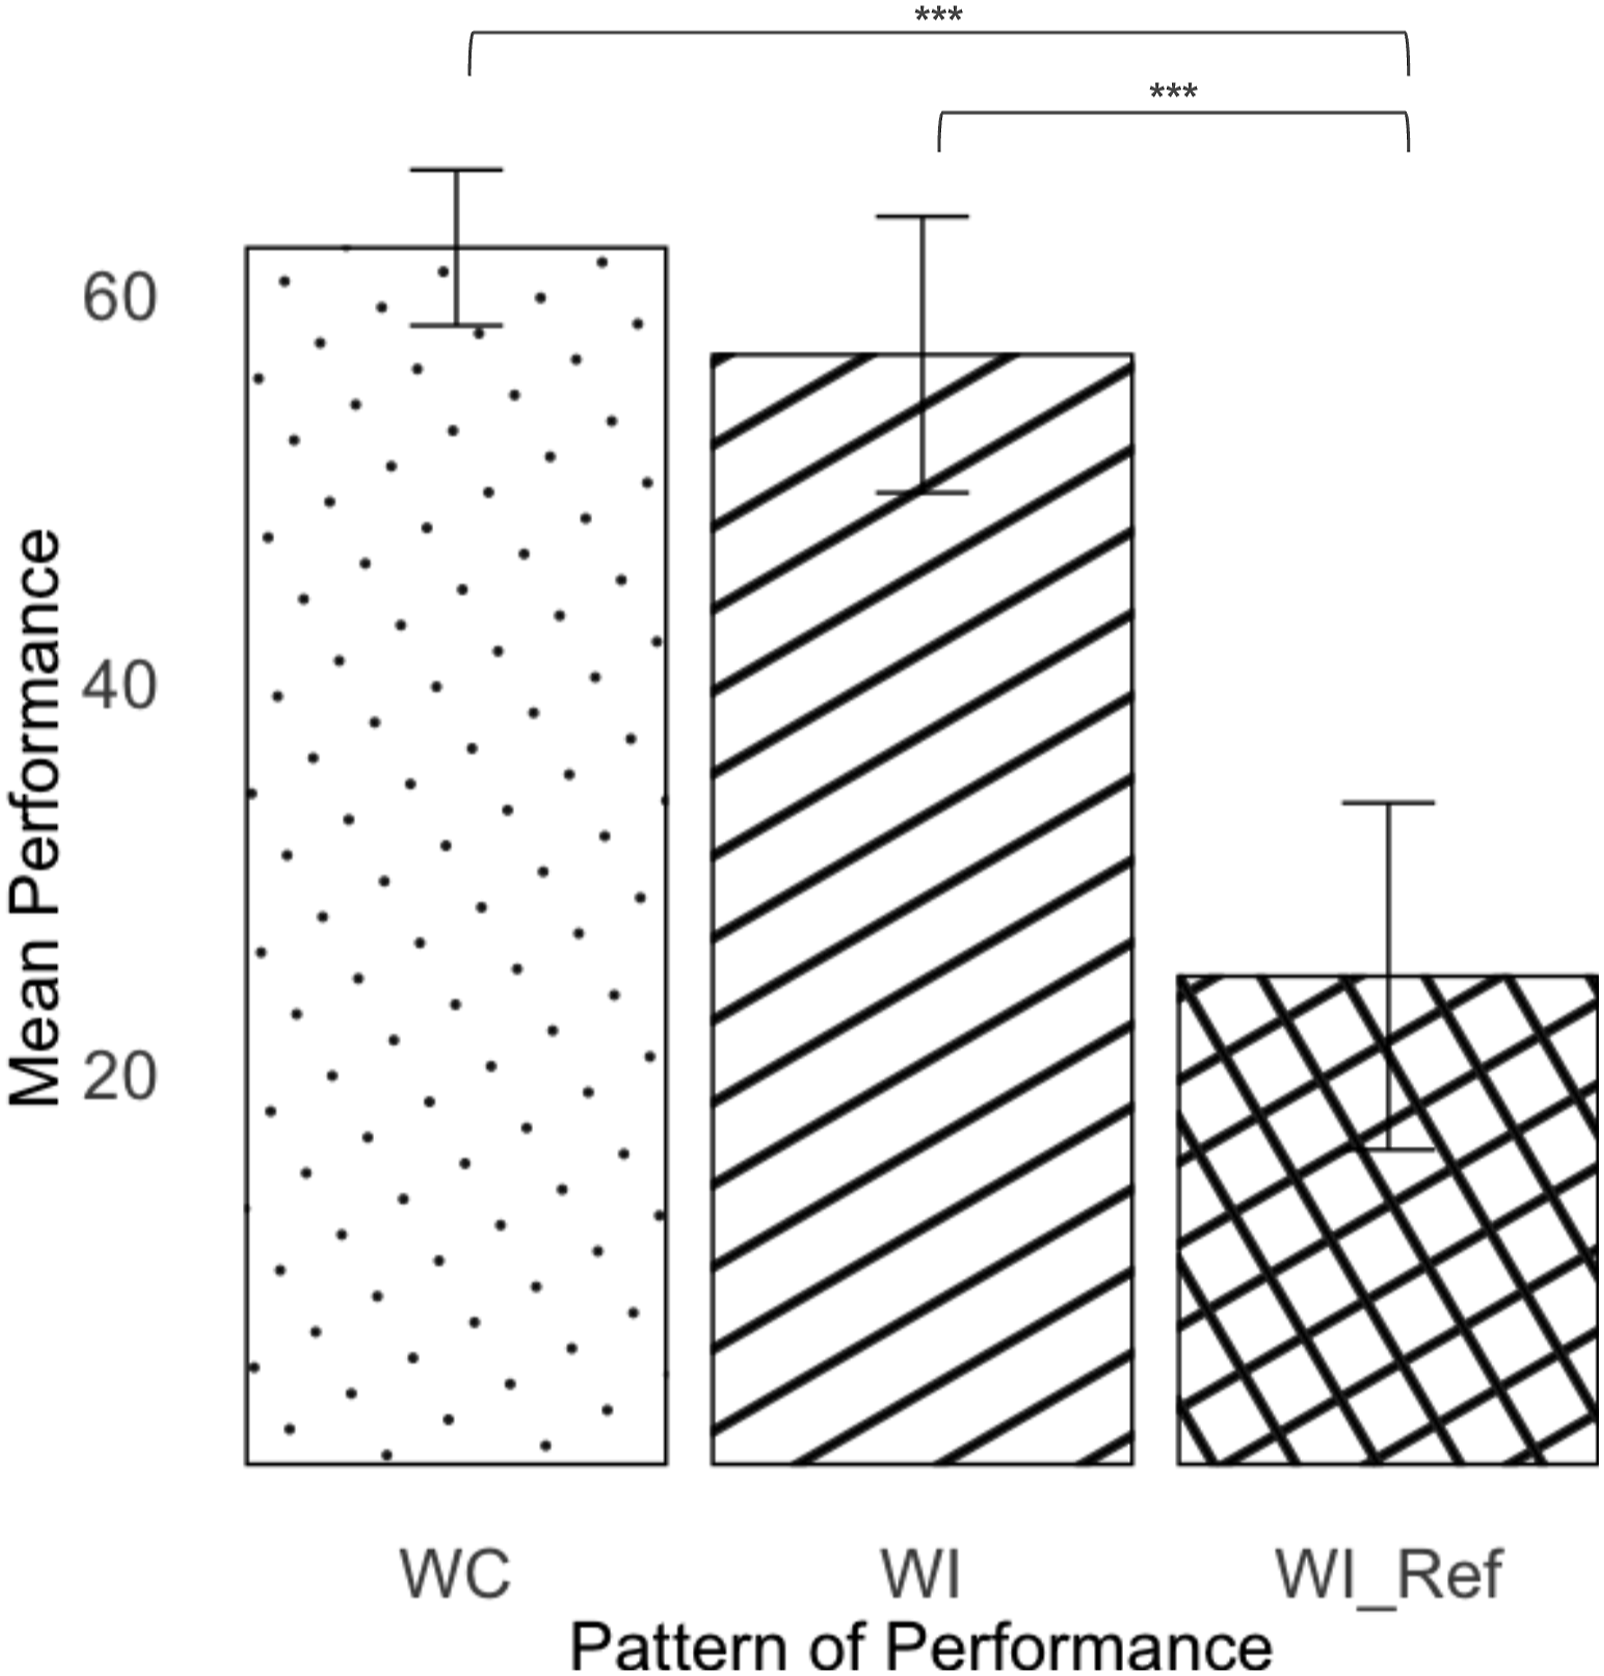
Reaction Time
For the statistical analyses of reaction times, a log scale transformation was applied to response time data. Both patterns (F(2, 852.35) = 26.82, p < .001) and outcomes (F(1, 862.59) = 24.64, p < .001) significantly affected reaction time. In addition, a significant interaction effect was observed (F(2, 855.15) = 10.38, p < .001). Because of the significant interaction effect, we compare the three patterns within each level of outcome. When the final outcome was right (Figure 13(a)), there was no significant difference between the three patterns (F(2, 475.49) = .35, p = .71); When the final outcome was wrong (Figure 13(b)), patterns significantly affected reaction time (F(2, 363.47) = 22.09, p < .001). Post hoc comparisons revealed WI
ref
resulted in significantly quicker reaction time than WC (t(362.36) = 5.82, p < .001) and WI (t(358.65) = 6.14, p < .001). Reaction Time by patterns of performance for (a) the right outcomes and (b) the wrong outcomes. The error bars represent +/− 2 standard errors. 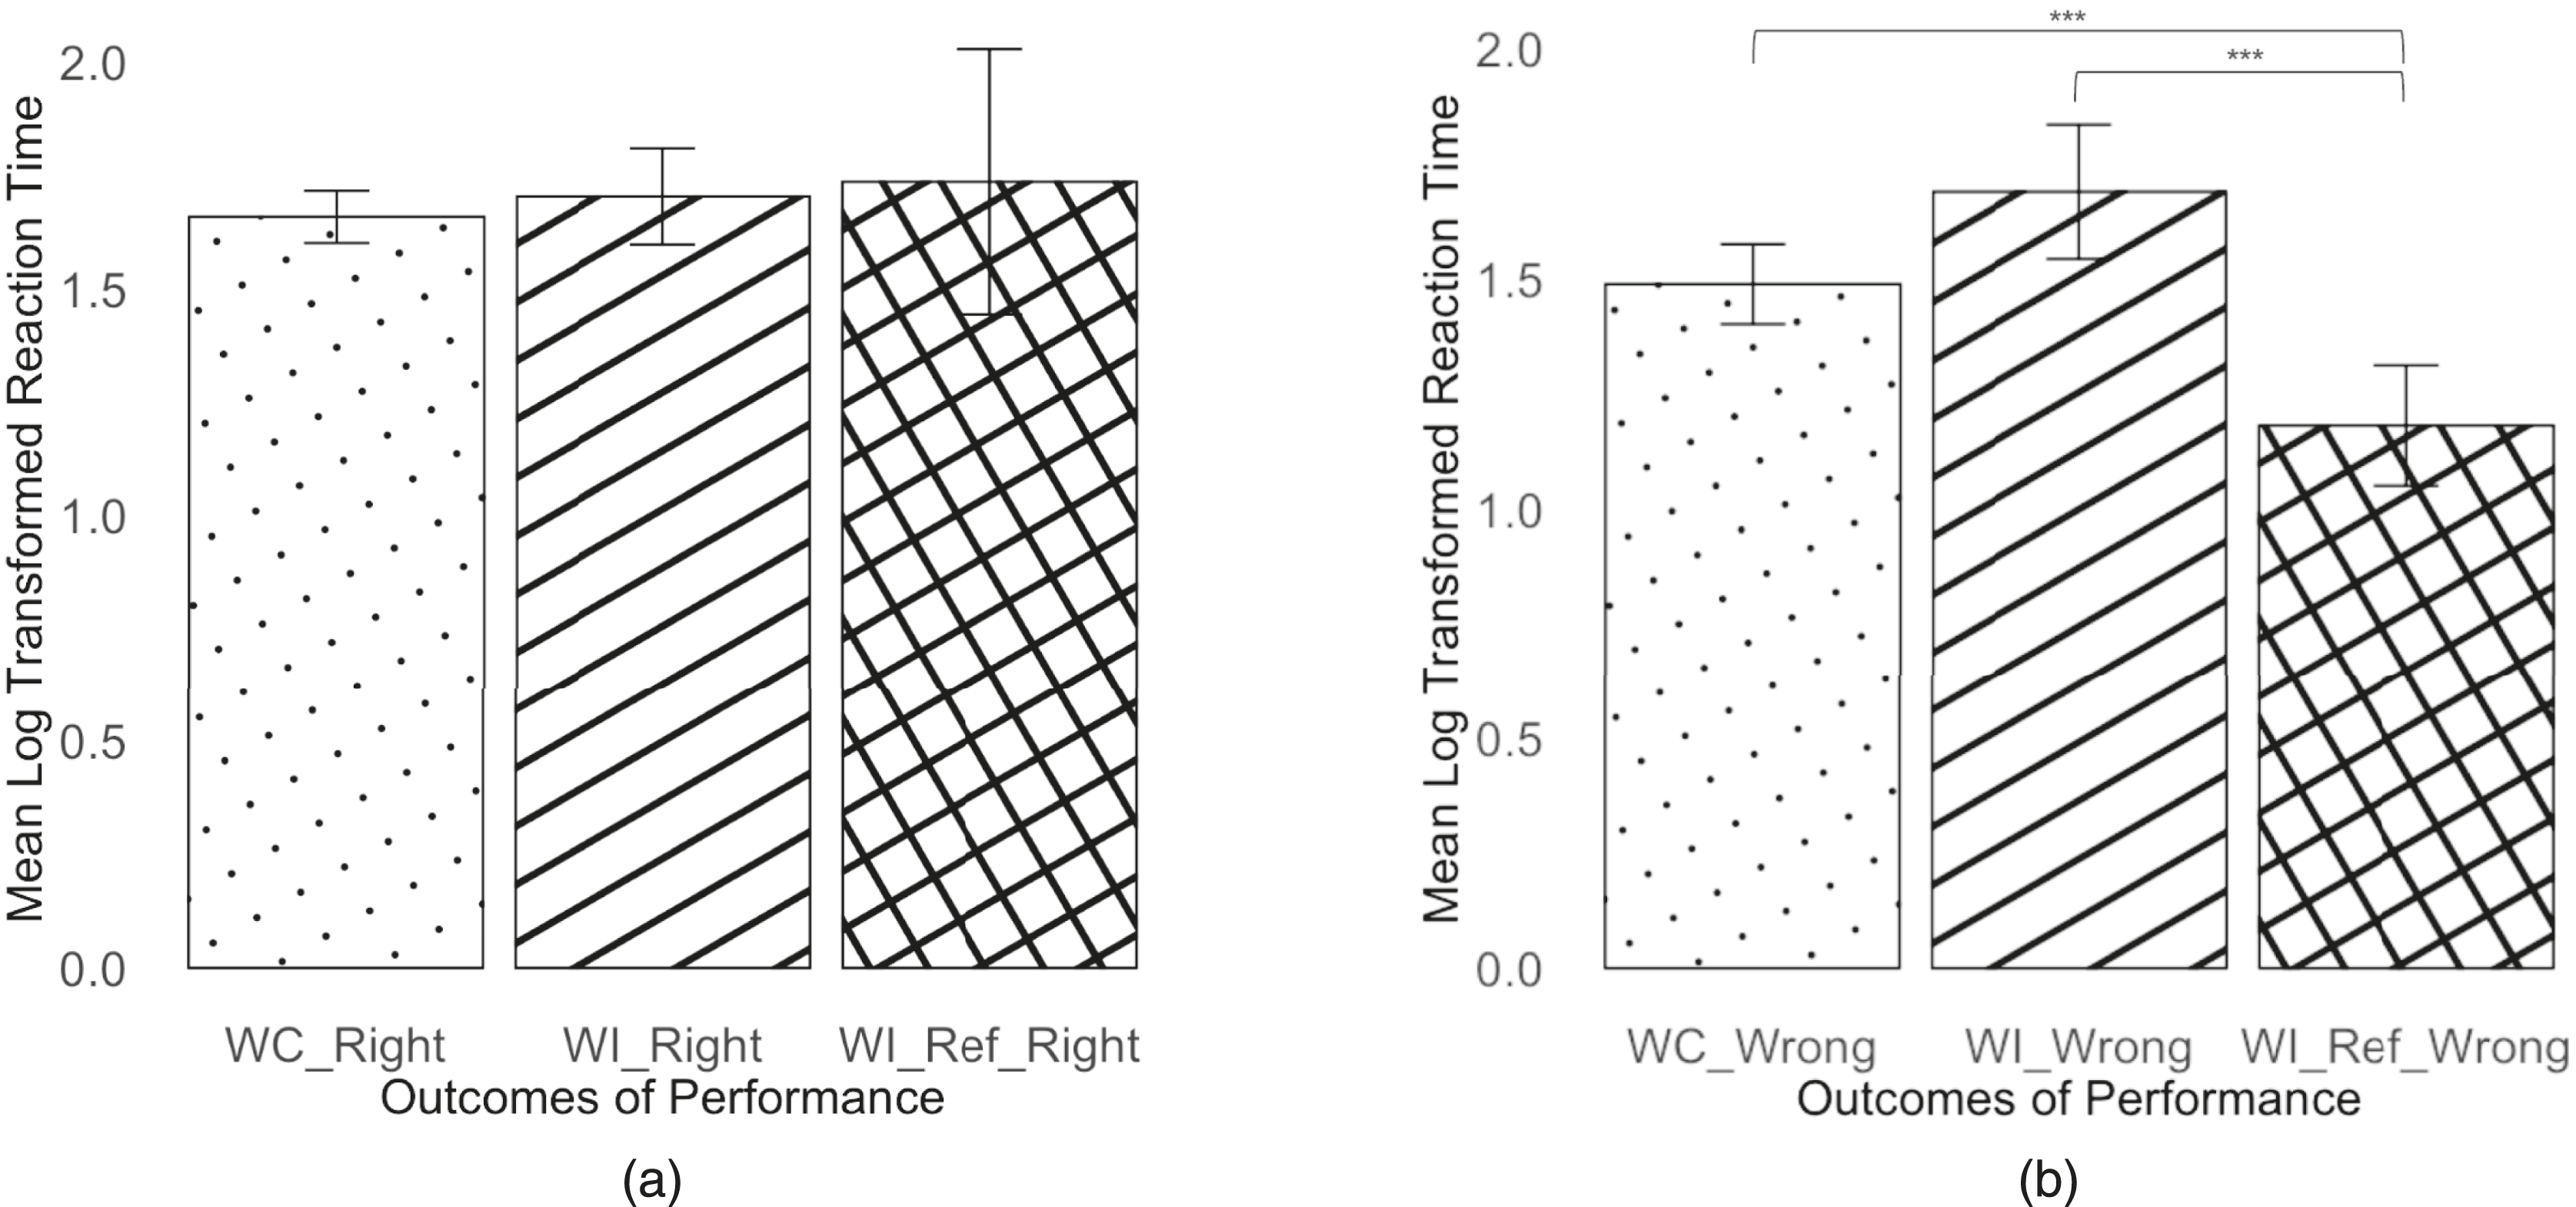
Evaluating Continuity, Negativity Bias, and Stabilization
To examine the two properties of trust dynamics, the patterns were organized into two classifications: correct AI predictions (i.e., patterns RC and WC) and incorrect AI predictions (i.e., patterns RI, WI, and WI ref ).
Continuity
Comparing correct AI predictions to incorrect AI predictions shows that AI success led to a trust increment. Conversely, AI prediction failures led to a decline in trust. In addition, trust at the present moment t is highly correlated with trust at the previous moment t − 1. To investigate the relationship between the present rating of trust and its historical rating over time, we computed the autocorrelation of trust ratings. The results, depicted in Figure 14, show that trust at time t is highly correlated with trust at the previous moment t − 1. In addition, the mean autocorrelation decreased as the time gap between ratings increased, indicating a decline in correlation with longer time intervals (Figure 15). Autocorrelation of trust as a function of time separation. The error bars represent +/− 2 standard errors. Trust adjustment by patterns of performance. The error bars represent +/− 2 standard errors.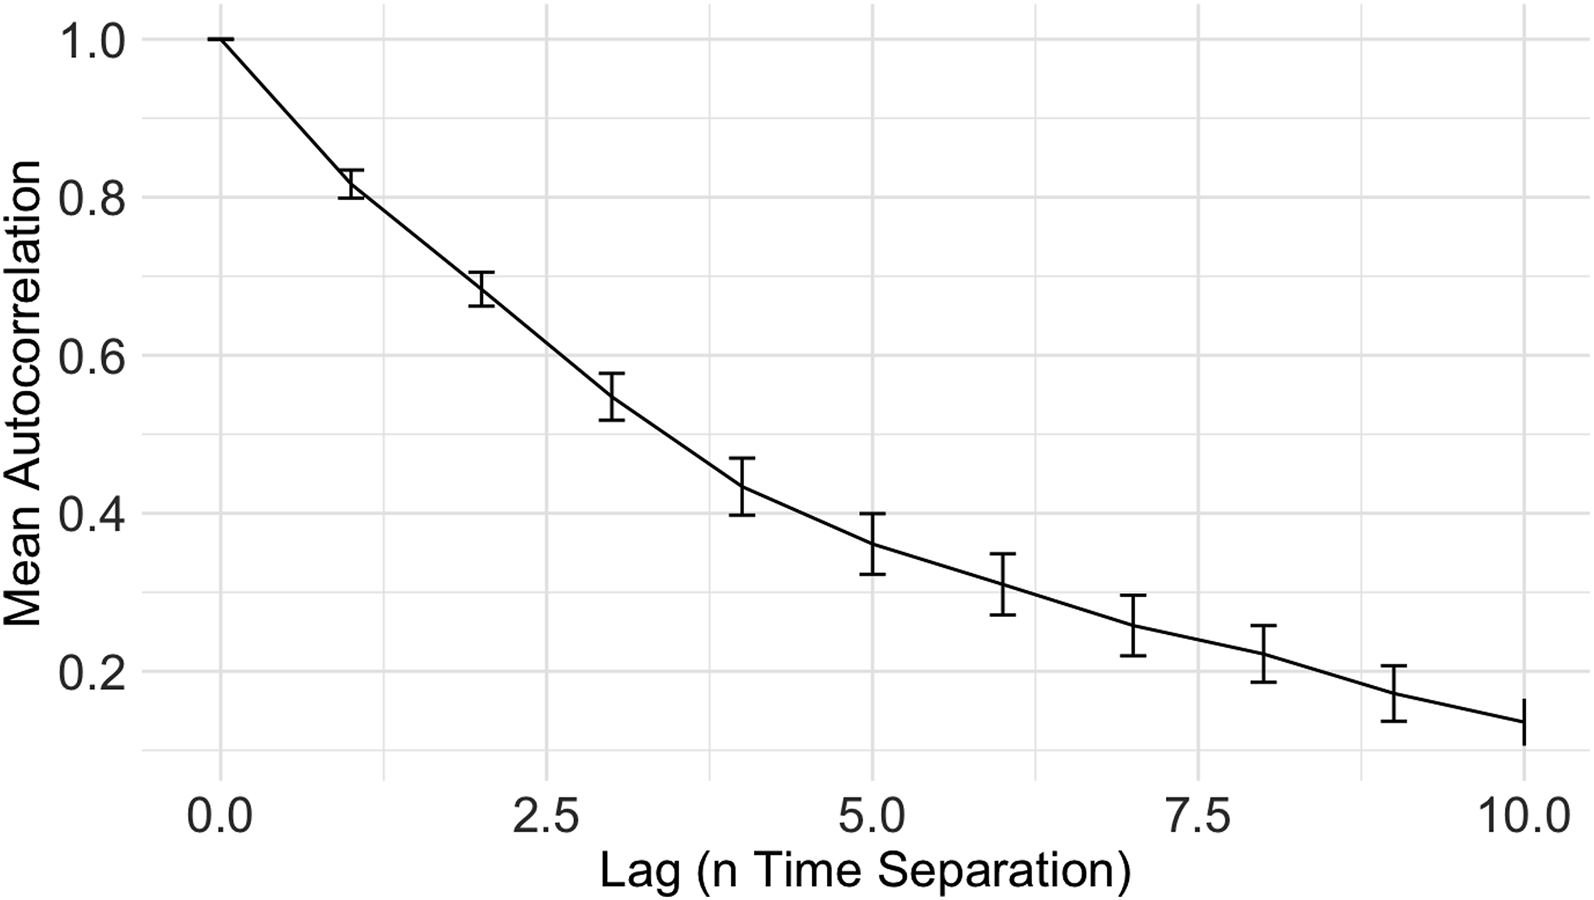
Negativity Bias
To evaluate the property of negativity bias, we compared the magnitude of trust increment and that of trust decrement. Results show significant differences between the correct (Mean = 1.01, SD = 0.13) and the incorrect (Mean = −3.16, SD = 0.22) AI prediction (t(1968.00) = −16.58, p < .001).
Stabilization
To evaluate the stabilization property, an analysis using a linear mixed model of trust adjustment as a function of time. Results show a significant decrease in the magnitude of trust adjustment over time for both the correct AI predictions (β = −0.035, t(1448) = −4.58, p < .001) and the incorrect AI predictions (β = −0.203, t(469.27) = −3.50, p < .001).
Discussion
In this section, we discuss the findings in relation to our aims and hypotheses.
The primary interest of the study is to compare between patterns WC, WI, and WI
ref
. The results partially support
In prior work examining human–automation/autonomy interaction, risk has been identified as a significant factor influencing trust, dependence, and task performance (Hoff & Bashir, 2015). The risk of an event is the product of the probability of an event and the consequence of that event (Sheridan, 2008; Slovic & Lichtenstein, 1968). Mathematically, Sheridan (2008) expressed risk R as the “product of the probability P
E
of an initial reference event E and the sum of products of probability P
i
|E of each consequence occurring given that E occurs, as well as the cost of each consequence C
i
.” Therefore,
Regarding the time taken to make a final decision after receiving the AI’s prediction, we hypothesized an interaction between the three patterns and the final outcome. The results supported
Along with our primary objectives, we also wished to validate the existence of the three properties of trust dynamics, namely, continuity (
Conclusion
Most studies on trust in and dependence on automation/autonomy and AI systems used SDT to model the performance of the systems. However, SDT categorizes the world into binary states—signal present or absent—which oversimplifies the complex dynamics observed in real-world scenarios. This binary categorization fails to address the recognition of complexity inherent in multi-class classification scenarios, which are increasingly prevalent in advanced AI systems across various sectors. Examples include medical diagnosis through image classification (classifying chest X-rays into normal, pneumonia, or lung cancer), object detection in autonomous vehicles (recognizing various objects encountered on the road), and product categorization in e-commerce (classifying products as electronics, clothing, home appliances, or books), among others (Gao et al., 2018; Kozareva, 2015; Rahman et al., 2008). As far as we know, we are one of the few, if not the only, studies that examine trust in and dependence on automation/autonomy and AI systems beyond the binary classification of the state of the world.
Our study revealed the difference in performance, response time, and trust between three patterns: WC, WI, and WI ref . These findings emphasize the need for careful consideration of error patterns in automated systems. In scenarios where AI falsely reassures the human operator, such as in pattern WI ref , we observed high likelihood for operators to make expedited decisions that often led to errors. This highlights a significant danger in AI design—systems that mislead operators can severely undermine safety and efficiency. Conversely, errors that lead to safety checks and verifications, even though incorrect, can enhance the overall reliability of human–AI systems by preventing potential mishaps. Our results also illustrate the generalizability of the three properties of trust dynamics, continuity, negativity bias, and stabilization, illustrating how people’s trust can change over time due to moment-to-moment interaction with AI.
There are several limitations to this study. First, in the present study, we did not manipulate the cost of an error or the cost of success (i.e., C
i
in the risk equation), which often varies in safety-critical domains. For instance, Aldhwaihi et al. (2016) found that although most dispensing errors caused no harm, some errors had high consequences that could potentially cause harm or even death, depending on the dosage and patients’ vulnerability. Future research could incorporate varying costs into experiments to examine the impact of various AI error types. Also, future research should be conducted to validate the results in more realistic contexts, particularly in safety-critical domains. Second, inspired by the medical dispensing examples described at the beginning of the article, the testbed we developed focused on a mental rotation and recognition task. Future studies could replicate the study using testbeds focusing on other human information processing components such as memory and decision making. Third, there were only 96 WI
ref
cases, which could have caused the lack of significance in
Key Points
• AI systems that offer a multi-class classification of the state of the world can lead to types of errors that SDT does not traditionally capture. • Varying error patterns from AI significantly impacted performance, reaction times, and trust adjustments. • AI errors can provide false reassurance, misleading operators into believing their incorrect decisions were correct. This leads to worsened performance and a significant decline in trust. Conversely, and paradoxically, some AI errors can prompt safety verification, ultimately enhancing overall performance. • We illustrate the generalizability of the three properties of trust dynamics: continuity, negativity bias, and stabilization.
Footnotes
Acknowledgments
The authors would like to thank Szu-Tung Chen for her assistance in testbed development, and Yili Liu for lively intellectual discussions.
Declaration of conflicting interests
The author(s) declared no potential conflicts of interest with respect to the research, authorship, and/or publication of this article.
Funding
The author(s) disclosed receipt of the following financial support for the research, authorship, and/or publication of this article: This study is in part supported by the University of Michigan Industrial and Operations Engineering department’s fellowship, the University of Michigan Rackham Graduate School’s graduate student research grant, and the National Library of Medicine of the National Institutes of Health under award number R01LM013624.