
Abstract
Objective
We investigated how people used cues to make Judgments of Difficulty (JODs) while observing automation perform a task and when performing this task themselves.
Background
Task difficulty is a factor affecting trust in automation; however, no research has explored how individuals make JODs when watching automation or whether these judgments are similar to or different from those made while watching humans. Lastly, it is unclear how cue use when observing automation differs as a function of experience.
Method
The study involved a visual search task. Some participants performed the task first, then watched automation complete it. Others watched and then performed, and a third group alternated between performing and watching. After each trial, participants made a JOD by indicating if the task was easier or harder than before. Task difficulty randomly changed every five trials.
Results
A Bayesian regression suggested that cue use is similar to and different from cue use while observing humans. For central cues, support for the UAH was bounded by experience: those who performed the task first underweighted central cues when making JODs, relative to their counterparts in a previous study involving humans. For peripheral cues, support for the MEH was unequivocal and participants weighted cues similarly across observation sources.
Conclusion
People weighted cues similar to and different from when they watched automation perform a task relative to when they watched humans, supporting the Media Equation and Unique Agent Hypotheses.
Application
This study adds to a growing understanding of judgments in human–human and human–automation interactions.
Introduction
Automated systems increasingly support and perform tasks previously performed by humans (Parasuraman & Riley, 1997). Consider luggage screening: for many years, Transportation Security Agency (TSA) agents manually searched passengers’ luggage for prohibited items. Although TSA agents still maintain a prominent role in luggage screening—possessing the sole authority of selecting luggage for additional screening—their roles are now supported by automated systems which aid in cueing operator attention to suspicious items (Huegli et al., 2020). When determining whether to act on the system’s recommendations, operators must recognize when the screening task, based on X-Ray imagery, might be too difficult for the system to complete accurately (e.g., weapon occlusion or rotation; Mery et al., 2020). Recognizing system limitations requires an understanding of how people evaluate the difficulty of the tasks that they perform, relative to those automation performs. Within the luggage screening example, cues to difficulty can be used to anticipate when a task might be too difficult for automation and easier for a TSA agent to perform manually (i.e., physically inspecting luggage). This provides an opportunity to intervene before accidents occur.
This paper discusses the kinds of information involved in evaluations of task difficulty and how this information is used by people as they perform a task or watch automation do so. We believe this topic is important because of the purported role judgments of difficulty (JODs) play in calibrating Trust in Automation (TiA; Hoff & Bashir, 2015). Because the existing literature on JODs and TiA involves implicit evaluations of task difficulty (Huegli et al., 2023; Ingram et al., 2021, Madhavan et al., 2006; Merritt et al., 2013; Monroe & Vangsness, 2022; Schwark et al., 2010), understanding this relationship requires a discussion about cue-based metacognitive frameworks. Furthermore, because task difficulty and TiA research often requires individuals to perform a task with automation, understanding this relationship also requires a focus on models of decision making for the self as compared to others. The Media Equation Hypothesis (Reeves & Nass, 1996) and the Unique Agent Hypothesis (de Visser et al., 2016) offer two predictions for patterns of judgment and decision making. These hypotheses informed an experiment that determined how cues to difficulty informed JODs during a visual search task where participants alternated between performing the task themselves and watching automation perform the same task.
Metacognitive Judgments
Metacognition is how one monitors or thinks about one’s own or others’ cognition (Flavell, 1979). Research suggests that individuals use cues (e.g., study time and reaction time) to make metacognitive judgments (Desender et al., 2017; Koriat, 1997; Undorf & Erdfelder, 2013; Vangsness & Young, 2019). Although metacognition research typically focuses on one’s own cognition, the principles and methods used to study metacognition (i.e., cue-based frameworks) can be used within the context of human–automation interaction, in which humans must anticipate the needs of their automated counterparts (Dekker & Hollnagel, 1999; Dekker & Woods, 2002; Hancock, 2022). Within human–automation interaction, applicable cues might include cues related to task difficulty (Hoff & Bashir, 2015).
Understanding which cues contribute most strongly to metacognitive judgments provides a window into the underlying strategy used to anticipate and support human and automated agents’ state. Imagine a situation where an individual is leveraging automation to conduct a luggage screening task. Certain object configurations (e.g., bundled cords) can make the task more difficult due to poor image clarity (Huegli et al., 2023; Ingram et al., 2021). Task-based characteristics (e.g., image clarity) reflecting objective task difficulty are a cue that individuals can monitor to inform reliance (Goddard et al., 2014; Huegli et al., 2023) and compliance decisions (Ingram et al., 2021). Therefore, studying individuals’ metacognitive assessments of automation provides a way to quantify how calibrated individuals are in weighing task-based characteristics and their sensitivity to changes in these characteristics over time. As long as humans are required to monitor and observe automation, there is a need to understand how humans track and integrate cues to make metacognitive judgments about automation. One metacognitive judgment relevant to TiA is judgments of difficulty (JODs) (Goddard et al., 2014; Hoff & Bashir, 2015; Huegli et al., 2023; Ingram et al., 2021).
Judgments of Difficulty
Some perspectives define difficulty as a function of task-based characteristics—static qualities of a task which make an individual more or less likely to succeed in their goals (Monroe & Vangsness, 2022; Vangsness & Young, 2019, 2021). Others relate difficulty to completion time (Gray et al., 2007), the proportion of time that task performance requires attention (Potts & Rosenbaum, 2021), and anticipated task duration (Potts et al., 2018)—the results of a person’s engagement with a task. While some perspectives also define task difficulty as the subjective assessment of the effort required to complete a task (Bedwell et al., 2014), this paper defines difficulty as a function of task-based characteristics. Defining difficulty in this way allows for cue grouping with respect to their relationships with the task and human. This enables researchers to identify cues equally available to all people and those available to individuals with task experience (Vangsness & Young, 2019).
Central versus Peripheral Cues to Difficulty.
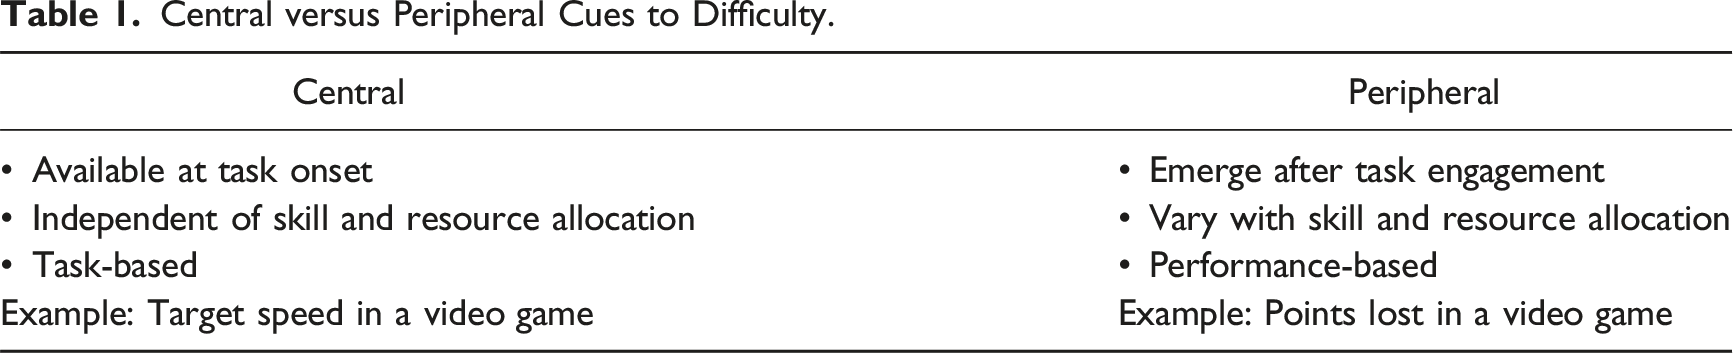
The TiA literature commonly defines trust as, “the attitude that an agent will help achieve an individual’s goals in a situation characterized by uncertainty and vulnerability” (Lee & See, 2004, p. 51). One quality that contributes to uncertainty and vulnerability is task difficulty (Hoff & Bashir, 2015). Previous research demonstrates that people use JODs to inform reliance (Madhavan et al., 2006; Schwark et al., 2010), and under-rely on automation when it performs “easy” tasks poorly (Madhavan et al., 2006). Calibrated trust leads to appropriate use, and reduced misuse and disuse of automation (Lee & See, 2004; Parasuraman & Riley, 1997). Therefore, studying the factors that contribute to peoples’ ability to estimate task difficulty is essential to understanding trust calibration.
Research on the relationship between task difficulty and TiA is divided. Sometimes the two share a direct relationship, such that increased task difficulty leads to increased TiA (Huegli et al., 2023; Merritt et al., 2013); other times, this relationship is reversed (Goddard et al., 2014; Ingram et al., 2021; Monroe & Vangsness, 2022). Task difficulty can also act as a moderating factor between reliability and TiA. For example, while Ingram et al. (2021) found higher levels of TiA when automation correctly labeled images, these findings were attenuated by task difficulty (i.e., image clarity). Despite the existing research on how task difficulty impacts TiA, no research identifies which information people attend to or how they weigh these cues within the context of tasks performed by automation. This gap motivated the first research question (RQ1): How do people make JODs while observing automation? We evaluated this question by manipulating task difficulty in a visual search task systematically and by requiring participants to make repeated JODs while observing automation.
JODs When Observing Others
While past research does not address how JODs are made while observing automation, there is existing research on how humans make JODs while observing other humans. Differences emerge when individuals make JODs while observing others—previous task experience moderates these differences (Kardas & O’Brien, 2018; Vangsness, 2019). Recent research suggests that people overestimate their ability to perform a task when observing humans. However, hands-on experience can attenuate this effect. Participants with early task exposure were better calibrated in their JODs, while participants with delayed task exposure reported lowered JODs until they received task experience (Kardas & O’Brien, 2018; Vangsness, 2019). This suggests that people use cues differently when they have task experience as compared to when they are naïve observers. These differences can lead to poorly calibrated JODs. This research, viewed in conjunction with present advances in automation (i.e., performing tasks previously performed by humans; Parasuraman & Riley, 1997; Rahwan et al., 2019), motivated the second research question (RQ2): how does experience with a task performed by oneself or by automation, impact JODs? We answered this research question by manipulating source of experience (i.e., task vs. observing automation) between-subjects. To date, there is no research that extends these findings to environments where individuals observe automation perform a task, nor is there research extending these findings to circumstances in which people have previous task experience. As a starting point for understanding how individuals might make JODs for automation, we can look to theories of Human–Automation Relationships.
Theories of Human–Automation Relationships
Parasuraman and Riley (1997) predicted a shift in the structure of human activities due to projected increases in automation power, speed, and intelligence. Automation increasingly replaces or supports human judgments (Rieger et al., 2022). For example, luggage detection screening is now supplemented with automated recommender systems (Merritt & Ilgen, 2008; Pop et al., 2015). While the literature evaluating human relationships with automated recommender systems is vast (for a review, see Hoff & Bashir, 2015), it is unclear how humans make judgments following handoffs with decision aids. Although there is existing research on attitudes of passive (Montague & Asan, 2012; Montague et al., 2014) or incidental users (Domeyer et al., 2020, 2022) of automation which they do not directly engage with or have control over, it is still unclear how these attitudes extend to handoff situations. Given the difficulty for humans to imagine how another entity (e.g., automated system) might think or act (Gray et al., 2007) and the tendency of experts to underestimate the difficulty of tasks performed by others (Hinds, 1999; Nickerson, 1999), it becomes imperative to understand the judgments associated with automation we passively observe. Understanding how humans make judgments regarding passively observed automation can aid in improving the calibration of TiA. The Media Equation Hypothesis (Reeves & Nass, 1996) and the Unique Agent Hypothesis (de Visser et al., 2016) offer two possible explanations for how human observers might evaluate automation following handoffs.
Media Equation Hypothesis
The Computers are Social Actors (CASA) paradigm, suggests that the human-technology relationship is fundamentally social (Reeves & Nass, 1996). Under the CASA paradigm, people apply attitudes towards technology that are typically reserved for humans. A revised version of the paradigm is referred to as the Media Equation Hypothesis (MEH). The MEH assumes that the mechanisms driving human-human and human-automation trust are similar (Nass et al., 1999; Reeves & Nass, 1996). While some studies in support of the MEH suggest that this relationship persists because of humans’ tendency to assign human-like traits to technology (Abubshait & Wiese, 2017; de Visser et al., 2016, 2017; Pak et al., 2012), it is worth noting that behaviors which might suggest anthropomorphism do not necessarily emerge from anthropomorphic perceptions (i.e., ethopoeia; Nass & Moon, 2000; Takayama, 2009). Instead, these behaviors may emerge from mindless application of social scripts to machines (Nass & Moon, 2000).
Unique Agent Hypothesis
The Unique Agent Hypothesis (UAH) asserts that humans respond to automation differently than they do to other humans. The UAH acknowledges that since interactions with automation are subject to biases unique to nonhuman entities (de Visser et al., 2016), this can lead to poorly calibrated trust. One consequence is that humans can sometimes over-trust automation and believe that it is always perfect (i.e., the Perfect Automation Schema/PAS; Dzindolet et al., 2002). Negative consequences from this bias emerge when automation performs imperfectly and can impact how humans respond to automation.
MEH and UAH
Although the MEH and UAH often are pitted against one another in the literature (Alarcon et al., 2021, 2023; de Visser et al., 2016, 2017), recent research suggests that attitudes towards automation are more nuanced than previously suggested. While people might perceive automated systems as social agents, they can still maintain biases about automation’s ability to outperform humans (Alarcon et al., 2023). Similarly, humans can shift degrees of verbal anthropomorphism towards automation, which might occur due to perceiving agents as less human-like and more tool-like over time (Cohen et al., 2021). While humans might have an in-the-moment social response to automation, often reflectively, humans believe there are distinctions between human and automated agents (Takayama, 2009).
Study Objective
We sought to understand how humans make JODs (i.e., weigh cues to difficulty) while observing automation (RQ1) and how JODs might be moderated by experience (RQ2). We also wished to compare these results to those obtained from a study in which people observed a human (Vangsness, 2019). In doing so, we sought to provide support to one of two theories:
when observing automation perform a task, participants will weigh cues to difficulty differently from how they weigh these cues when observing other humans, supporting the UAH (de Visser et al., 2016).
when observing automation perform a task, participants will weigh cues to difficulty similar to how they weigh these cues when observing other humans, supporting the MEH (Reeves & Nass, 1996).
We acknowledge it is possible that our study provides mixed support for both theories. In this case, we hope to identify the boundary conditions under which one hypothesis or the other is supported.
Method
This research complied with the American Psychological Association Code of Ethics and was approved by the Institutional Review Board at Wichita State University. We obtained informed consent from each participant. Eighty participants recruited through the psychology subject pool completed the experiment. Participants received 1 hour of research credit as compensation.
The Conjunction Visual Search Task
The study used a 3 A schematic of the manipulations presented during the visual search task. Note. Role order was manipulated between-subjects. Difficulty blocks were manipulated within-subjects and Latin-square counterbalanced. Participants experienced one difficulty condition per block. Schematic diagram of the visual search task.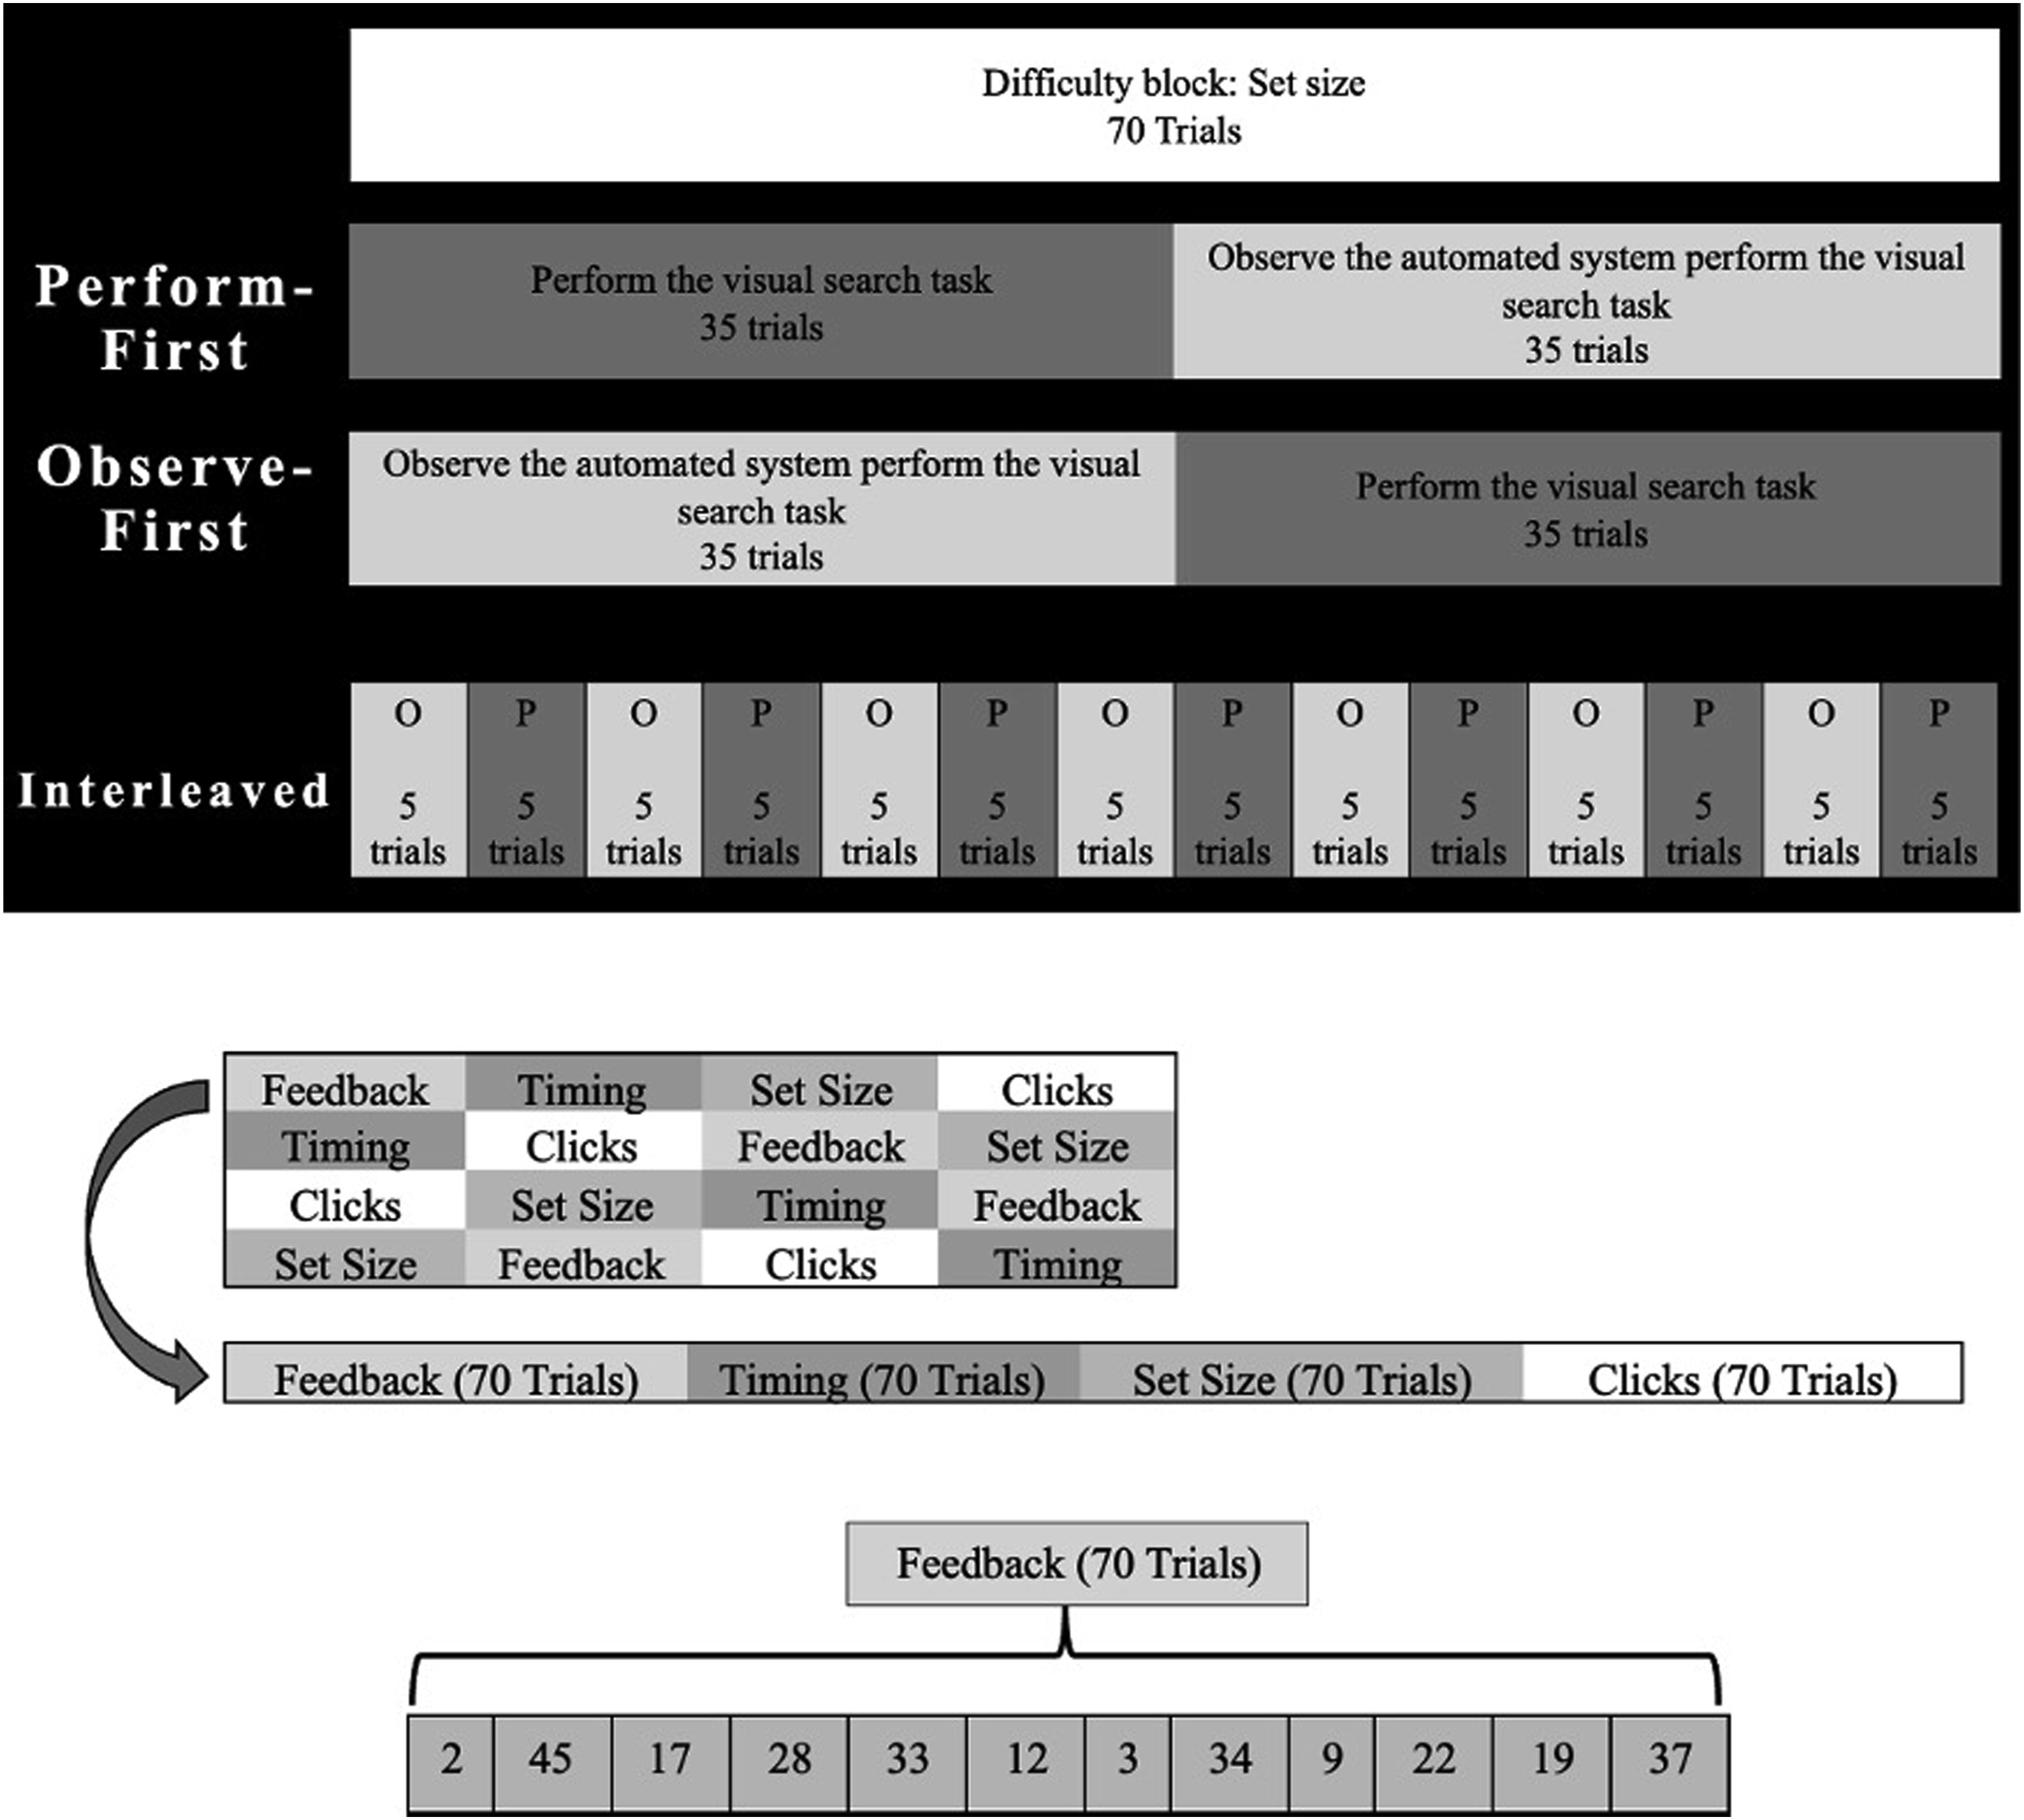
Difficulty Conditions (Within-Subjects).
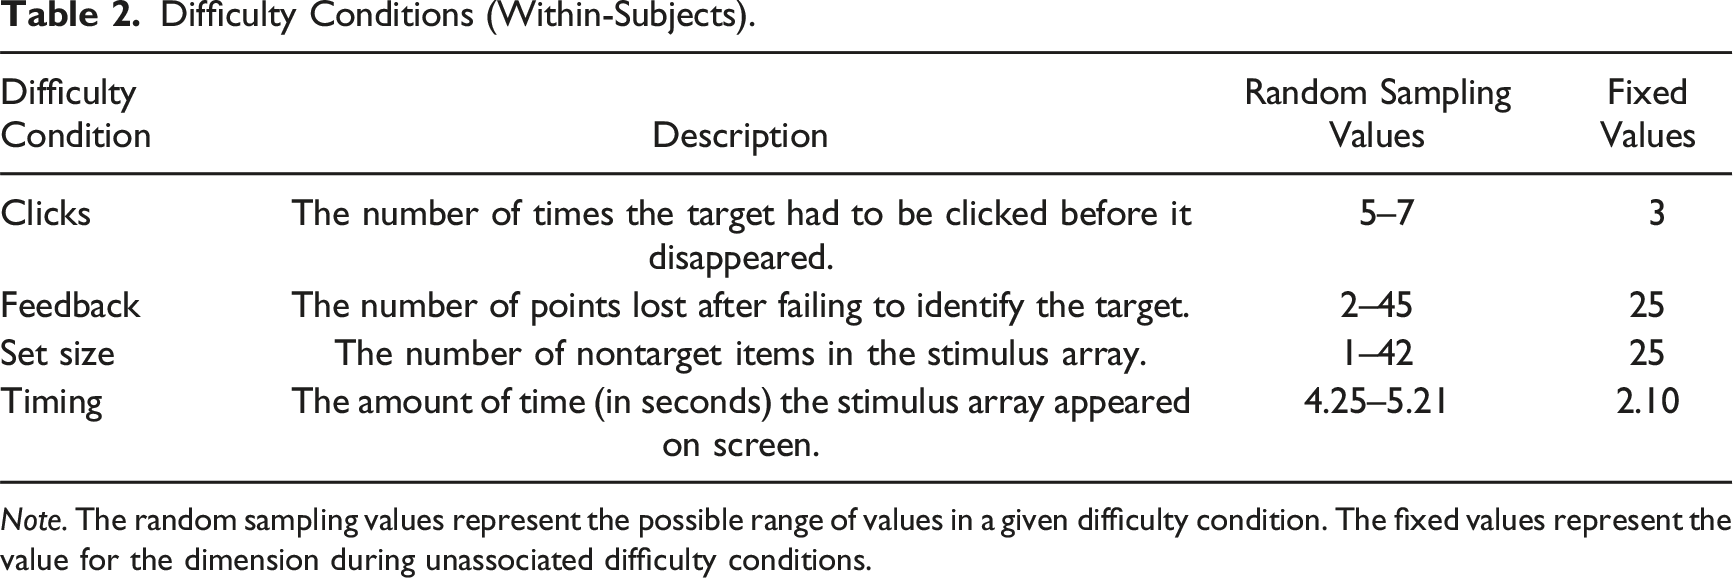
Note. The random sampling values represent the possible range of values in a given difficulty condition. The fixed values represent the value for the dimension during unassociated difficulty conditions.
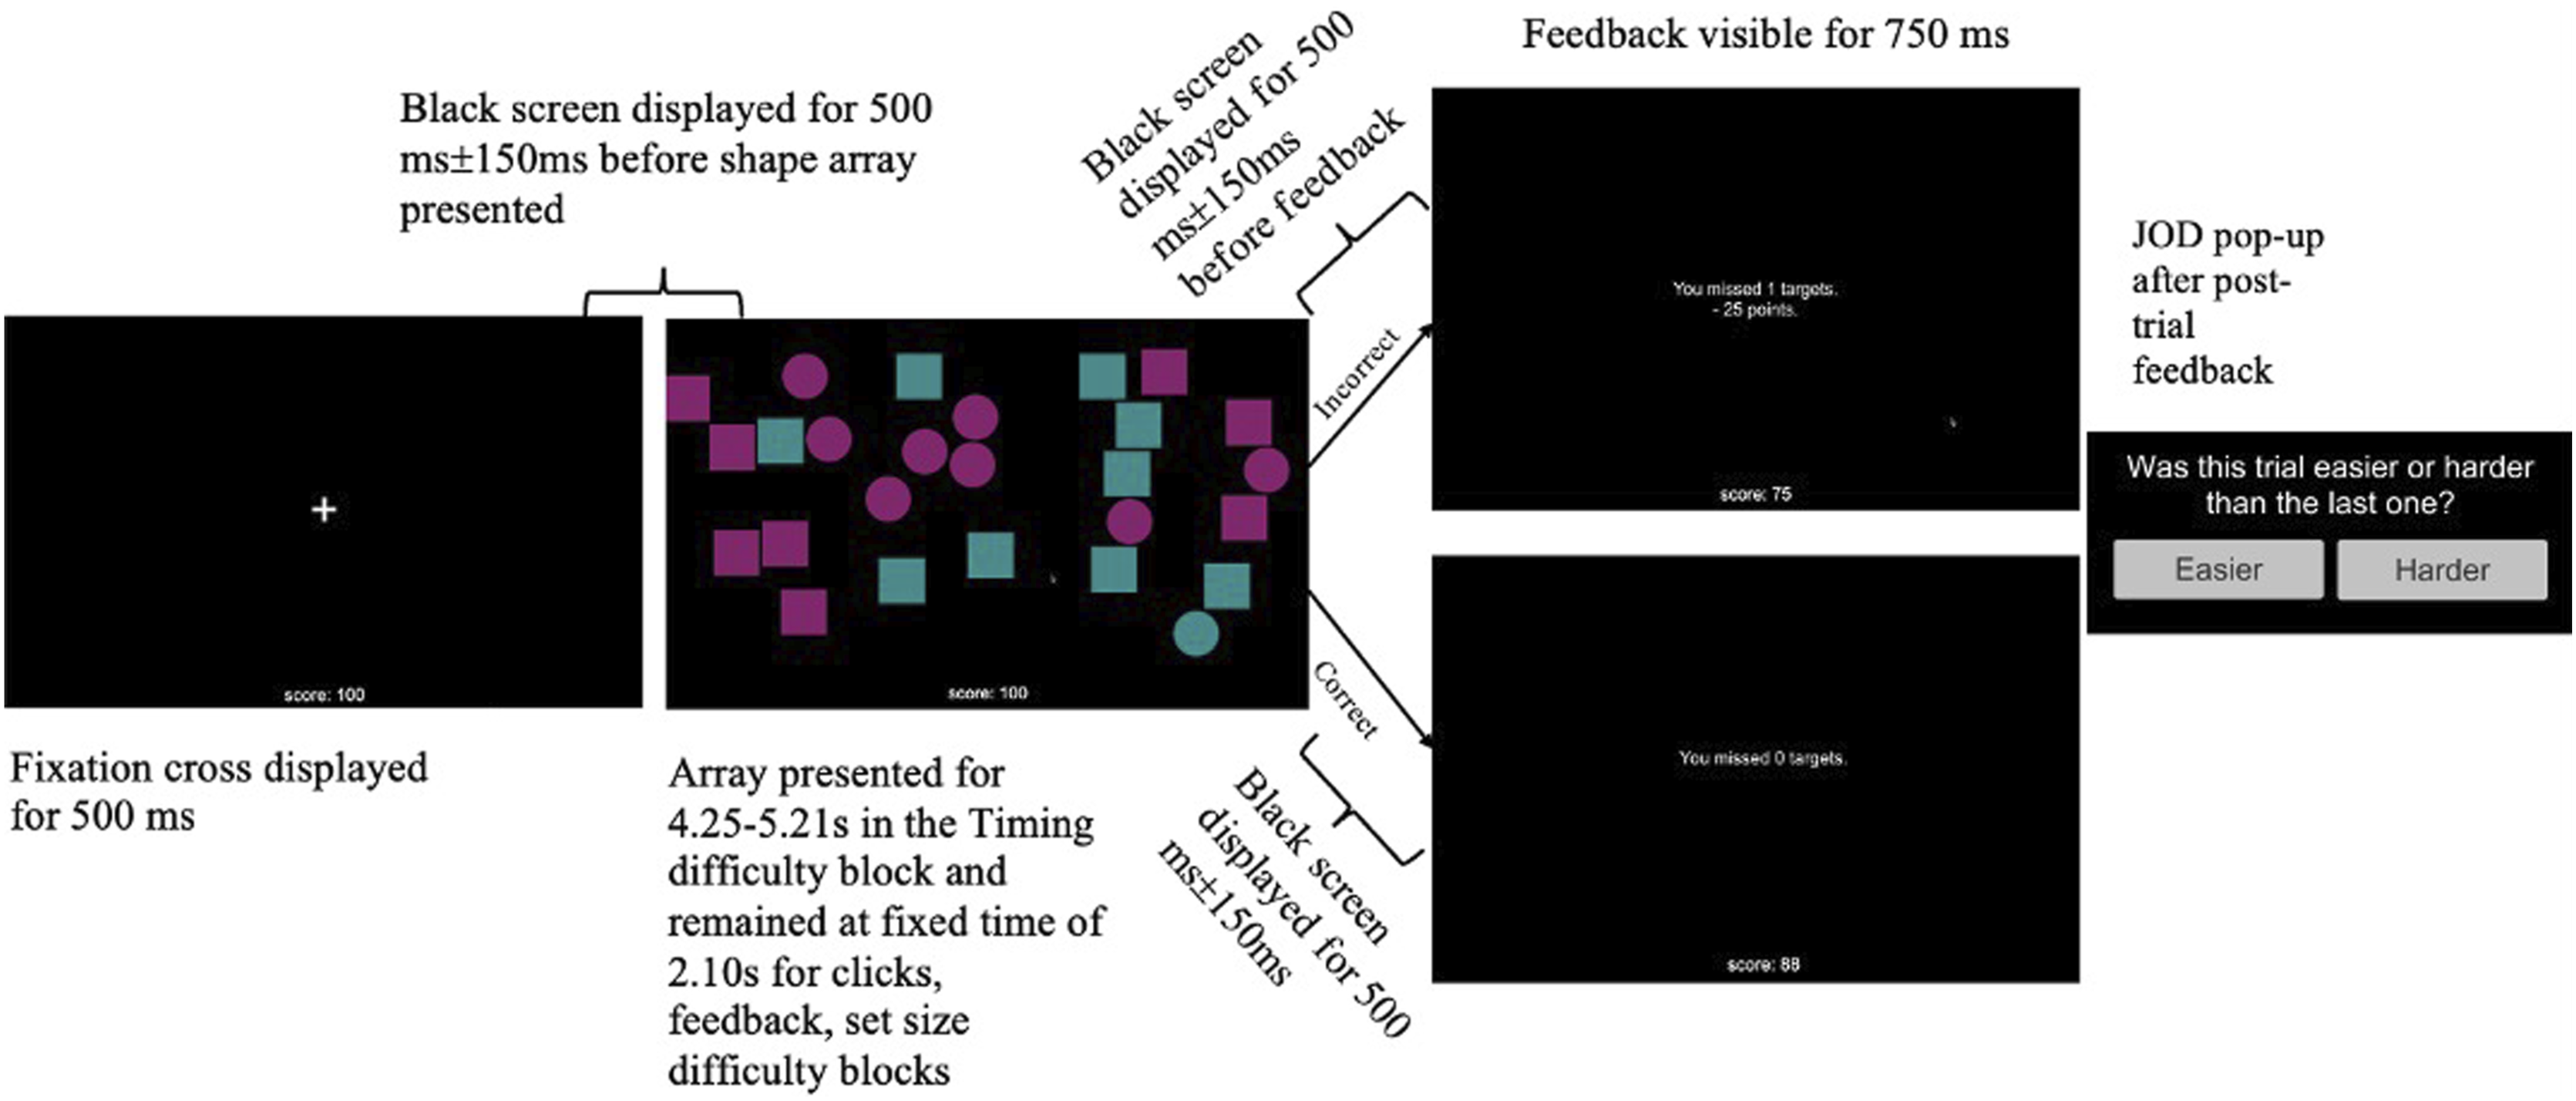
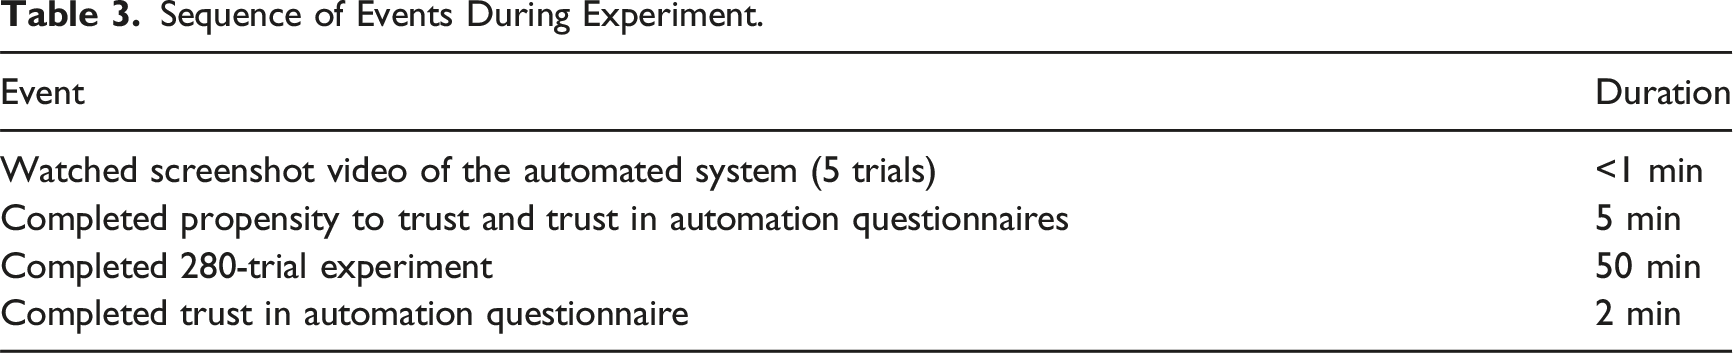
Sequence of Events During Experiment.
Task Difficulty
To understand sensitivity to changes in objective task difficulty, trials were split into three, 70-trial difficulty blocks whose presentation order was counterbalanced across subjects: clicks, set size, and timing. A fourth dimension, feedback, manipulated the salience of peripheral cues with task difficulty held constant. Difficulty dimension changed every 70 trials. The screen notified participants when the dimension changed but did not provide details on which dimension changed. To ensure that participants experienced levels of difficulty reflecting the full range of performance, a Halton sequence (Halton & Smith, 1964) semi-randomly assigned an objective task difficulty level at the beginning of each trial and was based on the condition to which a participant was assigned, changing every five trials. The ranges of values across the difficulty conditions were determined through algebraic calculations using the regression equations from Vangsness and Young (2021), which selected sampling values that equated the slopes across the difficulty conditions. Participants observed 35 trials and performed 35 identical trials within each difficulty condition block. A summary of these conditions is provided in Table 2. Stimulus array characteristics unassociated with the participant’s difficulty condition remained set at a fixed value throughout the block (see Table 2). Because the characteristics across dimensions differed, difficulty was standardized (i.e., normalized) by taking each difficulty condition value for a given trial, subtracting the maximum value and dividing by the random sampling value range. The standardized difficulty level ranged from 0 to 1, with values closer to 0 indicating easier levels, and values closer to 1 indicating harder levels.
Role Order
To understand the impact of experience on JODs, we manipulated role order between-subjects. Participants either observed-first, performed-first, or interleaved these two roles (see Figure 1). Those who observed first watched automation perform the task for the first 35 trials of the block, then completed the second 35 trials of the block. Those who performed first completed the first 35 trials of the block, then observed for the remaining 35 trials of the block. Those in the interleaved condition alternated between observing and performing every 5 trials throughout the block.
Automated System Details
Prior to starting the experiment, participants watched a 23s video of the automated system successfully performing four trials (https://www.youtube.com/watch?v=YuI2pZEqC7k). In the clip, the system’s characteristics were based on the fixed values (see Table 2) across all four difficulty conditions. Participants did not receive information regarding how the automation worked.
During the experiment, a predictive modeling equation that mimicked participants’ average performance during a pilot study (Vangsness, 2019) controlled the system’s behavior. The system’s performance was probabilistic, depended on difficulty condition, and standardized difficulty (see Figure 3), and was 62.3% accurate on the whole. Because the automation’s performance was based on past participants’ performance, the general decline in performance as a function of standardized difficulty, suggests that people were sensitive to changes in difficulty. Automated system performance as a function of standardized difficulty. Note. Automated system performance generally decreased as standardized difficulty increased. Participants observed the full range of automated system performance. From “Changes in Trust in Automation (TIA) After Performing a Visual Search Task with an Automated System,” by Driggs & Vangsness (2022), 2022 IEEE 3rd International Conference on Human-Machine Systems (ICHMS). Copyright 2022 by IEEE. Reprinted with permission.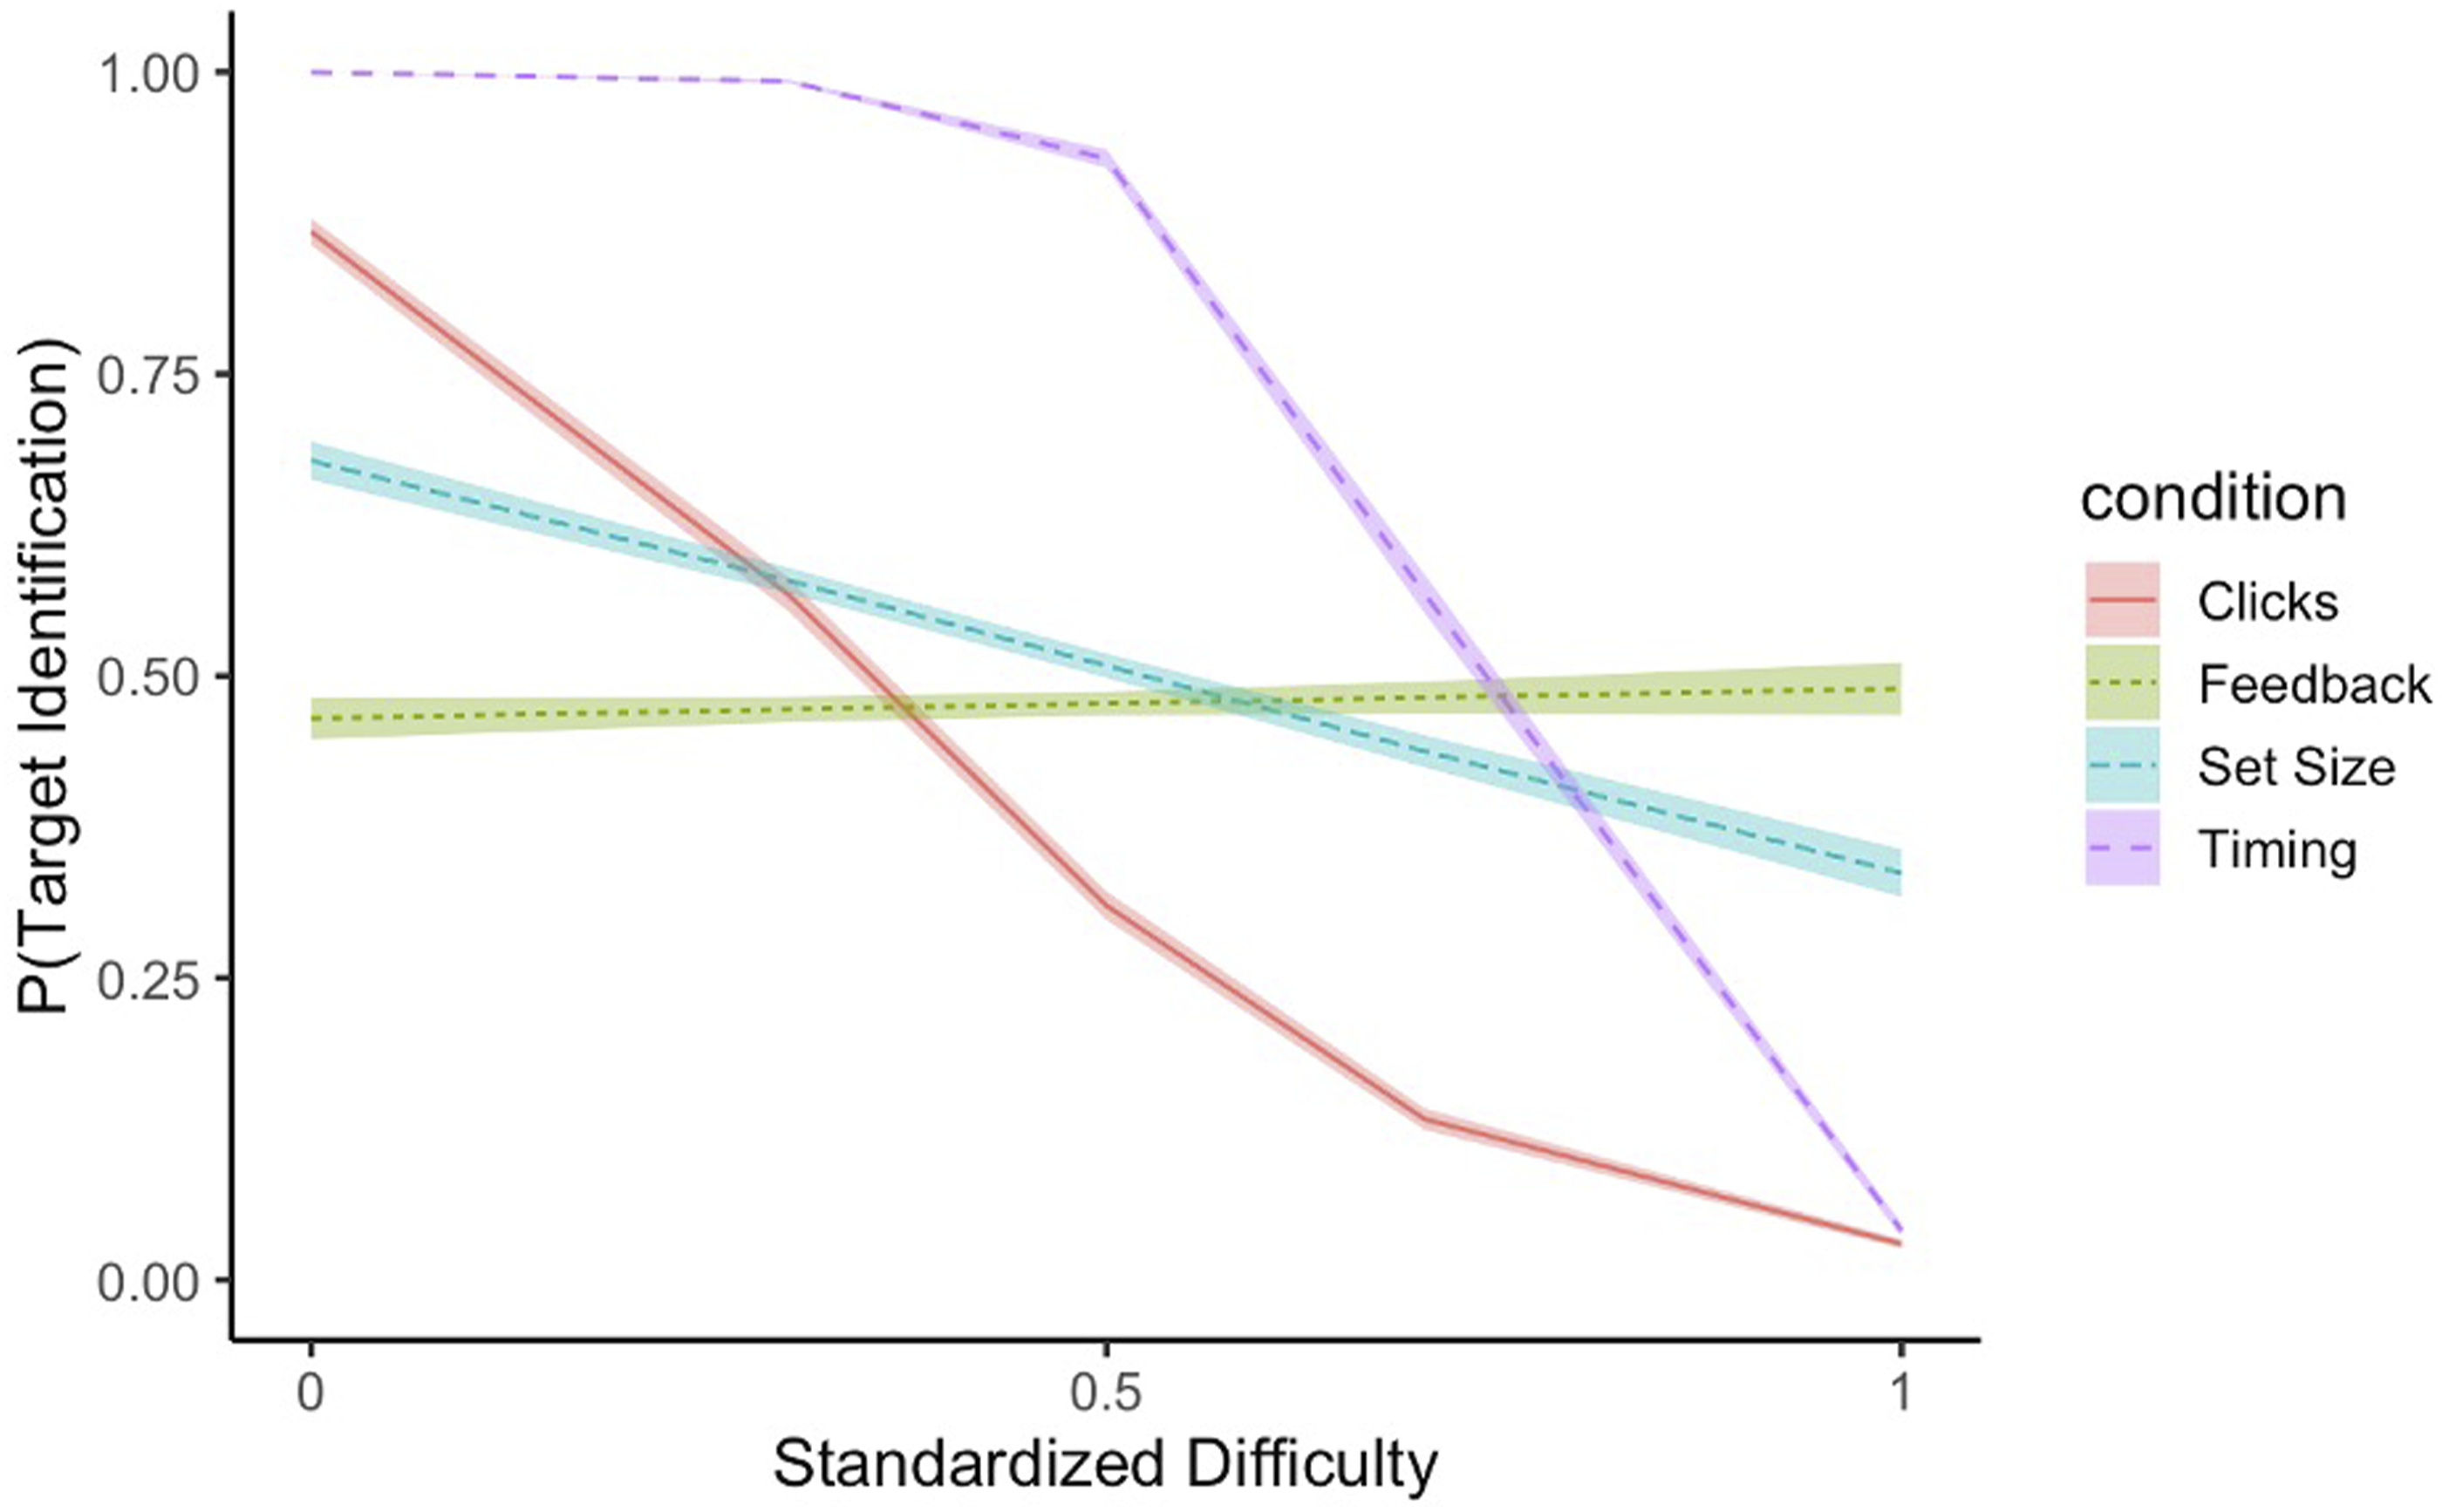
JODs
After each trial, regardless of role, participants rated whether each trial was easier or harder than before by clicking one of two buttons (Vangsness & Young, 2019, 2021). After selecting an option, the buttons would disappear, and the next trial would load. Participants provided a JOD after receiving trial feedback. Repeating this JOD after each trial ensured that participants anchored each judgment to their experiences during the previous trial. Comparative judgments reduce idiosyncratic interpretations of scale anchors and produce more reliable measurements (Böckenholt, 2004).
Demographics Survey/Trust Measurement
Before starting, participants provided demographic information and completed the Propensity to Trust Machines Questionnaire (Merritt & Ilgen, 2008). Participants completed the Trust in Automation Questionnaire (Jian et al., 2000), before and after the experiment. Preliminary analyses confirmed that trust in the automated system decreased pre- to post-experiment (Driggs & Vangsness, 2022).
Results
We cleaned our data and conducted all analyses in R (R Core Team, 2023). We used the brms package (Bürkner, 2017) for the Bayesian regression, conducted post-hoc tests using the emmeans package (Lenth, 2022), and generated all graphs using ggplot2 (Wickham, 2016). The full R-markdown file and data set are provided here: https://osf.io/jzcg2/?view_only=dc380535b9774e19961a1d49048ce735.
Defining Variables
To allow for comparisons of objective task difficulty across difficulty condition (i.e., clicks, set size, and timing), we standardized (i.e., normalized) the difficulty predictor by taking each difficulty condition’s value on a given trial, subtracting the minimum difficulty condition value, and dividing by the sampling range. For example, the standardized difficulty value associated with a trial requiring 6 clicks would be 0.5 (i.e.,
We tracked central cue use by modeling the relationship between this predictor (standardized difficulty) and JODs. This allowed us to understand the extent to which participants tracked objective task difficulty as a cue. We tracked peripheral cue use using target identification, a dichotomous variable indicating whether the target was identified on a given trial. For succinctness, unsuccessful (0) and successful (1) identifications will be described as “misses” and “hits,” respectively. Similarly, for our outcome measure (JODs), we converted easier/harder JODs to 0’s and 1’s, respectively.
Using trial-in-block as a predictor modeled changes in JODs that occurred as participants gained experience within a 70-trial difficulty block. We log-transformed trial-in-block to account for learning effects, which occurred most rapidly at the beginning of a 70-trial difficulty block before participants adjusted to the change in difficulty condition (i.e., clicks, set size, and timing). Role order, a three-level categorical predictor, represented the between-subjects assignment (e.g., perform-first, observe-first, and interleaved). Prior to analysis, we effect coded all categorical predictors and median-centered continuous predictors so that the model intercept represented average cue use halfway through a block. We subset trials to include only those where the objective task difficulty changed (i.e., every fifth trial). Additionally, we subset all feedback difficulty condition trials from the data since the objective task difficulty did not change during those trials.
Bayesian Regression
We used a Bayesian regression to answer RQ1 (how do people make JODs while observing automation?) and RQ2 (how does experience with a task performed by oneself or by automation, impact JODs?). The model included the Trial in Block
Bayesian analyses incorporate a study’s data with a prior distribution (often derived from the statistical results of past studies) to produce a posterior distribution that represents the possible values of model parameters, given this previously observed data (Gelman & Hill, 2014; Young, 2019). Prior distributions represent researchers’ current knowledge about a relationship; here, we derived our priors from a regression model of how humans make JODs while observing humans (Vangsness, 2019). By integrating these priors with the data from a study that involves a slightly different manipulation—such as how humans make JODs while observing automation—we can ascertain whether the new data is sufficiently different to conclude a unique process is at work in a second study (Young, 2019).
In lieu of p-values, Bayesian regressions generate 95% credible intervals (CI) for every model parameter, indicating likely intervals that contain the true parameter estimates. When new data falls within a prior’s CI, the CI narrows due to increased confidence in the estimate; data outside the CI shifts it. CIs excluding zero suggest a statistically significant effect (Gelman & Hill, 2007).
Media Equation Hypothesis versus Unique Agent Hypothesis
We informed the posterior distribution using the estimated regression weights from Vangsness (2019) as normally distributed priors. Estimates are provided in Appendix A and are available on the OSF (https://osf.io/8ghmt/?view_only=295d8f0aac9d40aa928913cf6b6e06fc). If humans treat automation like other humans (MEH), the prior distribution parameter estimates should fall within the 95% CIs of the posterior distribution. Conversely, if humans treat automation differently (UAH), the prior distribution estimates should fall outside the 95% CIs. We direct readers interested in learning more about this approach to Young (2019), who more thoroughly discusses the process of comparing posterior distribution estimates with prior distribution estimates. We estimated the posterior distribution by drawing 8,000 samples across four chains, discarding the first 1,000 samples as a burn in period. All R-hat values (fit indices) for each model parameter equaled one, indicating model convergence (Gelman & Hill, 2014). A summary of the parameter estimates, standard errors, and 95% CIs can be found in Appendix B and on the OSF.
JODs While Observing Automation
Pairwise Comparisons Test the Three-Way Interaction Between Peripheral Cues, Role Order, and Trial in Block.
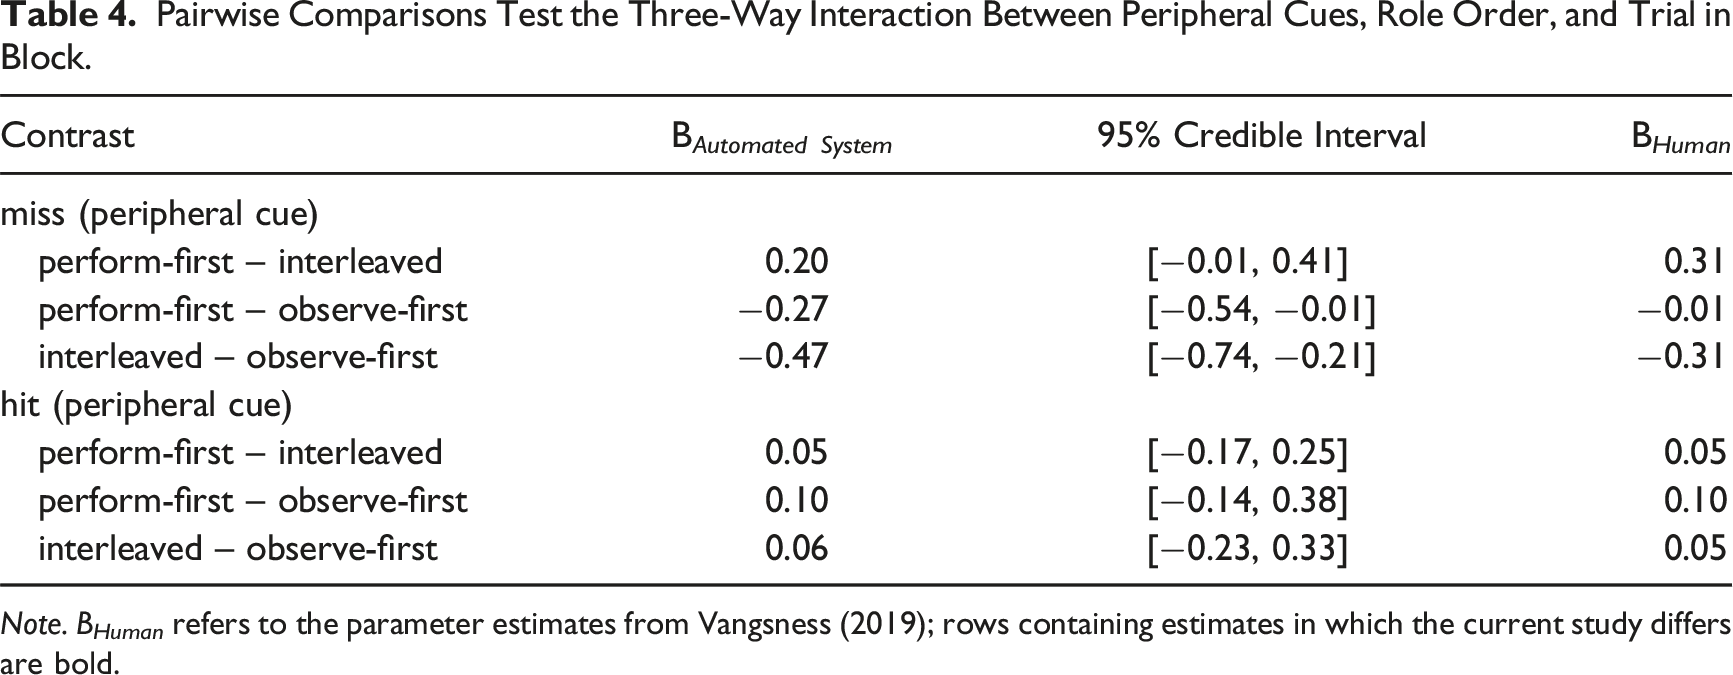
Note. B Human refers to the parameter estimates from Vangsness (2019); rows containing estimates in which the current study differs are bold.
The Impact of Experience on JODs
The role order predictor manipulated participants’ source of experience with the task (i.e., performing or observing automation first). Because participants alternated roles halfway through a 70-trial block, the trial-in-block and role order predictors together provide an opportunity to understand the impact of experience on JODs. Observe-first participants became increasingly likely to weigh misses over the course of a difficulty block (B = 0.25, 95% CI [0.05, 0.42]).
Central and Peripheral Cue Use for Humans versus Automated Systems
Slope Estimates for the Two-Way Interaction Between Central Cues and Role Order.
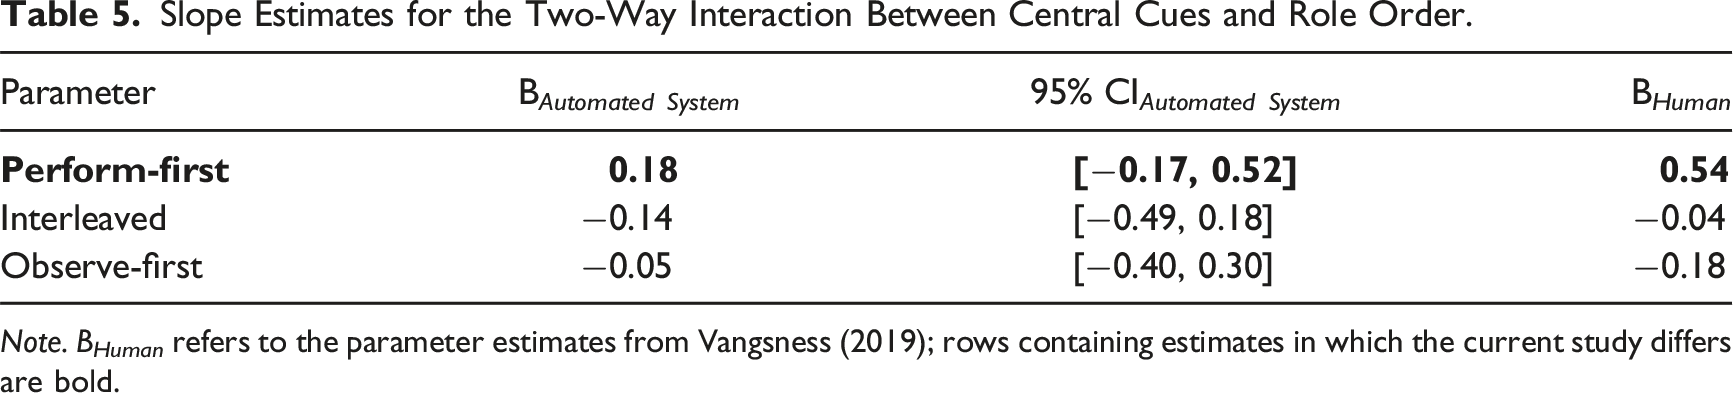
Note. B Human refers to the parameter estimates from Vangsness (2019); rows containing estimates in which the current study differs are bold.
Slope Estimates for the Three-Way Interaction Between Central Cues and Role Order at Trial 36.
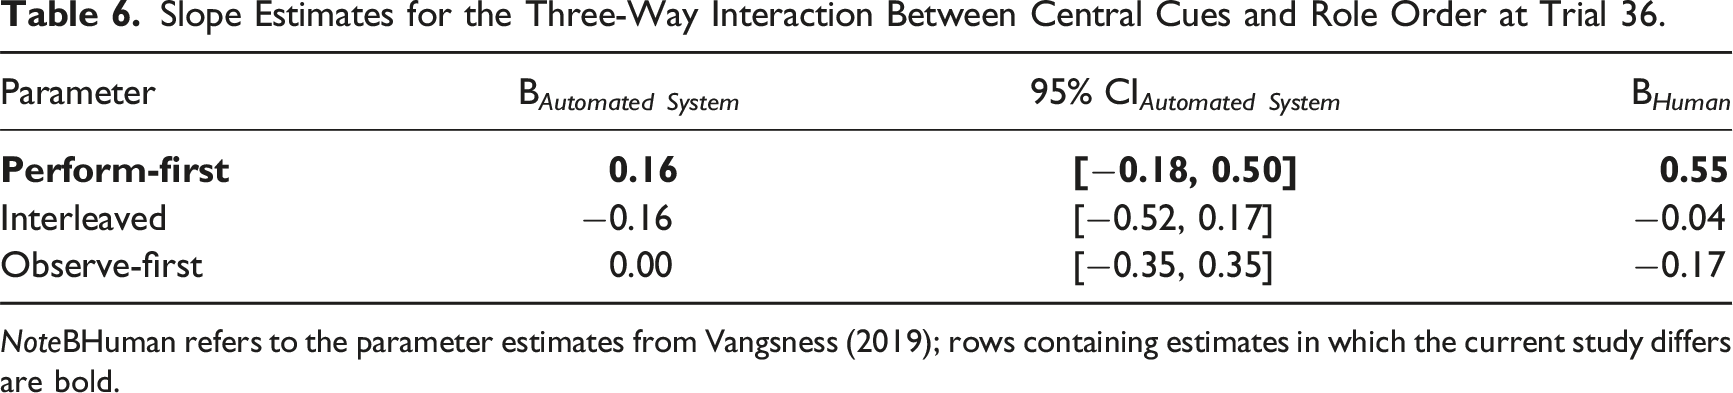
NoteBHuman refers to the parameter estimates from Vangsness (2019); rows containing estimates in which the current study differs are bold.
Slope Estimates for the Three-Way Interaction Between Central Cues and Role Order at Trial 53.
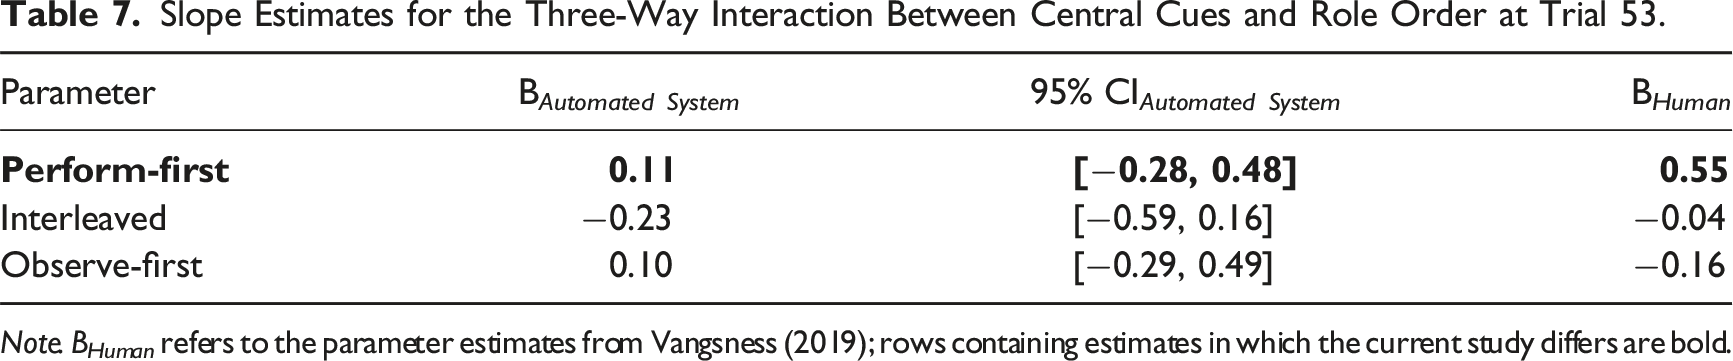
Note. B Human refers to the parameter estimates from Vangsness (2019); rows containing estimates in which the current study differs are bold.
Slope Estimates for the Three-Way Interaction Between Central Cues and Role Order at Trial 70.
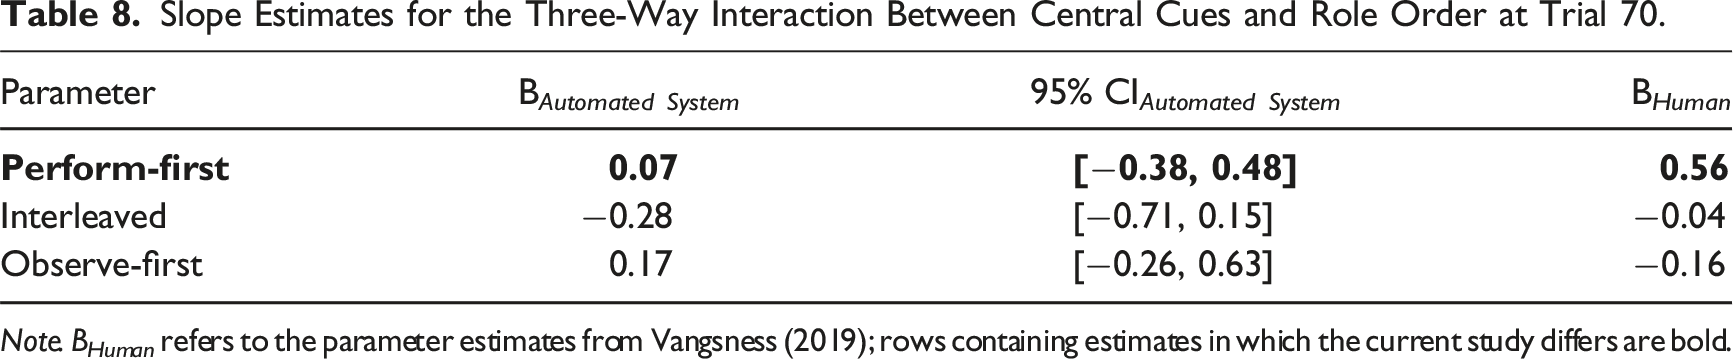
Note. B Human refers to the parameter estimates from Vangsness (2019); rows containing estimates in which the current study differs are bold.
Slope Estimates for the Three-Way Interaction Between Peripheral Cues, Role Order, and Trial in Block.
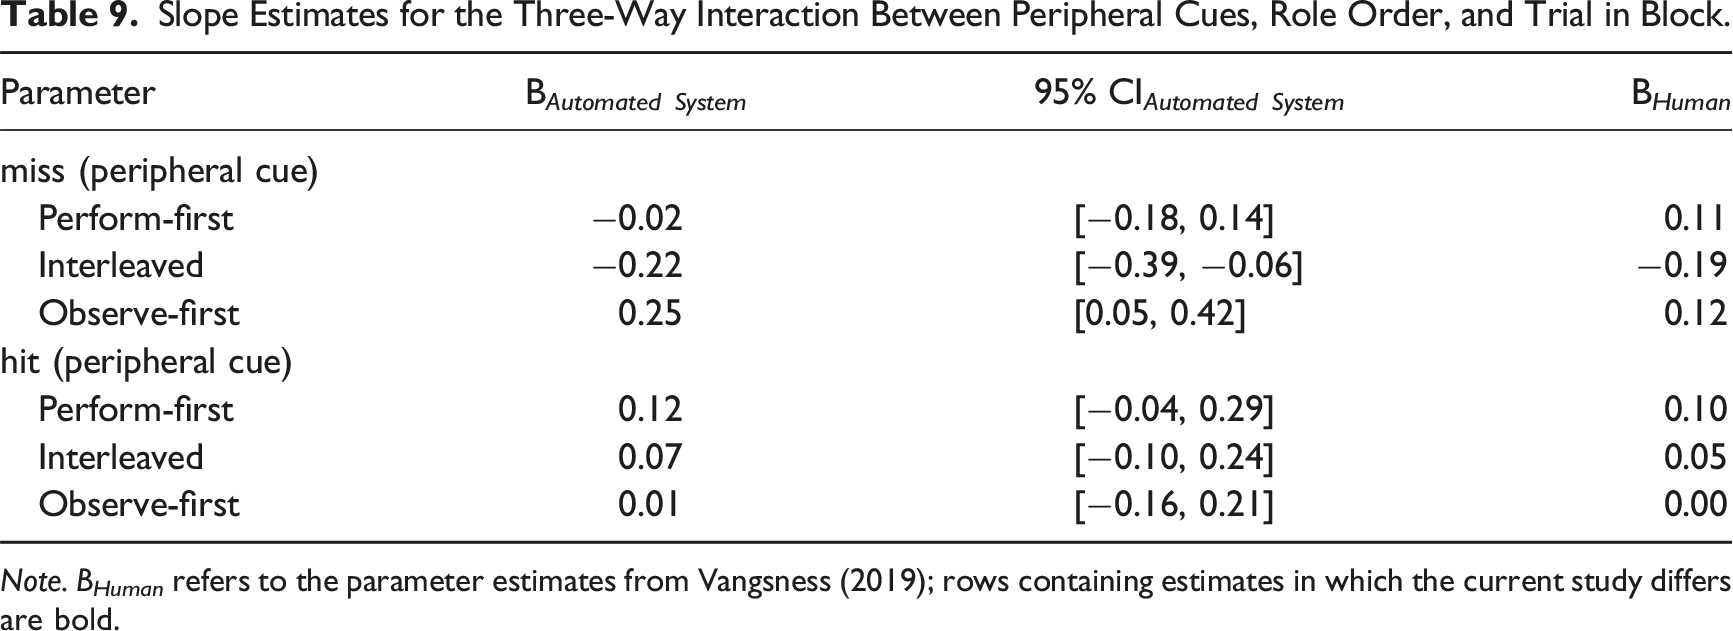
Note. B Human refers to the parameter estimates from Vangsness (2019); rows containing estimates in which the current study differs are bold.
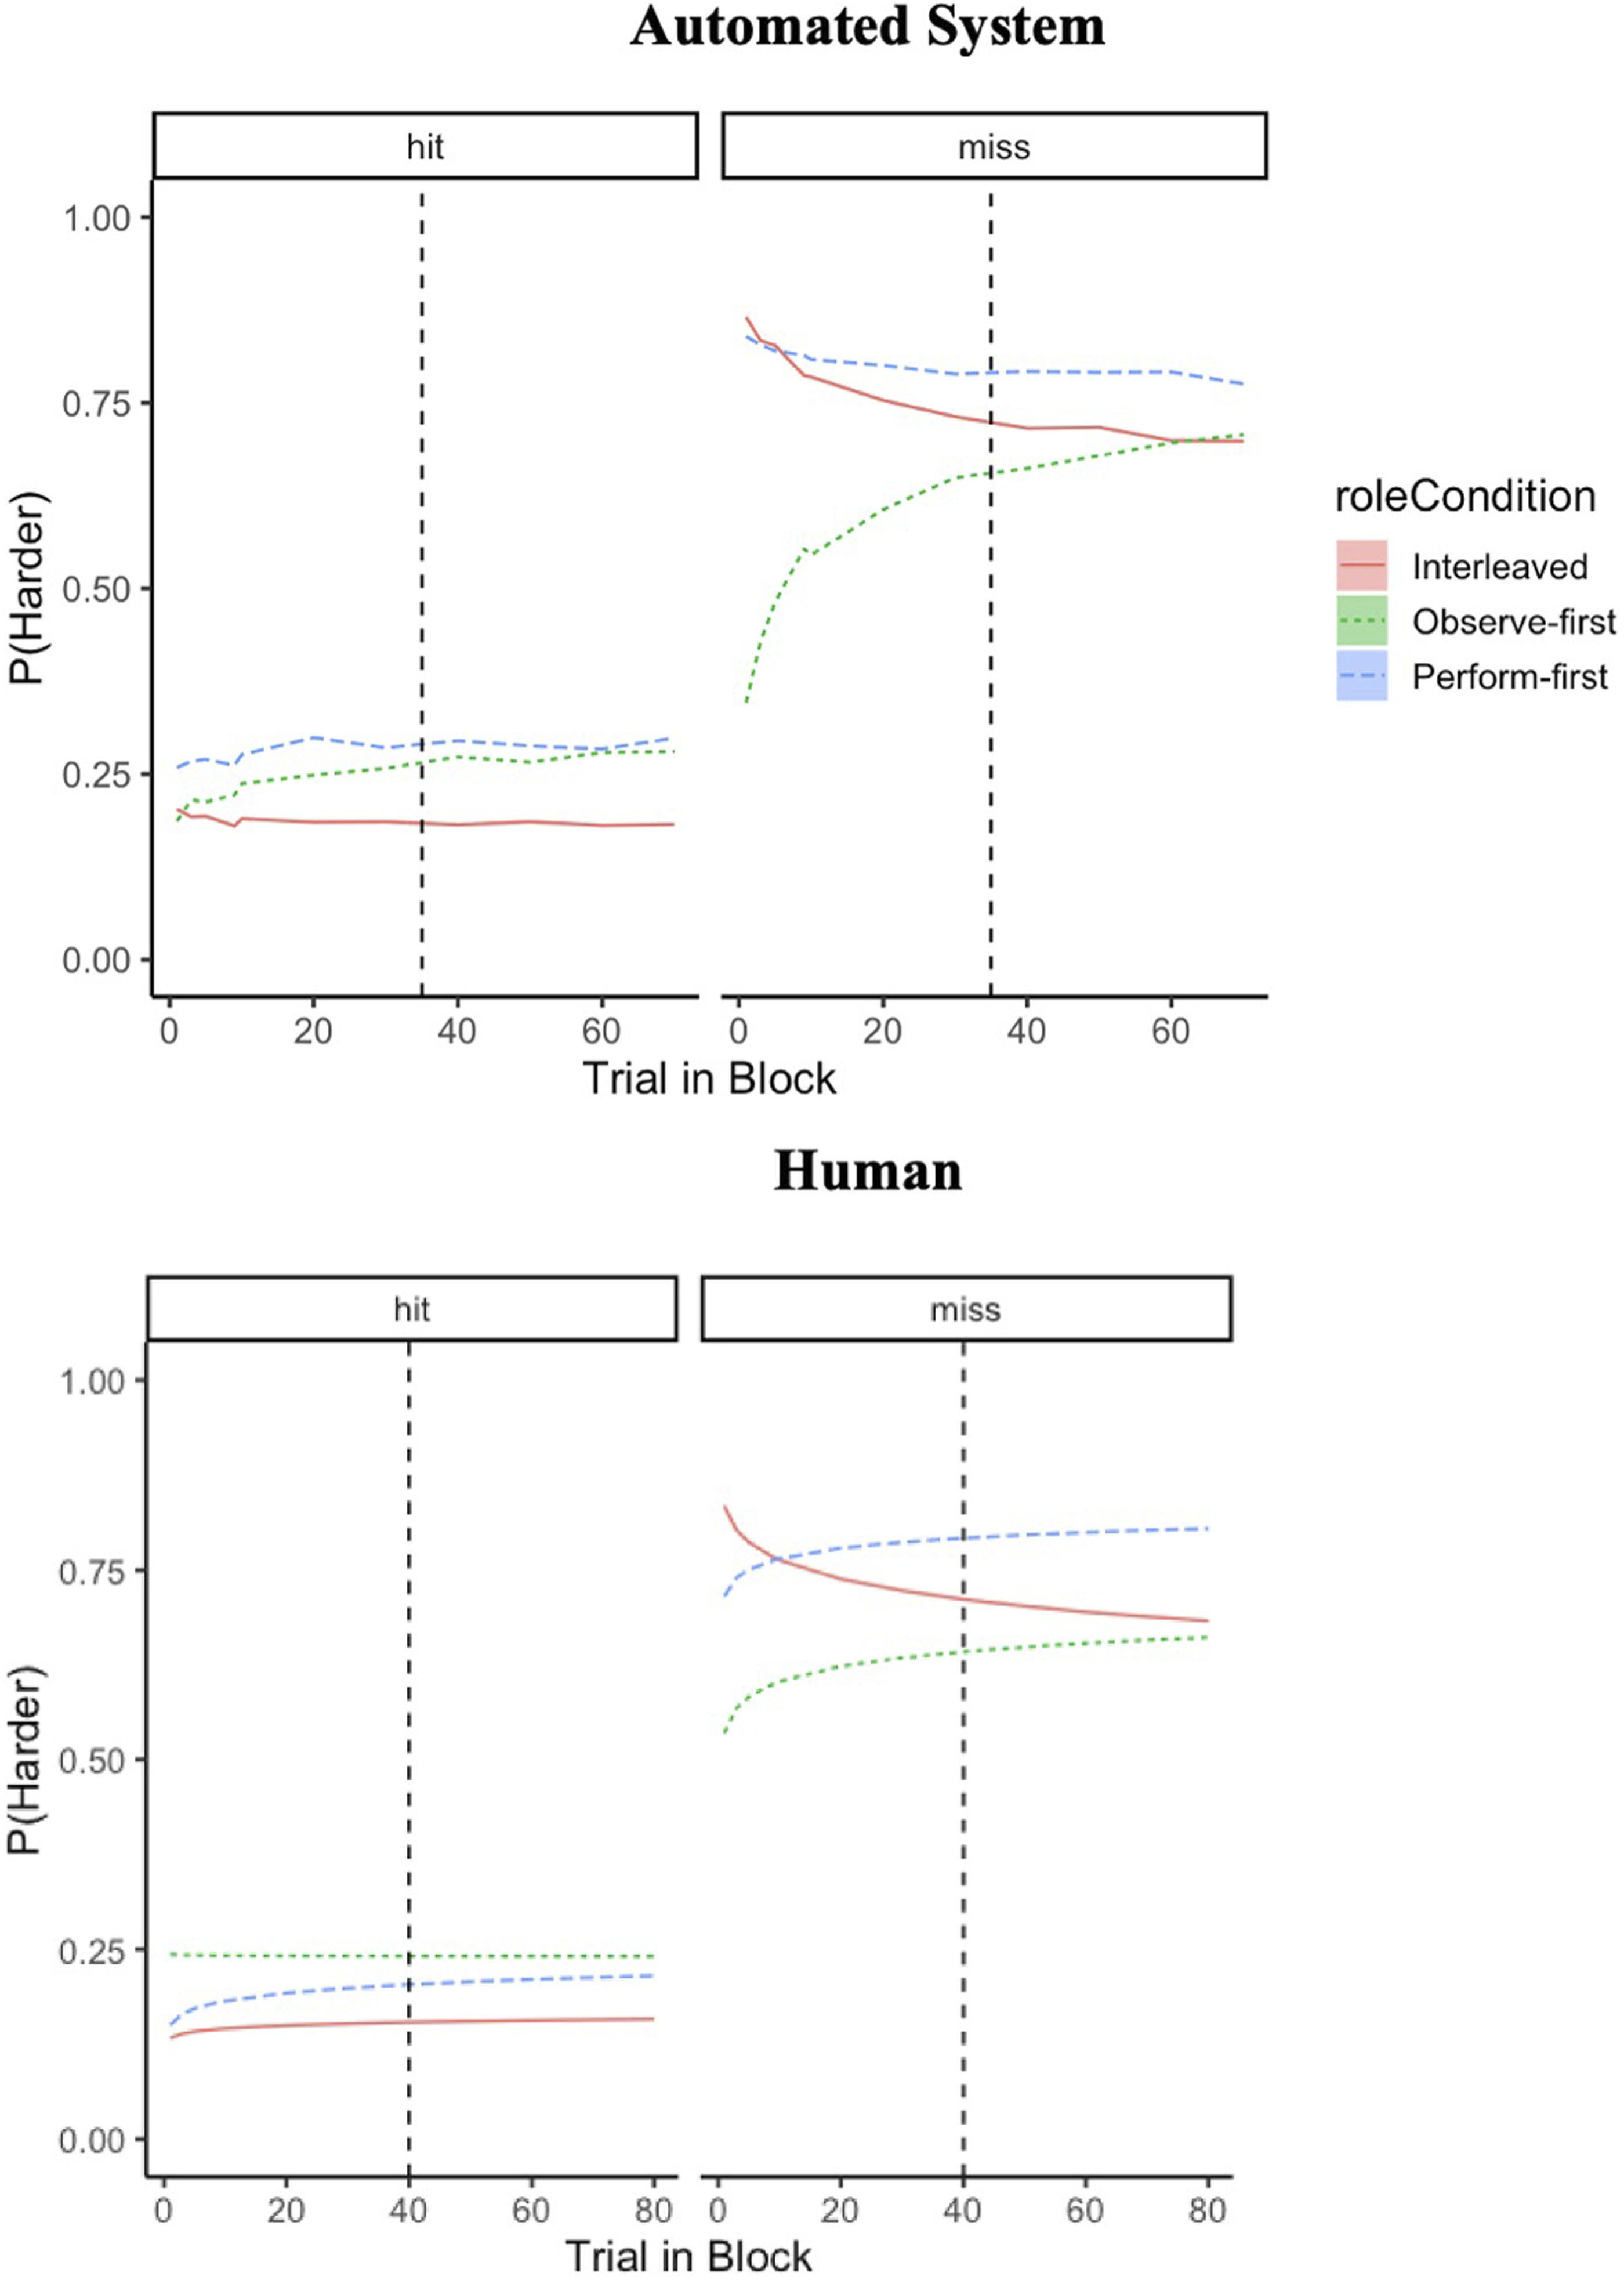
Bayesian (top) and Logistic (bottom) regressions illustrate similarities in how humans weigh peripheral cues in JODs for automated systems and humans. Note. Panels represent whether the target was successfully identified (hit) or not (miss) on a given trial. The dashed line represents the halfway point, at which participants shifted roles during a block (trial 35 for the automated system study and trial 40 for the human study). The bottom graph was reproduced from the data in Vangsness (2019) with permission.
Discussion
We addressed two research questions: how do people make JODs while observing automation and how does past experience with a task performed by oneself or by automation impact JODs? JODs were most strongly impacted by peripheral cues. Participants were most likely to rate the task as harder after receiving feedback that they (or the automated system) had missed the target. Although we intentionally manipulated central cues, participants did not use this cue to make JODs; this did not change as a function of role order or time. Weighting of misses significantly differed between perform-first and observe-first participants, with observe-first participants becoming increasingly likely to rate the task as harder over time in response to misses. Lastly, the results suggest that the process by which people make JODs for automation is both similar to and different from the way the make JODs for humans, given the previous evidence from a study involving humans (Vangsness, 2019). Although support for the MEH was unequivocal with respect to peripheral cues, with respect to central cues, role order bounded support for the UAH: those who performed the task first underweighted central cues when making JODs during periods of automation observation, relative to their counterparts in the previous study involving humans.
Unique Agent Hypothesis versus Media Equation Hypothesis
Our analyses evaluated two hypotheses in the TiA literature. The results provided support to both the MEH and UAH: people used peripheral cues similarly while observing automation or humans, while those with earlier task experience differed in central cue use across observation source. Although we did not manipulate who or what was observed, we used a Bayesian Regression to compare these results with Vangsness (2019), who did. The posterior distribution credible intervals encompassed the parameter estimates from Vangsness (2019) for peripheral cue use—but not for central cue use for perform-first participants.
Similarities and Differences in Cue Weighting While Observing Other Humans and Automation
Regarding peripheral cue use, participants in our study viewed automation in the same way as other humans (i.e., MEH; Reeves & Nass, 1996), which suggests that there are similar judgment and decision making processes that underlie both situations (Epley et al., 2007; Madhavan & Wiegmann, 2007). Because the automated system mirrored the imperfect performance of humans, it is possible that participants might have relied on learned social scripts from past human–human interactions (Nass & Moon, 2000), which could explain the similarities in peripheral cue weighting across observation sources.
Regarding central cue use, perform-first participants in our study viewed automation differently from other humans (i.e., UAH; de Visser et al., 2016). It is possible that perform-first participants may have exhibited an automation bias (Dzindolet et al., 2002; Parasuraman & Manzey, 2010) while observing, which could explain the underweighting of central cues while observing automation—relative to the study involving humans. Together, these findings are consistent with the points highlighted in Madhavan and Wiegmann (2007)—although humans possess a propensity to apply rules governing human–human interactions to automated systems, there are subtle differences to the manner in which humans perceive and react to automation—relative to other humans. Lastly, these findings align with recent work which suggests that the MEH and UAH can be simultaneously supported (Alarcon et al., 2023; Cohen et al., 2021), underscoring the nuances of human attitudes towards automation.
Study Limitations/Future Directions
We instructed participants to observe passively, without the option to engage/disengage automation. Therefore, an alternative interpretation of this stimuli could be that participants simply experienced a period of task familiarization before completing the task themselves. This limits our ability to generalize our findings to contexts where people actively engage with automation (i.e., level 2–level 8 automation; Parasuraman et al., 2000). Future research should be conducted to determine if and how this impacts how cues are used to make JODs. It is also possible that participants in the observe-first condition could have experienced a degree of high monitoring workload/automation vigilance issues (Warm et al., 1996), providing an alternative explanation of the differences between observe-first and perform-first participants for peripheral cue use. Lastly, visual search tasks are known to be related to individual difference factors (e.g., attention and memory abilities, video game experience)—our work is limited in that it did not account for these factors.
Our research evaluated the extent to which humans track difficulty as a cue. Future research would benefit from understanding how people weigh different cues as to whether automation will succeed at a task and how humans weight different trust cues (e.g., automation performance; de Visser et al., 2014). It is worth noting that because we based our model priors on JOD data for human observation, inherently there is a bias in support of the MEH. We encourage future studies to build on our work, using our parameter estimates as a prior distribution—or by including a true between-subjects manipulation. Lastly, there is emerging research (de Visser et al., 2018; Somon et al., 2019) monitoring brain activity while observing automation—or another human—perform a task (e.g., Flanker task). Future research would benefit from expanding our research to include physiological measures.
Conclusion
Our work supports both the MEH and UAH and suggests that the cues used while observing automation are similar to and different from those used to make JODs when observing humans. Together, these findings underscore the nuances to our interactions with automation and highlight the moderating impact of experience: performing a task first can contribute to an underweighting of central cues while observing automation, while observing automation first can lead to lower anchored JODs that eventually come into alignment with those with earlier task experience.
At the onset, automation came online to replace tasks previously performed by humans (Parasuraman & Riley, 1997; Rahwan et al., 2019). This context aligns with the perform-first condition in our preparation, resembling instances where humans transfer tasks to highly automated systems (i.e., Level 10; Parasuraman et al., 2000). TiA research involves humans observing automation perform unfamiliar tasks. Our work calls into question the generalizability of research that involves humans observing automation perform tasks with which they have no previous experience.
Our findings serve as a warning to system designers. Anchoring to easier JODs for automation could lead to inappropriate levels of reliance (Parasuraman & Riley, 1997). Understanding how experience moderates JODs for oneself creates instances where automation use more closely mirrors real-life situations; this is crucial in promoting calibrated TiA.
Footnotes
Acknowledgments
We would like to thank Olivia Tipton, Laila Robinson, and Courtney Brown for their assistance with data collection. Any opinions, findings, and conclusions or recommendations expressed in this material are those of the authors and do not reflect the official guidance or position of the United States Government, the Department of Defense or of the United States Air Force.
Key Points
• Patterns of cue use while observing an automated system support the Media Equation and Unique Agent Hypotheses. • JODs were most strongly impacted by peripheral cues to difficulty and were unaffected by central cues to difficulty. • Task experience moderates our JODs while observing automated systems. Observing automation first can lead to lower anchored JODs that eventually come into alignment with those with earlier task experience. Performing a task first can contribute to an underweighting of central cues.
Declaration of Conflicting Interests
The author(s) declared no potential conflicts of interest with respect to the research, authorship, and/or publication of this article.
Funding
The author(s) received no financial support for the research, authorship, and/or publication of this article.
Appendix A
Parameter Estimates from Vangsness (2019). Note. Trial in block was centered on the median (M = 40.00). Hits and role order were effect coded, with misses serving as the {−1} baseline for Hits, and Observe-first serving as the {−1, −1} baseline for experimental condition.
Parameter
B
SE
z
p
Intercept
−0.23
0.09
−2.66
0.01
Trial in block
−0.03
0.04
0.73
0.47
Standardized difficulty
0.11
0.15
0.78
0.44
Target identification
1.17
0.10
12.09
<.001
Perform-first
0.21
0.12
1.72
0.08
Interleaved
−0.17
0.12
−1.40
0.16
Standardized difficulty × Trial in block
0.01
0.12
0.10
0.92
Standardized difficulty × Perform-first
0.44
0.20
2.19
0.03
Standardized difficulty × Interleaved
−0.15
0.20
−0.78
0.44
Trial in block × Perform-first
0.08
0.06
1.28
0.20
Trial in block × Interleaved
−0.10
0.06
−1.75
0.08
Trial in block × Target identification
−0.02
0.04
−0.41
0.68
Target identification × Perform-first
0.18
0.13
1.33
0.19
Target identification × Interleaved
0.13
0.13
0.99
0.32
Trial in block × Target identification × Perform-first
0.02
0.17
0.05
0.96
Trial in block × Target identification × Perform-first
−0.10
0.06
−1.73
0.08
Trial in block × Standardized difficulty × Perform-first
0.02
0.06
0.40
0.69
Trial in block × Standardized difficulty × Interleaved
−0.10
0.06
−1.73
0.08
Appendix B
Parameter Estimates from the Bayesian Regression Predicting JODs. Note. Trial in block was centered on the median (M = 35.00). Hits and role order were effect coded, with misses serving as the {−1} baseline for Hits, and Observe-first serving as the {−1, −1} baseline for experimental condition.
Parameter
B
SE
95% Credible Interval
Intercept
−0.22
0.07
[−0.35, −0.08]
Trial in block
0.03
0.03
[−0.03, 0.10]
Standardized difficulty
−0.01
0.10
[−0.21, 0.19]
Target identification
1.19
0.07
[1.04, 1.33]
Perform-first
0.22
0.09
[0.05, 0.40]
Interleaved
−0.10
0.09
[−0.28, 0.08]
Standardized difficulty × trial in block
−0.01
0.10
[−0.20, 0.18]
Standardized difficulty × perform-first
0.17
0.13
[−0.09, 0.41]
Standardized difficulty × interleaved
−0.16
0.14
[−0.42, 0.11]
Trial in block × perform-first
0.01
0.05
[−0.08, 0.10]
Trial in block × interleaved
−0.11
0.05
[−0.20, −0.02]
Trial in block × target identification
−0.03
0.03
[−0.10, 0.03]
Target identification × perform-first
0.09
0.09
[−0.09, 0.27]
Target identification × interleaved
0.17
0.10
[−0.02, 0.36]
Trial in block × target identification × perform-first
−0.04
0.05
[−0.13, 0.05]
Trial in block × target identification × perform-first
−0.11
0.05
[−0.20, −0.01]
Trial in block × standardized difficulty × perform-first
−0.13
0.14
[−0.40, 0.14]
Trial in block × standardized difficulty × interleaved
−0.15
0.14
[−0.42, 0.13]
Appendix C
Pairwise Comparisons Testing Participants’ Central Cue Use Over Time.
Trial 1
parameter/contrast
B
95% Credible Interval
difficulty slope (central cue)
perform-first – interleaved
0.23
[-1.34, 1.73]
perform-first – observe-first
1.65
[-0.44, 3.51]
interleaved – observe-first
1.43
[-0.68, 3.41]
Trial 17
parameter/contrast
B
95% Credible Interval
difficulty slope (central cue)
perform-first – interleaved
0.31
[-0.20, 0.81]
perform-first – observe-first
0.47
[-0.17, 1.05]
interleaved – observe-first
0.16
[-0.46, 0.79]
Trial 35
parameter/contrast
B
95% Credible Interval
difficulty slope (central cue)
perform-first – interleaved
0.32
[-0.08, 0.74]
perform-first – observe-first
0.18
[-0.34, 0.67]
interleaved – observe-first
−0.15
[-0.66, 0.38]
Trial 36
parameter/contrast
B
95% Credible Interval
difficulty slope (central cue)
perform-first – interleaved
0.32
[-0.08, 0.74]
perform-first – observe-first
0.16
[-0.37, 0.65]
interleaved – observe-first
−0.17
[-0.68, 0.36]
Trial 53
parameter/contrast
B
95% Credible Interval
difficulty slope (central cue)
perform-first – interleaved
0.34
[-0.13, 0.78]
perform-first – observe-first
0.01
[-0.58, 0.57]
interleaved – observe-first
−0.33
[-0.93, 0.24]
Trial 70
parameter/contrast
B
95% Credible Interval
difficulty slope (central cue)
perform-first – interleaved
0.35
[-0.17, 0.86]
perform-first – observe-first
−0.11
[-0.79, 0.54]
interleaved – observe-first
−0.45
[-1.14, 0.20]]