
Abstract
Objective
The primary purpose was to determine how trust changes over time when automation reliability increases or decreases. A secondary purpose was to determine how task-specific self-confidence is associated with trust and reliability level.
Background
Both overtrust and undertrust can be detrimental to system performance; therefore, the temporal dynamics of trust with changing reliability level need to be explored.
Method
Two experiments used a dominant-color identification task, where automation provided a recommendation to users, with the reliability of the recommendation changing over 300 trials. In Experiment 1, two groups of participants interacted with the system: one group started with a 50% reliable system which increased to 100%, while the other used a system that decreased from 100% to 50%. Experiment 2 included a group where automation reliability increased from 70% to 100%.
Results
Trust was initially high in the decreasing group and then declined as reliability level decreased; however, trust also declined in the 50% increasing reliability group. Furthermore, when user self-confidence increased, automation reliability had a greater influence on trust. In Experiment 2, the 70% increasing reliability group showed increased trust in the system.
Conclusion
Trust does not always track the reliability of automated systems; in particular, it is difficult for trust to recover once the user has interacted with a low reliability system.
Applications
This study provides initial evidence into the dynamics of trust for automation that gets better over time suggesting that users should only start interacting with automation when it is sufficiently reliable.
Keywords
Introduction
Humans interact with automation in a variety of environments, including aviation, military operations, motor vehicle operation, and information retrieval (Lee & See, 2004). Automation can be defined as “technology that actively selects data, transforms information, makes decisions, or controls processes” (Lee & See, 2004, p. 50) and is more frequently being used in complex decision making tasks (Parasuraman & Riley, 1997; Rovira et al., 2007; Wickens & Dixon, 2007). Human performance can be aided using automated systems (Sheridan, 2002); however, if automation performance is impaired or unreliable, human operators must recognize the failure and adjust their dependence on the system to avoid errors or failures.
The extent to which an individual trusts an automated system is thought to play an important role in how they will interact with the system, and the outcomes of the larger human-automation system. With regard to automation, trust can be defined as “the attitude that an agent will help achieve an individual’s goals in a situation characterized by uncertainty and vulnerability” (Lee & See, 2004, p. 54). To promote optimal performance within human-automation interactions, it is vital that trust in an automated system corresponds to the system’s capabilities (Lee & See, 2004)—often referred to as trust calibration. It has been demonstrated that low levels of trust lead to underuse, while high levels of trust lead to overuse (Saeidi & Wang, 2019; Seppelt & Lee, 2019). In these cases, the mismatch between an individual’s trust and the accuracy of the system (i.e., reliability) results in a miscalibration, and in turn, an inappropriate use of the system and poor performance (Abbass et al., 2016; Boubin et al., 2017; Chen & Barnes, 2014).
Early work on trust in automated systems examined how trust was acquired and the impact that failures had on the development of trust using an automated system that operated at a fixed reliability level and included automation failures that occurred at different magnitudes (Lee & Moray, 1992). While interacting with a 75%–80% efficient system, participants’ trust in the system steadily increased. In situations where faults occurred, user trust decreased but recovered shortly after (Lee & Moray, 1992). This effect has been repeated in numerous studies over the years (see Lee & See, 2004 for an overview). However, some automated systems do not catastrophically fail; rather, their reliability may change subtly during use (Lafond et al., 2013; Marois et al., 2023). Experimentally, manipulating automation reliability between subjects has been shown to affect user trust, where higher levels of reliability have been associated with higher levels of trust (Moray et al., 2000; Ross et al., 2008; Strickland et al., 2023). There is evidence of a minimal reliability threshold—around 70%—for maintaining usefulness to the user (Wickens & Dixon, 2007). In practice, the reliability of systems often varies, and trust is dynamic, such that users can continually update their trust as they are interacting with an automated system (Akash et al., 2017; Desai et al., 2013; Xu & Dudek, 2015).
Several studies have examined how trust changes when the reliability level of a system differs within subjects (Chancey et al., 2015, 2017; Yu et al., 2017). Yu et al. (2017) had participants complete four blocks of 30 trials, where the first block acted as a baseline with 100% automation reliability. Following the baseline block, the reliability of the automation decreased with 90%, 80%, and 70% reliability conditions presented in random order. At 70% reliability, user trust declined steadily, whereas trust in the 80% and 90% reliability blocks did not (Yu et al., 2017). Since the changes in reliability were randomized, rather than sequential, large changes in automation reliability may have caused a significant shift in user trust, particularly when reliability jumped from 100% to 70%. This is consistent with other studies that have also used large changes in automation reliability (Chancey et al., 2015, 2017).
Some researchers have begun to look at trust as a highly dynamic variable that can change on smaller time scales such as within blocks, across only a few trials. The sequence of events leading can impact changes in trust indicating that there is an effect of the order of automation failures that influences how trust will change based on the distribution, type, and magnitude of errors (Sanchez et al., 2014; Yang et al., 2021). A key highlight across these papers is that automation failures have a greater effect on trust than automation success, causing trust to degrade in the presence of failures at a quicker rate than it is regained when the automation is performing accurately.
The literature to date has primarily focused on decreases in automation reliability, with previous research extensively characterizing automation use in the context of automation failures (Desai et al., 2012; Guznov et al., 2016; Honig & Oron-Gilad, 2018; Lee & Moray, 1992; Lee & See, 2004; Sanchez et al., 2014; Yu et al., 2017), with automation failures often leading to dramatic declines in trust that can take many interactions to recover. Given its propensity to make errors, it may be difficult to build trust in automation that starts with lower reliability; however, little research has examined how trust changes with regard to automation that is improving as an individual interacts with it. The impact of increases in reliability over time is relevant for machine learning algorithm-based aids that may improve their reliability as they obtain more examples from which to learn in the environment.
Merritt, Lee et al. (2015) sought to determine the dynamics of trust in both increasing and decreasing reliability conditions where the automation was 80%, 85%, 90% and 95% reliable in sequential order across blocks. It was determined that trust calibration was minimally associated with task performance and failure detection, suggesting that the benefits of trust calibration may have less of an effect than originally postulated (Merritt, Lee et al., 2015). Merritt et al.’s (2015b) assessment of trust calibration is admirable; however, it leaves open some questions about why calibration may not have occurred. For instance, it would be beneficial to characterize how trust may change following a shift in reliability level (i.e., the rate of change of trust within a block following a change in reliability). Much of the previous research has presented a single trust value or a mean trust value for a block of trials, which although informative about the overall trend, does not describe how trust changes. By examining trust changes on a finer scale, more information can be provided about how both increasing and decreasing automation reliability affects trust dynamics.
Previous research regarding trust in automation has also examined the influence of internal factors such as self-confidence, which impacts the decision making that guides trust in and use of automated systems (Lee & See, 2004). Self-confidence has been defined as an individual’s “sense of their competence and skill, their perceived capability to deal effectively with various situations” (Shrauger & Schohn, 1995, p. 256). Building on general self-confidence, there is also task specific self-confidence—one’s belief of success without aid with respect to a specific task—which may influence an individual’s willingness to use advice from an automated system. Users are expected to use system advice only when their perception of the system’s capabilities (i.e., their trust or confidence in the system) exceeds their perception of their own abilities (Hutchinson et al., 2022; Lee & Moray, 1994; cf. Williams et al., 2023). Individuals with high task-specific self-confidence are less likely to consider evidence that is incongruent with their own beliefs, as described by the overconfidence bias (Wickens et al., 2021). Further, the benefits of automated systems are expected to be greater when self-confidence is low (Huegli et al., 2020). However, more recent research has suggested that the relationship is more complicated; when users have greater self-confidence, their trust in automation better predicts whether they will use the automation (Williams et al., 2023). Given the mixed findings regarding the relationship between self-confidence and trust in automation, it is important to account for a user’s self-confidence when understanding the relationship between trust and automation reliability.
Self-confidence is also a factor that can be changed with interactions with automation, and may be influenced by automation reliability; however, the supporting literature is mixed in this regard. A decrease in automation reliability can decrease self-confidence (Chong et al., 2022; Weigmann et al., 2001) and an increase in reliability can improve self-confidence (Wiegmann et al., 2001). Contrarily, another study using a simulation based on a real world heat exchanger found no relationship between self-confidence and automation reliability (Moray et al., 2000). Thus, clarity regarding the relationship between a user’s self-confidence and automation reliability, as well as its interaction with trust, is needed.
Overall, the literature supports trust being dynamic in nature, such that users continually update their trust as automation reliability changes. Other factors, such as users’ self-confidence in a task, may interact with trust and affect how it dynamically changes while interacting with a system, and thus, should be considered. Therefore, the primary purpose of the present research was to compare how trust changes between increasing and decreasing automation reliability levels. To test the dynamics of trust, we set out to examine a large number of brief interactions between a user and a system that operated at a wide range of reliability levels. To do so, we implemented a simple binary decision task with system recommendations—reflecting a decision support system in Endsley’s 1987 hierarchy (Endsley, 1987; Endsley & Kaber, 1999). It was hypothesized that there would be a relationship between trust and reliability level in both increasing and decreasing groups, such that trust would gradually improve in the increasing reliability conditions and gradually degrade in the decreasing reliability condition. Since errors made by automation have been noted to have a significant and lasting impact on trust, it was anticipated that changes in trust may occur at a different rate for each group. The secondary purpose was to determine how self-confidence was associated with trust and automation reliability level. Given the exploratory nature of this secondary purpose, no directional hypothesis was made.
Method
Participants
Participants were recruited through Dalhousie University’s psychology participant pool (81.6% of participants) as well as social media advertisements (Instagram, Twitter; 18.4% of participants) to complete an online study. The only inclusion criterion was that participants needed to be able to discriminate between colors and be 18 years of age or older. Ninety-eight participants (mean age = 21.1, SD = 2.95; gender: 20.2% male, 77.7% female, 2.1% nonbinary) completed the experiment, where fifty-three participants (mean age = 21.4, SD = 2.51; gender: 14.0% male, 84.0% female, 2.0% nonbinary) were randomly assigned to interact with an automated system that increased in reliability and forty-five participants (mean age = 20.90, SD = 3.39; gender: 27.0% male, 70.5% female, 2.3% nonbinary) were randomly assigned to a system that decreased in reliability (see study design below). Of note, the demographic information of four participants was not retrievable (three from the increasing condition and one from the decreasing condition) due to limitations in how the data was collected to keep the anonymity of all participants. An a priori power analysis (conducted in G*Power2, goal: 0.8 power, with 𝛼 = 0.05) determined that a minimum of 40 participants were required in each group based on effect sizes from research comparing trust in automation between groups (Barnhart et al., 2023; Du et al., 2020; Hussein et al., 2020). Participants were compensated 15 Canadian dollars (CAD), where 10 CAD was guaranteed from the outset of the experiment and 5 CAD was used as a fictitious performance incentive (described in more detail in the procedure). Those who were registered through Dalhousie University’s psychology participant pool could opt to be compensated with partial course credit instead of the 10 CAD, with the same 5 CAD being used as a (fictitious) performance incentive. This research complied with the tenets of the Declaration of Helsinki and was approved by the Institutional Review Board at Dalhousie University. Informed consent was obtained from each participant.
Study Design
Prior to the experiment, participants read the task instructions and completed a series of questionnaires (described below). The participants then completed 25 practice trials (without automation), followed by six blocks of 50 experimental trials. In each block, the automated aid had a different reliability level. For the increasing reliability group, the reliability increased in 10% increments starting at 50% reliability and ending at 100% reliability (i.e., 50%, 60%, 70%, 80%, 90%, and 100%). The decreasing reliability group started at 100% reliability and ended at 50% reliability (i.e., 100%, 90%, 80%, 70%, 60%, and 50%). Trust and self-confidence (see measures below; Figure 2(c)) were measured five times per block (every 10 trials) for a total of 30 measurements. The study design can be visualized in Figure 1. Flow diagram of study design.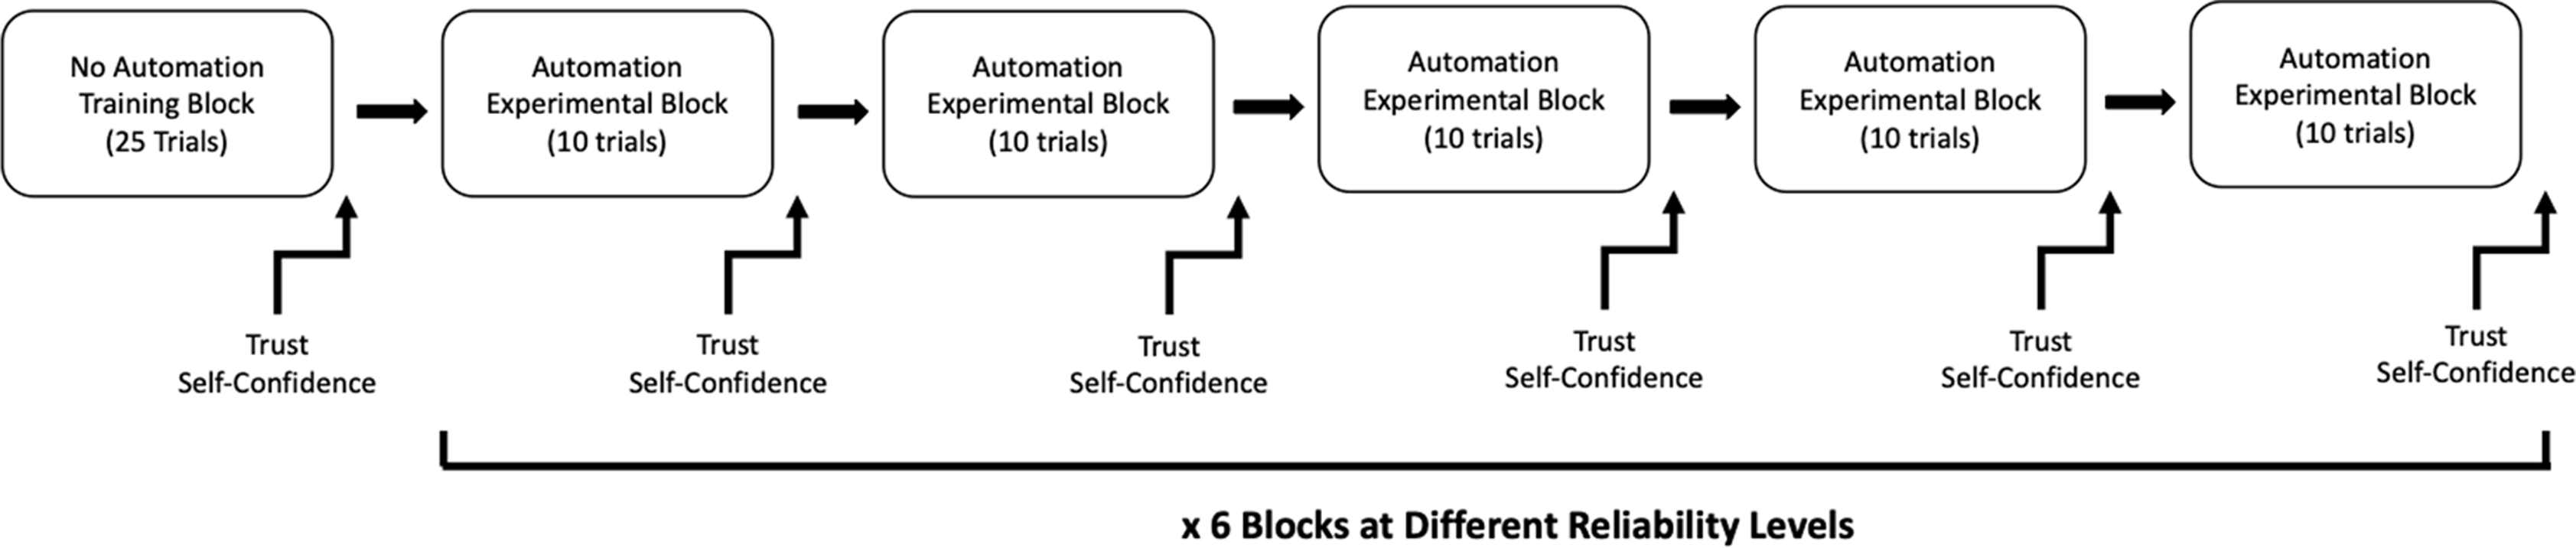
Stimuli and Measures
Color Identification Task
At the start of the experiment, participants read a script indicating that they were playing the role of a geological analysist, in which they were asked to aid in the detection of soil acidity through color detection. Participants were told that due to the large number of soil samples, geologists use an automated system to help reduce the time required to complete the sample identifications. They were told that the automated system is not always 100% accurate and, therefore, it was important for them as the geologist to survey the sample as well. Prior to each block, participants were told that they were moving to a different location to sample soil. Importantly, participants were informed that the automated system’s accuracy could fluctuate due to environmental or soil conditions in different locations (Figure 2(a)). This information was included to alert participants that automation reliability may change, but not explicitly tell them that it is changing. (a) Image shown to the participants during the instruction script showing them the (fictional) regions where they would be testing soil samples over the six blocks. (b) Example detection trial. (c) Trust and confidence scale.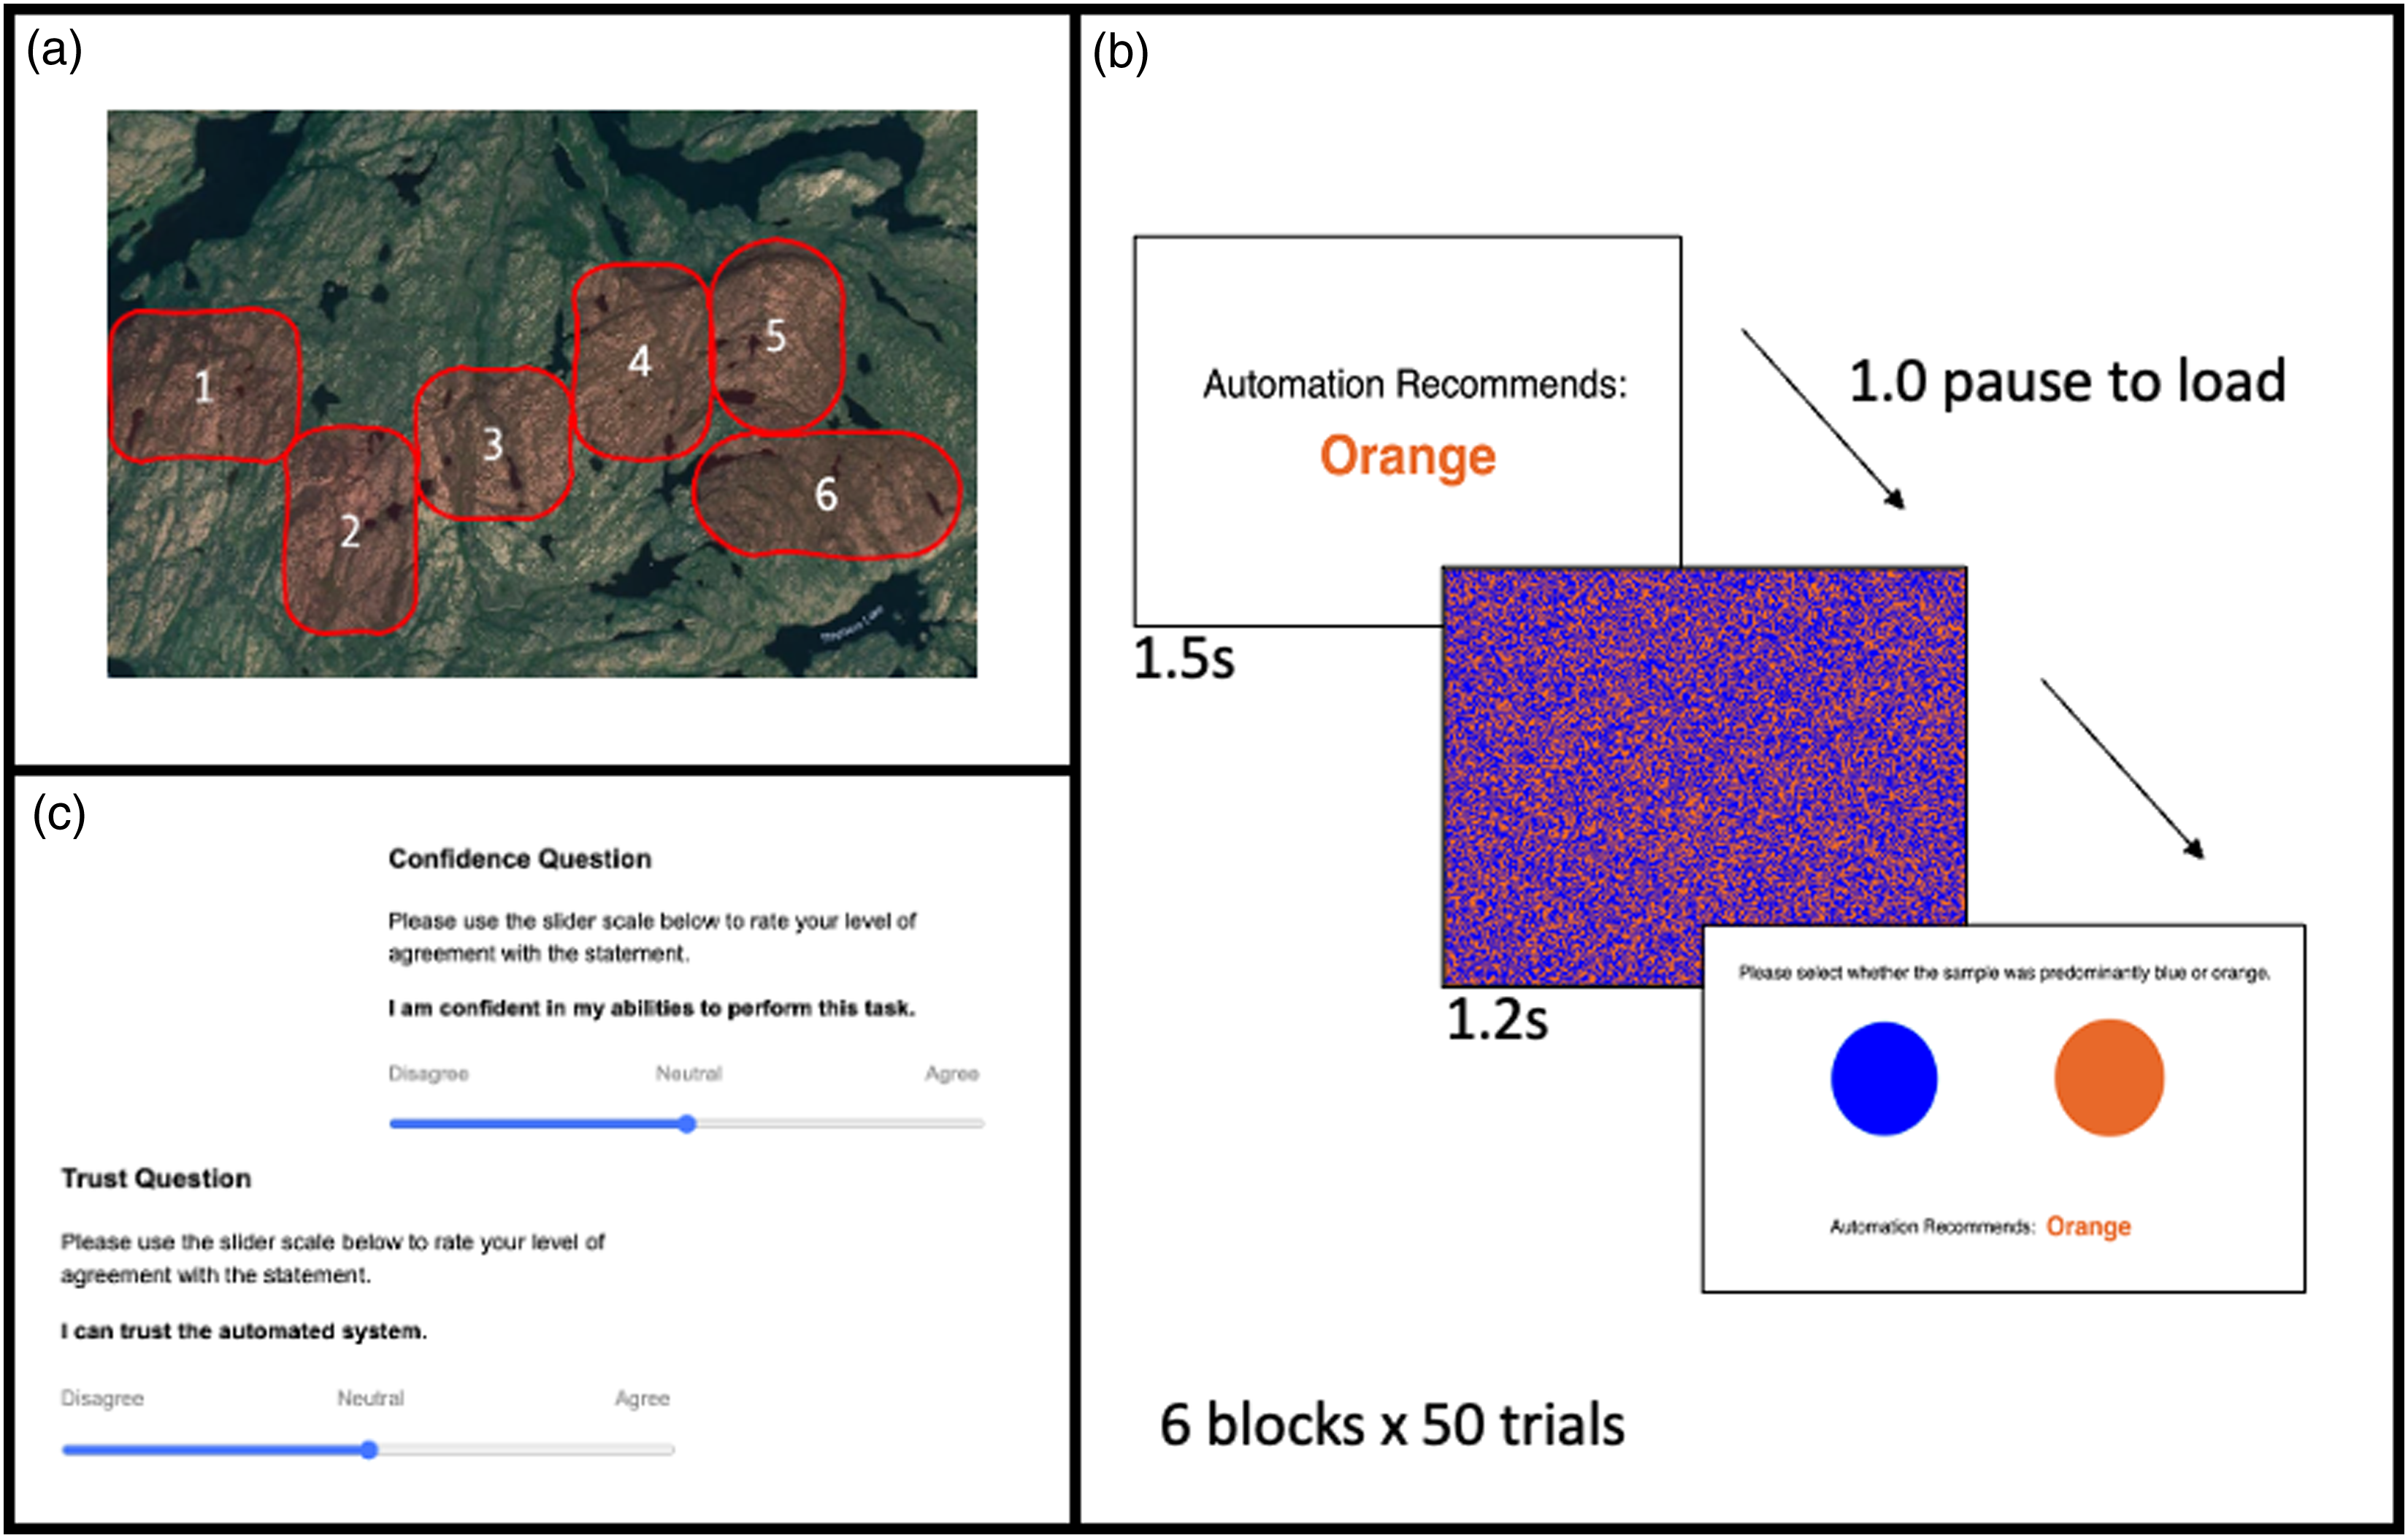
The color identification task on each trial consisted of an image of blue and orange squares that was dominantly blue or orange in a 51:49 ratio, similar to those used by Bartlett and McCarley (2019; Figure 2(b)). It should be noted that this ratio was selected based on pilot testing, balancing making the task difficult but not so much so that it was not possible to perform accurately in any condition. First, participants were provided with the automation’s recommendation for 1.5 seconds and after a 1 second pause, the image flashed on the screen for 1.2 seconds. The image was only displayed for a short amount of time to increase task difficulty and encourage use of the automation. After presentation of the image, the automated recommendation remained on the screen and participants were asked to select whether the image was more blue or orange by clicking on either a blue or orange circle (Figure 2). Participants did not receive any direct feedback on their performance or the performance of the automation. This task was modified from previous research by Voss et al. (2004).
Trust and Self-Confidence
Trust in automation and self-confidence were measured a total of 31 times (1 time prior to and 30 times during the experiment) using a visual analog scale that ranged from 0 to 100. Participants used a slider scale to rate their level of agreeance (from “disagree” = 0 to “agree” = 100) with the statements “I can trust the automated detection system” and “I am confident in my abilities to perform this task.”
Performance
Accuracy in identifying the color patches was used as the measure of performance and was calculated by dividing the number of correct responses by the total number of trials.
Procedure
Participants clicked a link to access the online study either available through the Psychology participant pool portal or the social media advertisement which brought them to Opinio (an online survey software) where they were screened for color vision deficiencies using the Ishihara test (identifying number present in multicolor panels; Clark, 1924) and only were able to proceed with the experiment if the test was passed. Once they passed the test, the participants proceeded to informed consent and reported basic demographic information (age, gender). Next, they were redirected to the online experiment portal used for this study. The experiment was developed in Lab.js (Henninger et al., 2022) and the Lab.js script used for the experiment is available online on Borealis (Holland, 2022: https://doi.org/10.5683/SP3/BYDQF9). Participants were directed through the text instructions provided online to select one of two links based on whether their birth date was even or odd to randomize them to the increasing or decreasing group.
After being redirected to the online experiment portal, participants were provided instructions on the “soil-identification” task and informed that if their performance in correctly identifying soil samples was in the top 25% of all participants, they would receive a 5 CAD bonus. In fact, all participants received this bonus at the end of the experiment. They then completed 25 practice trials of the color identification, without the aid of automation, to acclimate them to the task and were asked to rate their initial level of trust and self-confidence. The participant then performed six blocks of 50 trials, where each trial included a recommendation from the automated system. The start of each trial was self-paced (i.e., the participant initiated the trial) so participants could take breaks as needed. Following completion of the task, participants were informed that the performance incentive was a deception and in fact, everyone would receive the 5 CAD bonus.
Data Analysis
Incomplete data sets were not included in our analysis. Data sets that had more than 95% of trials selecting the same color were removed as it is suspected that these participants were not engaged in the task. Response times were examined to ensure that participants were engaging with the task. All participants had an average response time above roughly 400 ms from when the response screen appeared which indicates they were engaged in the task. Participants had 1.2 seconds to view the image, therefore, this reflects an average response time of 1.8 seconds from image appearance. Statistical analyses were performed using SPSS v.27 for Mac, JMP v.16.2.0, or R v.4.1.2. All statistical tests relied on null-hypothesis significance testing, which was based upon an a priori alpha level of 0.05.
To provide an initial descriptive analysis of the data, three mixed ANOVAs (two-way) were conducted to compare the between-subjects effect of reliability group as well as the within-subjects effect of block (Blocks 1–6) on trust, self-confidence, and performance. The assumption of sphericity was violated for all three mixed ANOVAs and, therefore, Greenhouse-Geisser corrected results are reported. For this analysis, all trust and self-confidence measures within a block were averaged together for each participant. This provided a descriptive analysis of how each of these measures changed over the course of the experiment across blocks for the two groups. Performance was indicated by accuracy, the proportion of color patches correctly identified by the participant.
Next, to provide a more detailed description of the rate of trust change within blocks, a linear mixed effect (LME) model (lme4 v1. 1-29 in R version 4.1.2) was constructed that included each measurement of trust that occurred throughout a block (i.e., every 10 trials). This trust measurement was nested within reliability level and group. Note that reliability level instead of block order was used in this analysis to model the relationship between trust and reliability to address the primary purpose (compared to block in chronological order in the ANOVA which provides a descriptive change in trust across the experiment).
To address the secondary purpose of understanding the impact of self-confidence on the relationship between reliability level and trust, a second LME was constructed. Block average trust and self-confidence measures were used for the analysis because including trial as a nested factor rendered the model computationally intractable. Condition and reliability level and their interaction were first entered into the model, followed by self-confidence. The use of the LME model allowed us to account for the repeated measures across trust and self-confidence. The inclusion of self-confidence allowed us to observe whether it influenced capacity to calibrate trust. All data and analysis scripts are available online on Borealis (Holland, 2022: https://doi.org/10.5683/SP3/BYDQF9).
Results
ANOVA Descriptive Analysis
There was a significant within-subjects main effect of block on trust scores (F (3.06, 293.86) = 29.91, p < .001, ηp2 = 0.238) and the main effect of reliability group on trust scores was nonsignificant (F (1, 96) = 2.21, p = .141, ηp2 = 0.022). These main effects were superseded by a significant interaction effect between block and reliability group on trust (F (3.06, 293.86) = 4.17, p = .006, ηp2 = 0.042). Polynomial trend analysis was performed on each reliability group separately to follow-up on the significant interaction. Contrary to our hypothesis, there was a significant decreasing linear trend for the increasing reliability group (F (1, 52) = 45.29, p < .001, ηp2 = 0.385). In the decreasing reliability group, there was a significant cubic trend (F (1, 44) = 23.81, p < .001, ηp2 = 0.184), where trust decreased nonlinearly with a delay when using automation that decreased in reliability (Figure 3). (a) Trust, (b) self-confidence, and (c) accuracy by block. Trust and self-confidence were scored on a 0–100 scale, and performance was scored on a 0–1 scale. It should be noted that the maximum and minimum of the scales have been adjusted for ease of interpreting the figures.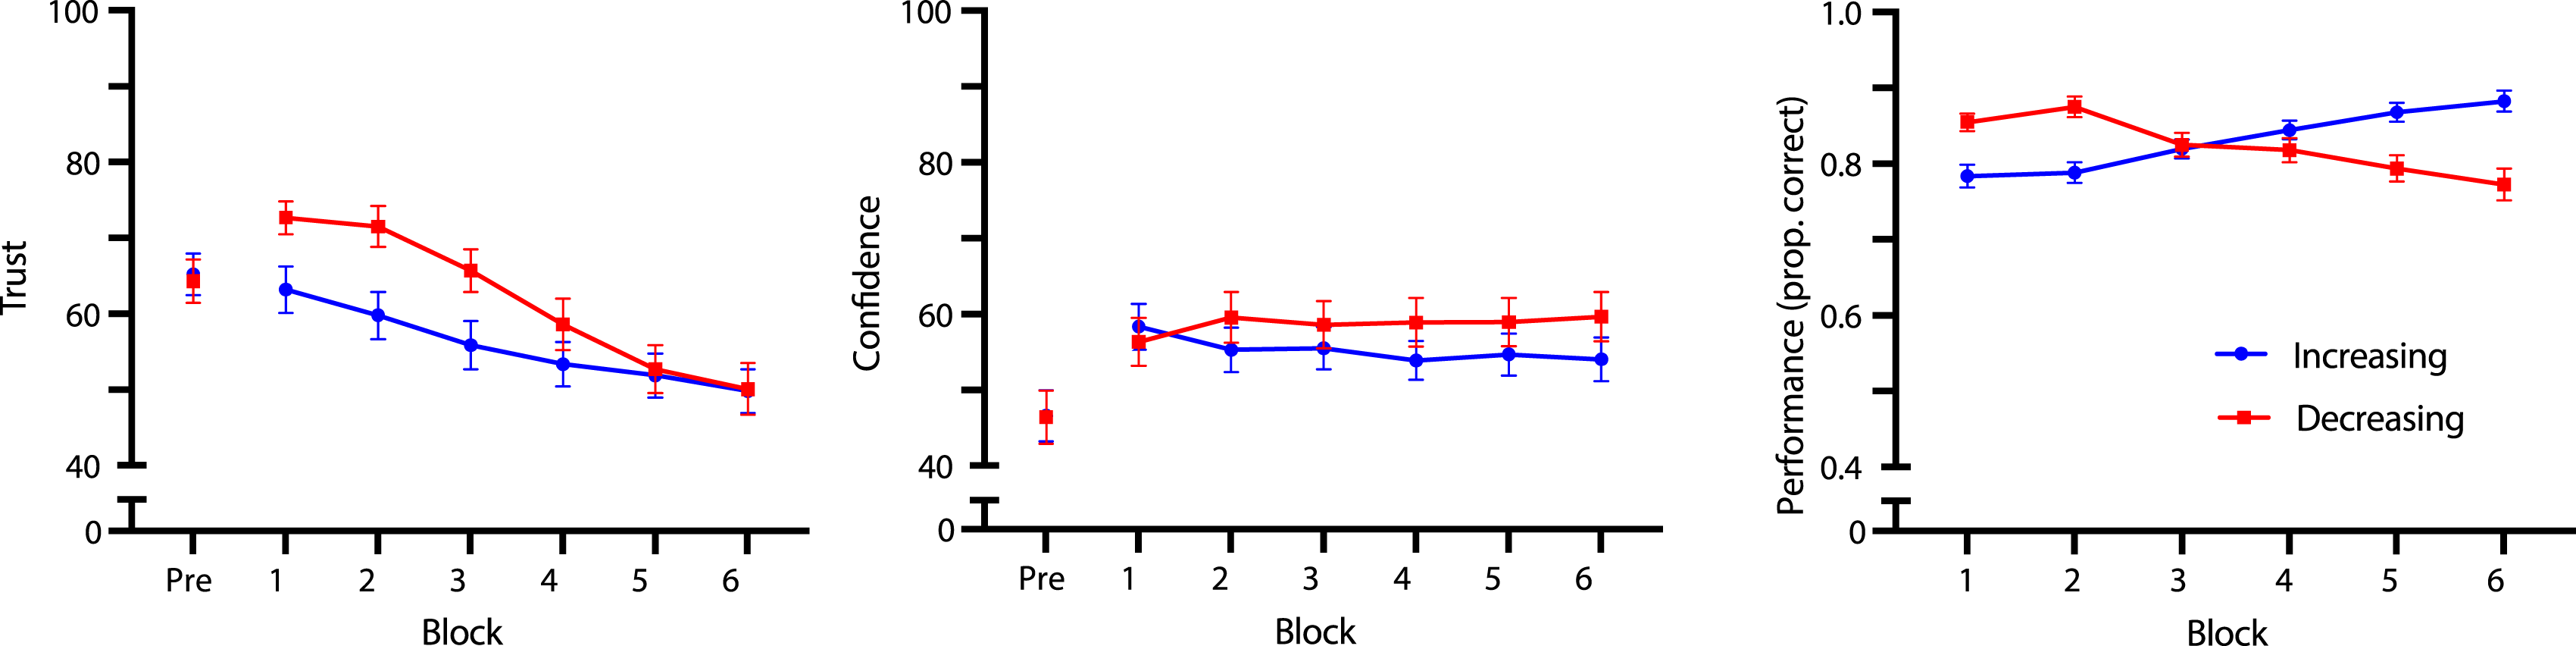
For self-confidence, there was a significant within-subjects main effect of block on self-confidence (F (3.25, 311.68) = 12.77, p < .001, ηp2 = 0.117), while the main effect of reliability group on self-confidence was nonsignificant (F (1, 96) = 0.55, p = .459, ηp2 = 0.006). Furthermore, the interaction effect between block and reliability group on self-confidence did not reach significance (F (3.25, 311.68) = 1.66, p = .172, ηp2 = 0.017; Figure 3).
Finally, there was no significant main effect of reliability group on performance (F (1, 96) = 0.25, p = .619, ηp2 = 0.003), nor significant within-subjects main effect of block on performance (F (2.91, 279.03) = 0.52, p = .660, ηp2 = 0.005). However, there was a significant interaction effect between block and reliability group on performance (F (2.91, 279.03) = 29.00, p < .001, ηp2 = 0.232). Polynomial trend analysis revealed that there was a significant cubic trend for the increasing reliability group (F (1, 52) = 4.41, p = .041, ηp2 = 0.078), and a significant negative linear trend for the decreasing reliability group (F (1, 44) = 20.86, p < .001, ηp2 = 0.322), indicating that participants’ performance tracked the changing performance (i.e., reliability level) of the automated system (Figure 3).
Relationship Between Reliability Group, Reliability Level, and Time (LME)
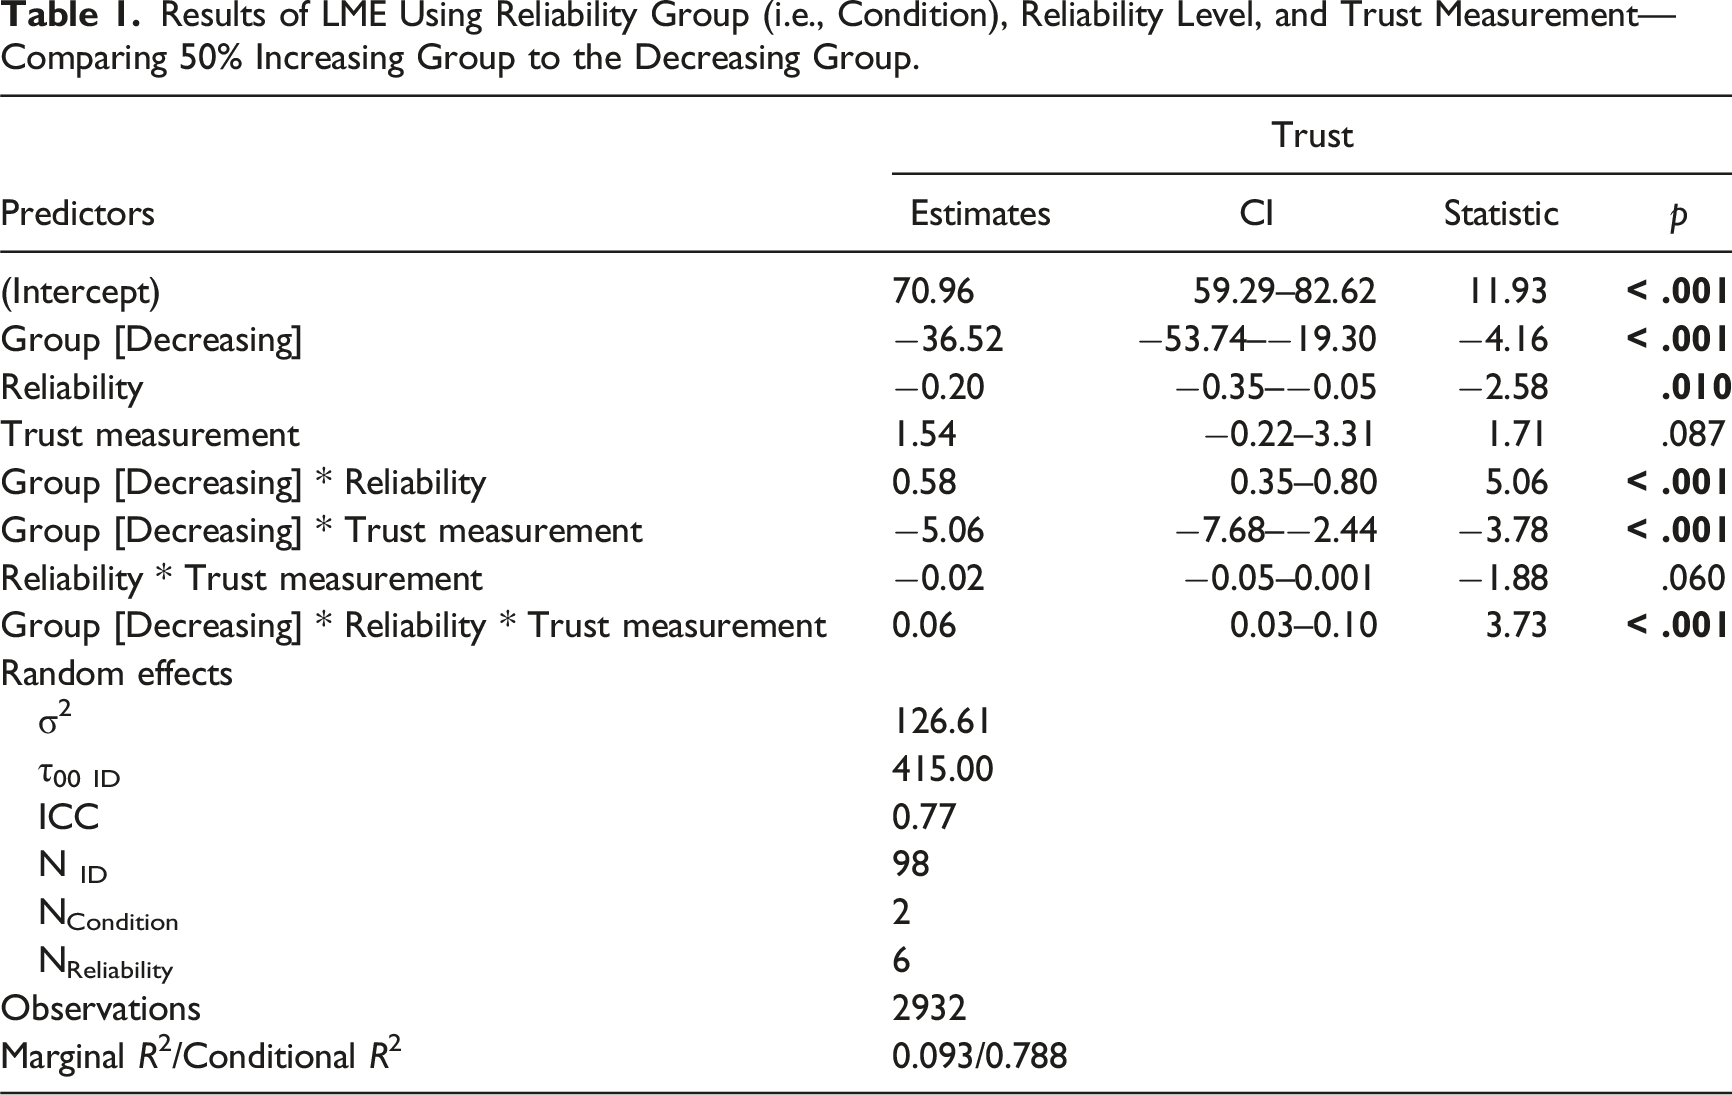
Results of LME Using Reliability Group (i.e., Condition), Reliability Level, and Trust Measurement—Comparing 50% Increasing Group to the Decreasing Group.
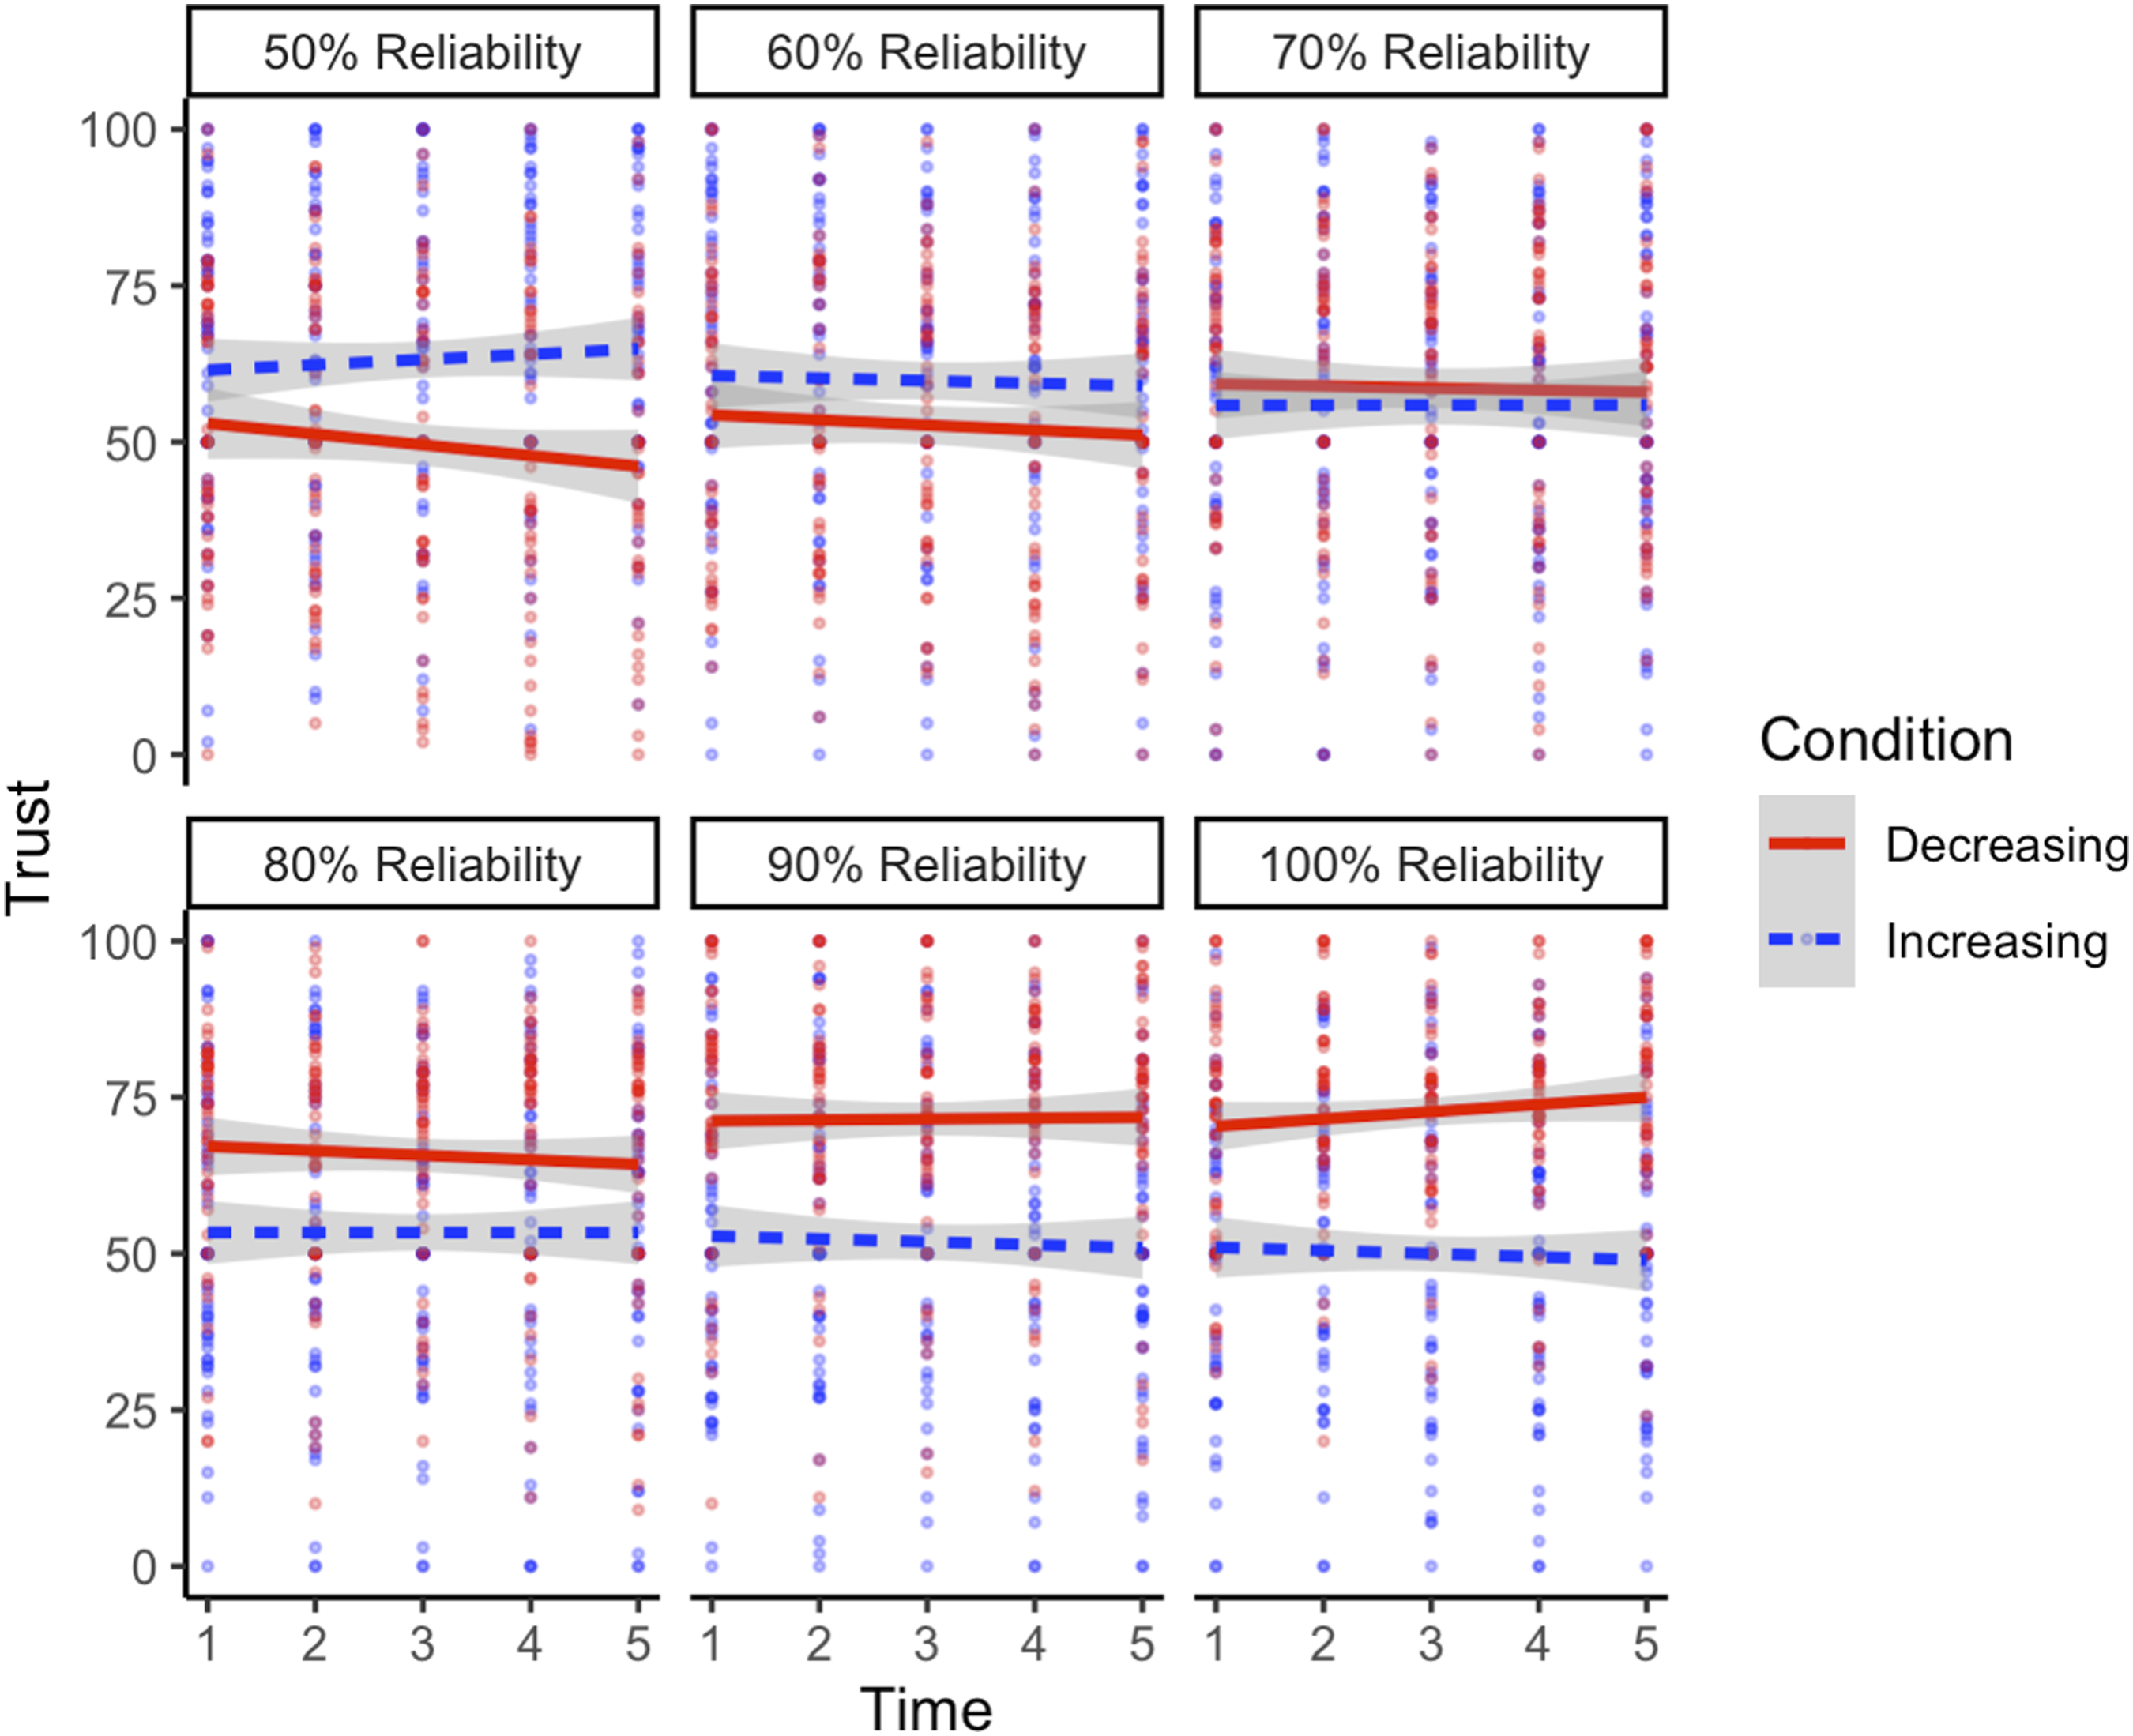
Visualization of the three-way interaction between reliability level, reliability group, and trust measurement predicting trust in the 50% increasing and decreasing conditions. As the figure is broken down by reliability level, it should be noted that the increasing group started from 50% reliability (moving from left to right and up to down in the figure), while the decreasing group started at 100% reliability (moving from right to left and down to up).
Relationship Between Reliability Level, Self-Confidence, and Reliability Group (LME)
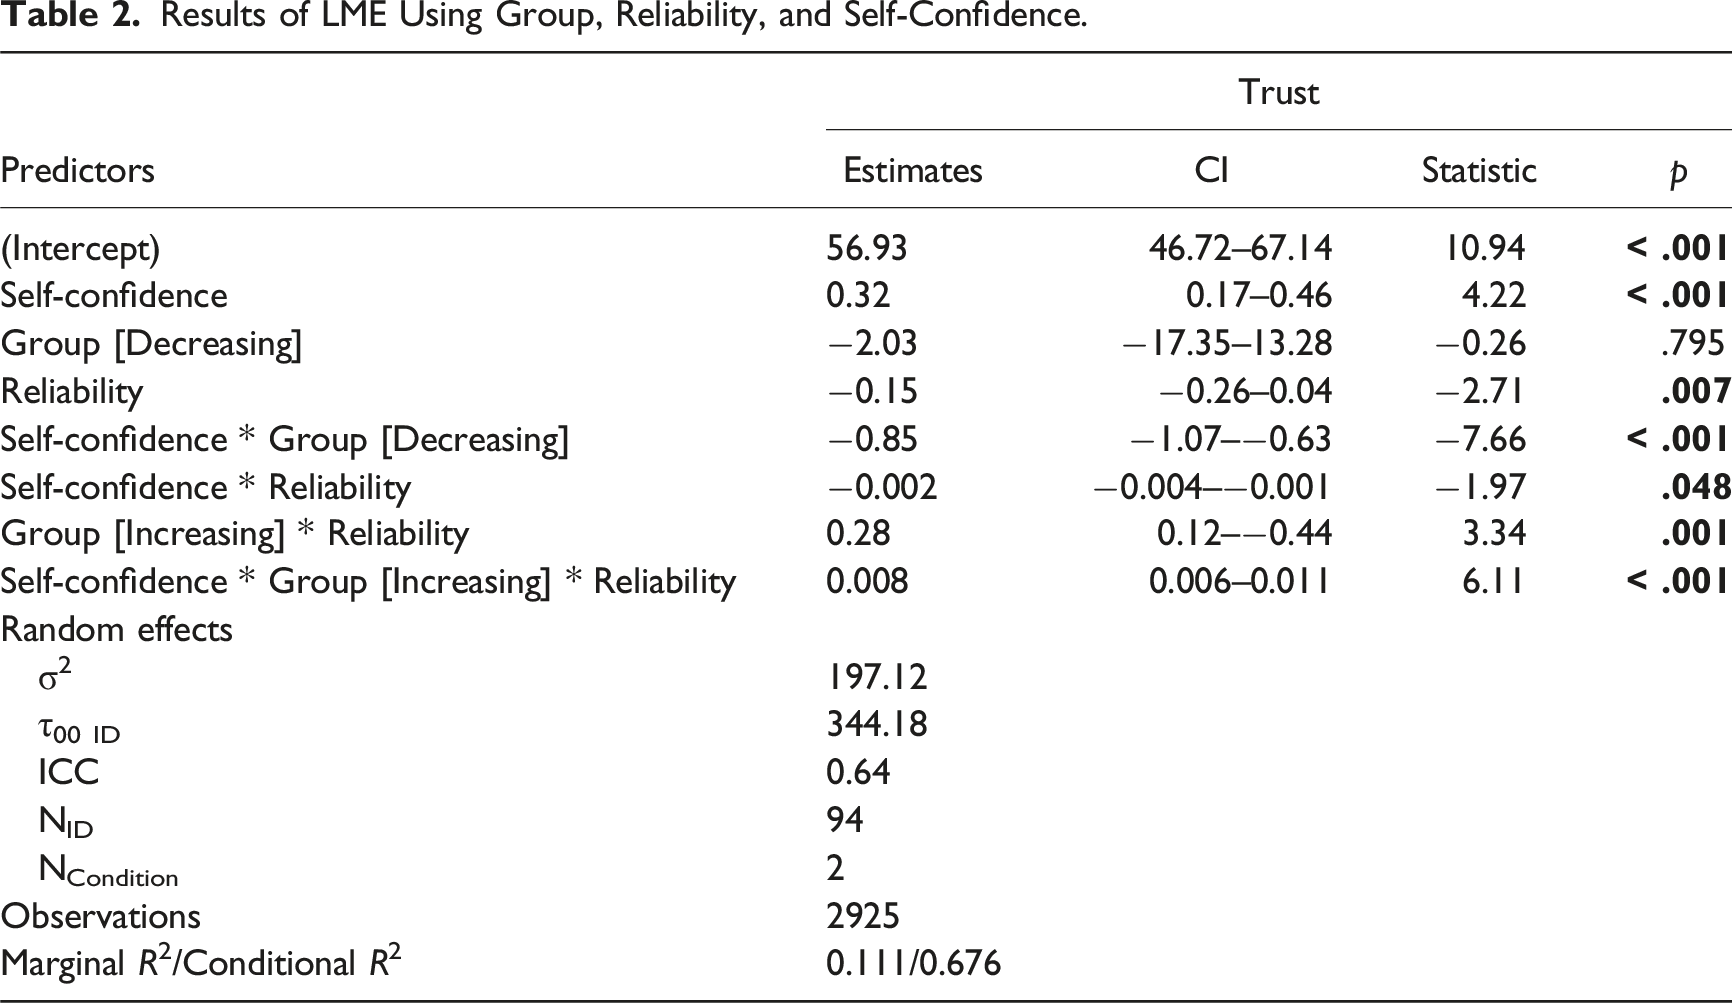
Results of LME Using Group, Reliability, and Self-Confidence.
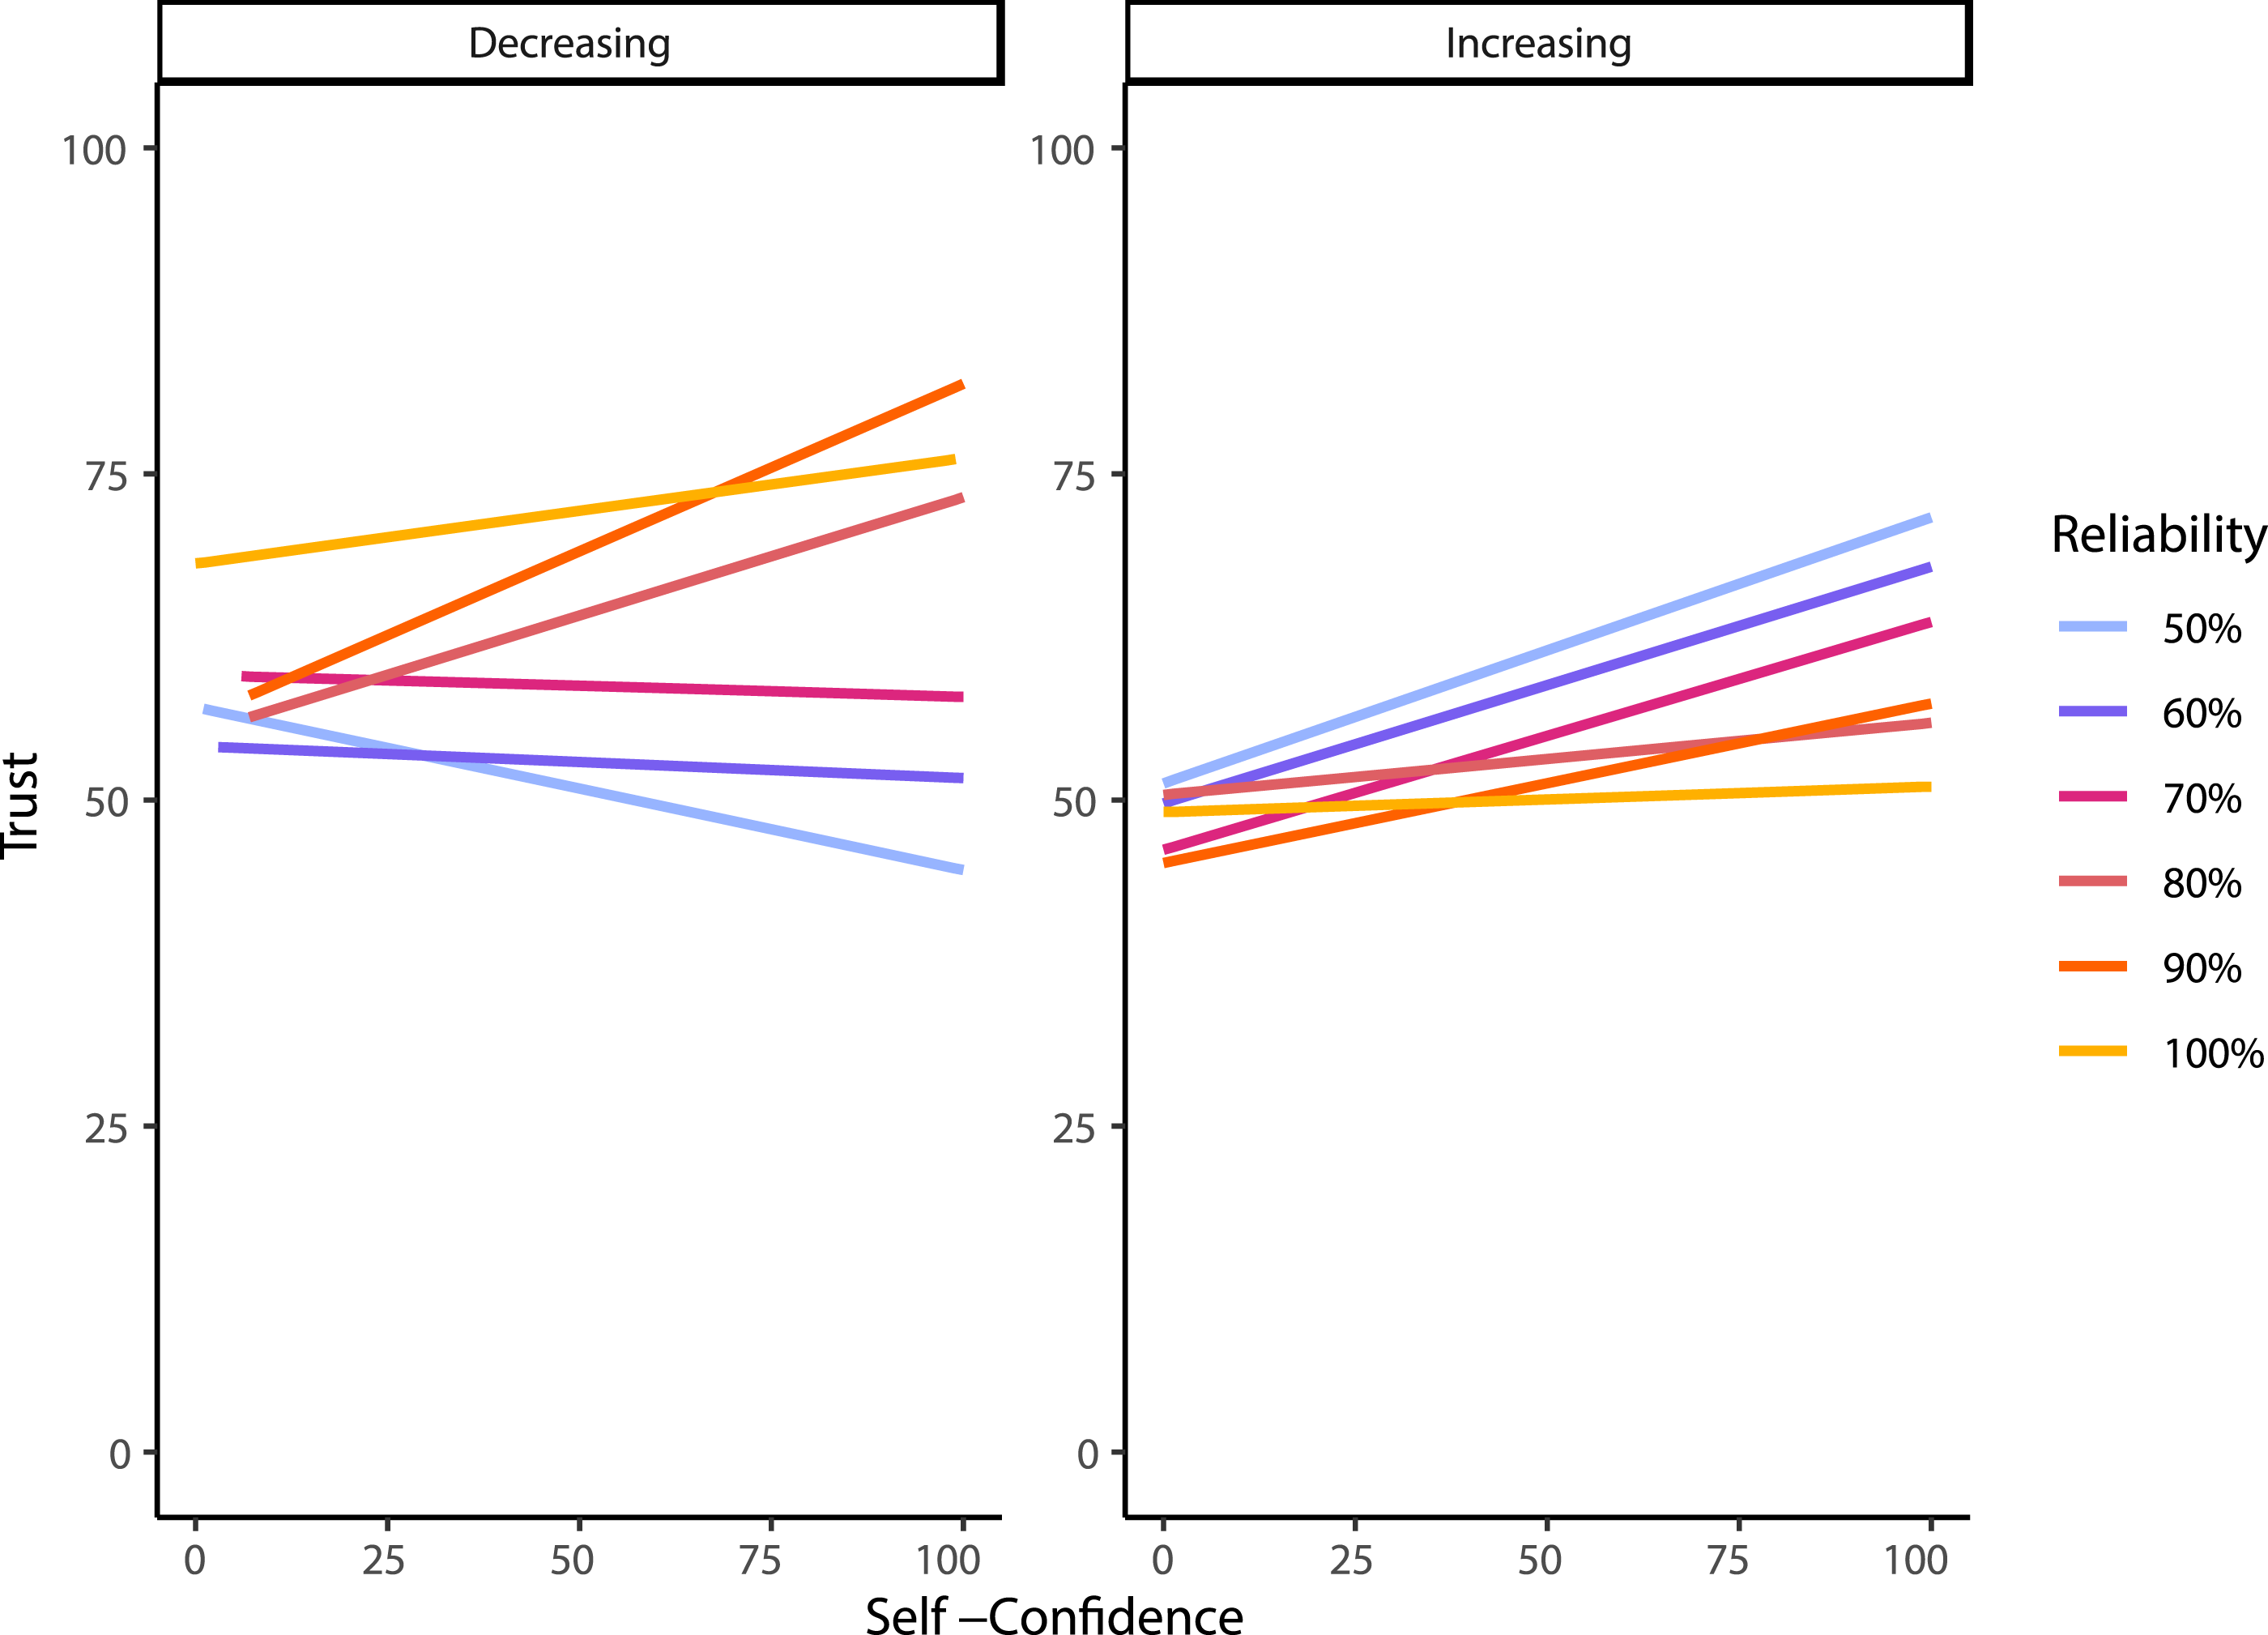
Visualization of the three-way interaction between self-confidence, group, and reliability level predicting trust.
Experiment 1 Discussion
This study investigated the dynamics of users’ trust in automation with increasing and decreasing reliability levels with a secondary purpose of understanding the influence of self-confidence. Trust decreased over the course of the experiment, whether users were interacting with automation that was increasing or decreasing in reliability. The group with the automation that was decreasing in reliability initially had higher trust in the automation than the increasing group which is unsurprising given that they were interacting with more reliable automation. However, contrary to our hypothesis, users in the increasing group saw a gradual decline in trust even as their automation became more reliable. Further analysis on the dynamics of trust changes within reliability blocks indicated that previous experience affects how trust changes when interacting with automation at different reliability levels. We also showed that trust changed more with changing reliability level when self-confidence was higher. Finally, it was also shown that the rate that trust declined in each group differed. Each of these findings will be discussed in turn.
Most previous research has focused on how trust changes when automation fails, though it is also important to see whether trust can improve when the reliability of automation increases. In the current experiment, participants’ trust in automation did not increase as the automation became more reliable. It is possible that users in this group experienced a reliability level that was so poor that their trust could not recover, no matter how well the automation was performing. This is perhaps unsurprising given previous research which has indicated that automation needs to be at least 70% reliable to be useful to human operators (Wickens & Dixon, 2007); however; the results demonstrate that for automation that increases in reliability, the 70% reliability level cannot simply be a level that is reached for trust to be regained. An initial reliability level of 50% may have resulted in users disregarding automation recommendations for the rest of the experiment. Alternatively, it could also be possible that participants learned early on that the automation may frequently perform poorly, leading to distrust in the system that could not be regained even if they later believed that the automation was performing appropriately. This interpretation is consistent with the finding that the distribution of errors can influence the behavior of the user, even after the reliability of the automation changes (Sanchez et al., 2014). It may also be the case that users were not perceptive enough to see changes in the automation reliability (Rovira et al., 2007), and that their trust thus did not match the reliability as expected. However, this interpretation should be taken lightly given that the decreasing group showed changes in trust that were more consistent with our hypothesis, as users experienced an initial increase in trust during their interaction with perfect automation, which was followed by a gradual decrease in trust as automation reliability got worse. This finding is congruent with other research, supporting that there is a relationship between automation reliability and trust in a dynamic context (Hussein et al., 2020; Strickland et al., in press; Yu et al., 2017).
Furthermore, the LME analysis looking at group, reliability level, and each individual trust measurement indicated that previous experience with the task and previous automation reliability affects rates of change of trust within blocks. This finding is best characterized by looking at the extremes. For instance, when the automation is perfectly reliable, the increasing group who initially experienced unreliable automation does not show an increase in trust over this block even though the automation is highly useful to them. In contrast, the decreasing group, which had no previous experience with less reliable automation, shows a slight increase in trust over the block. The difference in trust dynamics between groups suggests an influence of prior experience with the automation and trust in automation cannot be predicted solely by reliability level. However, this interpretation should be taken cautiously given that participants’ trust did not track with increasing reliability level in the increasing group.
Interestingly, how users performed on the task did not follow their trust in the automated system. For example, trust in the increasing reliability group steadily declined; however, they performed better as they interacted with the system over time (i.e., as the automation reliability increased). While the current experiment did not directly measure reliance (i.e., it is not possible to tease apart situations where participants went by their own assessment vs. the automated advice), the finding that participants’ performance on the task tracked the automation performance suggests they were relying on the information on at least some trials if they were uncertain of their response. Future research should measure reliance behavior (e.g., using a similar method to Merritt, Sinha et al. (2015) and Chancey et al. (2017) where participants provide an initial assessment before receiving advice from an automated system before providing a final assessment) to more directly determine associations with trust behavior.
Our findings are consistent with Merritt, Lee et al. (2015) who performed a similar experiment, where users interacted with automation that had either increasing or decreasing reliability. Their experiment had a slightly different purpose in that their aim was to determine what factors impacted trust calibration and whether trust calibration could predict performance. Critically, they showed that trust calibration did not predict performance, however, they did not present separate results or underlying trust scores for their increasing or decreasing groups. Therefore, there was no way to determine how trust calibration differed between conditions. Overall, our results are consistent with their main finding that trust calibration does not necessarily predict performance given that the increasing group reported decreased trust over the course of the experiment even though their performance consistently improved. Thus, the present study complements the findings published by Merritt, Lee et al. (2015) by further examining the rate at which trust changes and exploring how trust calibration differs between conditions of increasing and decreasing automation reliability. Combined together, these studies provide converging evidence that trust is not directly linked to system performance which has important practical implications for the field to determine first whether trust is a relevant metric to target in order to improve system performance and how other factors may affect the relationship between trust and system performance.
Turning to the effects of task specific self-confidence, both groups increased self-confidence from their pretest levels once the participants started performing the task. More interestingly, when self-confidence was higher, automation reliability had a greater influence on trust. It may be that when participants’ self-confidence was higher, they felt better able to assess the automation’s performance. This finding also suggests that, in some cases, trust may not correlate with automation reliability simply due to a user’s self-confidence in performing a task. These findings are consistent with a recent study where participants interacted with an automated system that they could choose to rely on to assist them in completing a tracking task (Williams et al., 2023). The results showed that reliance behavior was only associated with trust (i.e., higher trust was associated with a higher probability of the participants using the automation) when self-confidence was also high. When self-confidence was low, however, the relationship between trust and reliance behavior was weaker. Along with our results, these findings indicate that higher self-confidence leads to a stronger relationship between trust and reliability level/reliance behavior.
One main limitation of the current study is that participants in the increasing group were interacting with automation that initially performed at chance levels (i.e., 50% reliability). In this group, participants’ trust in the automation did not correspondingly increase. It is possible that this result was due to participants beginning the experiment using automation with an extremely low reliability. Previous studies have found that automated aids only provide a benefit to performance if the automation has a reliability of 70% or higher (Wickens & Dixon, 2007). Therefore, we conducted a second experiment that had a new group of participants that started with automation that was 70% reliable.
Experiment 2
The purpose of Experiment 2 was to determine if trust increased as automation reliability improved when participants started with automation that was more useful (i.e., automation with a higher reliability). We repeated the increasing condition starting instead at the 70% reliability threshold and increasing automation reliability by 10% every block, until it remained at 100% reliability for the remaining blocks. This condition was compared to the increasing condition collected in Experiment 1 that had automation reliability begin at 50% to determine whether the starting reliability of automation affected how trust changed over time. It was hypothesized that by starting with an initially more reliable automation, trust would increase as the automation reliability increased. We also hypothesized that we would replicate the effect observed in Experiment 1, where higher self-confidence was associated with trust that changed more with changing reliability level across observations.
Method
Participants
Fifty participants were recruited through Dalhousie University’s psychology participant pool (60% of participants) as well as social media advertisements (Instagram, Twitter; 40% of participants) to complete an online study. Forty-nine participants (mean age = 24.8, SD = 10.6; gender: 24.5% male, 67.3% female, 2.0% preferred not to self-identify) completed the experiment (one participant did not complete the experiment but it was not possible to know whether they were sourced from the participant pool or social media due to the anonymization of the data). Due to self-selected participant numbers not lining up in the demographic information and the experimental blocks, the demographic information of three participants was not retrievable. Participants received compensation in the same way as Experiment 1. This research complied with the tenets of the Declaration of Helsinki and was approved by the Institutional Review Board at Dalhousie University. Informed consent was obtained from each participant.
Study Design
All participants completed the same increasing condition which began at 70% reliability and increased in increments of 10% until reaching 100%. To match the number of trials and blocks of the increasing condition of Experiment 1, participants completed three blocks using an automation with 100% reliability (i.e., the reliability level from Block 1 to Block 6 was 70%, 80%, 90%, 100%, 100%, and 100%). All other aspects of study design were the same as Experiment 1.
Stimuli and Measures
The same stimuli and measures as Experiment 1 were used.
Procedure
The procedure was the same as Experiment 1 apart from the semi-randomization by birthdate. In contrast to Experiment 1, after completing screening and demographic information, all participants were directed to the same experimental site with the increasing from 70% condition.
Data Analysis
Similar data analysis approaches to Experiment 1 were used to compare the 70% increasing group to the increasing group from Experiment 1 (now on called the 50% increasing group).
Results
The main effect of reliability group on trust scores was significant (F (1, 100) = 5.59, p = .020, ηp2 = 0.053), while there was not a significant within-subjects main effect of block on trust scores (F (2.95, 295.15) = 0.31, p = .819, ηp2 = 0.003). These main effects were superseded by a significant interaction effect between block and reliability group on trust (F (2.95, 295.15) = 24.29, p < .0001 ηp2 = 0.195). Polynomial trend analysis was performed on the 70% increasing reliability group, showing there was a significant quadratic trend (F (1, 48) = 6.26, p = .016, ηp2 = 0.115), where trust increased for the first four blocks before stabilizing (Figure 6). (a) Trust, (b) self-confidence, and (c) accuracy by block. Trust and self-confidence were scored on a 0–100 scale, and performance was scored on a 0–1 scale. The 50% increasing group is the same data from the increasing group in Experiment 1, and has been included for comparison. It should also be noted that horizontal axis is showing blocks, which had a different progression of reliability between the two groups (progressions: 50% increasing—50%, 60%, 70%, 80%, 90%, 100%; 70% increasing—70%, 80%, 90%, 100%, 100%, 100%).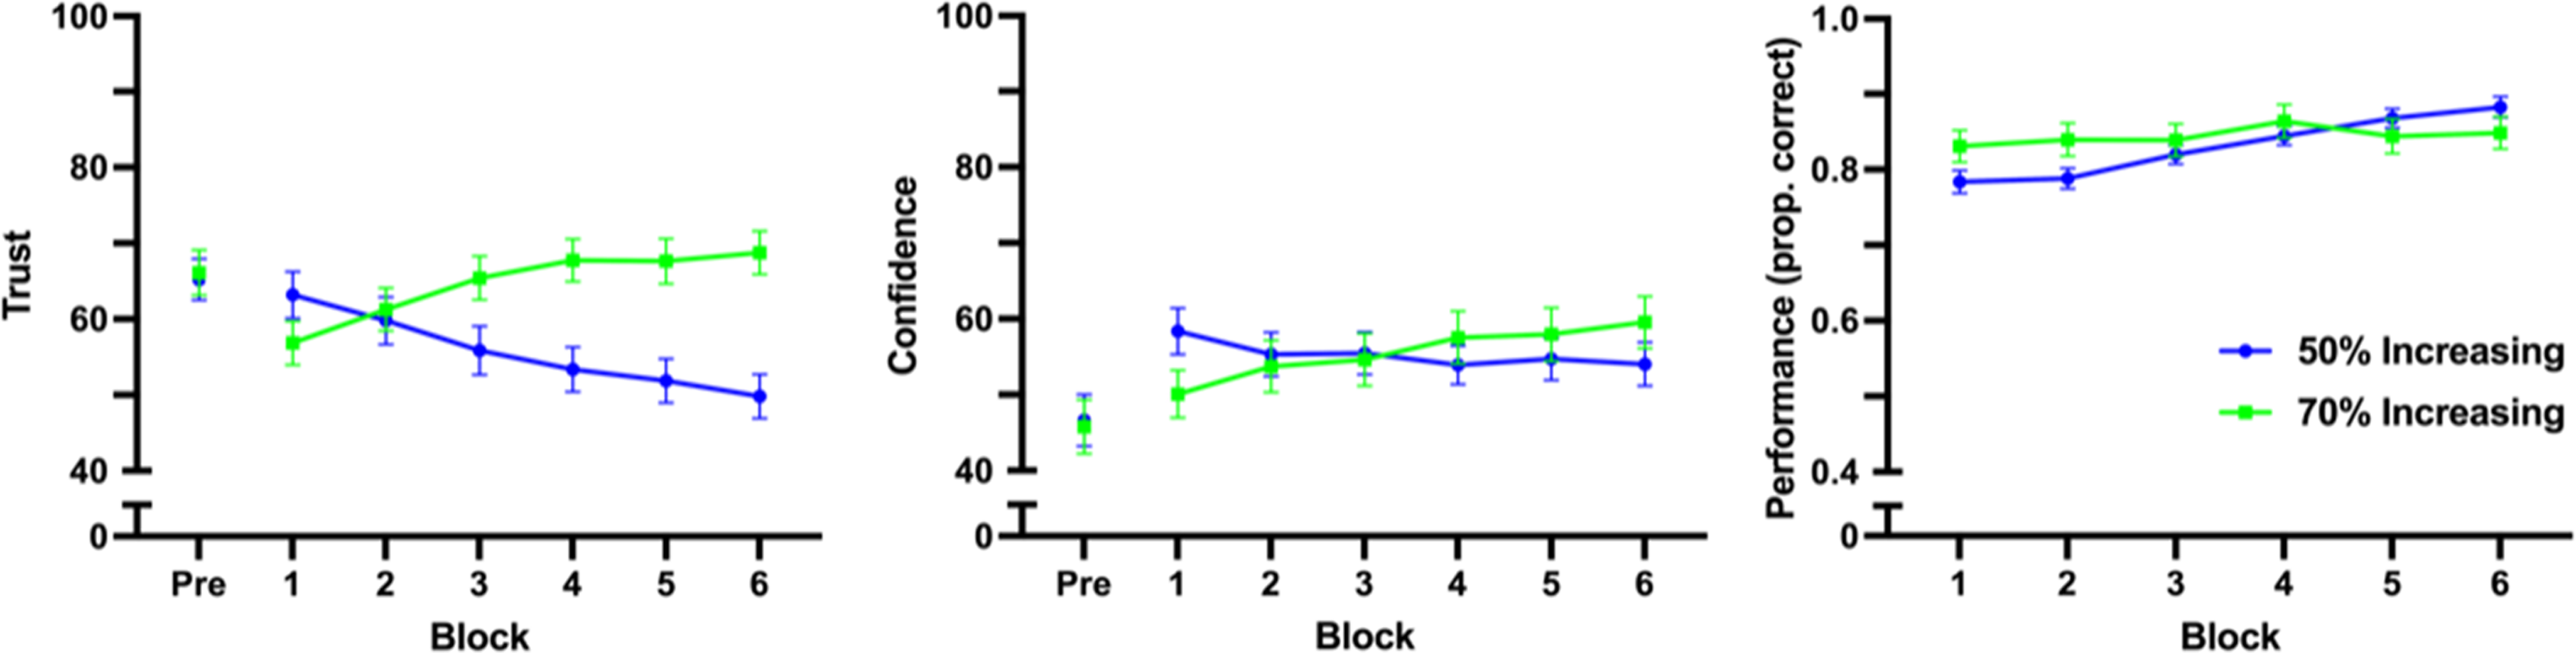
There was no significant main effect of initial automation reliability group on self-confidence (F (1, 100) = 0.0047, p = .945, ηp2<0.001), nor within-subjects main effect of block on self-confidence (F (3.19, 318.56) = 1.12, p = .342, ηp2 = 0.011). There was, however, a significant interaction between block and reliability group on self-confidence (F (3.19, 318.56) = 6.79, p = .0001, ηp2 = 0.064). Once again, polynomial trend analysis was used to follow up on the significant interaction. A significant increasing linear trend was found for the 70% increasing reliability group (F (1, 48) = 13.07, p < .001, ηp2 = 0.214).
Finally, there was a significant main within-subjects effect of block on performance (F (3.11, 311.02) = 14.68, p < .001, ηp2 = 0.128), and there was no significant main effect of initial automation reliability group on performance (F (1,100) = 0.35, p = .557, ηp2 = 0.003). There was a significant interaction between block and initial automation reliability group on performance (F (3.11, 311.02) = 7.78, p < .0001, ηp2 = 0.072). Polynomial trend analysis revealed there was a fifth-order trend for the 70% increasing reliability group (F (1, 48) = 5.86, p = .019, ηp2 = 0.109). Given that there were only six blocks, the fifth-order trend indicates that performance fluctuated over blocks but did not consistently increase or decrease over the course of the experiment.
Relationship Between Group, Reliability Level, and Time (LME)
Results of LME Using Group, Reliability, and Time of Trust Measurement—Comparing 50% Increasing Group to the 70% Increasing Group.
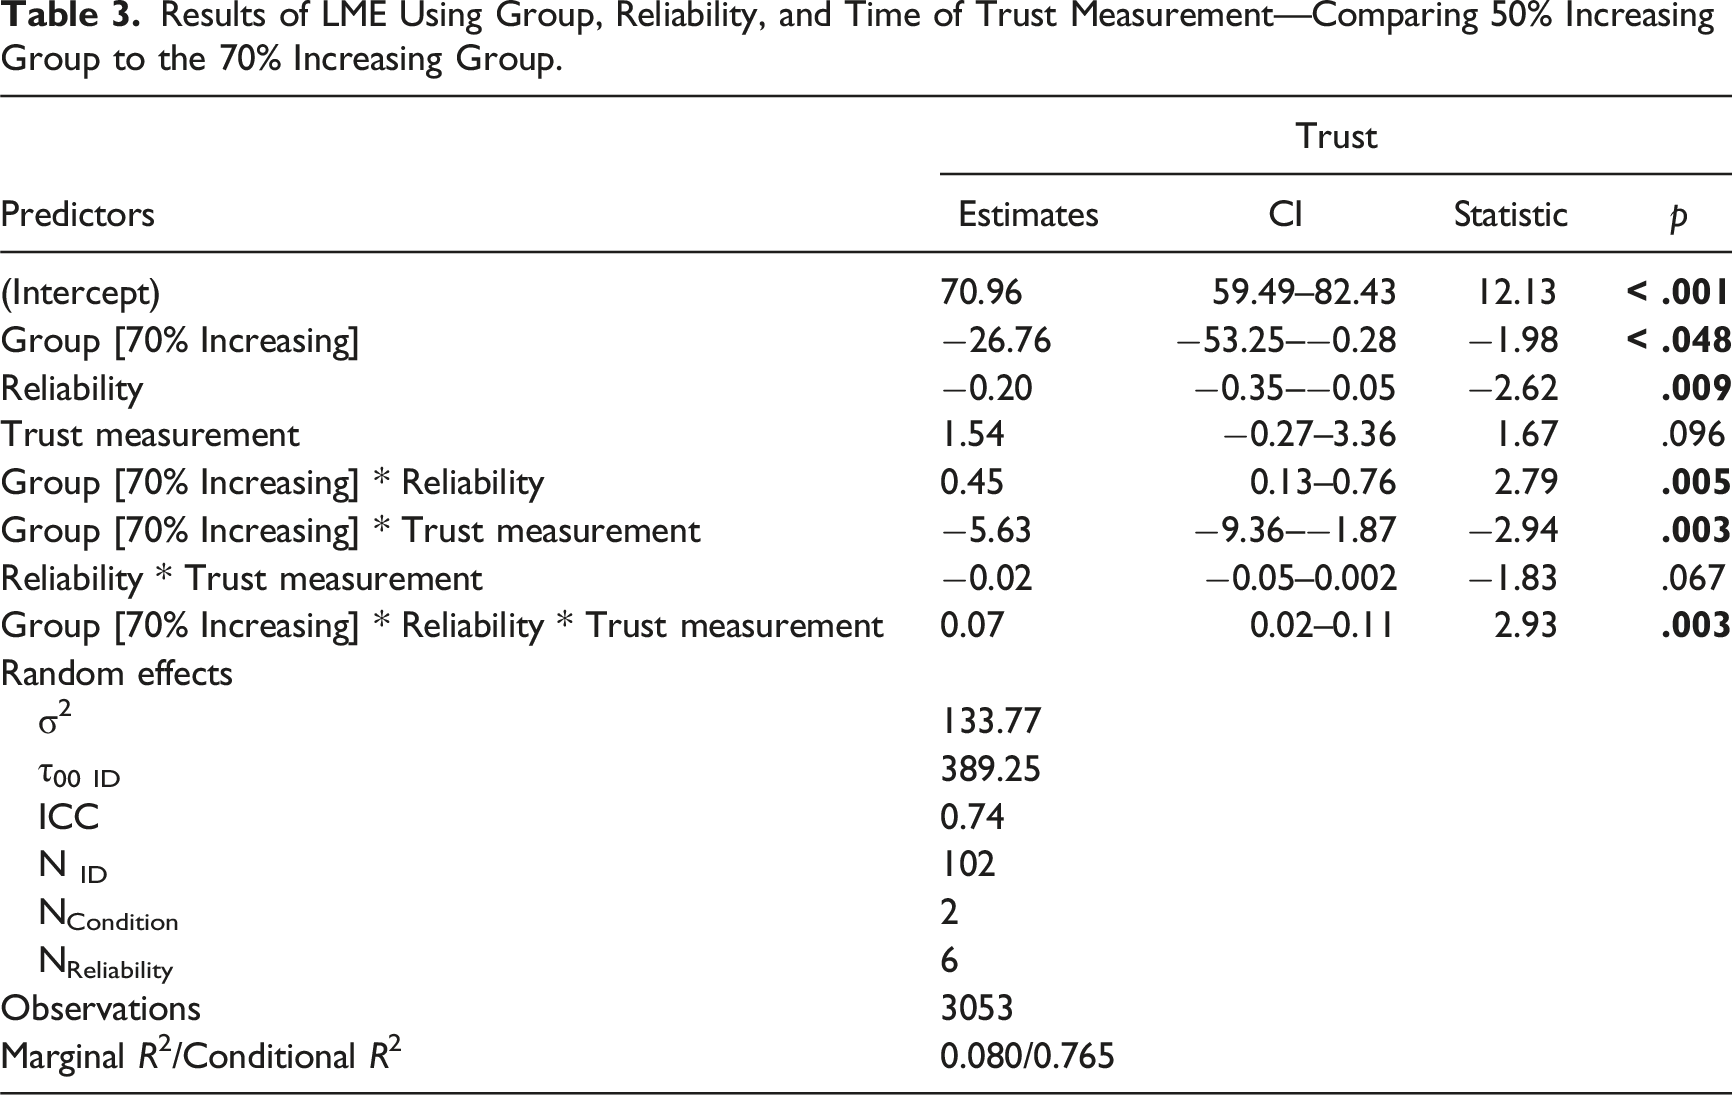
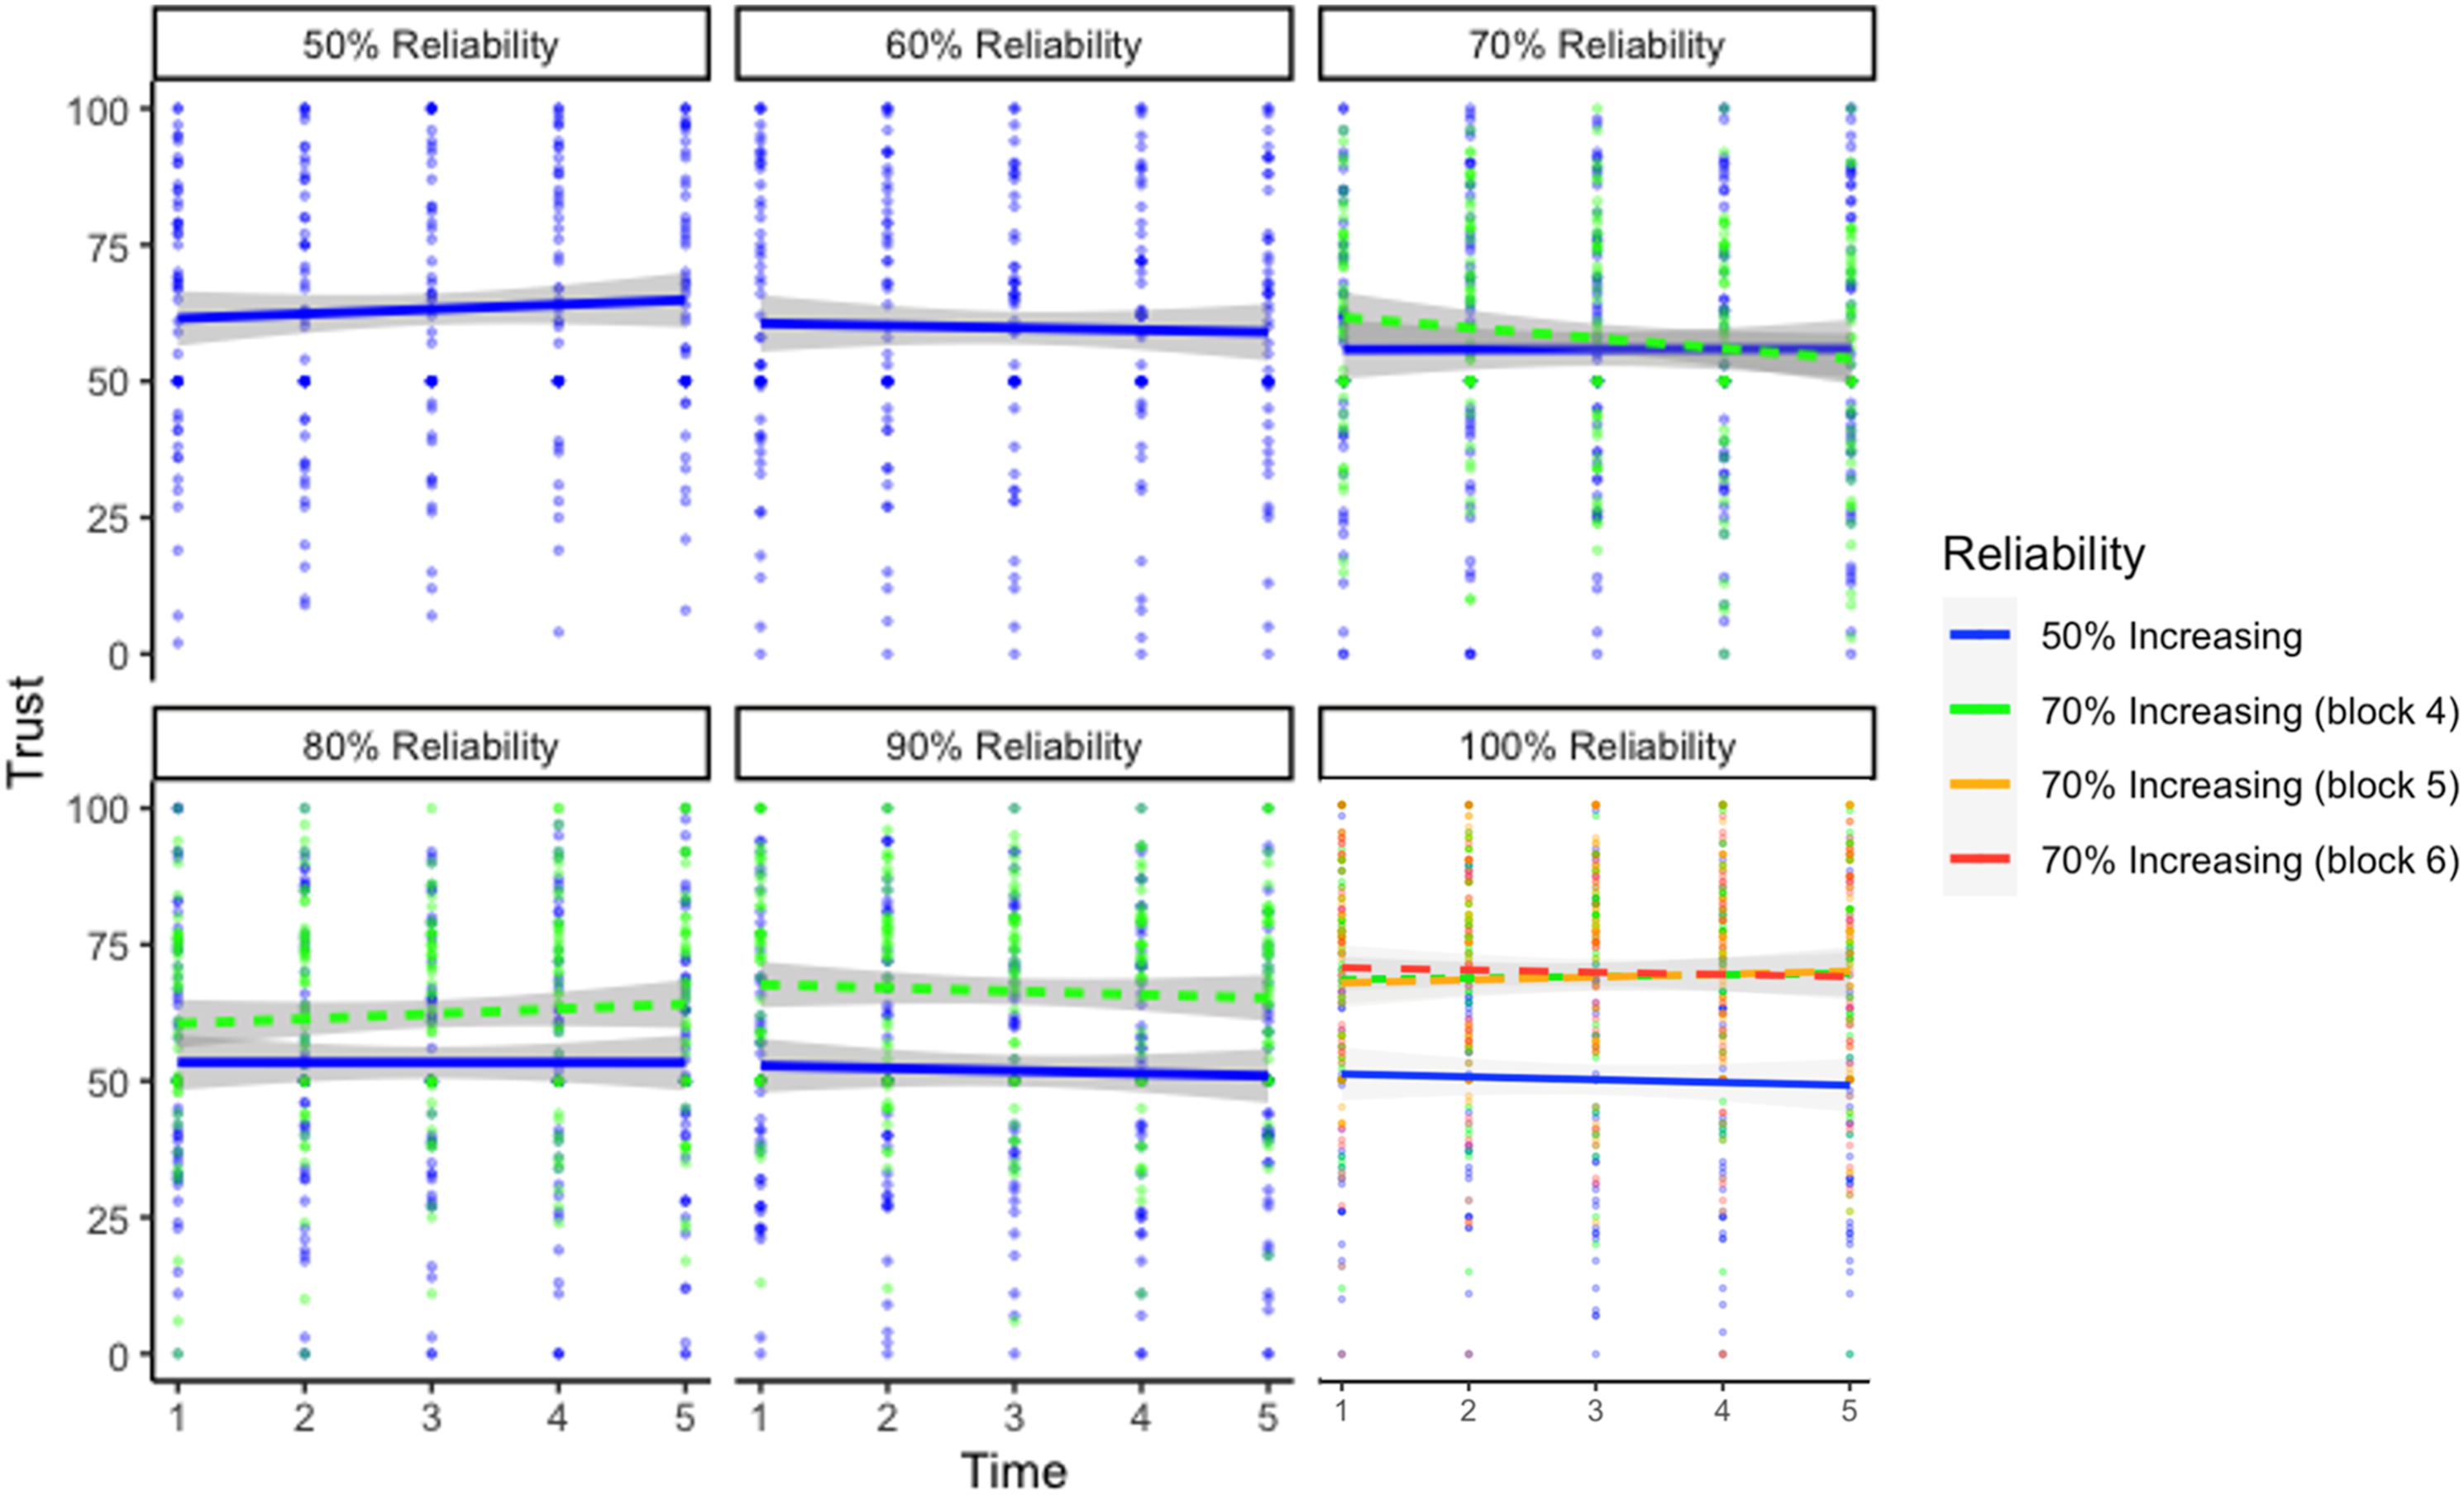
Visualization of the three-way interaction between reliability level, group, and trial predicting trust of the 50% increasing and 70% increasing conditions. The 50% increasing group is the same data from the increasing group in Experiment 1, and has been included for comparison. At the 100% reliability level, Blocks 4 through 6 for the 70% increasing group largely overlap.
Relationship Between Reliability Level, Self-Confidence, and Reliability Group (LME)
Results of LME Using Group, Reliability, and Self-Confidence—Comparing 50% Increasing Group to 70% Increasing Group.
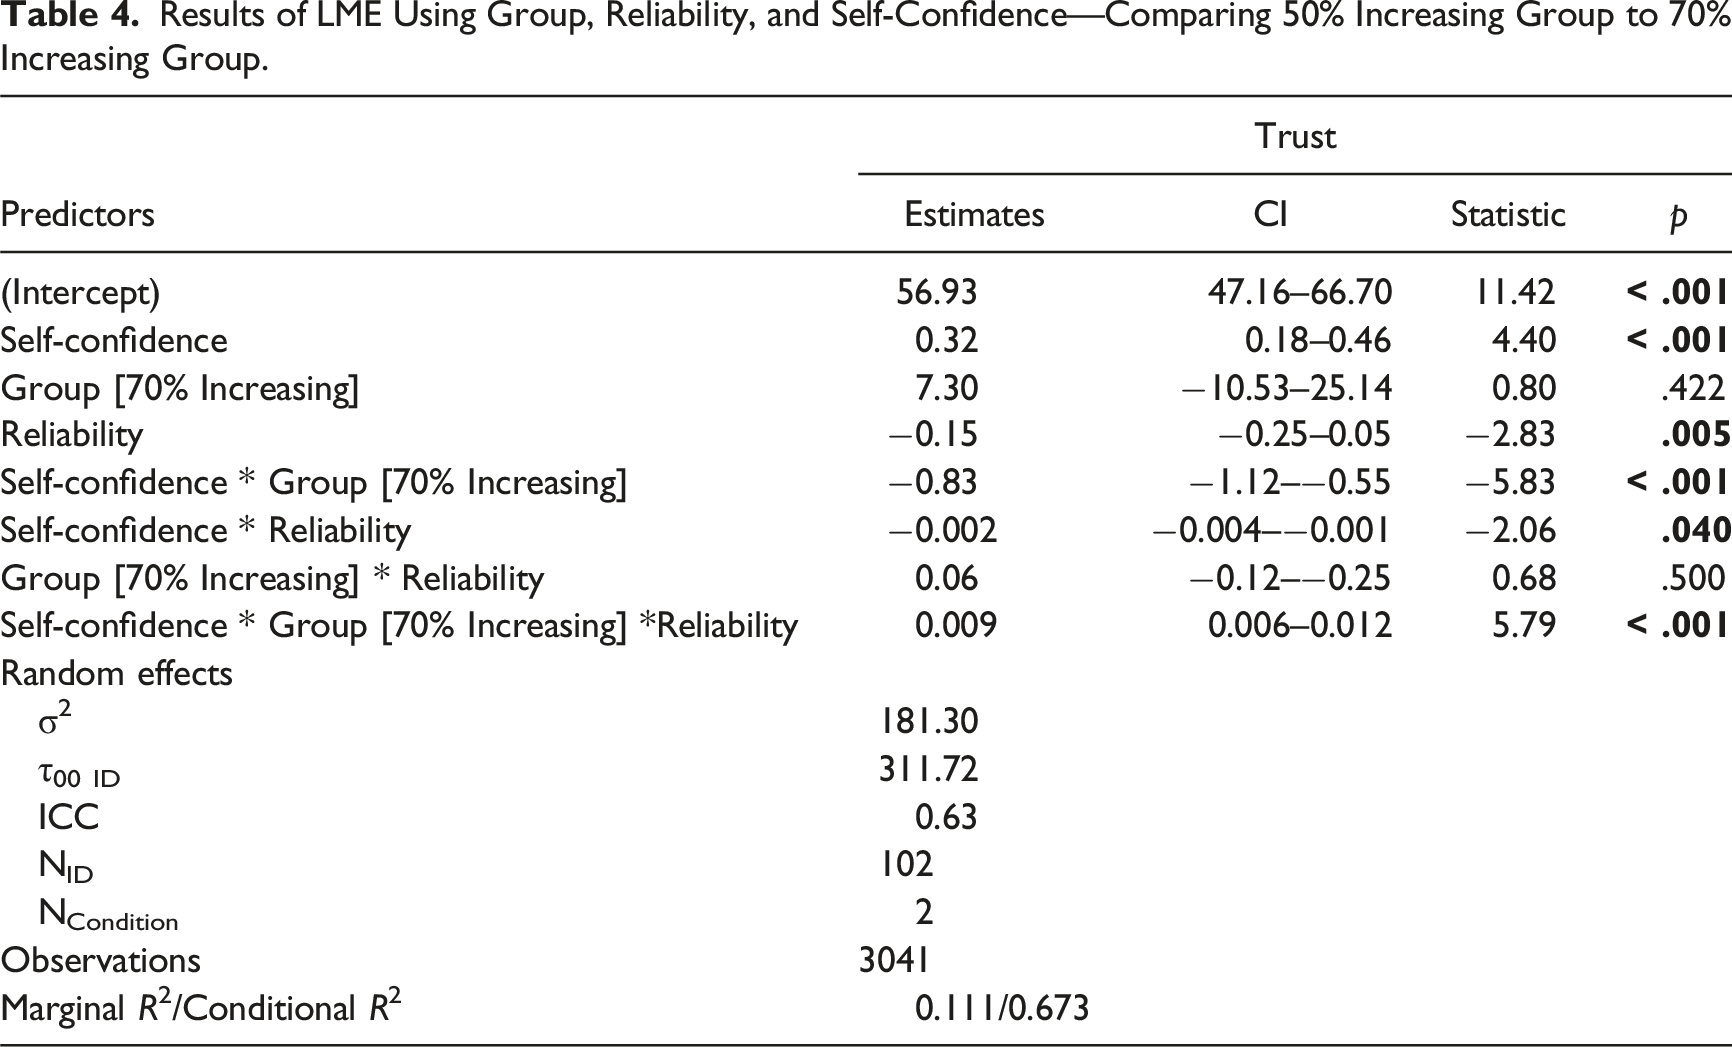
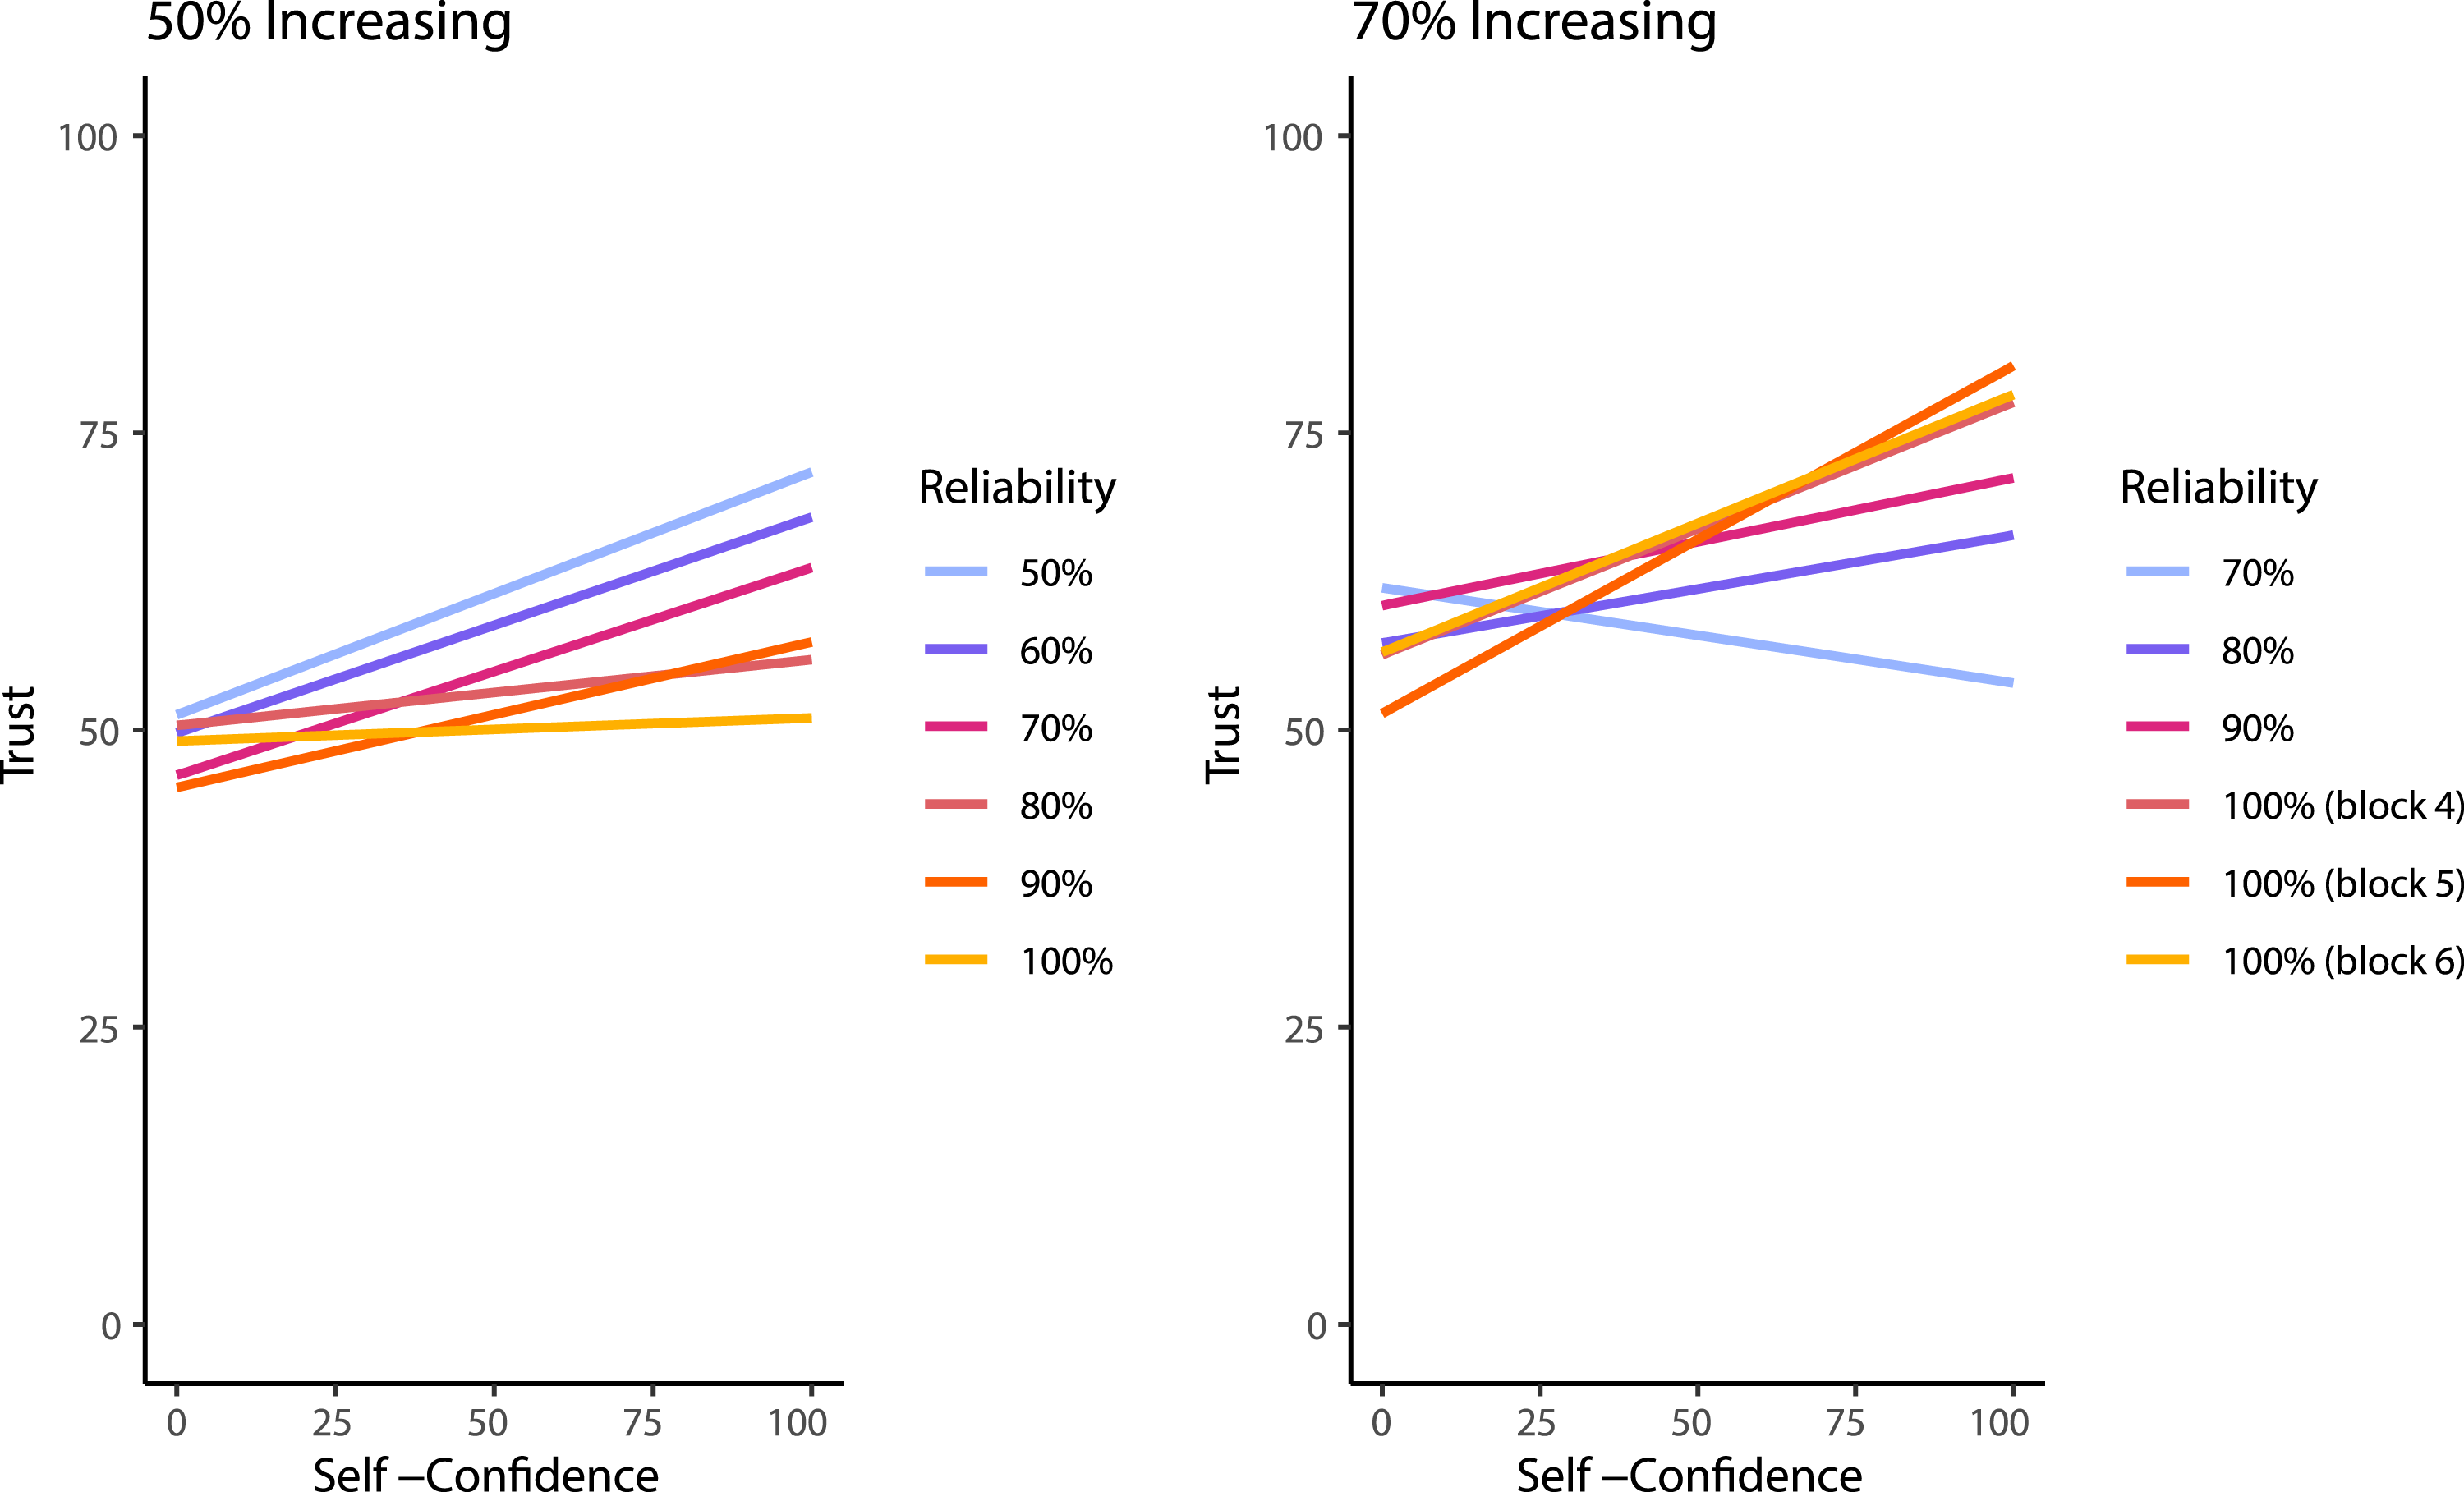
Visualization of the three-way interaction between self-confidence, group, and reliability level predicting trust of the 50% increasing and 70% increasing conditions. It should be noted that the 70% increasing group did not experience the 50% or 60% automation reliability and that were matched for block order between the figures to aid in demonstrating the change across blocks. The 50% increasing group is the same data from the increasing group in Experiment 1, and has been included for comparison.
Experiment 2 Discussion
The purpose of Experiment 2 was to determine if trust increased as automation reliability improved when participants started with more useful automation. We showed that a group that started with automation that was 70% reliable increased their trust in the automation as the reliability increased. This finding is consistent with previous research that has indicated that automation needs to be at least 70% reliable to benefit the user (Wickens & Dixon, 2007). Interestingly, however, is that in the first block of trials the 70% group had lower trust in the automation than the group that was interacting with the 50% reliable automation, and within that first block their trust decreased across trials. Although their trust was initially lower, the potential benefit of the automation seemed to allow their trust to grow over time and as automation reliability increased, indicating that the initial reliability level affected the dynamics of trust.
Unlike the 50% increasing group, the performance of the 70% group did not track with the performance of the automated system even though their trust was better calibrated with the changing reliability level of the system. Instead, their performance fluctuated between 80% and 85% across blocks. Compared to the 50% increasing group, the 70% group had greater performance in the earlier blocks of trials when they had more reliable automation, but they were not able to utilize the benefit of having 100% reliable automation in the final blocks of trials. This finding further indicates that there may be a disconnect between trust and performance.
Finally, Experiment 2 replicated the results of Experiment 1 demonstrating that when participants have higher self-confidence there is a stronger relationship between reliability and trust compared to when self-confidence is lower. Along with Williams et al. (2023), these results continue to show that self-confidence impacts trust in automated systems.
General Discussion
This study advanced trust in automation research given that it further investigated the dynamics of trust across automation that is experiencing shifts in reliability. This study adds to the body of literature that investigates not only how trust in automation varies after automation performance decreases but also how user trust, self-confidence, and performance changes as automation performance increases. Across two experiments, we showed that trust tracked automation that was decreasing in reliability, but only tracked automation that was increasing in reliability when users initially interacted with reasonably reliable automation. Practically, this means that when deploying automation that has the potential to improve its performance over time, consideration should be given to the initial reliability level to ensure it is high enough to engender further trust. Given the current study and previous research (e.g., Wickens & Dixon, 2007), automation should aim to be about 70% reliable on deployment, but this value may change depending on the specific application. Furthermore, the rate at which trust changes is influenced by prior experience and interactions with the automation, not just reliability alone. This means that studies examining the impact of automation reliability should consider the order of their conditions and blocks. This idea has already been partially explored by a few researchers such as Bhat et al., 2022; Sanchez et al., 2014; Yang et al., 2021. Alternatively, de Visser et al. (2019) explores the concept of relationship equity, which could help to explain why trust was unable to be rebuilt in the 50% condition, with too much equity being lost before the automation became reliable (or useful to the user). Lastly, both iterations of this study demonstrated a relationship between self-confidence and the ability to calibrate trust with automation reliability, adding to the recent work of Williams et al. (2023) who showed that self-confidence affected the relationship between trust and reliance behaviors. Further research should investigate this relationship between user self-confidence, automation reliability, and reliance.
While the results of this study contribute to the overall domain of trust research, it is not without its limitations. First, the binary color choice task that was used in this research was unrealistic for real-world applications. Although the task lent itself to being easily conducted online, allowing for a large number of trials to be collected, it is not clear how such a simple task would carry over to more complex systems or decision aids. The task used here is likely more informative about binary decision tasks using automation that may cue to the presence or absence of some sort of signal. Another consideration is that in many systems users would have at least delayed feedback about their performance which would impact their trust in the system because they would be better able to assess whether the automation was impacting performance. Future research should compare how both immediate and delayed feedback affects trust dynamics.
Turning towards more specific methodological limitations, the online nature of the task also limited our ability to ensure participants were engaged with the task. Although we can deduce that participants were considering the information from the automation (based on performance increases that cannot be explained by learning alone), having the automation present a recommendation after the user has already made a decision would allow for a more accurate measure of reliance on the system. On a more positive note, this study also developed a simple online platform for a binary decision task that is openly available for future use. This platform allowed for efficient participant recruitment as well as ease of use for both participants and researchers.
There may also be limitations due to the single question used for trust and self-confidence and there may have been some central clustering of the self-confidence responses (perhaps due to the simple nature of the task) though this was not observed as strongly for the trust measure. Previous research has made use of similar approaches, using a single question (see Lee & Moray, 1994) to measure characteristics of trust, some as frequently as every trial (see Yu et al., 2017). Although there are many criticisms of taking this approach, it is also not feasible to have participants complete multiple surveys every 10 trials over 300 trials; therefore, the decision was made to use a single item scale.
Conclusion
The results of this study show that trust does in fact change with the reliability of the system; however, the way trust changes differs depending on whether automation reliability is increasing or decreasing. Furthermore, it seems as though self-confidence interacts with automation reliability to influence trust, where those with higher self-confidence in a task have their trust influenced more substantially by the reliability level than those with lower self-confidence. Finally, we provide further evidence that automation with low reliability leads to lower trust and impacts the course of trust development even if the automation becomes highly reliable. These findings provide empirical evidence regarding the relationship between trust, self-confidence, and reliability level.
Key Points
Trust in automation changes differently between automation that is increasing or decreasing in reliability, as well as the rate of change of trust. Trust decreased nonlinearly with a delay when using automation that decreased in reliability; however, when using automation that increased in reliability, initial reliability levels affected how trust changed. Performance on the task improved for the automation that increased in reliability when starting with unreliable automation (Experiment 1) but decreased for the automation that decreased in reliability. Performance did not increase as dramatically when the reliability increased from a higher starting point (Experiment 2). Higher user self-confidence is associated with greater differences in trust between different automation reliability levels.
Supplemental Material
Supplemental Material - Trust in Automated Systems is Influenced Differently by Increasing and Decreasing Automation Reliability
Supplemental Material for Trust in Automated Systems is Influenced Differently by Increasing and Decreasing Automation Reliability by Benjamin S. P. Rittenberg, Christopher W. Holland, Grace E. Barnhart, Sierra M. Gaudreau and Heather F. Neyedli in Human Factors
Footnotes
Declaration of Conflicting Interests
The author(s) declared no potential conflicts of interest with respect to the research, authorship, and/or publication of this article.
Funding
The author(s) disclosed receipt of the following financial support for the research, authorship, and/or publication of this article: This work was supported by the Canadian Department of National Defense through the Innovation for Defence Excellence and Security (IDEaS) program. This research was supported by Lab Coordinator Chelsey Hall.
Supplemental Material
Supplemental material for this article is available online.
Author Biographies
Benjamin S. P. Rittenberg is an MD student at Dalhousie University. He completed his MSc in Kinesiology in 2023 at Dalhousie University.
Christopher W. Holland is a PhD student in Psychology and Neuroscience at Dalhousie University. He completed his MSc in Kinesiology in 2020 at Dalhousie University.
Grace E. Barnhart is a Research Assistant at Dalhousie University. She completed her MSc in Kinesiology in 2023 at Dalhousie University.
Sierra M. Gaudreau is a BSc student in Biology and Neuroscience at Dalhousie University.
Dr Heather F. Neyedli is an associate professor at Dalhousie University in Kinesiology. She received her PhD in Kinesiology and Physical Education in 2013 at the University of Toronto.
References
Supplementary Material
Please find the following supplemental material available below.
For Open Access articles published under a Creative Commons License, all supplemental material carries the same license as the article it is associated with.
For non-Open Access articles published, all supplemental material carries a non-exclusive license, and permission requests for re-use of supplemental material or any part of supplemental material shall be sent directly to the copyright owner as specified in the copyright notice associated with the article.