
Abstract
Objective
This on-road study employed behavioral and neurophysiological measurement techniques to assess the influence of six weeks of practice driving a Level 2 partially automated vehicle on driver workload and engagement.
Background
Level 2 partial automation requires a driver to maintain supervisory control of the vehicle to detect “edge cases” that the automation is not equipped to handle. There is mixed evidence regarding whether drivers can do so effectively. There is also an open question regarding how practice and familiarity with automation influence driver cognitive states over time.
Method
Behavioral and neurophysiological measures of driver workload and visual engagement were recorded from 30 participants at two testing sessions—with a six-week familiarization period in-between. At both testing sessions, participants drove a vehicle with partial automation engaged (Level 2) and not engaged (Level 0) on two interstate highways while reaction times to the detection response task (DRT) and neurophysiological (EEG) metrics of frontal theta and parietal alpha were recorded.
Results
DRT results demonstrated that partially automated driving placed more cognitive load on drivers than manual driving and six weeks of practice decreased driver workload—though only when the driving environment was relatively simple. EEG metrics of frontal theta and parietal alpha showed null effects of partial automation.
Conclusion
Driver workload was influenced by level of automation, specific highway characteristics, and by practice over time, but only on a behavioral level and not on a neural level.
Application
These findings expand our understanding of the influence of practice on driver cognitive states under Level 2 partial automation.
Keywords
INTRODUCTION
The growing prevalence of automated vehicles calls for systematic investigation into how drivers interact with them. Automated vehicles aim to reduce the workload placed on drivers by removing basic driving tasks such as steering, accelerating, and decelerating. They provide the potential to increase safety and decrease the number of crashes attributed to human errors. However, until vehicles reach full autonomy with no need for human input, it’s important to understand how drivers perform when the driving responsibilities are shared.
The Society for Automotive Engineers (SAE, 2021) has categorized six levels of vehicle automation, ranging from no automation (Level 0) to full autonomy (Level 5). Currently, Level 2 vehicles (referred to as partial automation) are prevalent on roadways and require shared responsibility between the driver and the automated technology. Level 2 vehicles provide concurrent longitudinal (Adaptive Cruise Control [ACC]) and latitudinal (Lane Keeping Assist [LKA]) control under driver supervision. ACC is the vehicle’s ability to maintain a preset speed and following distance and LKA is the vehicle’s ability to maintain lane positioning. These two features, when used simultaneously, comprise Level 2 partial automation.
When driving in Level 0 with no automation (equivalent to manual driving), the driver is in active control of the vehicle and maintains full responsibility for the vehicle’s speed and trajectory. When driving under Level 2 partial automation, however, the driver’s role shifts from an active controller of the vehicle to a passive monitor of the automated system (Endsley, 2017a; Endsley & Kiris, 1995). They are no longer responsible for basic driving tasks but must still supervise the system to detect “edge cases” that the automated technology is not equipped to handle and where human input is needed. In other words, the driver must remain sufficiently engaged to be able to take back manual control of the vehicle if the automation were to fail at any given moment.
Given humans are generally bad at monitoring for rare events (Wolfe et al., 2005) and perform poorly on driving tasks that require sustained attention (Greenlee et al., 2018), there is concern that passive monitoring may lead to disengagement from the environment (Casner et al., 2016; Fisher et al., 2016). This lies at the heart of the automation conundrum (Endsley, 2017a)—that as more automation is added to vehicles, they become more robust and reliable and the driver becomes less engaged, decreasing the likelihood that they will successfully take back manual control when needed. This concern has been evidenced by a decrease in driver situation awareness (Endsley & Kiris, 1995) and increase in drowsiness (Dufour, 2014) due to under arousal during partially automated driving. In addition to under arousal, disengagement from the driving environment can also be attributed to an increase in secondary task engagement under partial automation, limiting the cognitive resources the driver has available to allocate to the primary task of supervising the vehicle. Prior work has found that drivers are more likely to engage in nondriving-related tasks (NDRTs) when the cognitive demand of the primary driving task is low and proneness to boredom is high (Sanbonmatsu et al., 2013; Schroeter et al., 2015). Data from the human-automation interaction literature shows that engagement in NDRTs increases incrementally from manual driving to partially automated driving to fully automated driving (Carsten et al., 2012), and drivers are 50% more likely to engage in NDRTs when using partial automation compared to no automation (Dunn et al., 2019). This body of evidence suggests that driver engagement must continue to be monitored at each stage of shared responsibility between the human and the vehicle.
However, several on-road studies have failed to find that drivers disengage under partial automation. Naturalistic video data suggest that drivers continue to safely monitor the road under partial automation (Fridman et al., 2019; Hatfield et al., 2019), though with longer eye glances away from the forward roadway (Gaspar & Carney, 2019). In prior work, our group collected electrophysiological (EEG) data as participants drove a vehicle in Level 0 manual and Level 2 partial automation mode on real interstates—across multiple roadway conditions and vehicle types—and found no differences in EEG measures of frontal theta power or parietal alpha power between manual and partially automated driving (McDonnell et al., 2021b). The null effect of frontal theta power, which is a measure of driver workload that will be described in detail later, suggests that partial automation does not decrease driver workload as it intends. The null effect of parietal alpha power, which is a measure of driver engagement that will also be described in greater detail later, suggests that engagement is not, in fact, diminished under partial automation driving conditions—at least when measured on a neurophysiological level. Lohani et al. (2021) found a similar null effect of automation on physiological arousal, as measured by heart rate and heart rate variability. Furthermore, Weaver et al. (2022) periodically probed drivers and found a null effect of automation on self-reported mind wandering, physiological arousal, and driving performance. These results suggest there may be a difference between simulated and real driving, such that the potential for deadly consequences on real roadways forces drivers to remain engaged in a way that is not captured in simulated driving, where poor driving performance is less consequential. Regardless, the conflicting evidence of a driver’s ability to remain engaged under partial automation validates the need for real-time assessment of driver cognitive states.
It is possible that drivers with no prior automation experience (such as those in Lohani et al., 2021, McDonnell et al., 2021b; Weaver et al., 2022) remain engaged due to the novelty of the technology. Evidence suggests that increased familiarity with automation leads to increases in trust and decreases in stress over time (Endsley, 2017b; Gaspar & Carney, 2019). A recent longitudinal simulator study manipulated frequency of exposure to ACC and found that drivers’ mental models improved with increased exposure to the technology (Pai et al., 2023). Others have found that training drivers on how to interact with automated vehicles leads to improved takeover time and quality and increased trust in the technology (Ebnali et al., 2019). The concern here is that as experience and comfortability with partial automation grows, so might driver overreliance and trust, leading to a decrease in driver engagement over time. There is a gap in the literature regarding how experimentally manipulated practice with partial automation influences a driver’s cognition over time under real driving conditions on actual roadways.
To test the effect of practice with partial automation on driver workload and engagement over time, the present study experimentally manipulated familiarity with Level 2 partial automation. To do so, we replicated the experimental design of McDonnell et al. (2021b) in which participants drove in both Level 0 manual mode and in Level 2 partial automation mode on real highways. However, in the present study, we incorporated a novel, six-week familiarization period following their first experimental testing session in which participants took the vehicle home with them and drove it in partially automated mode every day to gain comfortability with it. Participants then completed a second experimental session at the end of the six weeks. In both experimental testing sessions, we assessed driver cognitive states from both a behavioral and neural perspective.
To understand cognition from a behavioral level, we measured driver workload using the Detection Response Task (DRT; ISO 17488, 2016). This simple stimulus-response task presents a vibrotactile stimulus every 3–5 s and requires drivers to respond to each probe with a button press. Such probe techniques are used across many domains of human factors to index changes in cognitive workload, such as in work related to driver distraction (McDonnell et al., 2021a), pilot performance (Innes et al., 2021), human-computer interactions (Thorpe et al., 2019), immersion in virtual and augmented reality head mounted displays (Maag et al., 2023), and more. Furthermore, the DRT has been used extensively to measure the workload associated with partially automated driving (e.g., Biondi et al., 2018; Lohani et al., 2021; Stapel et al., 2019). In the context of driving, an increase in driving-related demand is associated with increased reaction times (RTs) to the DRT (e.g., Cooper et al., 2016; Nilsson et al., 2018; Strayer et al., 2022a; Young et al., 2013). This method suggests that increased cognitive workload associated with the primary task of driving reduces the cognitive resources available to allocate to the secondary task of the DRT, thus resulting in the driver missing or responding slower to the DRT stimuli. In this way, DRT RTs can be interpreted as indicators of the attentional consequence of cognitive workload. While responding to the DRT does add an additional cognitive cost that can potentially affect performance (Biondi et al., 2021), Castro et al. (2019) found that this cognitive cost was lower for a simple RT task compared to a choice RT task. Furthermore, Strayer et al. (2015) found that subjective workload was not significantly affected by introduction of the DRT while driving, and Palada et al. (2019) found that when compared to a single-task group, the addition of the DRT only slowed response times by 10 ms and decreased accuracy on a classification task by 1%. Overall, the simplicity of the DRT makes it an ideal candidate to safely assess driver workload while driving on real roadways at high speeds (Strayer et al., 2022a). Nevertheless, it is essential to include the DRT in all experimental driving conditions to ensure that utilizing the DRT does not introduce a confound in the research design.
To understand cognition from a neural level, we collected EEG measures of driver workload and engagement, consistent with McDonnell et al. (2021b). EEG allows for direct measurement of brain activity in response to the varying demands of the driving environment (Lohani et al., 2019; Peng et al., 2022). The EEG signal can be decomposed into the frequency domain using a Fourier analysis (Cohen, 2014) and then categorized into different frequency bands (e.g., theta ∼ 4–8 Hz, alpha ∼8–12 Hz, beta ∼12–30 Hz) that index different cognitive processes. Prior studies in the human factors domain commonly assess power in the frontally distributed theta frequency band from 4 to 8 Hz (referred to as frontal theta power) and power in the partially distributed alpha frequency band from 8 to 12 Hz (referred to as parietal alpha power) to assess driver workload and engagement, respectively (for review see Borghini et al., 2014).
Recent meta-analyses verify that frontal theta power is sensitive to cognitive workload (Chikhi et al., 2022) such that theta oscillations over the frontal cortex of the brain increase with an increase in cognitive effort (Fairclough et al., 2005; Gevins & Smith, 2003). For example, frontal theta power increases under multitasking compared to single-task demands (Puma et al., 2018). In the context of driving, an increase in frontal theta power indexes the workload associated with an increase in cognitive demand of the driving environment. This is validated by recent work on army combat drivers that shows greater frontal theta power in response to increasingly complex driving environments (Diaz-Piedra et al., 2020). Thus, in the present study, frontal theta power is conceptualized as a neurophysiological metric sensitive to differences in driver workload between manual and partially automated driving.
Parietal alpha power is conceptualized as a neurophysiological metric sensitive to differences in driver engagement associated with varying levels of vehicle automation. Parietal alpha power is inversely related to visual engagement such that as engagement increases, parietal alpha power decreases (Foxe & Snyder, 2011). This is validated by literature demonstrating a decrease in alpha power from parietal and occipital electrodes that overlay visual cortices in the brain during a visual task (Classen et al., 1998), thus suggesting that parietal alpha oscillations serve as a mechanism of cortical suppression. This is further illustrated by the fact that parietal alpha power is greatest when the eyes are closed (Goldman et al., 2002).
In the present study, we explored three research questions related to driver cognitive states during partially automated driving:
How does partial automation influence driver workload (as measured with DRT reaction time and frontal theta power) when compared to manual driving with no automation? We hypothesized that if partial automation decreases driver workload as intended, we would observe faster DRT reaction times and lower frontal theta power while driving under partial automation compared to driving manually.
How does partial automation influence driver visual engagement (as measured with parietal alpha power) when compared to manual driving with no automation? We hypothesized that if partial automation leads to under-arousal and subsequent disengagement from the driving environment, we would observe an increase in parietal alpha power during partial automation compared to manual driving.
Does six weeks of practice with a partially automated vehicle influence driver workload and engagement over time? We hypothesized that if practice with partial automation leads to a decrease in driver workload and engagement over time, we would see a decrease in DRT reaction time and frontal theta power and an increase in parietal alpha power during partially automated driving at Session 2 compared to Session 1.
METHODS AND MATERIALS
This research complied with the American Psychological Association Code of Ethics and was approved by the Institutional Review Board at the University of Utah (IRB_00128049). Informed consent was obtained from each participant.
Participants
Participants (N = 30, 12 females, 18 males; M age = 35.73, SD age = 9.34) were recruited online. Eligible participants had a valid driver’s license, no at-fault accidents within the past two years, and no prior experience with Level 2 partial automation technology. To ensure substantial practice driving the vehicle over the six-week familiarization phase, participants were required to have a highway commute of at least 40 minutes round-trip and were instructed to drive the vehicle in partial automation mode daily.
Vehicles
Five vehicles equipped with Level 2 technology were utilized in this study: Tesla Model 3, Tesla Model S, Cadillac CT6, Volvo XC90, and Nissan Rogue. Six participants completed testing in the Tesla Model 3, eight tested in the Tesla Model S, one tested in the Cadillac CT6, nine tested in the Volvo XC90, and six tested in the Nissan Rogue. Multiple vehicles were included to increase generalizability of the results and not to compare driver experiences between vehicles, as we were not statistically powered to detect such between-vehicle differences. The vehicle that each participant drove was randomly selected based on which of the five vehicles was available at the time a new participant enrolled in the study.
Highways
Each participant drove on two interstate highways during the experimental testing sessions (Figure 1). I-15 is a straight, high-trafficked interstate that runs South to North with five lanes in either direction and an average speed limit of 75 mph. I-80 is a curvy, mountain interstate running West to East with 1–2 lanes in either direction and an average speed limit of 60 mph. Multiple highway configurations were included to assess how driving environments of varying complexity may differentially influence driver workload and engagement. Map of the two experimental driving routes utilized in the study (I-15 and I-80), as well as a training route that participants drove at the start of Session 1 (I-215).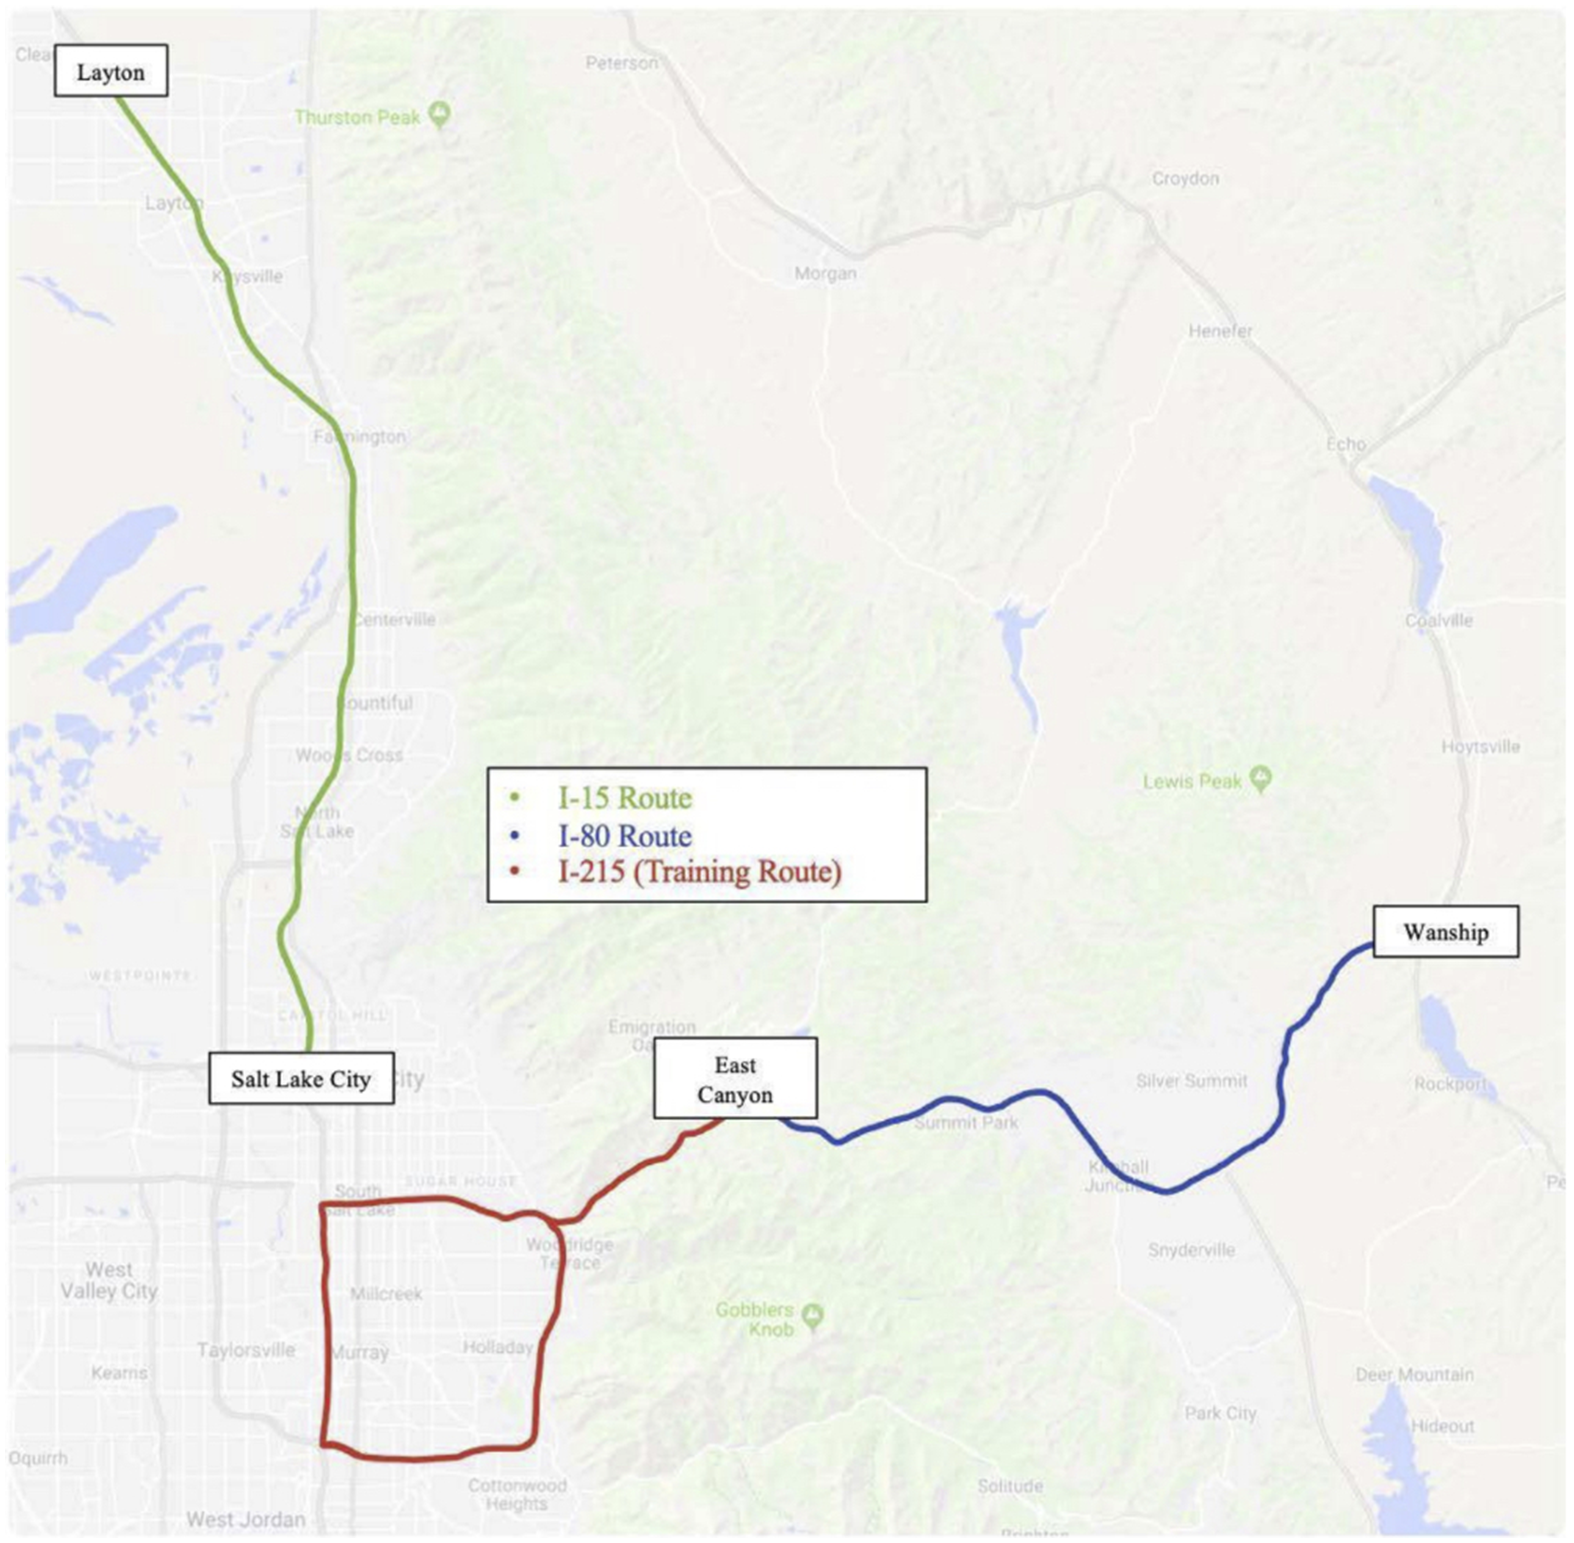
Detection Response Task
A vibrotactile DRT (Red Scientific, Inc.) was utilized as a behavioral metric of cognitive workload (ISO 17488, 2016). Participants were outfitted with a vibrotactile stimulus device taped to their right forearm and a microswitch response button attached to their right index finger (see Figure 2), consistent with previous research (Lohani et al., 2020, 2021; Strayer et al., 2022a). For this simple stimulus-response task, a vibration stimulus was presented quasi-randomly every 3–5 s (ISO 17488, 2016) and participants responded by pressing the response button against the steering wheel. The vibration lasted 1 second or until the participant pressed the response button. RTs to the vibrotactile stimuli were recorded at millisecond resolution and stimuli that were not responded to were coded as misses. Any RTs that occurred faster than 100 ms were removed before analyses and RTs that were over 2500 ms were coded as misses (ISO 17488, 2016). Average reaction time to the DRT was calculated for each participant in each experimental condition. Hit rate to the DRT was not analyzed because participants performed at a ceiling level (∼95% and above). This lack of hit rate variance is consistent with prior on-road studies (e.g., Lohani et al., 2021). The DRT vibrotactile stimulus and microswitch response button (left), EEG electrode setup (middle), and the combination of the two while driving (right).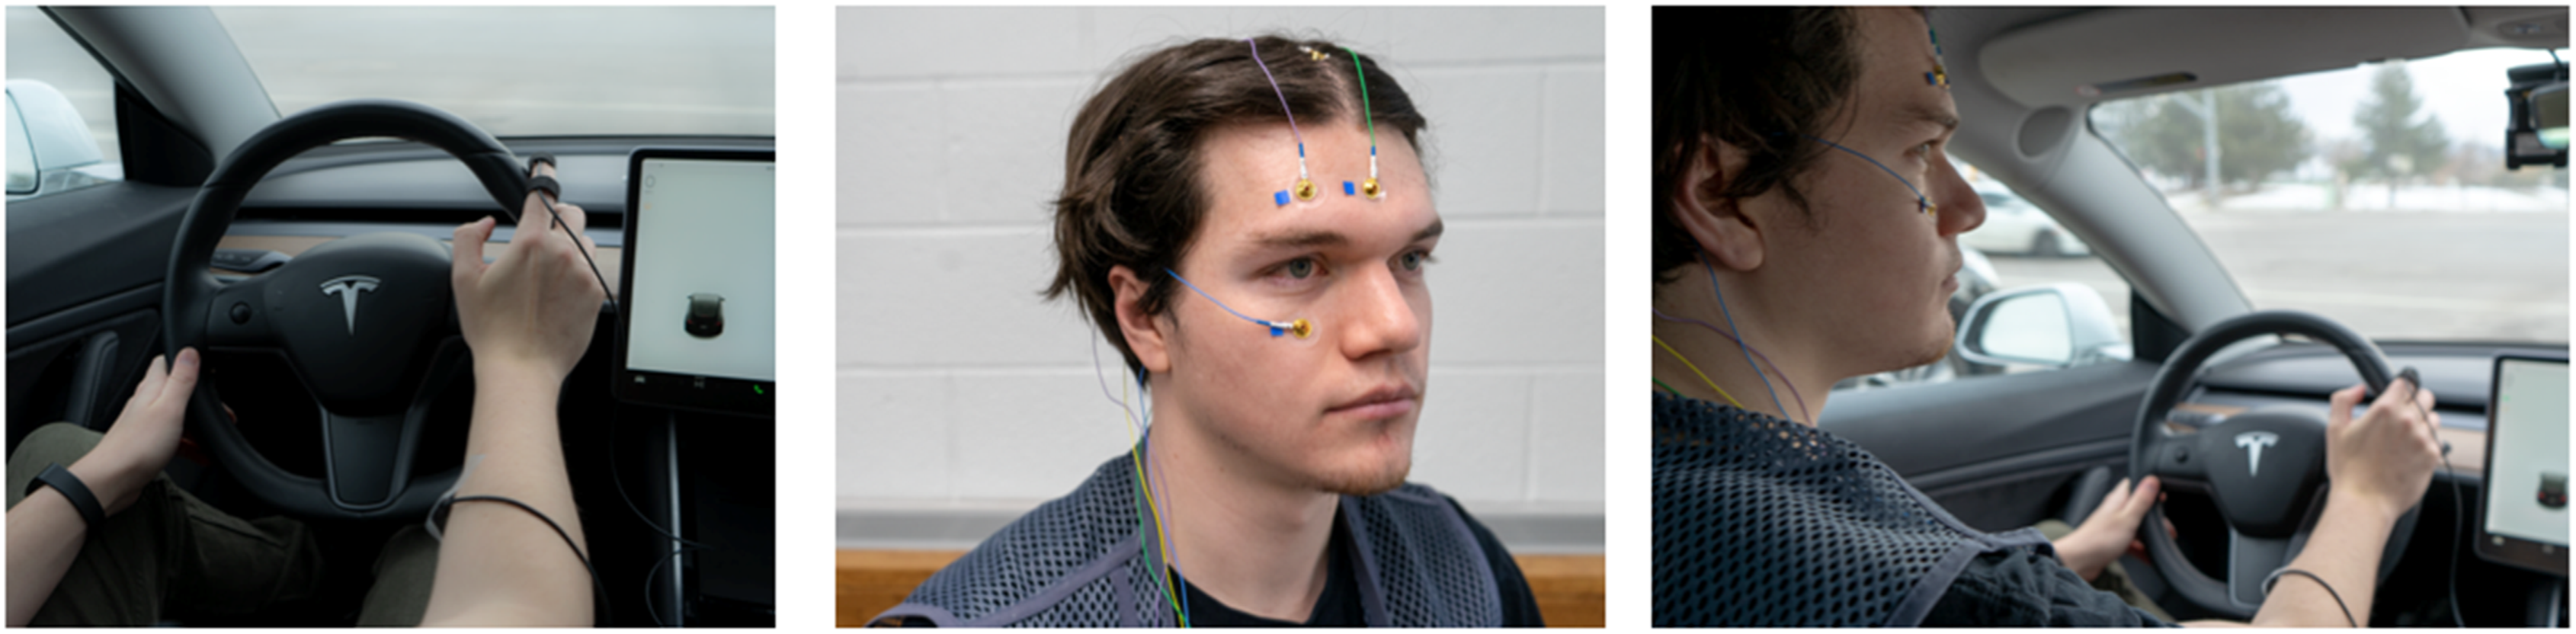
EEG Recording
EEG data were recorded using BIOPAC’s BioNomadix system (BIOPAC Systems, Inc.). Three passive electrodes (Ag/AgCl; NATUS Neurology) were placed along midline sites—frontal (Fz), central (Cz), and parietal (Pz)—according to the International 10–20 system (Jasper, 1958), with a ground electrode on the center of the forehead and a reference electrode on the right mastoid bone. Two electrodes were placed above and below the right eye to record electrooculographic (EOG) activity for later data processing (see Figure 2). Electrodes were secured to the scalp with Ten20 Conductive Paste and collars, and electrode impedances were kept below 10kΩ, as determined by BIOPAC’s EL-CHECK impedance checker. Two, two channel BioNomadix wireless transmitters were used to record the EEG signal, the BioNomadix Smart Center amplified the signal with a 2 kHz per channel maximum sampling rate, and the data were observed online through AcqKnowledge (Version 5.0) software.
Design
The present study employed a 2 (Level of Automation: Level 0 and Level 2) × 2 (Interstate: I-15 and I-80) × 2 (Session: 1 and 2) factorial design. At each session, participants completed three manipulation checks (resting DRT manipulation check, auditory N-back frontal theta manipulation check, and an eyes-closed parietal alpha manipulation check) and four experimental driving conditions (I-15 manual [Level 0], 1-15 partial automation [Level 2], I-80 manual [Level 0], I-80 partial automation [Level 2]). Driving in both Level 0 manual mode and Level 2 partially automated mode allowed for the comparison of driver cognitive states between when partial automation is engaged (Level 2) and not engaged (Level 0). In this way, the Level 0 conditions serve as benchmark conditions to which we compare Level 2 driving, validating that any potential changes in outcome measures between conditions are due to differences in level of automation.
The Resting DRT manipulation check consisted of responding to 4 min of the DRT while sitting in the parked vehicle. This allowed us to demonstrate that DRT RT is sensitive to the workload associated with driving such that RT increases under dual-task, driving conditions compared to at rest. Each participant also completed an eyes-closed, parietal alpha manipulation check in which EEG was recorded for 4 min while participants closed their eyes in the parked vehicle. An increase in parietal alpha power while the eyes are closed is one of the most reliable effects in the EEG literature (Goldman et al., 2002) and demonstrates that parietal alpha power is inversely related to visual engagement. Lastly, each participant completed a frontal theta power manipulation check in which EEG was recorded while participants completed an Auditory N-back counting task in the parked vehicle. The N-back task is commonly used in the driving literature to induce cognitive load (e.g., Mehler et al., 2011; Strayer et al., 2019; Zhang et al., 2015) and provides a measure of frontal theta power during a demanding, standardized cognitive task to compare with driving.
Procedure
At the start of both experimental testing sessions, participants signed a consent document, blew into a BACtrack breathalyzer to confirm a blood alcohol concentration of .00%, and were setup with the EEG system in the laboratory before heading to the vehicle.
In the parking lot, participants reviewed the technological features of the vehicle with the researcher and then completed the three manipulation checks described above. Participants then drove a training route (see Figure 1) and practiced engaging and disengaging partial automation until they were ready to begin testing.
Once the manipulation checks and training were complete, the four experimental driving conditions began (i.e., driving on I-15 in manual mode, I-15 in partially automated mode, I-80 in manual mode, and I-80 in partially automated mode). Each experimental driving condition was of comparable distance and took about 18 min to complete. This means that an average of ∼250 DRT stimuli (presented every 3–5 s) were presented in each experimental condition and an average of 18 min of EEG recordings were extracted for each condition. The order of the conditions was quasi-counterbalanced such that one interstate was completed before the other. For example, if one participant drove north on I-15 in partially automated mode first, they would then drive south on I-15 in manual mode before they headed to I-80, in which they would then drive east on I-80 in manual mode and then west on I-80 in partially automated mode. The next participant would then start their experimental conditions on I-80 in partially automated mode, and so on. Counterbalancing in such a way allowed us to control for potential practice effects or fatigue that may occur in the experimental conditions. Given DRT and EEG data were collected simultaneously throughout the entirety of each of the four driving conditions, a researcher sat in the passenger seat throughout the entire experimental procedure to monitor data acquisition and quality of the neurophysiological recordings. Between each of the four driving conditions, the participant was instructed to exit the highway for the researcher to check EEG electrode impedances.
At the end of Session 1, the participant took the vehicle home with them and was instructed to drive it in partial automation for six weeks on their daily work commute. Session 2 comprised of this exact same experimental procedure and occurred at the end of this six-week familiarization period (see Figure 3). Overview of the study design. The present analysis directly compares Experimental Session 1 with Experimental Session 2.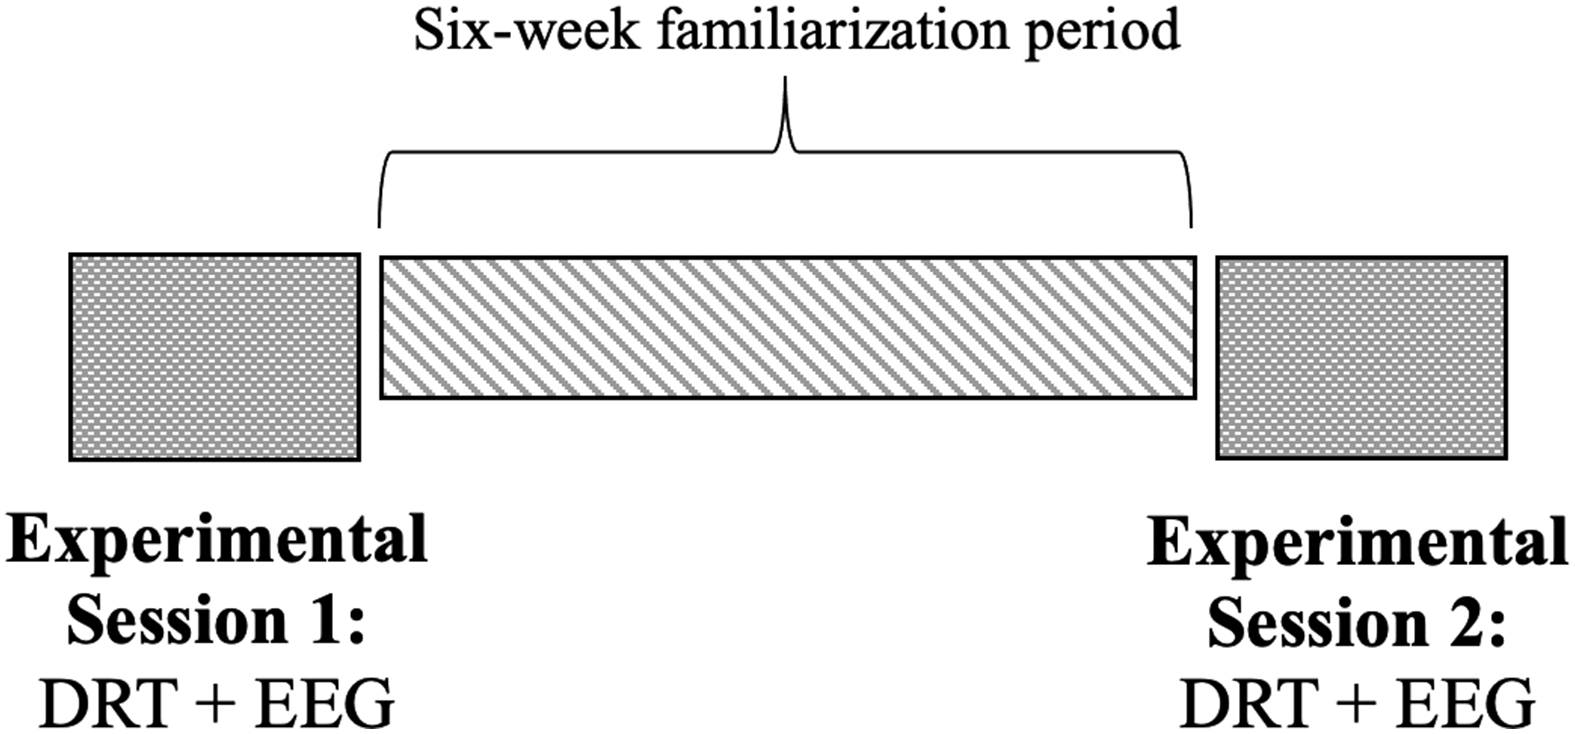
Six-Week Familiarization Period
Between Session 1 and Session 2, all participants took their testing vehicle home with them and agreed to drive it in partial automation mode for six weeks on their daily commute. Furthermore, they agreed not to allow other people in the vehicle and to operate the vehicle in accordance with the law. The research team validated that participants used partial automation mode daily via a video camera that captured the vehicle state icons indicating whether partial automation was active or not. The camera automatically began recording when the vehicle turned on. The purpose of this period was to ensure that each participant received adequate and comparable practice driving under partial automation. No outcome measures (i.e., DRT or EEG) were collected during this six-week period.
EEG Data Processing
EEG data were processed in MATLAB using the EEGLAB toolbox (Delorme & Makeig, 2004). Data were downsampled to 250 Hz, bandpass filtered from .1 to 30 Hz, and then epoched into 1 second intervals with a Hanning window. Eye movements were corrected with eye movement correction procedure (Gratton et al., 1983). The average percent of epochs lost due to artifacts after correction was .39% across all four experimental conditions (I-15 partial automation: .39%; I-15 manual: .42%; I-80 partial automation: .43%; I-80 manual: .33%), comparable with previous on-road studies (McDonnell et al., 2021b). We ran a Fast Fourier Transform to convert the artifact-free EEG data from the time domain to the frequency domain (Cohen, 2014), and then extracted the average power at each frequency from 1 to 30 Hz for each participant at each level of automation, interstate, and session.
Statistical Analyses
All data were analyzed in R version 4.1.3 (R Core Team, 2021). Manipulation check results were analyzed with paired-sample t-tests, comparing the manipulation check condition to the average of the four driving conditions. For our main analyses, we ran linear mixed effects models to account for repeated measures and missing data. Participant ID was included in all models as a random intercept and DRT RT, frontal theta power, and parietal alpha power were each entered independently as the outcome variables. For each outcome variable, we ran models testing the main effects of Level of Automation, Interstate, and Session, as well as models testing each two-way interaction between these predictors, with each predictor included as fixed effects in the models. We ran likelihood ratio tests to assess the significance of all effects. This generates a chi-squared statistic that compares the model with the variable of interest (Level of Automation, Interstate, Session, or interaction between each variable in the factorial design) entered as a fixed effect and Participant ID as a random effect, to a model with the fixed effect of interest removed. For significant interactions, we calculated the simple effects for each contrast of interest using the emmeans package in R.
RESULTS
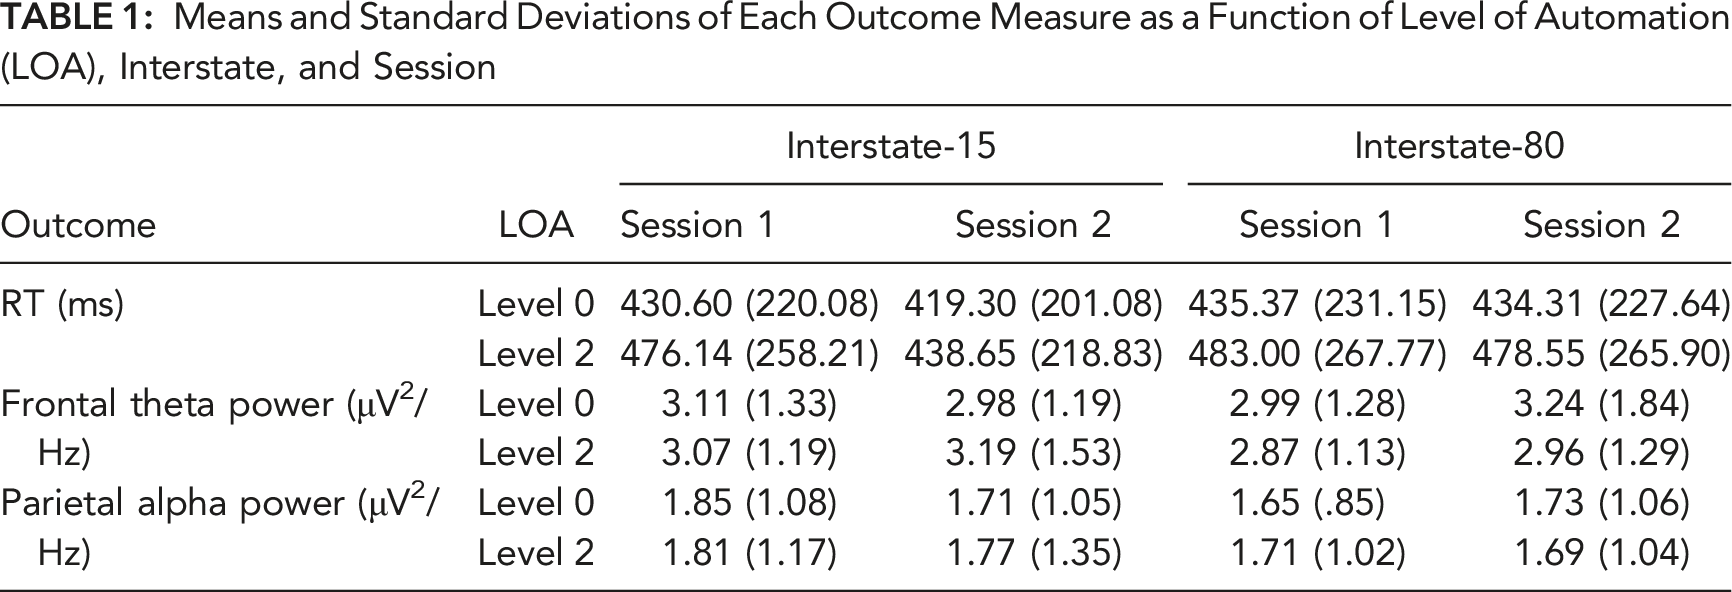
Means and Standard Deviations of Each Outcome Measure as a Function of Level of Automation (LOA), Interstate, and Session
Behavioral Results
DRT RT was assessed for insight into driver workload. The DRT manipulation check confirmed that RT is sensitive to the workload associated with driving such that there were significantly slower RTs while driving (M = 450.99 ms, SD = 99.84, SE = 18.23) compared to while parked (M = 353.07 ms, SD = 106.65, SE = 19.47), as confirmed by a paired groups t-test (t (58) = 3.67, p < .001).
Figure 4 shows mean RTs by Condition and Session, and results of the linear mixed effects models predicting RT are presented in Table 2. We found a significant main effect of Level of Automation such that RTs were significantly faster when driving in Level 0 manual when compared to Level 2 partial automation (β = −39.82, p < .001, 95% CI [−43.42, −36.21]). We also found a significant main effect of Interstate such that RTs were slower when driving on the more complex I-80 compared to on I-15 (β = 12.44, p < .001, 95% CI [8.83, 16.04]). Furthermore, we found a significant main effect of Session such that RTs were significantly faster at Session 2 compared to Session 1 (β = −14.40, p < .001, 95% CI [−18.04, −10.76]). Average RT to the DRT in the manipulation check as well as each of the four experimental driving conditions at Session 1 and Session 2. Error bars represent standard error of the mean. Results From Linear Mixed Effects Models Predicting RT (ms) to the DRT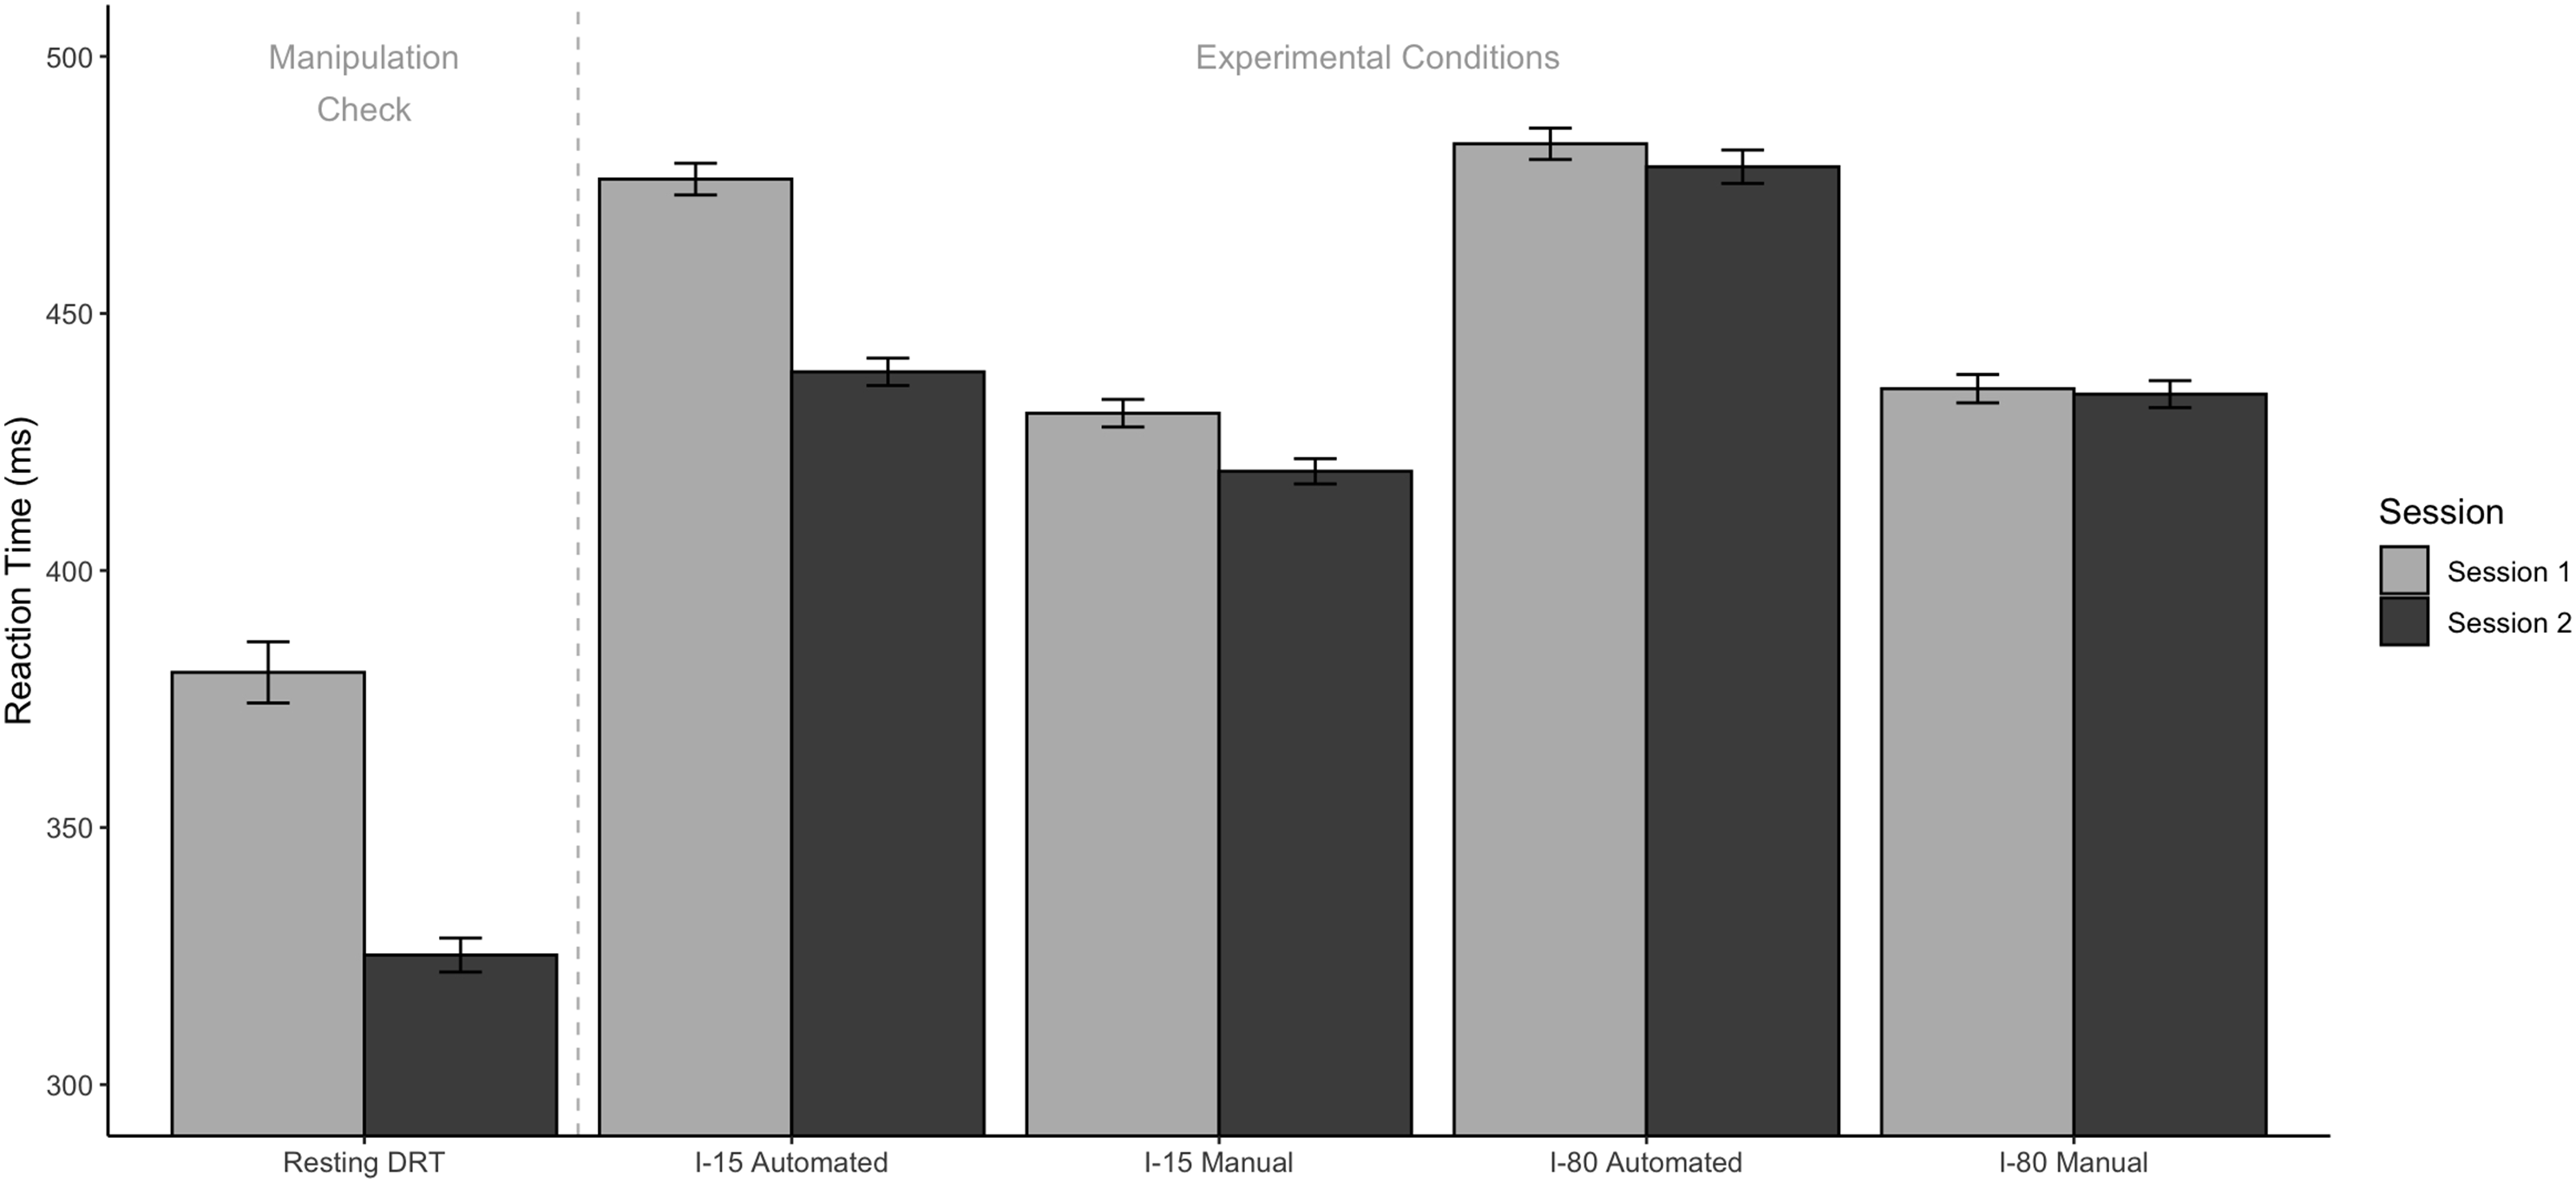
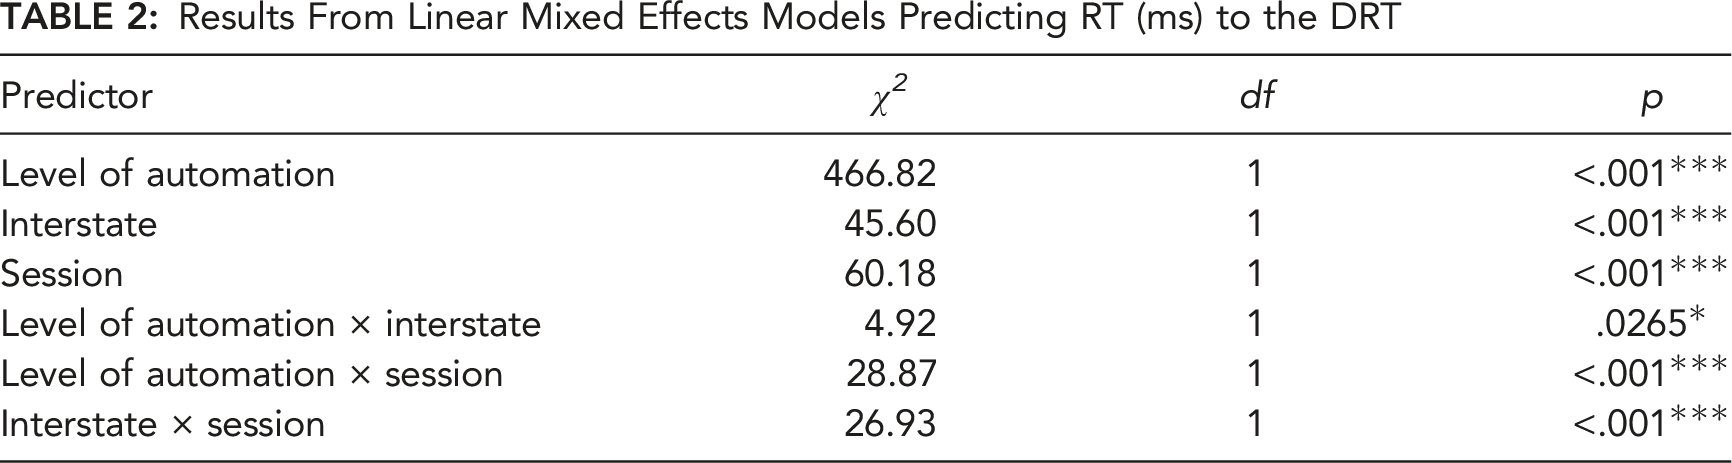
In terms of interactions, we found a significant interaction between Level of Automation and Interstate (β = −8.17, p = .0265, 95% CI [−15.39, −.95]), such that there were significantly higher RTs when driving on I-80 compared to I-15, and that difference was greater when driving under partial automation (simple effect estimate = 16.9, p < .001) compared to driving manually (simple effect estimate = 8.7, p < .001). We found a significant interaction between Level of Automation and Session (β = 19.75, p < .001, 95% CI [12.55, 26.96]), such that RT significantly decreased from Session 1 to Session 2 only when driving under partial automation (simple effect estimate = −22.99, p < .001) and not when manually driving (simple effect estimate = −3.24, p = .215). Lastly, we found a significant interaction between Interstate and Session (β = 19.09, p < .001, 95% CI [11.88, 26.31]), such that RTs significantly decreased from Session 1 to Session 2, and that decrease was greater on the simpler I-15 (simple effect estimate= −24.18, p < .001) than on I-80 (simple effect estimate= −5.09, p = .0482).
EEG Results
Frontal theta power and parietal alpha power were assessed to examine covert changes in driver workload and engagement, respectively. The raw spectral curves for each manipulation check and experimental condition are presented in Figure 5. Consistent with prior driving literature, frontal theta power is defined as the power in the frequency band between 4 and 8 Hz at electrode Fz. Parietal alpha power is defined as the power in the frequency band between 8 and 12 Hz at electrode Pz. Spectral curves of the power at each frequency at electrodes Fz (left) and Pz (right), collapsed across participants and sessions.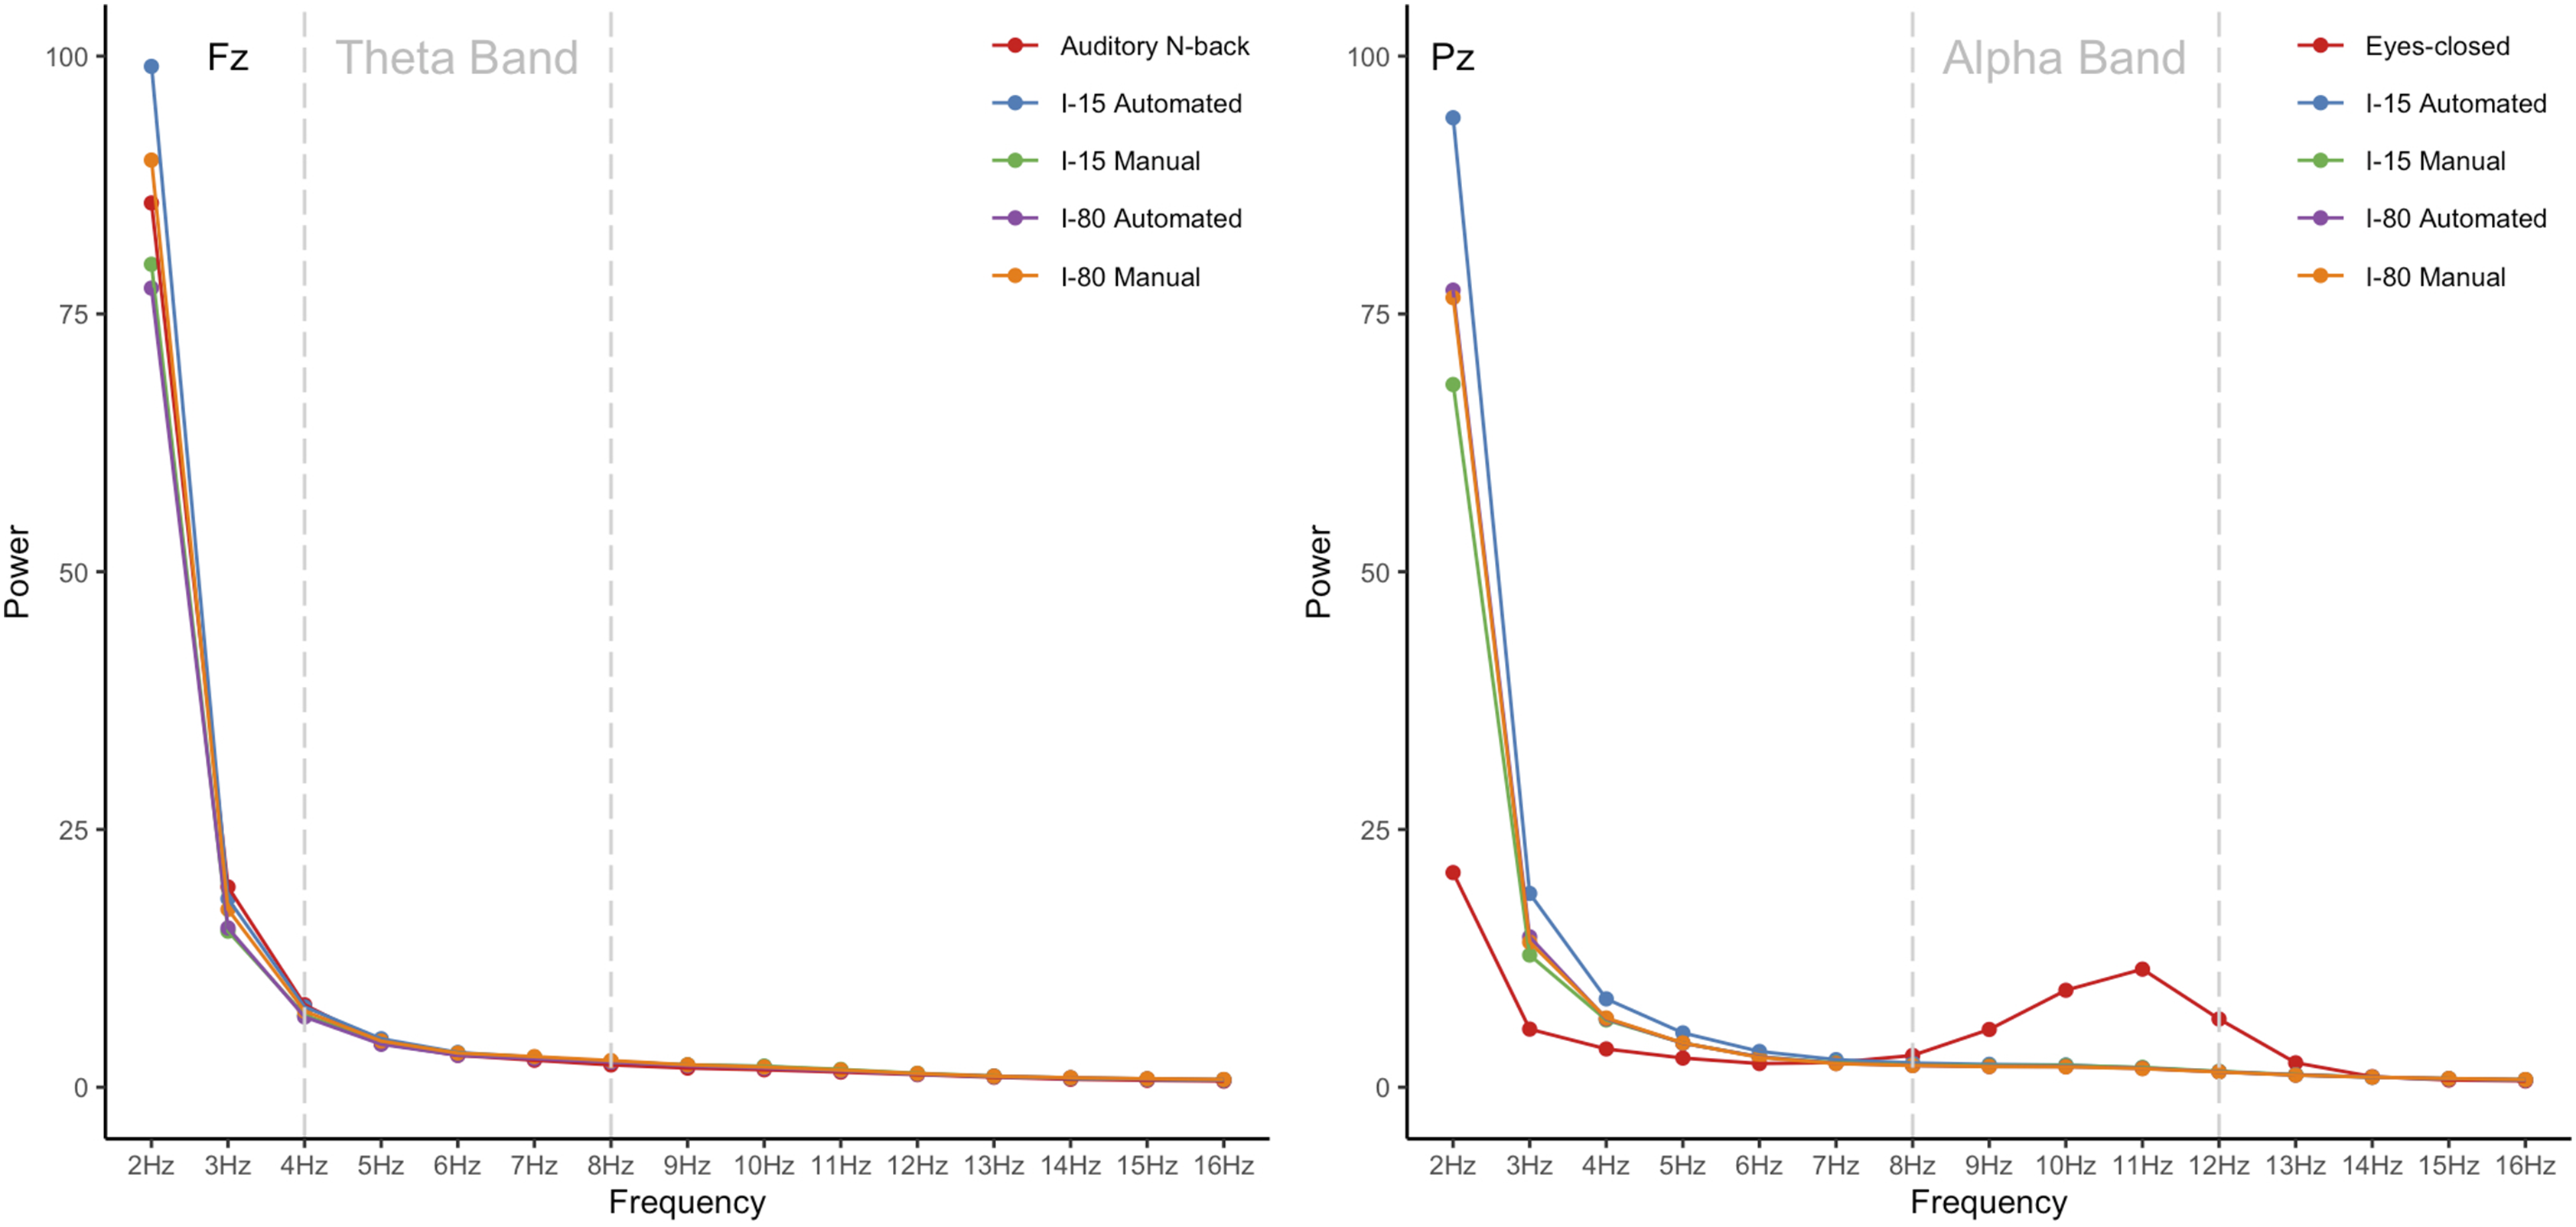
The frontal theta power Auditory N-back manipulation check confirmed that frontal theta power is sensitive to the cognitive demand associated with driving such that frontal theta power was higher while driving (M = 3.06 μV2/Hz, SD = 1.27, SE = .23) compared to during the Auditory N-back (M = 2.77 μV2/Hz, SD = 1.22, SE = .22), though not significantly so (t (58) = −.90, p = .371). The Eyes-closed parietal alpha power manipulation check confirmed that parietal alpha power is a neural marker of visual engagement with the driving environment such that parietal alpha power while the eyes are closed at rest (M = 6.96 μV2/Hz, SD = 10.11, SE = 1.85) is significantly greater than while driving (M = 1.75 μV2/Hz, SD = 1.01, SE = .18), as confirmed by a paired groups t-test (t (58) = 2.81, p = .00870).
Frontal Theta Power
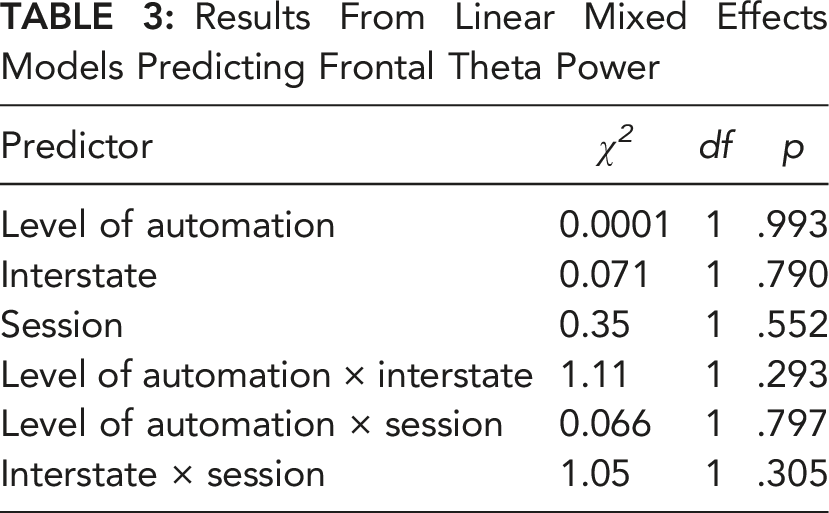
Figure 6 shows the mean frontal theta power as a function of Condition and Session, and results of the linear mixed effects models predicting frontal theta power are presented in Table 3. Mixed models revealed that there were no significant main effects of Level of Automation, Interstate, or Session on frontal theta power, nor were there any significant interactions between each of the variables in the factorial design. Average frontal theta power in the Auditory N-Back manipulation check as well as each of the four experimental driving conditions at Session 1 and Session 2. Error bars represent standard error of the mean. Results From Linear Mixed Effects Models Predicting Frontal Theta Power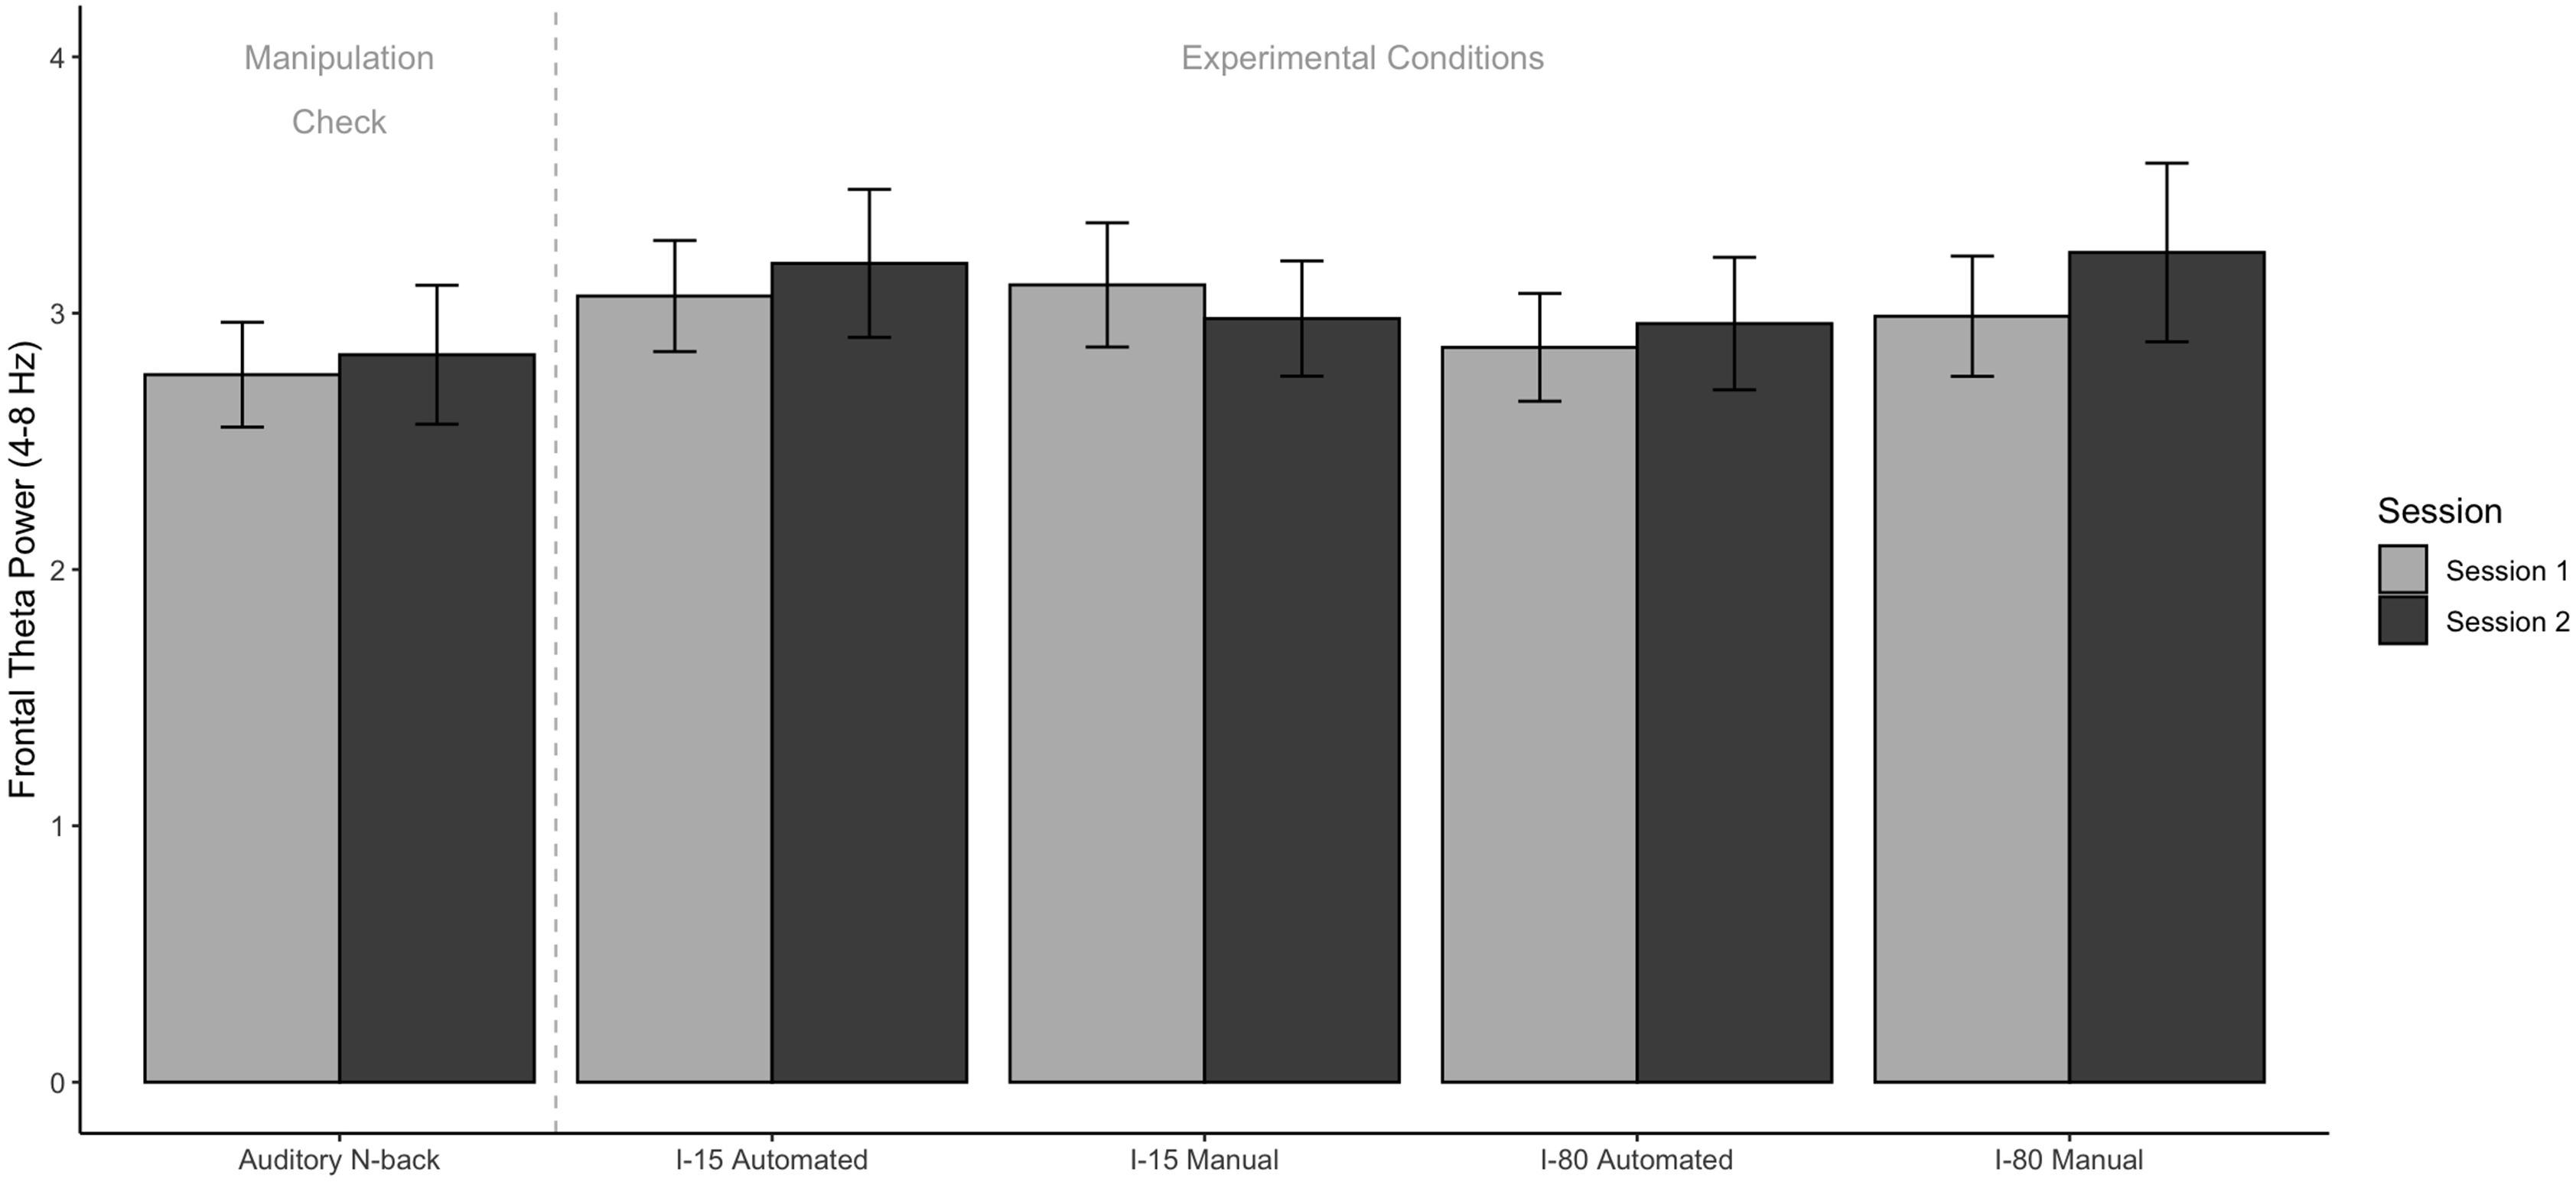
Parietal Alpha Power
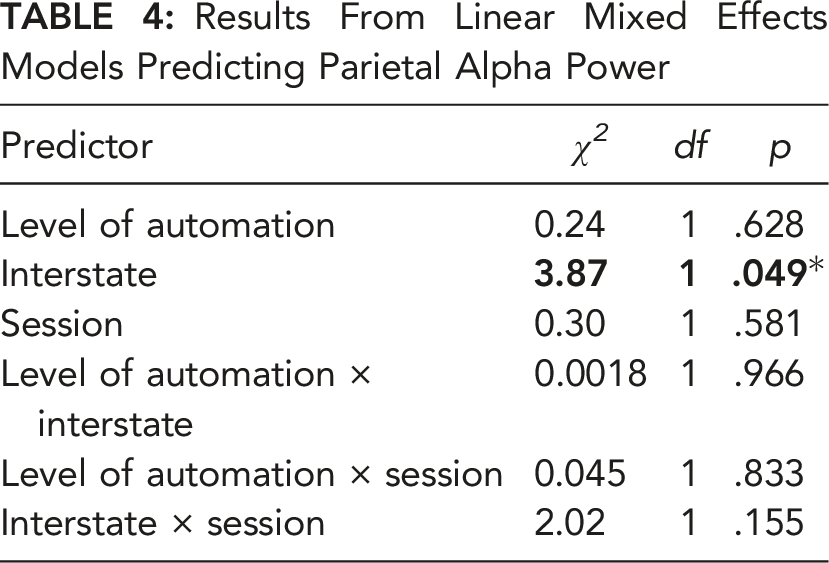
Figure 7 shows the mean parietal alpha power broken down by Condition and Session, and results of the linear mixed effects models predicting parietal alpha power are presented in Table 4. Mixed models revealed that there were no significant main effects of Level of Automation or Session, but there was a small significant main effect of Interstate on parietal alpha power such that there was lower parietal alpha power when driving on the more complex I-80 compared to I-15 (β = −.10, p = .0499, 95% CI [−.20, −.00042]). There were no significant interactions between any of the variables in the factorial design. Average parietal alpha power in the Eyes-closed manipulation check as well as each of the four experimental driving conditions at Session 1 and Session 2. Error bars represent standard error of the mean. Results From Linear Mixed Effects Models Predicting Parietal Alpha Power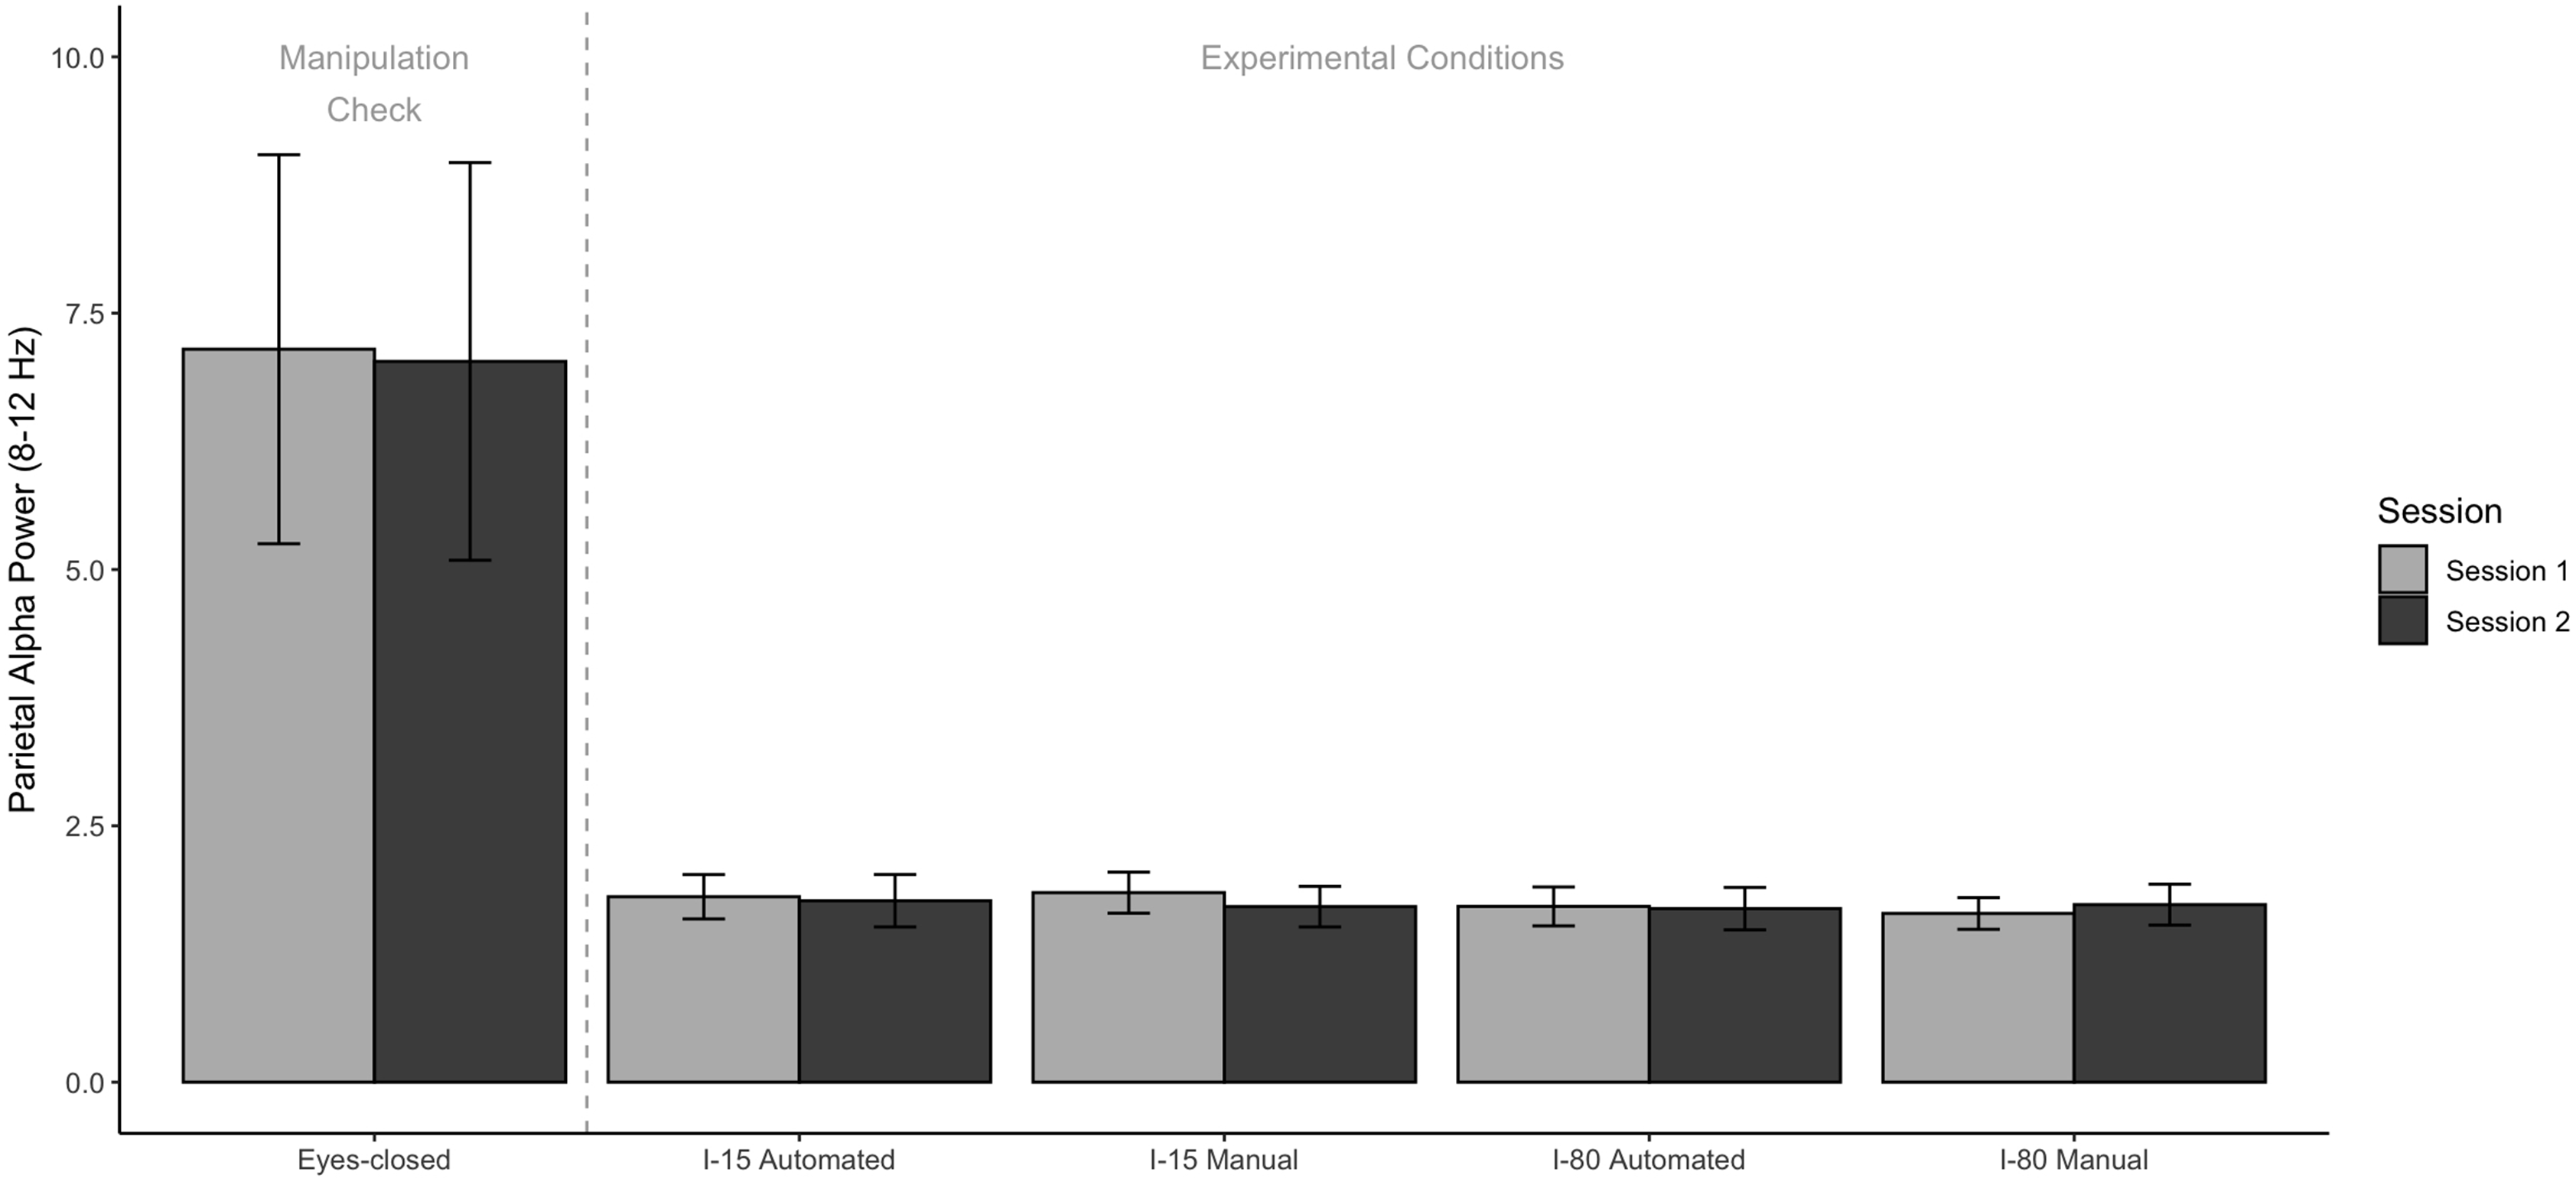
DISCUSSION
When driving a Level 2 partially automated vehicle, drivers must remain sufficiently engaged should the automation fail and human input be required (SAE, 2021). There is concern that the low workload associated with automated driving may lead to decreases in driver arousal and subsequent disengagement from the driving environment. The present study explored the effect of partial automation on driver workload and engagement and how these changed after drivers gained six-weeks of practice driving a partially automated vehicle. We used a multi-method, experimental approach to measure driver cognitive states during real, on-road driving from both a behavioral (DRT) and a neural (EEG) perspective. We systematically manipulated variables of interest in a 2 (Level of Automation: Level 0 and Level 2) × 2 (Interstate: I-15 and I-80) × 2 (Session: 1 and 2) factorial design. We tested participants in this experimental design before and after a familiarization period during which they practiced driving under partial automation every day for six weeks. We generally found significant effects with our behavioral measure (DRT RT) but not with our neurophysiological measures (frontal theta or parietal alpha power).
Our DRT manipulation check validated that RT derived from the DRT is sensitive to the workload associated with driving, as there was an increase in RT when participants were driving and responding to the DRT compared to responding to the DRT on its own in a parking lot. Additionally, RTs demonstrated sufficient discriminability to detect differences in driver workload associated with varying levels of automation, highway characteristics, and changes over time. In testing our first research question regarding the effect of partial automation on driver workload, we found a main effect of automation such that participants had slower RTs when driving in partially automated mode compared to manual mode, meaning drivers had fewer cognitive resources available to allocate to the secondary DRT task when driving under partial automation. This suggests that rather than decreasing driver workload as automation intends, driving under partial automation was associated with an increase in driver workload. This provides evidence against the concern for under-arousal associated with low workload during automation. Rather, supervisory control of the automation may, in fact, place greater workload on the driver compared to manual control since in the latter case, the driver is already actively participating in the control loop (Endsley, 2017a; Kim et al., 2023; Sheridan, 2012; Stapel et al., 2019). Furthermore, we found a significant main effect of Interstate such that driver workload was greater on the more complex I-80 compared to I-15, regardless of level of automation. I-80 is a more curvy, mountainous, cognitively demanding highway than I-15, which forced drivers to prioritize the primary driving task over the secondary DRT task, resulting in slower RTs to the DRT. Lastly, we found a main effect of Session on RT such that participants responded faster to the DRT at Session 2 compared to Session 1, suggesting either a DRT or an automation practice effect that is clarified by the following interaction results.
All two-way interactions were significant. Of particular interest in answering our third research question regarding the effect of practice on driver workload over time was the interaction between Level of Automation and Session, where we found that six weeks of practice with vehicle automation decreased driver workload over time. RTs showed a steeper decline (faster RTs) from Session 1 to Session 2 when driving in partially automated mode compared to manual mode. This suggests that practice with partial automation does, in fact, decrease driver workload over time—at least when workload is measured on a behavioral level via RTs to the DRT. Interestingly though, this was only the case when driving on I-15 and not I-80, meaning that this practice effect under partial automation is only realized when driving on a relatively simple highway with low complexity and therefore low demand. Rather, drivers seemingly remain at elevated levels of workload under partial automation when their driving environment demands such. A similar finding was reported by Stapel et al. (2019), who found that monitoring a Level 2 vehicle is associated with higher workload than manual driving (as measured by the DRT), particularly in complex driving environments. This has also been demonstrated by Kim and colleagues (2023), who found similar patterns of increased self-reported workload associated with partial automation in an on-road study. These findings, in conjunction with the present analysis, highlight the importance of including various highway characteristics and traffic configurations in study designs, which is not common in the literature and can be considered a novel contribution of the present study.
Our EEG metrics were less insightful than our behavioral DRT metrics. The frontal theta and parietal alpha manipulation checks validated that these metrics are sensitive to the demands (both cognitive and visual) associated with driving. However, they were less sensitive to discriminating differences between driving conditions. Unlike the behavioral results, our neurophysiological results did not show significant effects of Level of Automation or Session. There was a main effect of Interstate on parietal alpha power such that participants were slightly more visually engaged on I-80 compared to I-15, likely due to the increased demand associated with the complex driving environment of I-80. However, this effect was small and should be interpreted with caution. The general lack of frontal theta and parietal alpha effects across most of the experimental conditions replicate the results of McDonnell et al. (2021b).
Though the inclusion of the Interstate factor (comparing driving on the simpler I-15 to the more complex I-80) was exploratory and not the crux of our research questions, we did find that driver workload and engagement are modulated by driving environment, consistent with prior work (Stapel et al., 2019; Strayer et al., 2020). We found an increase in DRT RT and a slight decrease in parietal alpha power when participants drove on I-80, a more curved section of the interstate, as compared to the straighter driving environment on I-15. Interestingly, this pattern held for both Level 0 manual driving as well as Level 2 partially automated driving and was observed even after participants had six weeks of practice. This result has implications for future research in that it establishes the importance of including a variety of roadway conditions in the testing protocol, as the relationship between driver cognitive state and automation may be dependent on the specific demands of a given driving environment.
Future research may also extend the amount of practice provided to a participant. In the present study, we allowed participants six weeks of practice with the Level 2 vehicle and found significant effects of Session on DRT RT. It is possible that with more time and practice, there would be an even greater decrease in workload and engagement associated with partial automation.
One limitation of the current experimental protocol is that an experimenter was present in the vehicle during testing to monitor data acquisition, the quality of the neurophysiological recordings, and electrode impedances. It is possible that driver behavior would change in a more naturalistic setting without an experimenter present. Furthermore, there are aspects of the six-week familiarization period that were uncontrolled in the present study. While we did use in-vehicle camera recordings to ensure that participants drove the vehicle in partial automation mode daily on their work commute, we were unable to control for the length of those daily practice drives. For example, one participant may have had a 45-minute commute to work while another may have had a 60-minute commute. Therefore, there was likely slight variation in the amount of practice each participant had during the familiarization period.
Overall, this study highlights the methodological feasibility of collecting on-road behavioral and neurophysiological data across different driving environments and vehicles. Furthermore, the results combat some popular concerns that driving partially automated vehicles leads to low driver workload and engagement. This study demonstrates that even after extensive practice driving a Level 2 vehicle, participants remain relatively engaged with the driving task on highway conditions that demand close attention. These results are promising for the continued development of automated vehicles. Our study addresses a timely topic in human factors research and until vehicles are completely autonomous, we must continue to explore how humans interact with automated technology when roles are shared.
Footnotes
Acknowledgments
Support for this work was provided by AAA Foundation for Traffic Safety.
KEY POINTS
Some argue that Level 2 partially automated driving may lead to driver under-arousal and disengagement over time. Participants drove on real highways with partial automation both engaged and not engaged, at the start and end of six-weeks of practice driving the vehicle. Reaction time metrics showed that partially automated driving placed higher workload on drivers than manual driving. Driver workload decreased over time with practice, though only on simple highways with low demand. EEG theta and alpha metrics were not sensitive to differences in level of automation. Future research should include multiple highway characteristics in testing.