
Abstract
Objective
This research explores the effect of partial vehicle automation on neural indices of mental workload and visual engagement during on-road driving.
Background
There is concern that the introduction of automated technology in vehicles may lead to low driver stimulation and subsequent disengagement from the driving environment. Simulator-based studies have examined the effect of automation on a driver’s cognitive state, but it is unknown how the conclusions translate to on-road driving. Electroencephalographic (EEG) measures of frontal theta and parietal alpha can provide insight into a driver’s mental workload and visual engagement while driving under various conditions.
Method
EEG was recorded from 71 participants while driving on the roadway. We examined two age cohorts, on two different highway configurations, in four different vehicles, with partial vehicle automation both engaged and disengaged.
Results
Analysis of frontal theta and parietal alpha power revealed that there was no change in mental workload or visual engagement when driving manually compared with driving under partial vehicle automation.
Conclusion
Drivers new to the technology remained engaged with the driving environment when operating under partial vehicle automation. These findings suggest that the concern surrounding driver disengagement under vehicle automation may need to be tempered, at least for drivers new to the experience.
Application
These findings expand our understanding of the effects of partial vehicle automation on drivers’ cognitive states.
Keywords
Introduction
The introduction of automated technology in vehicles places new demands on drivers. The Society of Automotive Engineers (SAE) defined six categories of vehicle automation, ranging from Level-0 to Level-5 (SAE, 2016). Level-0 automation has no automated technology, and we refer to it in this study as operating a vehicle in manual mode. A Level-5 vehicle is fully sufficient on its own, without any input from a driver. Currently, Level-2 vehicles are publicly available to consumers and are increasingly common on the roadways. Level-2 vehicles, referred to in this study as partially automated vehicles, provide simultaneous latitudinal and longitudinal control under driver supervision. According to SAE guidelines, both manual and partially automated vehicles require the driver to remain engaged with the driving environment at all times (SAE, 2016).
In manual mode, the driver is in full control of the vehicle. They must be vigilant and respond to unexpected events in the environment while manually controlling the speed, following distance, and trajectory of the vehicle. However, in a partially automated vehicle, the role of the driver shifts from active controller to passive monitor. The driver must monitor the vehicle and driving environment for rare “edge cases” that may require them to take over manual control of the vehicle at a moment’s notice. Researchers have found that individuals are traditionally bad at monitoring tasks involving rare events (Wolfe et al., 2005), so this shift in attentional demand from active control to passive monitoring presents a potential safety concern.
It is unknown whether a driver will be able to maintain optimal levels of arousal while driving a partially automated vehicle. On the one hand, researchers have found that driving in a minimally demanding environment reduces attention to the roadway, whether it is through “zoning out” or an increased willingness to partake in distracting behavior such as cellphone use (Schroeter et al., 2015). Some argue that the introduction of partial automation in the vehicle further detaches the driver from the primary task of driving (Casner et al., 2016; Endsley & Kiris, 1995). On the other hand, some researchers argue that partial automation may improve attention while driving by decreasing the workload placed on the driver (Billings, 1991). It is an open question as to how the shift in the driver’s role from active controller to passive monitor might affect mental workload and attention while driving.
Electroencephalography (EEG) can be used to objectively assess a driver’s mental workload and visual engagement with the environment in real time (Lohani et al., 2019). EEG is a neurophysiological method that records neural activity from electrodes placed on the scalp. EEG is noninvasive, mobile, and allows for the direct measurement of neural activity (on the order of milliseconds) in response to the demands of the environment. The oscillatory activity that makes up the EEG signal can be decomposed into various frequency bands using a Fourier analysis (Cohen, 2014). These frequency bands (Delta ~0.5–4 Hz, Theta ~ 4–8 Hz, Alpha ~8–12 Hz, and Beta ~12–30 Hz) reflect different neurocognitive functions.
Most driving studies that utilize EEG assess fluctuations in the theta and alpha frequency bands derived from the EEG power spectrum (for review, see Borghini et al., 2014). Theta power in the frontal regions of the brain is generally studied as an index of cognitive workload, such that greater theta power reflects greater exertion of mental effort in response to task demands (Fairclough et al., 2005). Researchers have found that theta power increases with driving demand (Fairclough et al., 2005; Gevins & Smith, 2003) and with fatigue (Lal & Craig, 2002). Meanwhile, alpha power in parietal regions of the brain has shown to decrease during cognitively demanding tasks (Gevins & Smith, 2003), thus exhibiting an inverse relationship with frontal theta during exertion of mental effort. Because of this, parietal alpha power, like frontal theta power, is considered by many researchers to reflect dynamics of cognitive engagement while driving (Lohani et al., 2019). Additionally, some researchers propose that parietal alpha also serves as a mechanism of cortical suppression, particularly of visual cortices, such that parietal alpha power decreases when an individual is visually engaged with a task (Foxe & Snyder, 2011; Goldman et al., 2002). Therefore, alpha is also used to index visual attention such that greater alpha power at parietal cortical regions reflects less visual engagement with the environment and lower alpha power reflects more visual engagement (Foxe & Snyder, 2011). In line with this, parietal alpha power is greatest when an individual’s eyes are closed (Goldman et al., 2002). The interpretations of parietal alpha power as a neural marker of cognitive versus visual engagement are not mutually exclusive, as visual engagement and cognitive engagement often co-occur within the driving context. Furthermore, there is ongoing debate regarding the extent to which alpha power fluctuates with driving fatigue (Wascher et al., 2016). In studying the relationship between frontal theta and parietal alpha, some researchers argue that an increase in cognitive workload (denoted by an increase in frontal theta power) leads to an increase in visual engagement with the environment (denoted by a decrease in parietal alpha power; Mun et al., 2017).
Whereas EEG has been used in autonomous vehicle simulators (Borghini et al., 2014; Du et al., 2020; Lee & Yang, 2020; Park et al., 2018), the current study utilizes it in on-road driving (Lohani et al., 2019). Few, if any, studies have utilized EEG in this way to study the effects of vehicle automation on drivers’ cognitive states under real driving conditions. We measured frontal theta and parietal alpha power as indices of driver workload and visual engagement, respectively. We assessed the changes in these frequency bands while drivers operated both manual and partially automated vehicles. In order to maximize the generalizability of our findings, we tested two age cohorts (see recommendations from National Highway Traffic Safety Administration, 2013), on two different highway configurations, in four different partially automated vehicles. We hypothesized that if driving a partially automated vehicle leads to under-arousal and a decrease in engagement with the driving environment, then we would see a decrease in frontal theta power and an increase in parietal alpha power. However, if partial automation leads to greater arousal and engagement with the driving environment, then we would see an increase in frontal theta power and a decrease in parietal alpha power.
Methods
This research complied with the American Psychological Association Code of Ethics and was approved by the Institutional Review Board at the University of Utah (IRB_120183). Informed consent was obtained from each participant.
Participants
Participants (N = 71) were recruited via flyers. The young adult cohort consisted of 39 participants (13 females) aged 21–40 (M = 29.07, SD = 6.53). The middle-age adult cohort consisted of 32 participants (12 females) aged 41–64 (M = 52.2, SD = 6.37). We based our criteria for age cohorts on the National Highway Traffic Safety Administration (NHTSA) visual-manual guidelines for participant age demographics that should be included in vehicle testing (NHTSA, 2013).
Eligibility criteria consisted of having a valid U.S. driver’s license, no at-fault accidents or loss of consciousness in the past 2 years, no history of neurological disorders, and no experience with Level-2 partial automation technology (Lane Centering or Adaptive Cruise Control). Research staff confirmed clean driving records through the University of Utah’s Division of Risk Management. Prior to participation, participants completed an online defensive driver training course required by the Division of Risk Management and researchers verified their certificate of completion. Upon arriving at the lab, participants confirmed that they had at least 6 hr of sleep the night before the study and were not under the influence of alcohol (as verified with a BAC of 0.0 by a BACtrack breathalyzer).
Participants were compensated $20/hr. If a participant came back to test in more than one vehicle, they received bonus payment per visit—$10 for their second testing session, $15 for their third testing session, and $25 for their fourth testing session.
Equipment
EEG data were collected with the gel-based BIOPAC system (BIOPAC Systems, Inc) and NATUS Neurology Grass reusable electrodes (Ag/AgCl). Three passive electrodes were placed along midline sites—frontal (Fz), central (Cz), and parietal (Pz)—following the International 10–20 system (Jasper, 1958). We employed a three-electrode system to best control the quality of the EEG recordings (Lohani et al., 2019; Luck, 2014). The ground electrode was placed on the center of the forehead, and the reference electrode was placed on the right mastoid. Electrooculographic (EOG) activity from blinks was recorded by two electrodes placed above and below the right eye. Impedances were kept below 10 kΩ, as verified by BIOPAC’s EL-CHECK electrode impedance checker. Electrodes did not interfere with the participant’s field of view or range of motion while driving.
Four vehicles were used in testing: a 2018 Cadillac CT6, a 2019 Nissan Rogue, a 2019 Tesla Model 3, and a 2018 Volvo XC90. All four vehicles were equipped with Lane Centering and Adaptive Cruise Control, two features that, when combined, qualify as SAE Level-2 partial vehicle automation (SAE, 2016). Lane Centering refers to the vehicle’s ability to stay within the lane of travel, and Adaptive Cruise Control refers to the vehicle’s ability to adjust the speed of the vehicle while maintaining a preset following distance. While Lane Centering technology is on by default for all the vehicles included in this study, Adaptive Cruise Control must be activated by the driver at the start of driving. Therefore, at the beginning of each partial automation experimental condition, participants were instructed to set Adaptive Cruise Control at the legal speed limit on the relevant interstate as well as set the following distance to the maximal distance permitted by each vehicle. The 2018 Cadillac CT6 offers “Far,” “Medium,” and “Near” following distances and the distance between vehicles dynamically increases as driving speed increases. The 2019 Nissan Rogue offers “Long,” “Middle,” and “Short” following distances, with the example that when traveling at 60 mph with the “Long” option selected, the following distance is about 200 feet. The 2019 Tesla Model 3 offers following distances numbered 1–7, representing a time-based distance of how long it takes to reach the rear bumper of the vehicle ahead. Lastly, the 2018 Volvo XC90 offers following distances numbered 1–5, with 5 representing approximately 3 s to reach the rear bumper of the vehicle ahead. Again, participants were instructed to set the following distance to the maximum option offered in each vehicle, and Lane Centering and Adaptive Cruise Control were to remain activated for the whole condition.
Testing was conducted on two unique interstates in Salt Lake City, Utah. Both interstates are major corridors in the western United States. I-15 is a straight, high-trafficked interstate with four to five lanes in each direction separated by a median with a maximum speed limit of 70 mph. It runs predominantly North to South with an average annual daily travel of 175,000 vehicles during the period of our testing (Utah Department of Transportation, n.d.). I-80 is a slightly curvy, low-trafficked interstate with two to three lanes in each direction separated by a median with a maximum speed limit of 60 mph. It runs primarily East to West with an average annual daily travel of 19,000 vehicles during the period of our testing (Utah Department of Transportation, n.d.). During testing, participants were instructed to drive with the flow of traffic. Prior to conducting the study, researchers confirmed that these two driving routes were appropriate for the proper implementation of each vehicles’ Lane Centering and Adaptive Cruise Control capabilities.
Design
The study utilized a 2 (Age Cohort) × 2 (Level of Automation) × 2 (Interstate) × 4 (Vehicle) factorial design. Each participant completed testing in both Level-0 (manual) and Level-2 (partial) automation, on sections of I-15 and I-80, and in at least one of four vehicles. 48 participants (24 young adults and 24 middle-aged adults) tested in each vehicle for a total of 192 testing sessions. Some participants participated in multiple vehicles on different testing days. Seventeen participants tested in one vehicle, 11 participants tested in two vehicles, 19 participants tested in three vehicles, and 24 participants tested in all four vehicles. To account for any potential practice effects due to repeat testing, we included number of vehicles driven as a variable in all our statistical models.
Each participant completed one manipulation check and four experimental driving conditions. The manipulation check involved 4 min of eyes-closed EEG data collection while the vehicle was parked and was included for data quality control purposes. An increase in parietal alpha power when the eyes are closed is one of the most reliable effects in the EEG literature (Goldman et al., 2002). Therefore, we included this manipulation check to demonstrate that the spectral analysis pipeline was functioning properly by picking up what are known and reliable changes in the EEG signal. The four experimental conditions consisted of driving on I-15 for 20 min in manual mode and 20 min in partial automation, and on I-80 for 20 min in manual mode and 20 min in partial automation (Figure 1). The order of the experimental conditions was quasi-counterbalanced across participants with the constraint that one interstate was completed before the other began. For example, if a participant’s first experimental condition consisted of driving on I-15 in partial automation, they completed I-15 in manual mode next before traveling to I-80. The next participant would then complete I-80 in manual mode first, followed by I-80 in partial automation, and then followed by the two I-15 conditions.
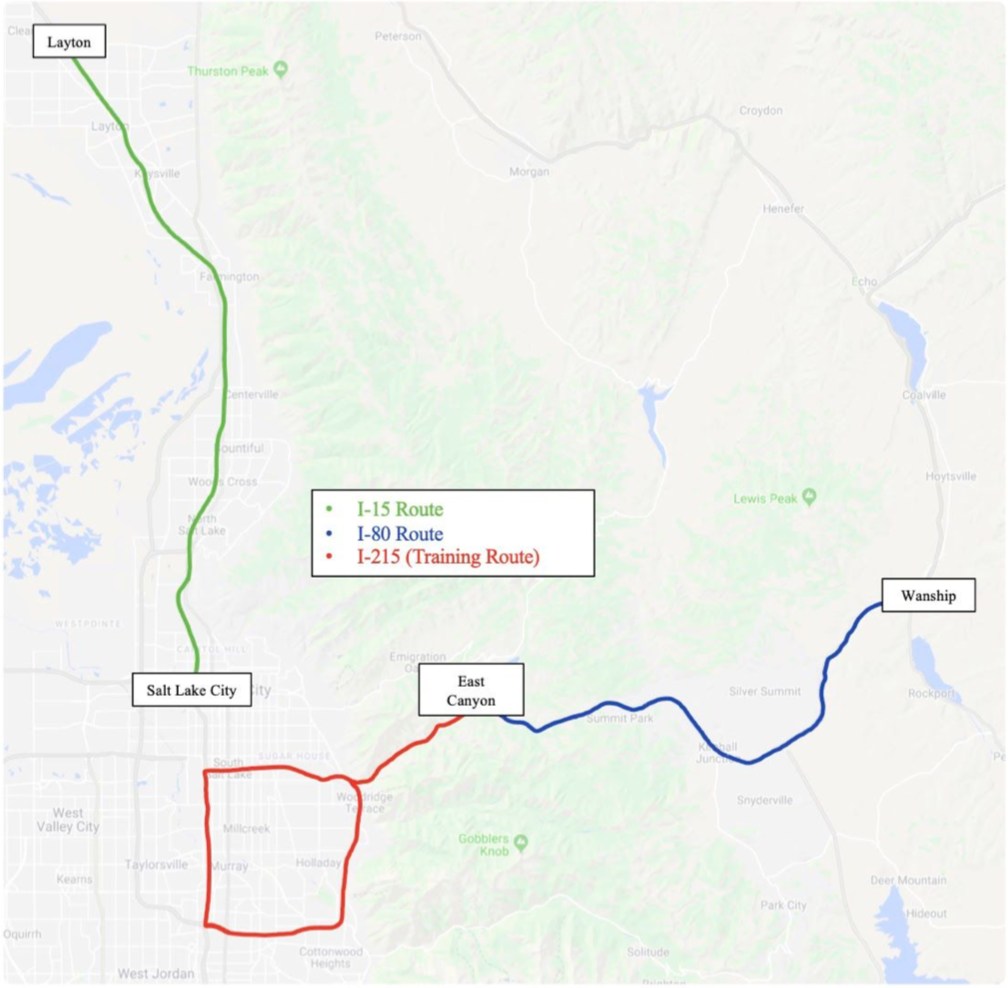
Map of driving routes.
Participant Training
In order to participate in the experimental protocol, participants were first required to complete a total of 1.5 hr of vehicle training approved by the IRB (IRB_120183). Prior to arriving at the lab, participants watched a 30-min instructional video explaining the automated features of the vehicle they would be driving. An additional 30 min was spent on the day of testing (prior to driving) familiarizing the participant with the vehicle (i.e., adjusting seats and mirrors, locating relevant sensors, and reviewing how to activate and deactivate Adaptive Cruise Control and Lane Centering in that vehicle). During this familiarization period, participants were encouraged to ask any questions they might have about the vehicle or the partially automated technology.
Participants were then required to complete test driving on a training route (Figure 1) for up to 30 min. During the test drive, participants were instructed to practice engaging and disengaging Adaptive Cruise Control and Lane Centering based on the vehicle they were driving, all while traveling with the flow of traffic. Again, participants were encouraged to ask any questions they might have about the technology at this point. If both the researcher and the participant felt comfortable with the participant’s ability to interact with the partial automation system, the experimental portion of the study began. If the participant completed the training and either the participant or the researcher did not feel comfortable in the participant’s ability to interact with the partially automated features, the participant was given the opportunity to drive the training route again. If after the second drive of the training route, the participant or the researcher still did not feel comfortable, the researcher drove the vehicle back to the lab and the study ended at no negative consequence to the participant or their rate of compensation. Participants (N = 1) that opted not to begin the experimental protocol were not included in the analyses.
Procedure
Upon arriving to the lab, participants signed the consent document and were set up on the EEG system. The researcher then walked the participant to the testing vehicle, where they familiarized themselves with the vehicle settings and technology. Before driving, the participant closed their eyes for 4 min while EEG was recorded. This served as the manipulation check of parietal alpha activity. Next, test-driving along the training route began, in which participants drove the vehicle in both manual and partial automation mode and could ask the researcher any questions about the vehicle’s technology.
Once the participant indicated that they were comfortable with the partially automated technology, the experiment began. Each participant drove each of the four experimental driving conditions in a quasi-counterbalanced order (I-15 manual, I-15 partial automation, I-80 manual, and I-80 partial automation). Participants were instructed to drive with the flow of traffic and to never exceed the designated speed limit (70 mph on I-15 and 60 mph on I-80). There were no systematic differences in driving speed between manual and partially automated driving. Data recording began when the vehicle reached the speed limit, had passed any construction or road debris, and the participant felt ready and safe to begin. All data were collected during safe and normal driving conditions and discontinued through construction zones and other road hazards. Conditions in which data collection was interrupted or discontinued were not included in the analyses. Electrode impedances were checked between each condition to ensure that the electrodes were still in their proper place.
Data Recording and Analysis
EEG data were recorded from two wireless transmitters, amplified by the BioNomadix Smart Center at a 2 kHz sampling rate, and observed through AcqKnowledge (Version 5.0). The data were cleaned and processed offline in MATLAB and the EEGLAB toolbox (Delorme & Makeig, 2004). Data were downsampled to 250 Hz, bandpass filtered from 0.1Hz to 30 Hz, and the continuous data were epoched into 1-s intervals using a Hanning window. Artifacts created by blinks and eye movements were corrected for using Gratton’s regression-based eye-movement correction procedure (EMCP; Gratton et al., 1983). To account for any additional artifacts that were not detected and corrected with EMCP, subsequent artifact rejection was performed using a moving window to reject epochs containing flatlines or peak-to-peak activity greater than 200μV (Lopez-Calderon & Luck, 2014). The average percent of epochs lost due to blinks and eye movements after correction was 1.16% across all four experimental conditions (I-15 partial automation: 1.49%; I-15 manual: 1.03%; I-80 partial automation: 1.03%; I-80 manual: 1.12%). A Fast Fourier Transform (Cohen, 2014) was then used to convert the artifact-free data from the time domain to the frequency domain, and the average power at each frequency from 1 to 30 Hz was extracted for each participant in each level of automation, interstate, and vehicle.
Data were analyzed using linear mixed-effect models in order to account for sources of non-independence (i.e., repeated measures within a person) and to allow for any missing data (e.g., if a participant only drove in three of the four vehicles). All analyses were conducted in R version 1.1.456 (R Core Team, 2020), and linear mixed-effect models were run using the lmer function in R’s lme4 package (Bates et al., 2015) with frontal theta power and parietal alpha power entered independently as the outcome variables. Each model used a random intercept for each Subject, a random slope for Number of Vehicles Driven, and we ran separate models for each of the variables in the 2 × 2 × 2 × 4 factorial design (Level of Automation, Interstate, Age Cohort, and Vehicle). These variables were included as fixed effects in order to understand the association between each of the variables and the outcome measure. The number of vehicles each participant had driven was included as a random effect in order to allow the association between this variable and the outcome measure to vary by individual. We also explored the interaction between Level of Automation and each of the other variables in the factorial design (Interstate, Age Cohort, and Vehicle). Likelihood ratio tests, calculated using the anova function in the stats package (R Core Team, 2020), were used to test the significance of all fixed effects. These tests generated a chi-squared statistic comparing the model with the variable of interest (Level of Automation, Interstate, Age Cohort, or Vehicle) entered as a fixed effect and Subject and Number of Vehicles Driven as random effects, to a model with the fixed effect removed. For significant effects, effect sizes were calculated as Cohen’s d. For null effects, we calculated a Bayes factor for linear mixed models to determine the strength of the evidence for the null hypothesis over the alternative hypothesis (Kruschke, 2011). While the p value of the mixed model allows for the disproving of the alternative hypothesis, the Bayes factor shows if the data favors the null hypothesis over the alternative hypothesis (Quintana & Williams, 2018). To calculate the Bayes factor, we used the bayesfactor_models function in R’s bayestestR package (Makowski et al., 2019). This function divides a full model with all the variables included (Level of Automation, Interstate, Age, Vehicle, and the random effects of Subject and Number of Vehicles Driven) by a restricted model with the variable of interest removed. We used the classification scheme for Bayes factors presented by Lee and Wagenmakers (2014) to interpret the results. According to this classification scheme, a Bayes factor less than 1 suggests that the evidence favors the null hypothesis (ranging from anecdotal evidence [0.33 < BF < 1] to extreme evidence [BF <.01]), whereas a Bayes factor greater than 1 suggests that the evidence favors the alternative hypothesis (ranging from anecdotal evidence [1 < BF < 3] to extreme evidence [BF >100]).
Results
Prior to data processing and analysis, all EEG files were manually inspected offline by a trained researcher who was blind to the condition in order to ensure acceptable data quality. Individual files were lost due to electrodes falling off while driving, the interruption or discontinuation of data collection due to roadway hazards, or human error in data collection. The use of linear mixed effect models allowed for any missing data.
Frontal theta is defined as the average power in the theta band between 4 and 8 Hz at electrode Fz. The final dataset used in the frontal theta analysis consisted of 168 I-15 manual files, 167 I-15 partial automation files, 172 I-80 manual files, and 171 I-80 partial automation files. Parietal alpha is defined as the average power in the alpha band between 8 and 12 Hz at electrode Pz. The final dataset used in the parietal alpha analysis consisted of 183 eyes-closed files, 168 I-15 manual files, 169 I-15 partial automation files, 173 I-80 manual files, and 175 I-80 partial automation files.
The plots of the power at each frequency (1–30 Hz) for each condition can be seen in Figure 2. The red line represents the eyes-closed manipulation check, in which the alpha bump is the largest between 8 and 12 Hz. The blue and black lines (solid and dotted) represent the four experimental driving conditions (I-15 manual driving, I-15 partial automation, I-80 manual driving, I-80 partial automation).
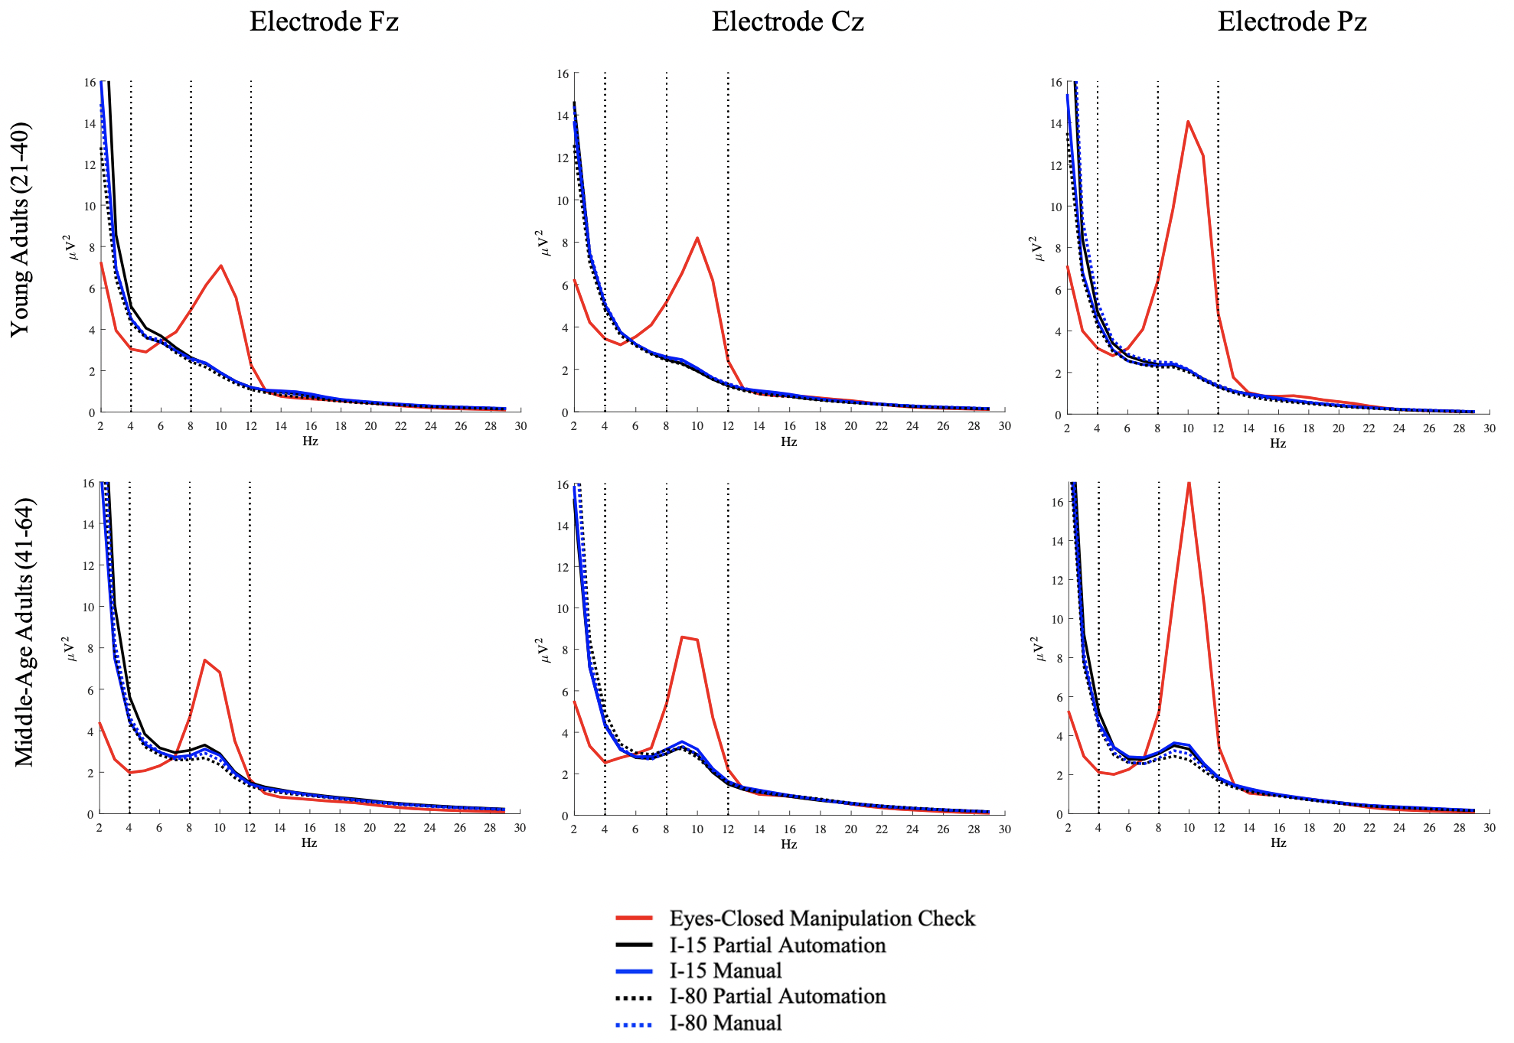
Spectral curves. Spectral curves of the power at each frequency for young and middle-aged adults. Frontal theta power is observed between 4 and 8 Hz, and parietal alpha power is observed between 8 and 12 Hz. See article online for color figure.
Manipulation Check for Parietal Alpha
Figure 3 shows the anticipated difference in parietal alpha power between the eyes-closed condition and driving conditions (averaged across the four experimental driving conditions). Collapsed across all participants, the mean parietal alpha power while driving was 2.34 μV2/Hz (SD = 1.6, SE = .06) and during the eyes-closed manipulation check was 9.48 μV2/Hz (SD = 7.55, SE = .56). This increase in parietal alpha power when the eyes are closed is one of the strongest known EEG effects, thus demonstrating proper functioning of the analysis pipeline. This result is also consistent with the findings of Goldman et al. (2002) such that an increase in parietal alpha is an index for cortical inactivity, particularly in visual cortices, thus validating the role of parietal alpha activity in visual engagement.
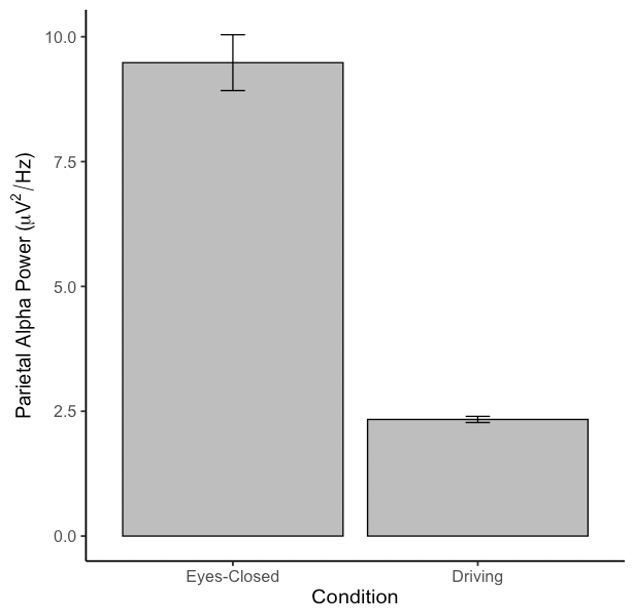
Manipulation check. Error bars reflect the standard error of the mean.
Level of Automation
We first compared the effects of manual driving and partially automated driving on frontal theta and parietal alpha power. This comparison is the crux of our research question regarding the effects of automation on cognitive states. The mean frontal theta and parietal alpha power for the two levels of automation can be seen in Figure 4.
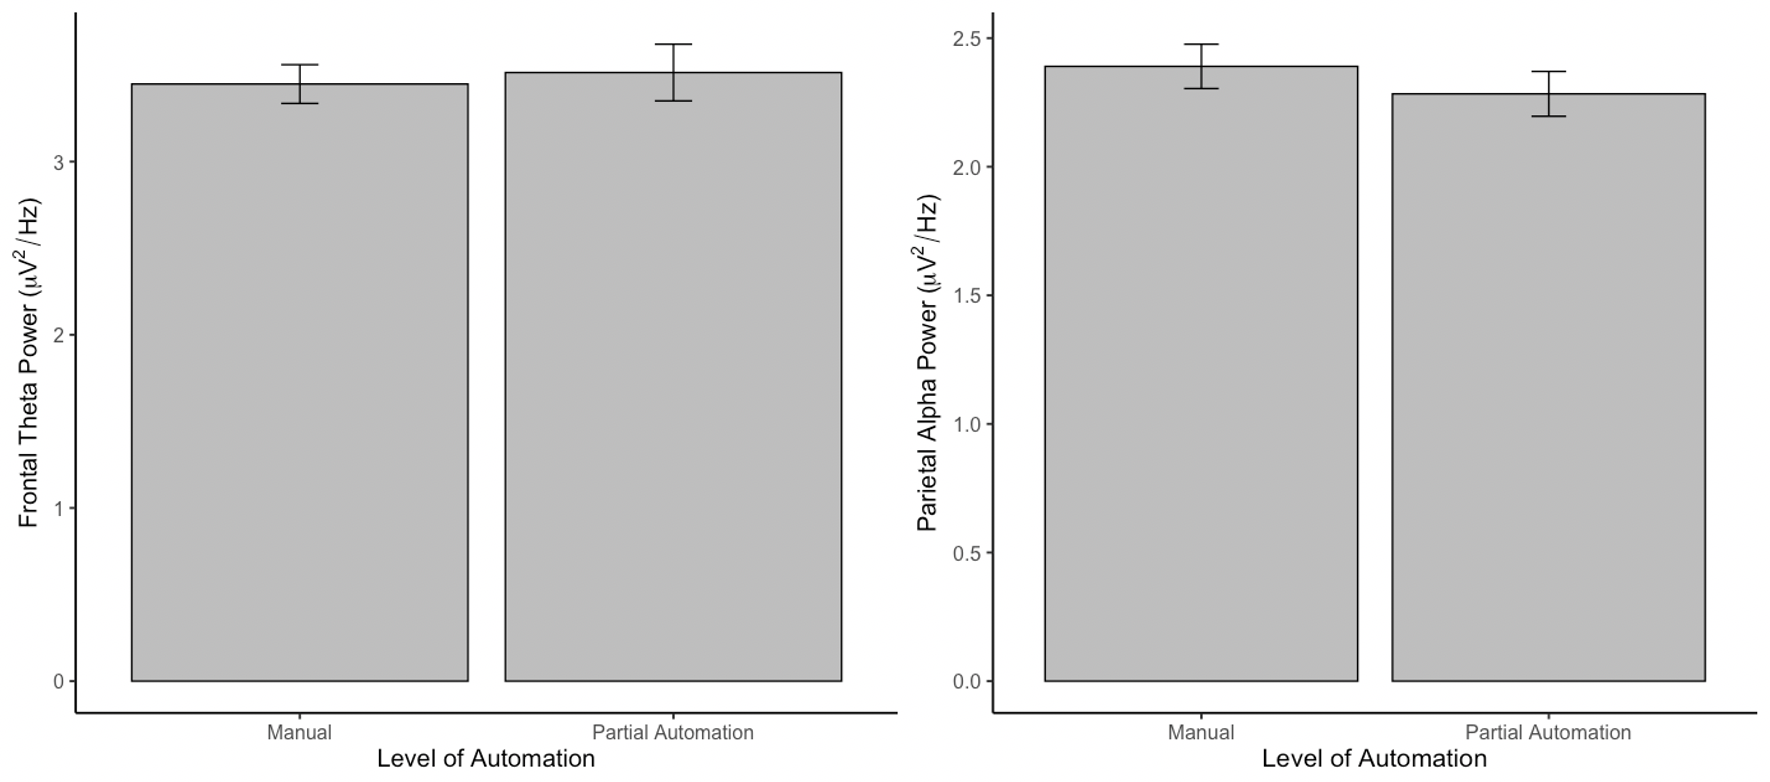
Level of automation. Mean frontal theta power (4–8 Hz) at electrode Fz (left) and parietal alpha power (8–12 Hz) at electrode Pz (right) during manual driving and partially automated driving. Error bars reflect the standard error of the mean.
Null effect of Level of Automation on frontal theta power
The mean frontal theta power during manual driving was 3.45 μV2/Hz (SD = 2.12, SE = .11) and during partially automated driving was 3.51 μV2/Hz (SD = 3.08, SE = .16). To test the effect of Level of Automation on frontal theta power, we entered Level of Automation into the mixed model as a fixed effect predicting frontal theta power. We then compared this model with the model without Level of Automation using a Likelihood Ratio Test and found no omnibus effect of Level of Automation on frontal theta power (χ2(1)=.20, p = .651). To determine the meaningfulness of this null effect, we calculated a Bayes factor by dividing the full model (with the fixed effects of Level of Automation, Interstate, Age Cohort, and Vehicle and the random effects of Subject and Number of Vehicles Driven) by the restricted model (with Level of Automation removed). The resulting Bayes factor was 0.02, which provides very strong evidence in favor of the null effect (Lee & Wagenmakers, 2014). This suggests that when collapsed across all participants, age cohorts, vehicles, and interstates, there is no difference in frontal theta power when manually driving compared with partially automated driving.
Null effect of Level of Automation on parietal alpha power
The mean parietal alpha power during manual driving was 2.39 μV2/Hz (SD = 1.59, SE = .09) and during partially automated driving was 2.28 μV2/Hz (SD = 1.62, SE = .09). To test the effect of Level of Automation on parietal alpha power, we entered Level of Automation into the mixed model as a fixed effect predicting parietal alpha power. We then compared this model with the model without Level of Automation using a Likelihood Ratio Test and found no omnibus effect of Level of Automation on parietal alpha power (χ2(1) = .78, p = .379). The Bayes factor analysis resulted in a Bayes factor of 0.008, which represents extreme evidence for the null hypothesis (Lee & Wagenmakers, 2014). This suggests that when collapsed across all participants, age cohorts, vehicles, and interstates, there is no difference in parietal alpha power during manual driving compared with partially automated driving.
Interstate
We then explored the main effect of Interstate on frontal theta and parietal alpha power. The mean frontal theta and parietal alpha power on the two interstates can be seen in Figure 5.
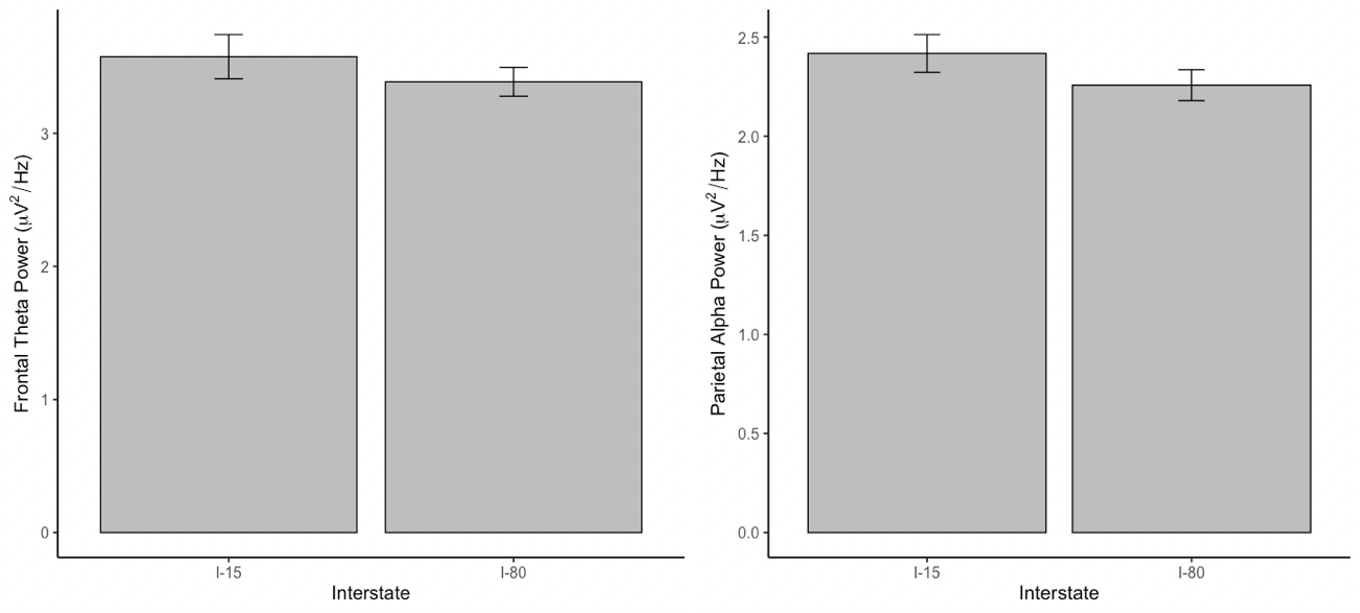
Interstate. Mean frontal theta power (4–8 Hz) at electrode Fz (left) and parietal alpha power (8–12 Hz) at electrode Pz (right) on I-15 compared with I-80. Error bars reflect the standard error of the mean.
Null effect of Interstate on frontal theta power
The mean frontal theta power on I-15 was 3.58 μV2/Hz (SD = 3.13, SE = .17), and the mean frontal theta power on I-80 was 3.39 μV2/Hz (SD = 2.05, SE = .11). There was no omnibus effect of Interstate on frontal theta power (χ2(1) = 1.70, p = .192). The Bayes factor was 0.03, which provides strong evidence for the null effect (Lee & Wagenmakers, 2014). This suggests that when collapsed across all participants, age cohorts, vehicles, and levels of automation, there was no difference in frontal theta power on I-15 compared with I-80. However, there was a significant interaction between Interstate and Level of Automation when predicting frontal theta power (χ2(1) = 4.08, p = .043). To interpret this interaction, we calculated the simple slopes for the association between Level of Automation and frontal theta power on both I-15 and I-80 and their corresponding confidence intervals. While neither the association between Level of Automation and frontal theta power on I-15 (simple slope estimate = .180, 95% CI [−.02, 0.38]) nor the association between Level of Automation and frontal theta power on I-80 (simple slope estimate = −.11, 95% CI [−.32, 0.09] were independently significant, the difference between the slopes was significantly different (contrast estimate = .291, p = .044).
Significant main effect of Interstate on parietal alpha power
The mean parietal alpha power on I-15 was 2.42 μV2/Hz (SD = 1.75, SE = .1), and the mean parietal alpha power on I-80 was 2.26 μV2/Hz (SD = 1.45, SE = .08). There was a significant omnibus effect of Interstate on parietal alpha power (χ2(1) = 8.00, p = .005). Specifically, there was significantly lower parietal alpha power on I-80 compared with I-15 (β = −0.16, p = .005, 95% CI [-0.26,–.05], d = −0.10) when collapsed across all participants, age cohorts, levels of automation, and vehicles, though the effect size was small. Lastly, there was no interaction between Interstate and Level of Automation when predicting parietal alpha power (χ2(1) = 1.54, p = .214).
Age Cohort
Next, we explored the main effect of Age Cohort on frontal theta and parietal alpha power. The mean frontal theta and parietal alpha power in the two age cohorts can be seen in Figure 6.
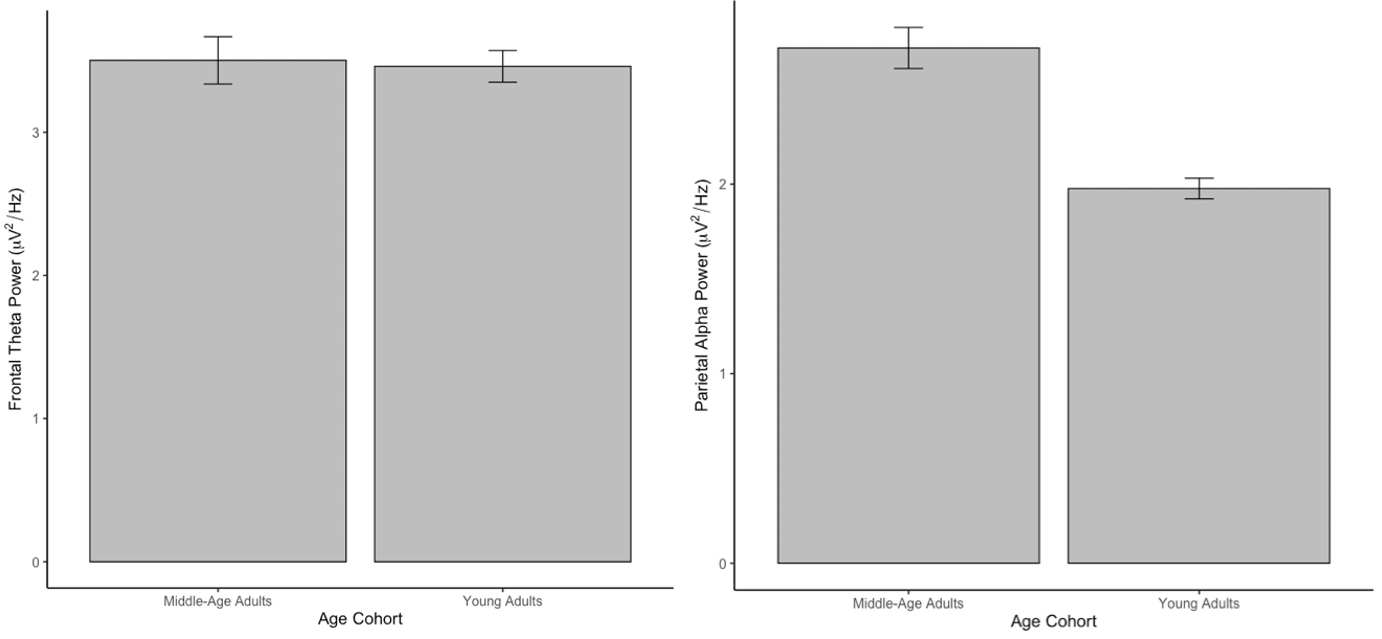
Age cohort. Note. Mean frontal theta power at electrode fz (left) and parietal alpha power at electrode Pz (right) in middle-aged adults compared with young adults. Error bars reflect the standard error of the mean.
Null effect of Age Cohort on frontal theta power
The mean frontal theta power of the young adult cohort was 3.46 μV2/Hz (SD = 2.10, SE = .11), and of the middle-age adult cohort was 3.50 μV2/Hz (SD = 3.1, SE = .17). There was no omnibus effect of Age Cohort on frontal theta power (χ2(1) = .29, p = .591). The Bayes factor was 0.05, which provides strong evidence for the null effect (Lee & Wagenmakers, 2014). This suggests that when collapsed across all participants, levels of automation, vehicles, and interstates, there is no difference in frontal theta power in middle-aged adults compared with young adults while driving. There was no interaction between Age Cohort and Level of Automation predicting frontal theta power (χ2(1) = .01, p = .922).
Null effect of Age Cohort on parietal alpha power
The mean parietal alpha power of the young adult cohort was 1.98 μV2/Hz (SD = 1.03, SE = .05) and of the middle-age adult cohort was 2.72 μV2/Hz (SD = 1.98, SE = .11). There was no omnibus effect of Age Cohort on parietal alpha power (χ2(1) = 2.23, p = .136). The Bayes factor was 0.09, which provides strong evidence for the null effect (Lee & Wagenmakers, 2014). This suggests that when collapsed across all participants, levels of automation, vehicles, and interstates, there is no difference in parietal alpha power in middle-aged adults compared with young adults while driving. Lastly, there was no interaction between Age Cohort and Level of Automation predicting parietal alpha power (χ2(1) = .0004, p = .985).
Exploratory analysis: Age as a continuous variable
We based our criteria for the age cohorts on the NHTSA guidelines for participant demographics recommended for inclusion in vehicle testing (NHTSA, 2013). While the analyses just presented treated Age Cohort as a dummy coded categorical variable (young versus middle-aged adults), we were curious to see if there would be an effect of age on frontal theta and parietal alpha power when treating age as a continuous variable. When age was coded as a mean-centered continuous variable from 21 to 64, there was still no effect of age on frontal theta (χ2(1) = .33, p = .565) or parietal alpha power (χ2(1) = .55, p = .458).
Vehicle
Lastly, we explored the main effect of Vehicle on frontal theta and parietal alpha power. The mean frontal theta and parietal alpha power in each vehicle can be seen in Figure 7.
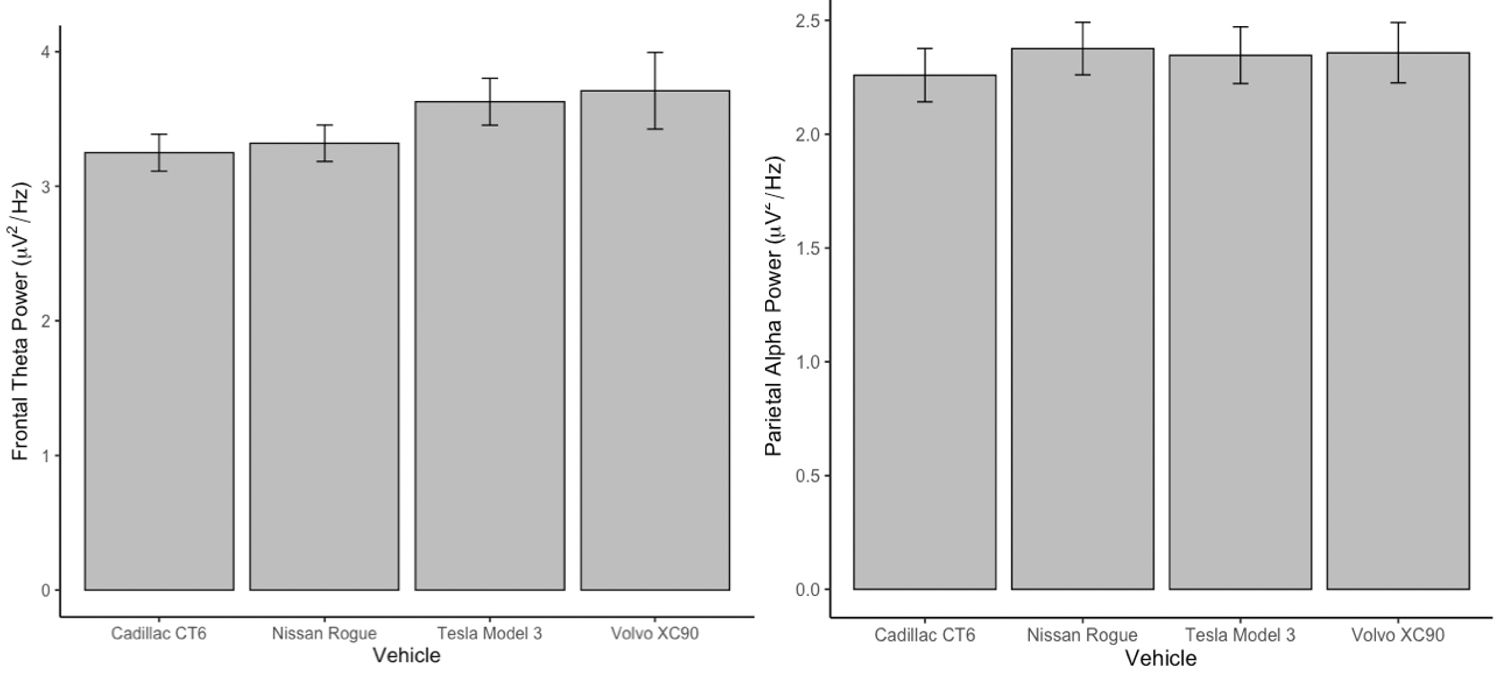
Vehicle. Mean frontal theta power (4–8 Hz) at electrode Fz (left) and parietal alpha power (8–12 Hz) at electrode Pz (right) in each of the four vehicles used in testing. Error bars reflect the standard error of the mean.
Significant effects of Vehicle on frontal theta power
The mean frontal theta power in the Cadillac CT6 was 3.25 μV2/Hz (SD = 1.78, SE = .14), in the Nissan Rogue was 3.32 μV2/Hz (SD = 1.83, SE = .14), in the Tesla Model 3 was 3.63 μV2/Hz (SD = 2.29, SE = .17), and in the Volvo XC90 was 3.71 μV2/Hz (SD = 3.92, SE = .29). When collapsed across the two levels of automation, age cohorts and interstates, there was a significant omnibus effect of Vehicle on frontal theta power (χ2(3) = 7.85, p = .049). Specifically, there was significantly lower frontal theta power in the Nissan Rogue compared with both the Tesla Model 3 (β = −0.61, p = .012, 95% CI −1.08, –.13], d = −0.23) and the Volvo XC90 (β = −0.49, p = .023, 95% CI −0.91, –.07], d = −0.19), though the effect sizes were small. There was no interaction between Vehicle and Level of Automation predicting frontal theta power (χ2(3) = 4.34, p = .227).
Null effects of Vehicle on parietal alpha power
The mean parietal alpha power in the Cadillac CT6 was 2.26 μV2/Hz (SD = 1.5, SE = .12), in the Nissan Rogue was 2.38 μV2/Hz (SD = 1.54, SE = .12), in the Tesla Model 3 was 2.35 μV2/Hz (SD = 1.62, SE = .12), and in the Volvo XC90 was 2.36 μV2/Hz (SD = 1.76, SE = .13). When collapsed across the two levels of automation, age cohorts, and interstates, there was no omnibus effect of Vehicle on parietal alpha power (χ2(3) = 4.81, p = .186), nor were there significant differences between any two vehicles. The Bayes factor analysis resulted in a Bayes factor of 0.000004, which represents extreme evidence for the null hypothesis (Lee & Wagenmakers, 2014). Lastly, there was no interaction between Vehicle and Level of Automation predicting parietal alpha power (χ2(3) = 7.52, p = .057).
Exploratory Analysis: Duration of Driving
While we had no a priori hypotheses regarding how duration of driving may affect the neurophysiology of the driver, we acknowledge that this factor may impact frontal theta or parietal alpha power due to either loss of vigilance or growing comfortability over the course of the 20-min drive. Therefore, we conducted an exploratory analysis in which we divided each drive into two, 10-min halves and added a categorical predictor of “half of driving” as a random effect in our linear mixed-effect models. Adding this as a random effect in the models did not significantly influence the observed null effects level of automation on frontal theta (χ2(1) = .706, p = .401) or parietal alpha power (χ2(1) = 1.26, p = .261), nor did it influence the observed null effects of age on frontal theta (χ2(1) = .03, p = .860) or parietal alpha power (χ2(1) = .12, p = .733). Additionally, adding duration of driving as a random effect in the models did not change the observed null effect of interstate on frontal theta power (χ2(1) = 3.41, p = .065) or the already observed significant effect of interstate on parietal alpha power (χ2(1) = 16.26, p < .001). Lastly, the significant omnibus effect of vehicle on frontal theta power remained (χ2(3) = 14.06, p = .003), and the null effect of vehicle on parietal alpha power remained unchanged (χ2(1) = 4.78, p = .188).
Discussion
When manually driving, the driver controls the vehicle’s speed, lane positioning, and following distance. However, with the introduction of partial vehicle automation, the driver’s role shifts from active controlling to passive monitoring. Nevertheless, the driver is expected to maintain awareness of the driving environment and be able to manually take control of the vehicle should a problem arise. There is an open question regarding how the shift in the driver’s role from active controller to passive monitor affects various cognitive processes. Despite concerns that passive monitoring may lead to under-arousal and disengagement from the driving environment, our data suggest that driving a partially automated vehicle does not, in fact, significantly change mental workload or visual engagement with the environment for drivers new to the technology. These findings are consistent with SAE recommendations that a driver should remain engaged with the driving task and environment when driving a partially automated vehicle (SAE, 2016).
Our study measured changes in frontal theta as a neural index of cognitive workload while driving under manual and partial vehicle automation (Borghini et al., 2014). Because partial automation removes much of the demand placed on the driver to maintain vehicle speed and position, there has been conjecture that partial automation would result in a decrease in driver workload that may lead to under-arousal and fatigue (Casner et al., 2016; Endsley & Kiris, 1995). However, our analysis of frontal theta found no difference in workload when driving in manual compared with partial automation mode.
We also explored changes in parietal alpha as a neural index of visual engagement while driving (Foxe & Snyder, 2011). It was hypothesized that if driving under partial automation leads to under-arousal and fatigue, we would see an increase in parietal alpha. Again, we found no differences in parietal alpha when driving in manual compared with partial automation mode, suggesting that visual engagement was equivalent in the two driving conditions.
Understanding the null effects is particularly important in this study. Null effects can arise from either low statistical power resulting in the inability to detect a real effect or can simply be due to the true absence of an effect. The calculation of Bayes factors in this study allowed us to assess the strength of our null effects and interpret how meaningful the lack of differences between manual and partially automated driving are. Our analyses provided strong to extreme evidence for the null hypotheses according to the classification of Bayes factors defined by Lee and Wagenmakers (2014), meaning that our nonsignificant effects of manual compared with automated driving on mental workload and engagement were due to lack of an effect rather than weak evidence for the alternative hypotheses or low statistical power. These null findings attributed to the true lack of a real effect are both novel and theoretically meaningful in that the speculation that drivers “zone out” during partial vehicle automation may not actually be grounded in physiological evidence and therefore may need to be tempered. These results should be expanded upon in future research.
Beyond the manual versus partially automated driving contrast, we also explored the main effects of the remaining variables in the factorial design (Interstate, Age Cohort, and Vehicle). We found a significant decrease in parietal alpha power on I-80 (the curvy, rural interstate) regardless of whether the driver was in manual or partially automated mode. We believe that this decrease in parietal alpha power indicates an increase in visual engagement with the environment due to more demanding driving conditions. On this interstate, participants were required to ensure that the vehicle maintained its position in the center of the lane, all while climbing a curved highway. In contrast to the familiar, straight trajectory of I-15, the data indicate that I-80 demanded more visual attention to the driving environment. We also found a significant interaction between Interstate and Level of Automation on frontal theta power such that the association between Level of Automation and frontal theta power was significantly different on I-15 compared with on I-80, although the simple slopes of these associations themselves were not statistically significant. This suggests that traffic configurations and roadway demand of various interstates may affect drivers’ mental workload differently under manual compared with partially automated driving. Future research could further explore this idea by manipulating roadway characteristics to identify which aspects of a roadway most heavily influence changes in driver workload.
Additionally, we found that when controlling for individual differences in neural activity with mixed models, there was no effect of Age Cohort (or Age as a continuous variable) on frontal theta and parietal alpha power. This suggests that the cognitive effort exerted in response to changing task demands was equivalent for both age cohorts.
Finally, we found a significant effect of the specific vehicle driven on frontal theta power, such that there are small differences in frontal theta power between vehicles. Specifically, we found significantly less frontal theta power in the Nissan Rogue compared with the Tesla Model 3 and the Volvo XC90. It is possible that certain characteristics of the vehicle interfaces and technologies available in the Tesla and Volvo place higher workload on the driver, reflected by greater frontal theta power during the driving of these vehicles compared with the Nissan or Cadillac. However, these differences were small, and this study was not designed to assess differences in demand characteristics of the specific vehicles; therefore, in-depth interpretation of these findings is outside the scope of this paper and likely warrant replication before drawing firm conclusions.
We believe the results of this study offer significant methodological and theoretical contributions to the vehicle automation literature. For one, Lohani et al. (2019) propose that psychophysiological measures can, and should, be used to assess driver cognitive states during real-world driving. While the implementation of such experimental methods is often quite involved, we demonstrate the feasibility of collecting clean EEG data under real-driving conditions rather than the often-studied simulated ones. Because humans are not always accurate in their judgments of their cognitive states (Schmidt et al., 2009), we believe utilizing these methods allows for a more objective assessment of cognitive state changes during partial vehicle automation. Theoretically, our results suggest that the safety concerns surrounding driver disengagement during partial vehicle automation may not be grounded in psychopsychological evidence. Future research should seek to replicate and expand upon these findings.
Limitations and Future Directions
In our study, a research assistant sat in the passenger seat throughout data collection as both a safety precaution and to ensure quality data acquisition. It is possible that having a research assistant in the car may have influenced driver behavior. Participants may have been more attentive to the driving task than they otherwise would have been without an observer in the car. Future studies can address this by including a more naturalistic driving component in order to observe driving behavior without a researcher in the car.
Additionally, the participants recruited for this study had never driven a partially automated vehicle, and our research testing was their first exposure to this technology. Therefore, this study is representative of all new Level-2 partial automation vehicle owners. However, it is possible that the technology was sufficiently novel that participants remained engaged and aroused when driving under partial vehicle automation, despite the hour and a half of practice prior to participation. Future research might explore how additional experience driving the vehicles may alter behavior and neural activity.
Furthermore, we stopped recording the EEG signal during unsafe driving conditions, such as stand-still traffic or stretches of highway with construction or road hazards. We made this decision with the safety of our participants and research assistants in mind. While Level-2 automation technology continues to improve, there are circumstances in which the technology is not 100% reliable. Because of the nature of our on-road study, we chose to prioritize participant and research assistant safety; however, an important avenue for future research would be to recreate these circumstances in a driving simulator in order to tease apart if certain driving conditions are more likely to show a divergence in driver cognitive states between manual and automated driving.
Finally, the experimental manipulations of age cohort, interstate, and vehicle that were included in this study were not intended to be representative of every single type of driver and driving experience possible. We collected data on two major interstates in the western United States (I-15 running from southern California to the Canadian border and I-80 running from San Francisco, CA to New York, NY) that have different roadway configurations and traffic patterns. We also collected data in four different vehicles equipped with technology characteristic of Level-2 partial automation (2018 Cadillac CT6, 2019 Nissan Rogue, 2019 Tesla Model 3, and 2018 Volvo XC90). Future research could benefit from including additional roadway and traffic configurations to increase the generalizability of the findings reported.
Conclusion
This on-road study examined how partial vehicle automation may affect various cognitive processes while driving. We utilized EEG-based measures of mental workload and visual engagement while driving on real roadways. Data were collected from two age cohorts, on two different highway configurations, in four different commercially available vehicles equipped with partial vehicle automation, while participants drove in both manual and partially automated mode. The primary focus was on how neural indices of workload and engagement change when the driver shifts from full control of a manual vehicle to passively monitoring a partially automated vehicle. The results suggest that the concerns surrounding driver disengagement under vehicle automation may need to be tempered, at least for drivers new to the experience. This study demonstrates the methodological feasibility of collecting reliable psychophysiological data on real roadways and future research should explore how additional driving conditions may differentially affect drivers’ cognitive states while driving under partial vehicle automation.
Key Points
In partially automated vehicles, the role of the driver shifts from active controller to passive monitor. It is unclear how this shift in demand affects driver workload and engagement.
We used EEG to measure frontal theta and parietal alpha power while participants drove on different types of highways, in different vehicles, and with partial automation both engaged and not engaged.
Frontal theta is a neural index of driver workload, and parietal alpha is a neural index of visual engagement with the driving environment.
We found no significant changes in mental workload or visual engagement while driving in manual mode compared with partial automation.
Concerns regarding driver disengagement under vehicle automation may need to be tempered, at least for drivers new to the experience.
Footnotes
Acknowledgments
Support for this work was provided by AAA Foundation for Traffic Safety.
Author Biographies
Amy S. McDonnell is a doctoral student in the Department of Psychology at the University of Utah, where she received her MS in psychology in 2020.
Trent G. Simmons is a research associate in the Applied Cognition Lab at the University of Utah, where he received his BS in psychology in 2019.
Gus G. Erickson is a research associate in the Applied Cognition Lab at the University of Utah, where he received his BS in psychology in 2018.
Monika Lohani is a professor in the Department of Educational Psychology at the University of Utah. She received her PhD in social and developmental psychology in 2014 from Brandeis University.
Joel M. Cooper is the founder of Red Scientific and an associate research professor in the Department of Psychology at the University of Utah, where he received his PhD in cognition and neural science in 2010.
David L. Strayer is a professor in the Department of Psychology at the University of Utah. He received his PhD in psychology from the University of Illinois at Urbana-Champaign in 1989.