
Abstract
Background
Human performers often recruit environment-based assistance to acquire or process information, such as relying on a smartphone app, a search engine, or a conversational agent. To make informed choices between several of such extended cognitive strategies, performers need to monitor the performance of these options.
Objective
In the present study, we investigated whether participants monitor an extended cognitive strategy’s performance—here, speed—more closely during initial as compared to later encounters.
Methods
In three experiments, 737 participants were asked to first observe speed differences between two competing cognitive strategies—here, two competing algorithms that can obtain answers to trivia questions—and eventually choose between both strategies based on the observations.
Results
Participants were sensitive to subtle speed differences and selected strategies accordingly. Most remarkably, even when participants performed identically with both strategies across all encounters, the strategy with superior speed in the initial encounters was preferred. Worded differently, participants exhibited a technology-use primacy effect. Contrarily, evidence for a recency effect was weak at best.
Conclusion
These results suggest that great care is required when performers are first acquainted with novel ways to acquire or process information. Superior initial performance has the potential to desensitize the performer for inferior later performance and thus prohibit optimal choice.
Application
Awareness of primacy enables users and designers of extended cognitive strategies to actively remediate suboptimal behavior originating in early monitoring episodes.
Keywords
Humans in a technologized environment typically have different means to acquire or process information at their disposal, which necessitates the use of different cognitive strategies (CSs). Cognitive strategies can, but need not, rely on the surrounding environment (Clark & Chalmers, 1998). For example, if one wants to know the name of a tree, one may rely on one’s own memory and recall information encoded earlier during biology class. Instead, one may however also ask a friend, send a picture to a biologist, use a plant recognition app, consult a book after returning back home, and so on. The present article is focused on such extended cognitive strategies in which cognitive processing extends beyond the acting agent and reaches out into the environment.
Deciding for a specific CS is not trivial because it can be associated with substantial consequences, which need to be taken into account. For example, a bad choice might entail unnecessarily bad quality of the acquired information (e.g., your friend tells you an incorrect name), or unnecessarily long time to acquire the desired information (e.g., finding and opening the app might be slow). Fortunately, humans were shown to frequently (e.g., Gilbert, 2015; Gray et al., 2006; Siegler & Lemaire, 1997; Walsh & Anderson, 2009; Weis & Wiese, 2019a), though not always (e.g., Risko & Dunn, 2015; Touron, 2015), make adaptive choices regarding such performance-related CS properties.
For the present paper, we were especially interested in time-related adaptiveness: if two extended CSs are similar but one is faster than the other, human performers were frequently shown to prefer the faster one (e.g., Gray et al., 2006; Siegler & Lemaire, 1997; Walsh & Anderson, 2009; Weis & Wiese, 2019a). Such adaptive behavior might not be too surprising, as humans are known to discriminate time intervals quite accurately (reviewed by, e.g., Allan, 1979; Mauk & Buonomano, 2004). Proficiency in time monitoring is also reflected by moderate to high correlations of introspective and actual time between a stimulus and a related response (e.g., with a mean correlation between actual and introspected RT of .73; Corallo et al., 2008). Yet, time monitoring requires cognitive resources and seems to be offset when such resources are required by another concurrent task (Corallo et al., 2008), or mind-wandering (Terhune et al., 2017). Thus, although humans prefer CSs that come with lower processing time even without explicit speed feedback (e.g., Siegler & Lemaire, 1997), the monitoring of processing time is cognitively demanding in itself, and thus conceivably employed sparsely.
Here, our goal was to better understand this sparsity and the associated trajectory of time monitoring across several potential monitoring episodes. Specifically, we asked whether the time point of experiencing differences between two CSs determines which strategy is preferred later on. To answer this question, we instructed participants to use two different CSs and monitor whether with each of both strategies the desired information, that is, the answer to a trivia task, is found “fast enough.” At this point, participants were not able to choose between the strategies. However, after the observation phase, participants were able to choose the “better” CS. The crucial variations concerned when and how frequently one of both strategies was faster in providing the desired information during the observation phase. Importantly, in Experiments 2 and 3, both strategies were identically fast throughout the whole observation block. What differed was only when which strategy was faster than the other.
While we first replicated the well-established preference for CSs that consistently come with higher speed, we conjectured that initial, as compared to later, encounters of speed differences between CSs are especially powerful at determining later choices. There are at least three mutually nonexclusive reasons to assume such a primacy effect. First, early episodes of using a specific CS might be retrieved more likely from memory during future choices (Murdock, 1962). Second, early information has a stronger impact on impression formation than information that was encountered later on (e.g., Asch, 1946; Sullivan, 2019). Third, given that time monitoring absorbs cognitive resources (cf. Corallo et al., 2008; Terhune et al., 2017), agents might be inclined to monitor novel CSs more thoroughly and decrease monitoring after some initial evaluation has taken place.
The existence of a primacy effect in time monitoring would provide insights for the human-technology interaction domain, a domain intimately linked with the supply of novel CSs. For example, time monitoring is likely influencing how choices between smartphone apps or between conversational agents used for knowledge acquisition are made. A primacy effect would strongly suggest that special attention is required when acquainting users with novel CSs. A CS’s initial performance might overshadow performance changes that are experienced only later on. Relatedly, primacy might explain to some extent why users perseverate on using a certain CS, despite more beneficial alternatives being available (e.g., Scarampi & Gilbert, 2020; Storm et al., 2017). As a quick outlook, in the remainder of the article, we will provide evidence for a primacy effect: participants favored an initially fast CS over an initially slow CS, even though great care was taken from Experiment 2 onward that the speeds of both CSs were, on average, identical.
EXPERIMENT 1
Our focus in Experiment 1 was to first validate the adequacy of the used paradigm (see H1a, H1b below), and to subsequently investigate the existence of a primacy effect (H1c). Participants were asked to monitor the time it took different algorithms to solve a trivia task. Referring back to our initial nomenclature, each algorithm constituted a CS and was assigned a unique key on the keyboard. Participants needed to keep pressing that key to make an algorithm find the answer to the trivia question, until it found the answer (Figure 1). Trivia task. Note. In the Trivia task, participants needed to keep a key pressed to let the associated algorithm find the solution. Referring to the nomenclature introduced in the main text, each algorithm constituted a cognitive strategy. At the beginning of each trial, participants were given time to prepare for the next question right before the question appeared. Then, the available algorithms appeared in a box; one of both algorithms in the force choice trials of the observation block and both algorithms in the free choice trials of the choice block. Each algorithm had a unique logo and key assigned. Both logo and key appeared in the box. As soon as one of the keys was getting pressed, the box of the used algorithm was lighting up in red. Also, different algorithm-specific processing words appeared while the key was being pressed (e.g., “initializing,” “bootstrapping,” ...). Once the key was pressed long enough for the associated algorithm to provide the answer, the participant was informed with the words “found answer.” Eventually, the answer was presented in Experiments E1a–c. In Experiments E2a–d, the answer was hidden to minimize thoughts about an algorithm’s accuracy.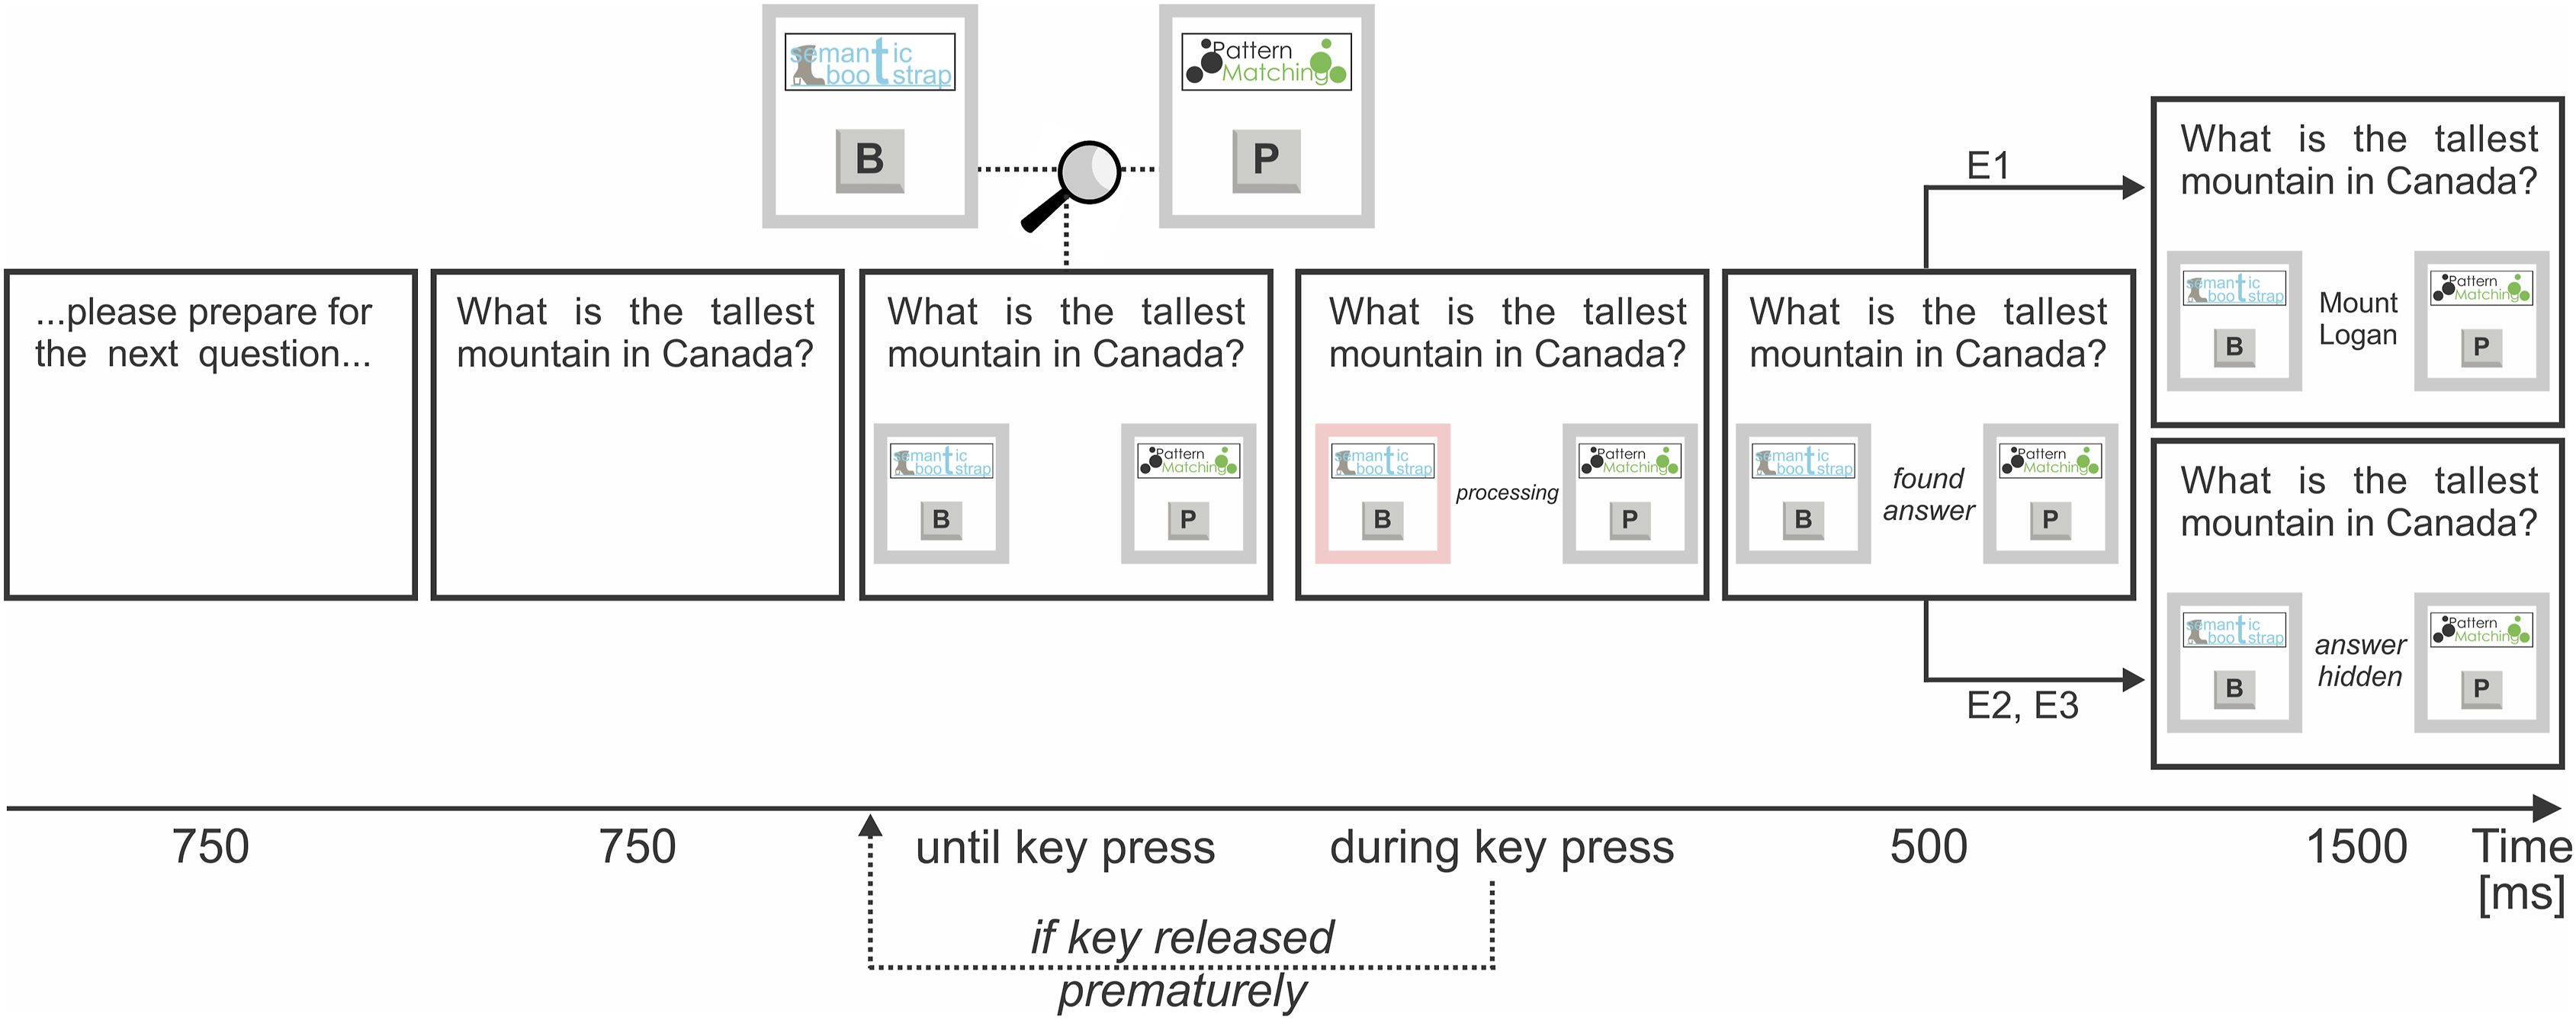
Three hypotheses were evaluated. First, to set appropriate parameters for later studies, we investigated whether a 800-ms processing time difference between algorithms was detectable and choice-relevant for our participants (H1a). Building on initial results regarding H1a, we investigated whether a 800-ms difference is relevant for our participants even if that difference was only present during the first few encounters with the algorithms (H1b) rather than during all encounters. Lastly, we investigated whether the 800-ms difference during the first few encounters was more relevant for participants than a 800-ms difference that occurred later on (H1c), which would be first evidence for a primacy effect. H1a was investigated in Experiment 1a, H1b in Experiment 1b, and H1c based on data from Experiment 1b and 1c combined. In Figure 2, time manipulations for each experiment are visualized. Hypotheses were preregistered (https://osf.io/re23k). Please note that, after piloting, we decided to increase the time differences between both algorithms from 400 ms as originally denoted in the preregistration to 800 ms because some participants were unable to reliably detect time differences of 400 ms. Trivia trials: Procedure and manipulations across experiments. Note. First, participants engaged in four practice trials. After finishing the practice block, participants engaged in 50 observation trials in which participants had to alternate between two algorithms in chunks of five consecutive trials of the same algorithm. In other words, only one box for one algorithm appeared at a time (unlike the two boxes shown in Figure 1). After five trials, the box for the other algorithm appeared instead. For example, at the beginning of the E1b observation block, five trials in which Algorithm A provided fast answers were followed by five trials in which Algorithm B gave slow answers; afterward, Algorithm A provided medium speed answers for five trials and Algorithm B provided medium speed answers for another five trials, and so on. Eventually, in a choice block, participants were able to choose between both algorithms (both boxes appeared, as shown in Figure 1). Whether Algorithm A or B was presented first within a block was counterbalanced between participants. Please note that, referring to the nomenclature introduced in the main text, each algorithm constituted a cognitive strategy. Fast = high speed answers (600–1400 ms, mean 1000 ms), med = medium speed answers (1000–1800 ms, mean 1400 ms), slow = low speed answers (1400–2200 ms, mean 1800 ms), ROS = reverse subblock. A = Algorithm A, B = Algorithm B.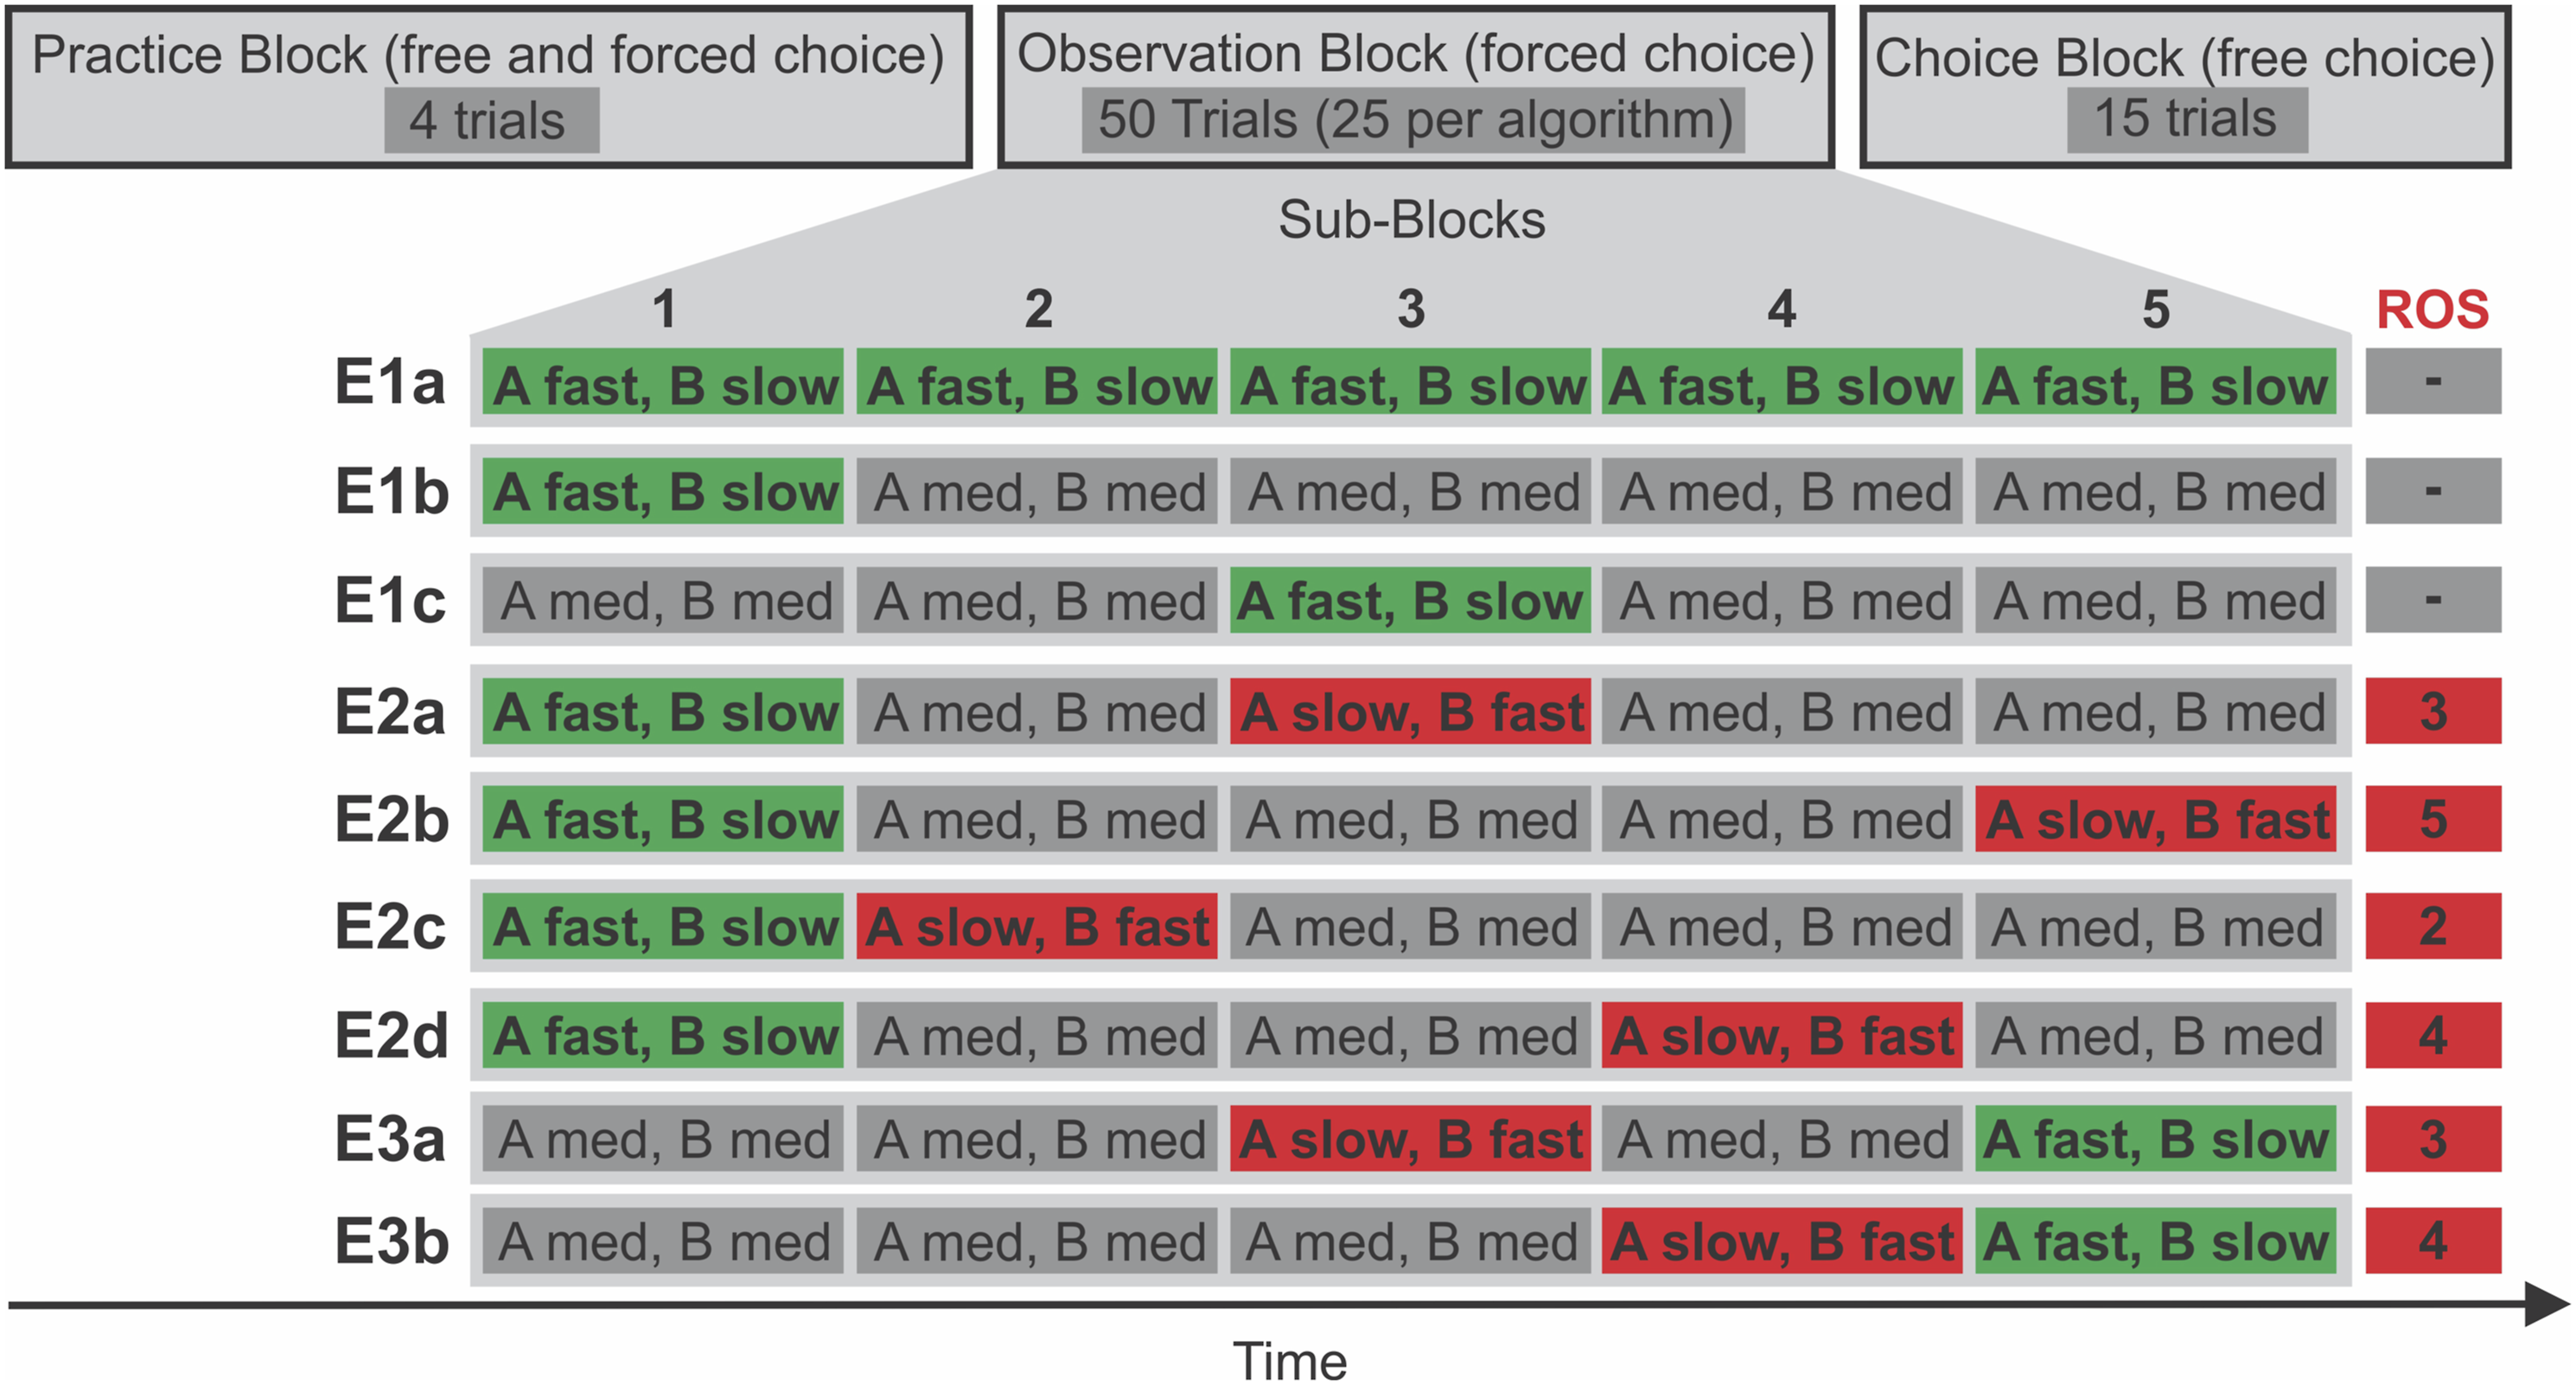
Manipulation check: If the faster Algorithm A is fast in 100% of observation trials and the slower Algorithm B is slow in 100% of observation trials, the fast Algorithm A is preferred by participants during choice trials.
Robustness of the manipulation: Preference for the fast Algorithm A persists even if it is only faster in the first 20% of observation trials (i.e., Observation Subblock 1; Figure 2) and has the same speed as the slower Algorithm B thereafter.
Primacy effect (between design): Preference for the fast Algorithm A is more pronounced if it was faster than the slow Algorithm B only in the beginning (first 20% of trials, that is, Observation Subblock 1) in comparison to when it was faster only in the middle (between 40% and 60% of trials, that is, Observation Subblock 3) of the observation block. Preference is defined as Algorithm A choice proportion in a choice block.
EXPERIMENT 1a
Methods
Participants
A total of 15 participants (mean age 30.6 years; age range 21–61; 8 female, 6 male, 1 nonbinary) that fulfilled the inclusion criteria were measured. All samples in the present study were recruited from countries with English as main language, including the United States, Canada, and the United Kingdom, through the platform Prolific (www.prolific.co). The sample size is based on a one-sided one-sample t-test in G*Power (version 3.1.9.2, Faul et al., 2007); alpha = .05, 1 - beta = .9, and a large effect size d = 8. In line with preregistration, one participant with a mean trial time (observation and choice trials combined) above or below 2.5 sample SDs from the grand mean was excluded from analyses. Please note that the preregistration file states 16 participants, which is a typo that is not consistent with the sample size calculations provided by G*Power. We decided to stick with the sample size as provided by G*Power.
Apparatus
Participants completed the task on their personal computer running either Windows, Linux, or macOS. The task was programmed using PsychoPy (v2022.2.5; see Peirce et al., 2019) and presented online via the Pavlovia platform (www.pavlovia.org). Screen frame rates ranged between 10 Hz and 200 Hz with a mean of 78.6 Hz.
Procedure and Task
Our participants’ main task was to read trivia questions, let an algorithm find the according answer, and monitor the time the algorithm needed to do so; consult Figure 1 including caption for details. After passing an attention check, giving informed consent, and reading instructions, participants engaged in a practice block with unique generic algorithm names, logos, and associated keys, to get accustomed to the trivia trials. After practice, two different names, logos, and keys were used: Semantic Bootstrap (SB, key “b”) and Pattern Matching (PM, key “p”). The main manipulation of interest was implemented in a subsequent observation block. In the observation block, the time each algorithm needed to provide an answer was manipulated. Eventually, participants were able to choose between two algorithms in a choice block. The procedure and algorithm timings are summarized in Figure 2. Whether the SB or the PM algorithm names were assigned to what Figure 2 denotes as “Algorithm A” and “Algorithm B” was counterbalanced between participants. In the observation block, participants needed to observe the behavior of one algorithm in subblocks consisting of five trials each. We preferred this blocked design over a design alternating between algorithms every trial to not encourage switching behavior in the choice block, which would induce undesired error variance in algorithm choice proportions. Order within an observation subblock was counterbalanced. In other words, the notation “A fast, B slow” in Figure 2 also encompasses the order “B slow, A fast.”
Timings were closely controlled. During practice trials, participants needed to press the algorithm-specific key between 1000 and 1800 ms for an answer to appear. During observation trials, an algorithm was either fast, slow, or of medium speed. The algorithms’ speeds in each 5-trial block (see Figure 2 caption for explanation) were always comprised of the exact same times for each speed and presented in randomized order. If an algorithm was fast in a block, a participant needed to press the associated key in one trial for 600 ms, in one for 800 ms, in one for 1000 ms, in one for 1200 ms, and in one for 1400 ms until “answer found” was presented (600–1400 ms, M = 1000 ms). If an algorithm was slow in a block, one trial required a key press duration of 1400 ms, one 1600 ms, one 1800 ms, one 2000 ms, and one 2200 ms until “answer found” was presented (1400–2200 ms, M = 1800 ms). If an algorithm was of medium speed in a block, one trial required a key press duration of 1000 ms, one 1200 ms, one 1400 ms, one 1600 ms, and one 1800 ms until “answer found” was presented (1000–1800 ms, M = 1400 ms). Note that medium speed did not occur in this very first Experiment 1a but only occurred in later experiments (see Figure 2). Importantly, to avoid speed effects in the choice block, both Algorithms A and B needed exactly 1400 ms without variance beyond screen refresh rate to find the answer in all 15 choice block trials.
After all trivia trials were completed, questions regarding the reasons for choosing one over the other algorithms in the choice block were posed. Specifically, participants were asked which algorithm gave more reasonable answers (SB, PB, or equal), which algorithm was faster (SB, PM, or equal), and why they preferred the algorithm they chose more frequently (open answer).
Stimuli
Trivia questions were extracted from the Open Trivia Database (https://opentdb.com/). Only medium or hard questions with non-binary answers were used. Where necessary, questions were slightly adjusted to match an open answer format rather than the original multiple choice format.
Analyses
Data Cleaning. Practice trials were excluded from all analyses.
Hypotheses Testing. The main dependent variable (DV) was the proportion in which Algorithm A was chosen during the choice block; compare Figure 2. If that value was above 50%, H1a would be confirmed. The hypothesis was tested with a one-sided one-sample t-test testing against 50%. All analyses were conducted in R (version 4.2.2 R Core Team, 2013). Effect sizes and associated intervals were computed with the package bootES (version 1.2.1; the function bootES was used based on Cohen’s d, bias-corrected and accelerated confidence intervals, and R = 2000).
Results
Hypothesis Testing
H1a is confirmed. Participants preferred Algorithm A throughout the fifteen trials of the choice block; M = 77.8%, μ = 50.0%, t (14) = 4.6, p = .0002, d = 1.20, 95% CI
d
= [.68, 2.05] (Figure 3). Results were similar when only considering the first choice trial; M = 73.3%, μ = 50.0%, t (14) = 2.0, p = .0342, d = .51, 95% CI
d
= [−.23, 1.04] (Figure S2). Algorithm preference in choice blocks of experiments 1a–c. Note. Each dot summarizes data from one of the Experiments 1a–c. Within-experiment tests were one-sided t-tests against chance level μ = 50%. The underlying averages of individual participants are depicted in Figure S1a. Error bars depict 95% CIs. Alg. = Algorithm. ***p = .0002. *p = .0236. †p = . 0606. ns p = . 3680.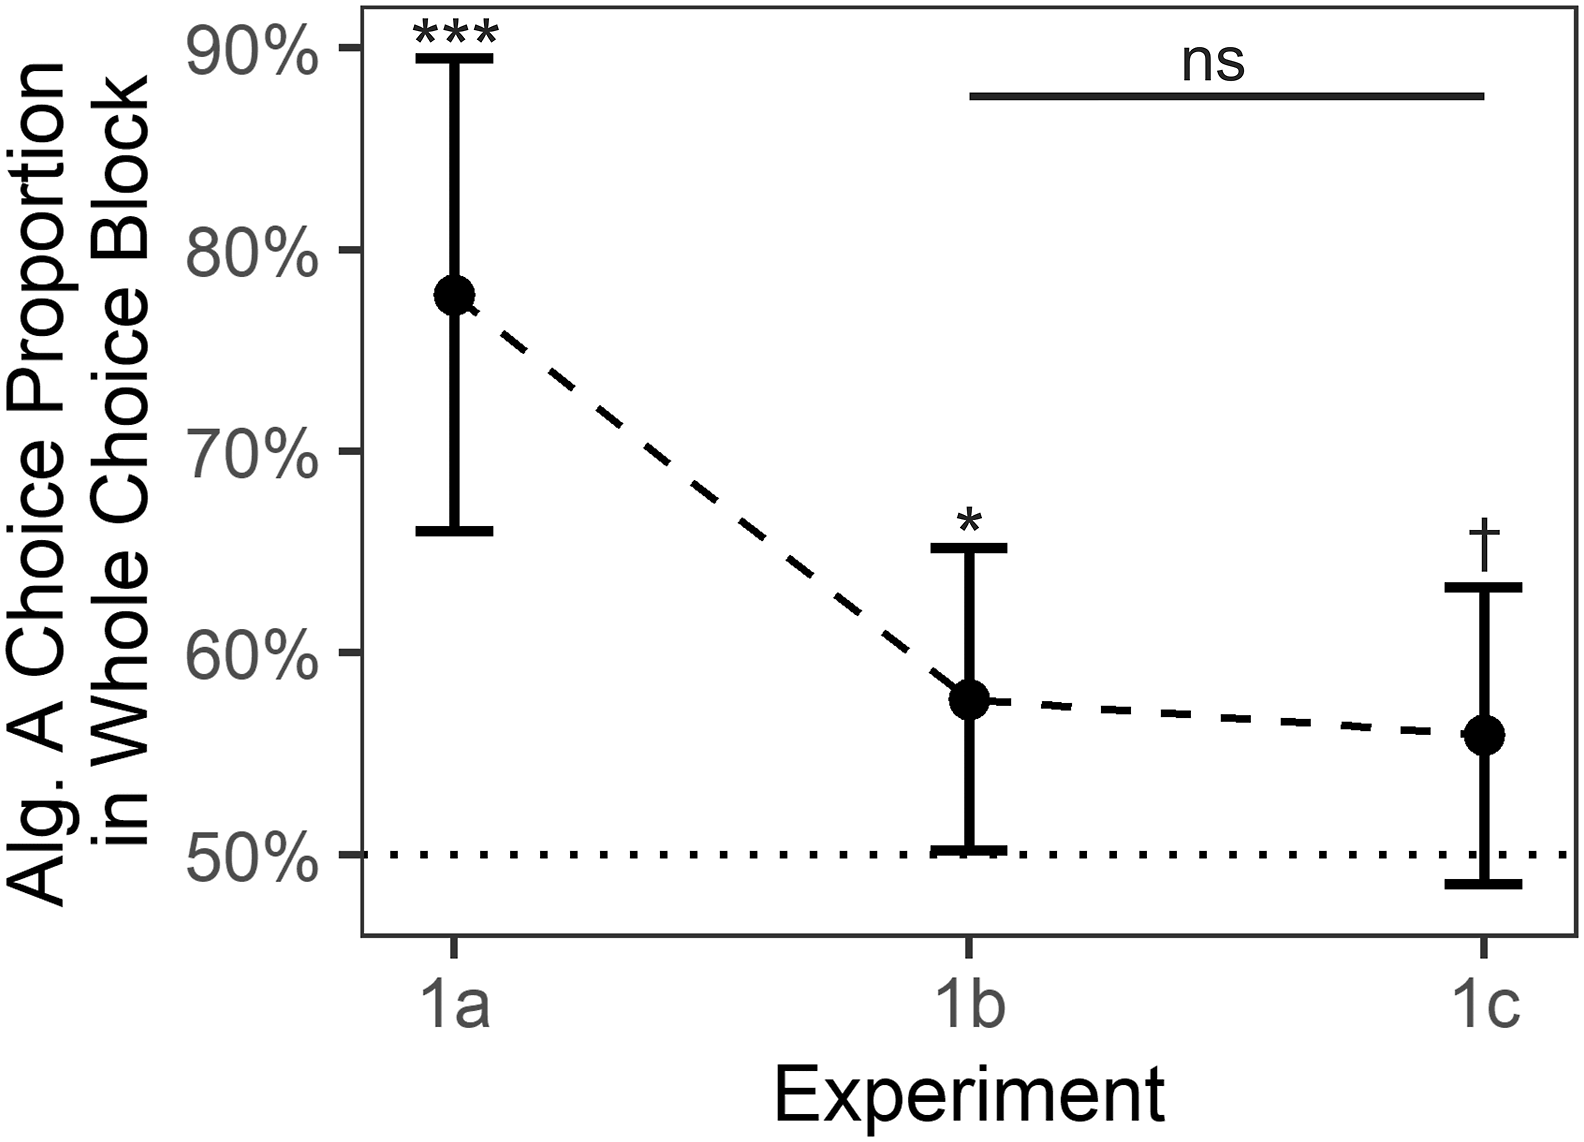
EDA: Metacognition
To explore whether participants were not only choosing the faster algorithm as indicated by confirmation of H1a, but were also aware of the speed difference between algorithms, we also report metacognitive findings. In line with choice data, 73% of participants correctly identified the faster algorithm and 27% reported both algorithms to be equally fast. No participant reported the slower algorithm, that is, Algorithm B, to be faster. To further validate our speed manipulation, we also looked at participants’ evaluations of the algorithms’ answer quality. Most participants, 73%, reported both algorithms to provide equally reasonable answers. In sum, most participants correctly identified the faster algorithm while most participants also perceived both algorithms to provide comparably reasonable answers. Employing a one-sided one-sample t-test in an analogous manner as for the choice proportion complemented this descriptive finding regarding speed perception; M = .73 on a scale from −1 to 1, μ = 0, t (14) = 6.2, p < .0001, d = 1.60, 95% CI
d
= [.79, 2.46]. Results are summarized in Figure 4(a). For an explanation regarding the scale as well as for evaluations regarding reasonableness of the algorithms’ answers, please consult Figure 4 and its caption. Metacognitive ratings after choice blocks of experiments 1a–c. Note. Individual data was based on three answer options for a (Algorithm A faster was coded as 1, equal was coded as 0, Algorithm B faster was coded as −1) and b (Algorithm A more reasonable was coded as 1, equal was coded as 0, Algorithm B more reasonable was coded as −1). Error bars depict 95% CIs. ***p < .0001. *p = .0451. †p = .0572.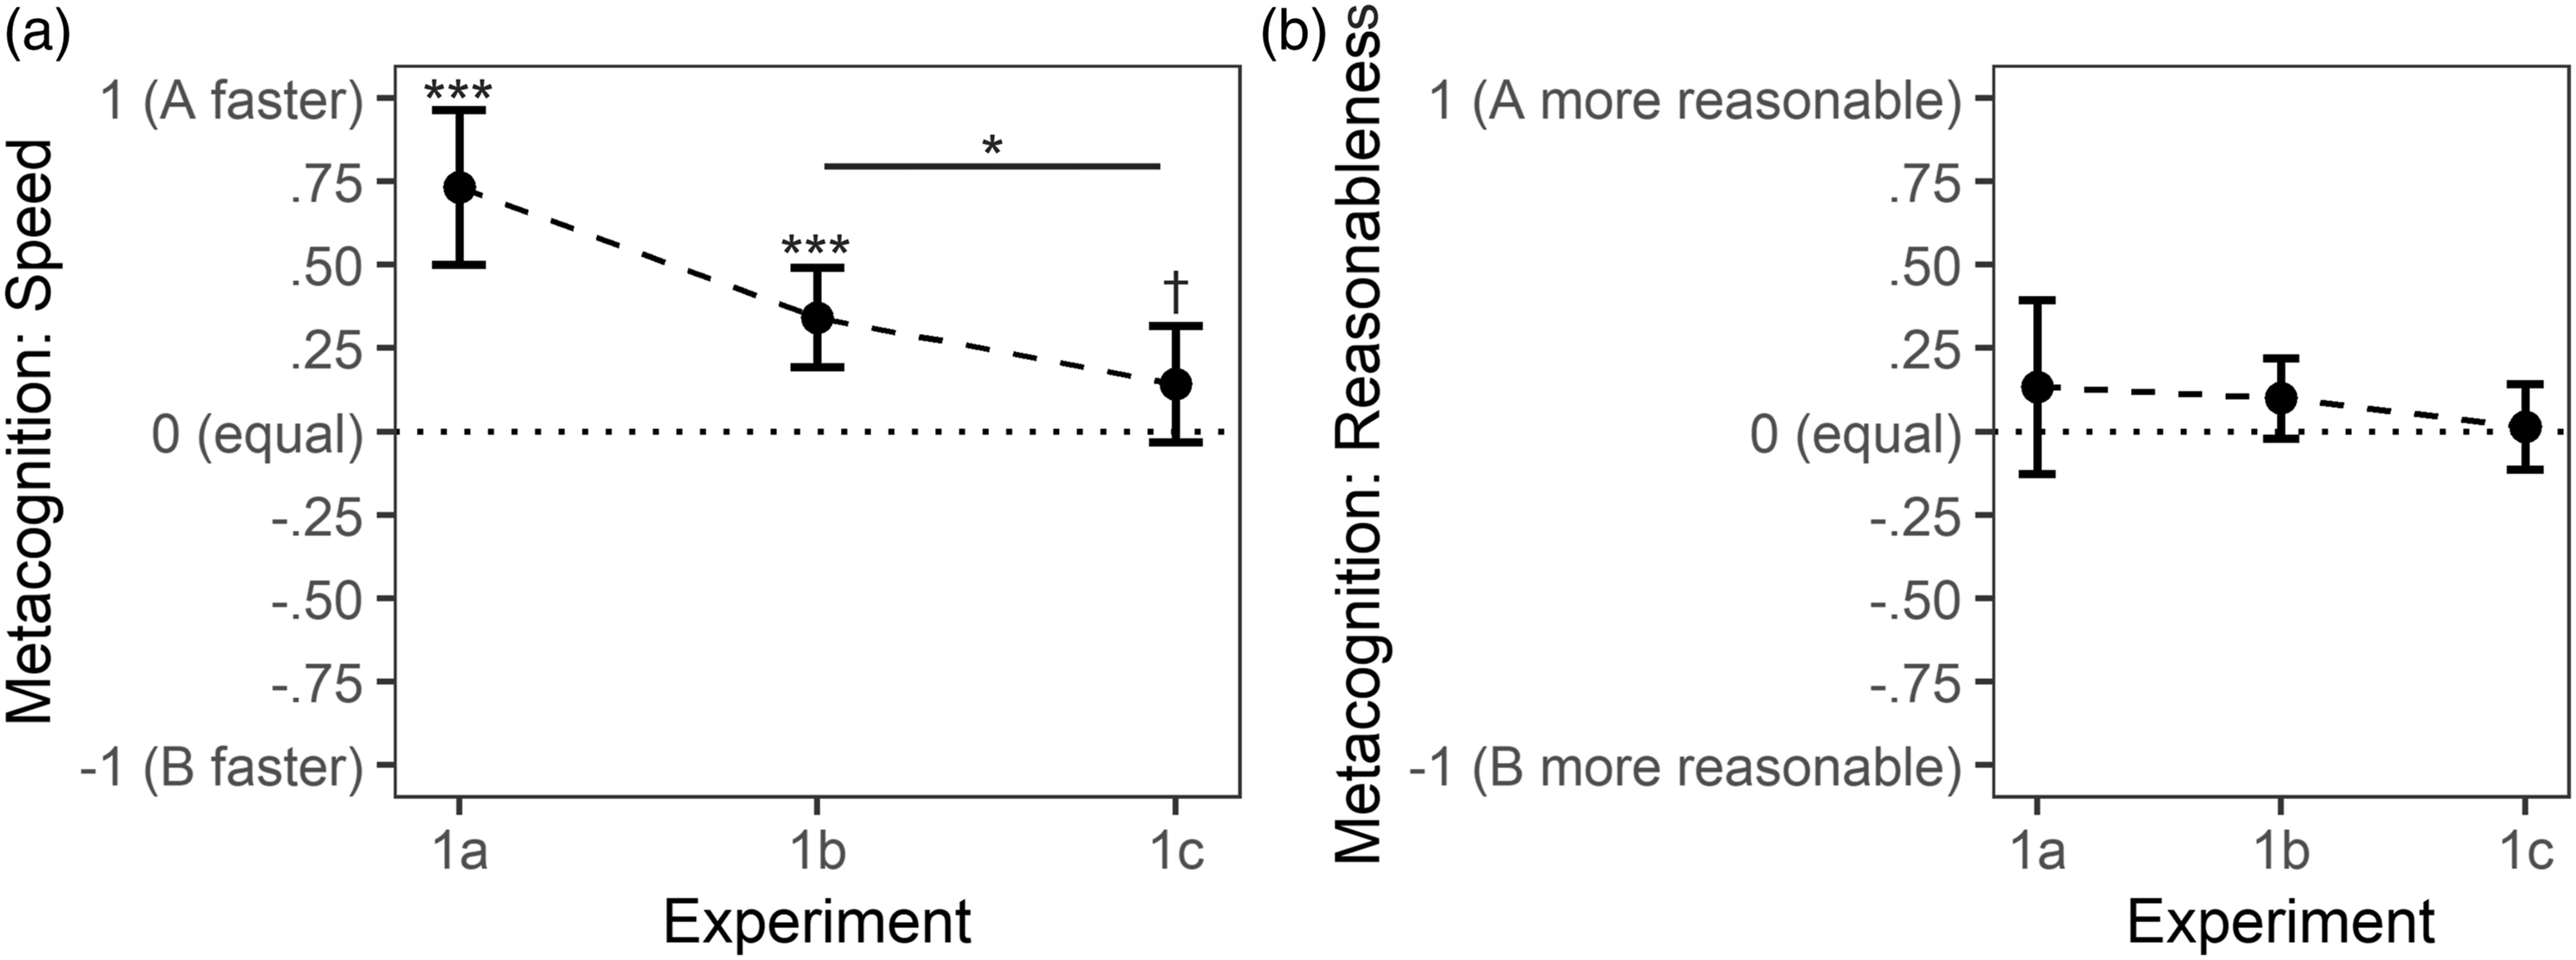
Discussion
Data from Experiment 1a showed that our participants were able to proficiently monitor the speed of two extended CSs—here, two algorithms that needed on average either 1000 ms or 1800 ms, respectively, to find the answer to a trivia question—and subsequently adaptively prefer the faster strategy. In addition to the adaptive choice, participants also explicitly reported that the faster CS—here, Algorithm A—is indeed faster. This confirmation of H1a sets the stage for Experiment 1b and for testing H1b.
EXPERIMENT 1b
Here, we investigated whether the preference for the fast CS—here, Algorithm A—persisted even if it was faster only in the first 20% of observation trials and had the same speed as the slower CS—here, Algorithm B—thereafter, Hypothesis H1b (Figure 2). This experiment further delineates our participants’ ability to monitor speed differences between algorithms in the present paradigm and sets the stage for investigating primacy in Experiment 1c.
Methods
Participants
In total, 76 participants were measured and data from 70 participants (mean age 30.8 years; age range 19–70; 33 female, 34 male, 3 nonbinary) were used for analyses. The final sample size is based on a one-sided two-sample independent t-test in G*Power (version 3.1.9.2, Faul et al., 2007); alpha = .05, 1 - beta = .9, medium effect size d = .5. In line with preregistration, two participants with a mean trial time (observation and choice trials combined) above or below 2.5 sample SDs from the grand mean were excluded from analyses. Additionally, we decided to exclude four participants because their screen refresh rates were below 10 Hz—which prohibited meaningful time monitoring.
Apparatus
The same setup as in Experiment 1a was used. Screen frame rates ranged between 12 Hz and 240 Hz with a mean of 64.8 Hz.
Procedure, Task, and Stimuli
Except for one change, the same procedure, task, and stimuli as in Experiment 1a were used. The change pertains to the timing of the observation block trials. In Experiment 1a, Algorithm A was faster in all five subblocks of the observation block. In Experiment 1b, Algorithm A faster in only the first of the five subblocks; compare Figure 2. In all other subblocks, both Algorithms A and B were equally fast with an average duration of 1400 ms to find an answer.
Analyses
Similar to Experiment 1a, the main DV was the proportion in which Algorithm A was chosen during the choice block. If that value was above 50%, H1b would be confirmed. The hypothesis was tested with a one-sided two-sample independent t-test testing against 50%.
Results
Hypothesis Testing
H1b is confirmed. Participants preferred the algorithm that was faster throughout the first ten trials of the observation block; M = 57.7%, μ = 50.0%, t (69) = 2.0, p = .0236, d = .24, 95% CI d = [−.02, .49] (Figure 3). Results were in the same direction when only considering the first choice trial; M = 67.1%, μ = 50.0%, t (69) = 3.0, p = .0017, d = .36, 95% CI d = [.11, .64] (Figure S2).
EDA: Metacognition
As in Experiment 1a, we also explored metacognition. With 43%, less than half of participants correctly identified Algorithm A as the faster algorithm. However, considering that both algorithms had the same speed in Observation Subblocks 2–5 and throughout the whole choice block, it also seems warranted that 48.5% of participants indicated that both algorithms were equally fast. Anecdotally, several participants who indicated that both algorithms were equally fast in the predefined answer format also stated that Algorithm A was a tiny bit faster in the open answer format. Thus, some participants might have noted the differences but they deemed them to be so small that they still picked “equal” in the predefined answer format. In contrast to Experiment 1a, 8.5% of participants now incorrectly identified Algorithm B as the faster algorithm. In sum, many participants still correctly identified the faster algorithm. A one-sided one-sample t-test employed analogously as for Experiment 1a strengthened this interpretation; M = .34 on a scale from −1 to 1, μ = 0, t (69) = 4.5, p < .0001, d = .54, 95% CI d = [.26, .80]; Figure 4(a). That correct identification was lower than in Experiment 1a was to be expected due to a weaker signal, that is, the less pronounced differences. As in Experiment 1a, 73% of participants indicated that both algorithms provided equally reasonable answers. Metacognition results are depicted in Figure 4.
Discussion
From Experiment 1a, we know that participants are able to distinguish a fast CS—that is, Algorithm A—with an average speed of 1000 ms from a slow CS—that is, Algorithm B—with an average speed of 1800 ms; compare Figure 3. In Experiment 1a, after an observation block, participants were more likely to choose the faster CS in the choice block. Here, we showed that this preference for the faster CS is still present when the CS was only faster at the beginning in comparison to the entirety of the choice block. In other words, forty trials in which both CSs were equally fast were not enough to eliminate the preference for the fast CS that had been established due to speed differences during the first ten trials. This finding sets the stage for testing our main hypothesis H1c in Experiment 1c.
EXPERIMENT 1c
After confirmation of H1b we met all preconditions to investigate hypothesis H1c. Has initial observation of speed differences between two CSs—here, Algorithms A and B—more impact on later choices between both CSs than later observation of such differences?
Methods
Participants
In total, 73 participants were measured and data from 70 participants (mean age 35.1 years; age range 20–66; 32 female, 35 male, 3 nonbinary) were used for analyses. The final sample size is based on a one-sided two-sample independent t-test in G*Power (version 3.1.9.2, Faul et al., 2007); alpha = .05, 1 - beta = .9, medium effect size d = .5. In line with preregistration, two participants with a mean trial time (observation and choice trials combined) above or below 2.5 sample SDs from the grand mean were excluded from analyses. Additionally, we excluded one participant because of a screen refresh rate below 10 Hz.
Apparatus
The same setup as in Experiment 1a was used. Screen frame rates ranged between 13 Hz and 240 Hz with a mean of 63.9 Hz.
Procedure, Task, and Stimuli
Except for one change, the same procedure, task, and stimuli as in Experiment 1b were used. The change pertained to the timing of the observation block trials. In Experiment 1b, Algorithm A was faster in the first of the five subblocks. Now, Algorithm A was faster in the third of the five subblocks; compare Figure 2.
Analyses
As in Experiment 1b, the main DV was the proportion in which Algorithm A was chosen during the choice block. To test for H1c, a one-sided two-sample independent t-test was conducted comparing the sample of Experiment 1b with the sample of Experiment 1c. If participants from Experiment 1c were more likely to choose the faster Algorithm A in the choice block than participants from Experiment 1b, H1c would be confirmed.
Results
Hypothesis Testing
H1c is not confirmed. There was no significant primacy effect. In other words, in the choice block, participants showed no differences in their preference for Algorithm A when it was fast in the first observation subblock (MExperiment 1b = 57.7%) in comparison to when it was fast in the third observation subblock (MExperiment 1c = 55.9%); t (138) = .34, p = .3680, d = .06, 95% CI d = [−.28, .40] (Figure 3). Similar results were obtained when only looking at the first trial of the choice block rather than at all fifteen trials; MExperiment 1b = 67.1%, MExperiment 1c = 61.4%, t (138) = .70, p = .2420, d = .12, 95% CI d = [−.21, .45] (Figure S2).
For reasons of comparability with Experiments 1ab, we also conducted analogous one-sided t-tests against 50%. The data provided weak evidence that participants in Experiment 1c favored Algorithm A over B in the fifteen trials of the choice block; M = 55.9%, μ = 50.0%, t (69) = 1.6, p = .0606, d = .19, 95% CI d = [−.04, .42] (Figure 3). The data provided stronger evidence that participants favored Algorithm A over B in the first trial of the choice block; M = 61.4%, μ = 50.0%, t (69) = 2.0, p = .0276, d = .23, 95% CI d = [−.03, .47] (Figure S2).
EDA: Metacognition
By and large, metacognition was comparable to Experiment 1b (Figure 4). However, with 36%, participants were less likely than in Experiment 1b to identify Algorithm A as the faster algorithm. Conversely, with 21%, participants were more likely than in Experiment 1b to incorrectly identify Algorithm B as the faster algorithm. These descriptive differences between speed evaluations in Experiments 1a and 1b also manifested in the results of a one-sided one-sample t-test employed in an analogous manner as for the choice data; M 1b = .34, M 1c = .14, t (138) = 1.7, p = .0451, d = .29, 95% CI d = [−.06, .62]. Comparable to Experiments 1ab, 70% of participants indicated that both algorithms provided equally reasonable answers. Metacognition results are depicted in Figure 4.
Discussion
Experiments 1b and 1c provided no compelling evidence for a primacy effect. However, to us, the data is also not unambiguous enough to deny the idea of primacy in the context of time monitoring. To the contrary, we would argue that the data hints towards the existence of a primacy effect, though with a lower effect size than the power analyses were based on. Descriptively, Algorithm A choice proportions were in the hypothesized direction when considering both the first and all fifteen choice trials (i.e., Algorithm A choice proportion declined from E1b to E1c; Figure 3). Additionally, metacognitive speed evaluations also support the notion of a primacy effect (i.e., Algorithm A speed evaluations declined from E1b to E1c; Figure 4). We therefore decided to adjust the experimental design in a way that increases power and decreases error variance in our second experiment.
EXPERIMENT 2
First, to increase power, we switched from the between-participants design used in Experiment 1 to a within-participants design. At the same time, we employed an even more subtle variation of speed differences between CSs. In Experiment 2, both CSs—that is, both Algorithm A and B—now had identical speed when averaged across the whole observation block. The speed advantage of one CS over the respectively other CS occurred at different time points during the same observation block; compare Figure 2. Specifically, Algorithm A was always faster during the first observation subblock while Algorithm B was faster later on, in the reverse observation subblock (ROS). Additionally, correct answers to the trivia questions were now hidden to decrease unwanted variance in Algorithm A choice proportions due to accuracy-related metacognition; compare Figure 1. We decided for this change because—in Experiment 1—some participants mentioned that they chose one algorithm over the other because one gave one wrong answer. We checked answers and found no wrong answer in our stimulus material. However, apparently, believing that an answer was wrong is enough to alter choice behavior (compare Weis & Wiese, 2019b). Lastly, informed by pilot data from a within design, we now based our sample size calculations on a small (d = .3) rather than on a medium (d = .5) effect size as in Experiment 1.
EXPERIMENT 2a
In Experiment 2a, our hypothesis was analogous to H1c:
Primacy Effect (within design): Algorithm A, which is fast in the beginning (first 20% of trials, i.e., Observation Subblock 1) is preferred over Algorithm B, which is fast in the middle (between 40% and 60% of trials, i.e., Observation Subblock 3) of an observation block. Preference is defined as Algorithm A choice proportion in a choice block.
Methods
Participants
In total, 101 participants were measured and data from 97 participants (mean age 38.1 years; age range 19–70; 50 female, 45 male, 2 nonbinary) were used for analyses. The final sample size is based on a one-sided one-sample dependent t-test in G*Power (version 3.1.9.2, Faul et al., 2007); alpha = .05, 1 - beta = .9, small effect size d = .3. Three participants with a mean trial time (observation and choice trials combined) above or below 2.5 sample SDs from the grand mean were excluded from analyses. Additionally, we excluded one participant because of a screen refresh rate below 10 Hz.
Apparatus
The same setup as in Experiment 1a was used. Screen frame rates ranged between 12 Hz and 353 Hz with a mean of 64.0 Hz.
Procedure, Task, and Stimuli
Except for the changes mentioned at the beginning of section Experiment 2, procedure, task, and stimuli were identical to Experiment 1c.
Analyses
As in Experiment 1, the DV was the proportion in which Algorithm A was chosen during the choice block. If that value was above 50%, H2 would be confirmed. The hypothesis was tested with a one-sided one-sample t-test testing against 50%.
Results
H2 is confirmed: Participants exhibited a primacy effect. Specifically, participants preferred choosing the algorithm in the choice block that was faster in the first observation subblock in comparison to the algorithm that was faster in the third observation subblock; M = 56.2%, μ = 50.0%, t (96) = 2.6, p = .0057, d = .26, 95% CI
d
= [.05, .46]; Figure 5, Reverse Observation Subblock 3. Results were not statistically significant but in the same direction when only considering the first choice trial; M = 52.6%, μ = 50.0%, t (69) = .5, p = .3071, d = .05, 95% CI
d
= [−.16, .24]; Figure S3, Reverse Observation Subblock 3. Algorithm preference in choice blocks of experiments 2a–d. Note. Each dot summarizes data from one of the Experiments 2a–d. Specifically, data points from Reverse Observation Subblocks 2, 3, 4, and 5 relate to Experiments 2c, 2a, 2d, and 2b, respectively; compare Figure 2. Within-experiment tests were one-sided t-tests against chance level μ = .5. The underlying averages of individual participants are depicted in Figure S1b. Error bars depict 95% CIs. Alg. = Algorithm. E = Experiment. **p = .0057. *p = .0102. ns p >= . 2562.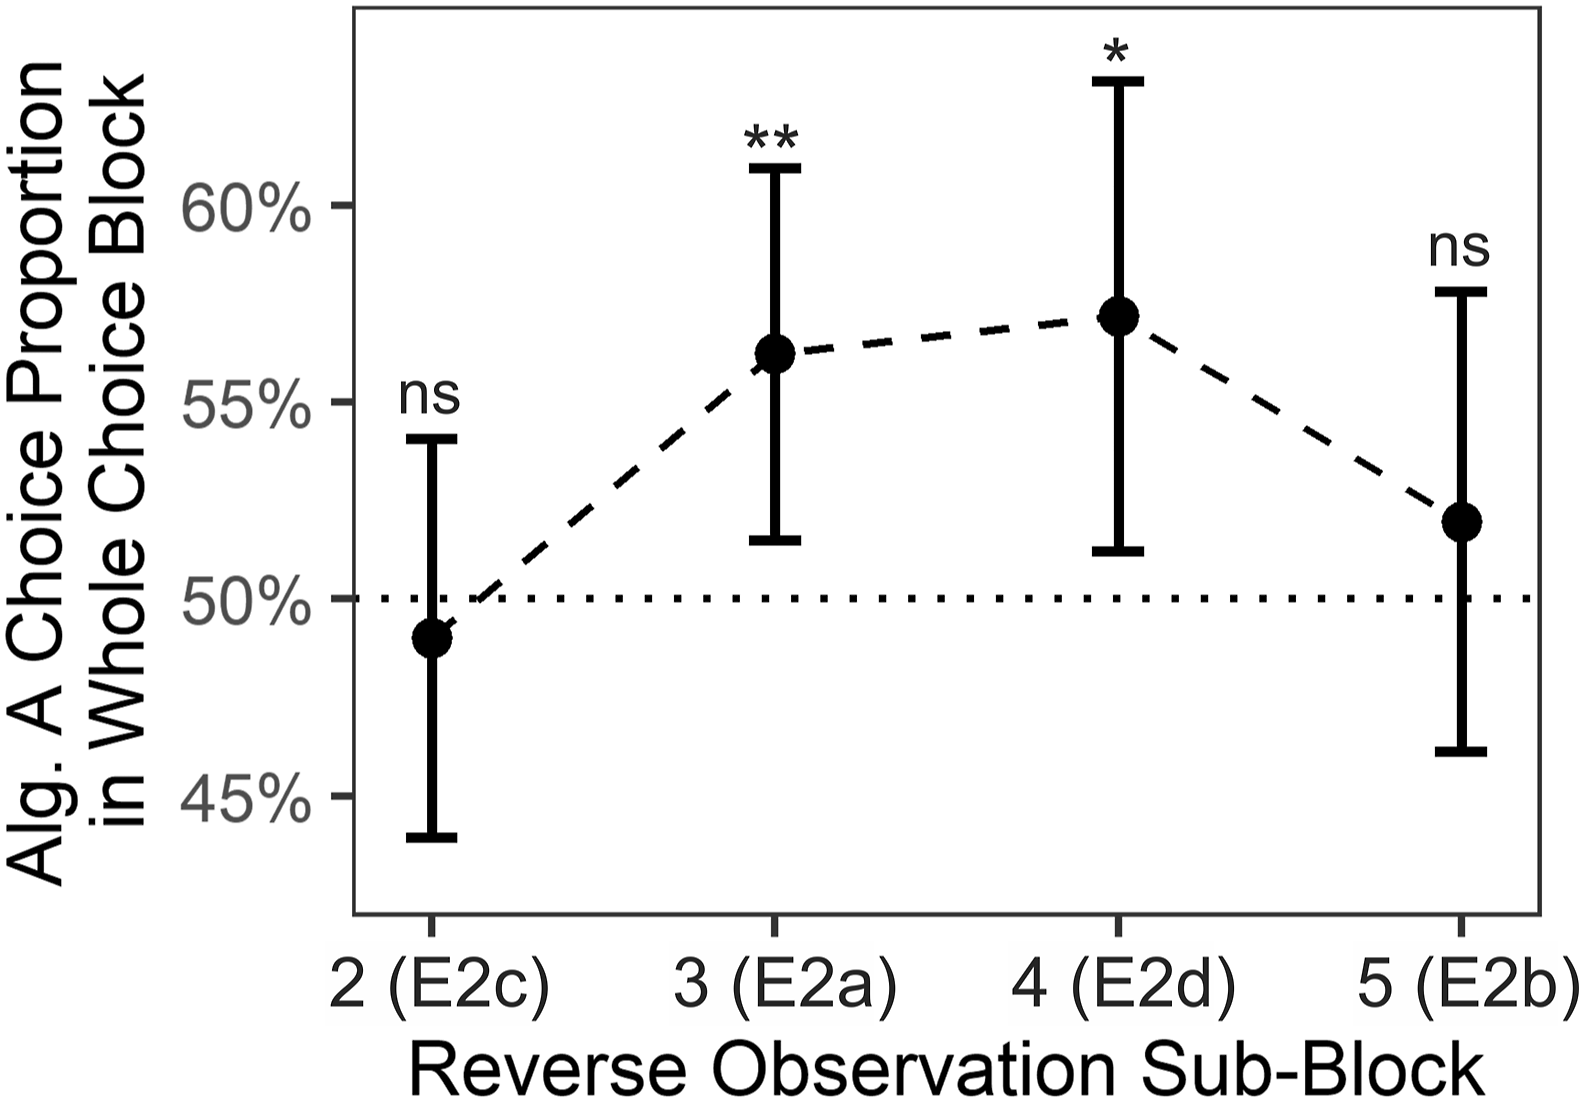
EDA: Metacognition
The primacy effect was also evident in speed-related metacognition. Descriptively, a sizable portion of participants, 29%, thought that Algorithm A was the faster algorithm whereas only 17% thought that Algorithm B was faster, despite both of them being equally fast throughout the whole choice block; 54% of participants thought that both algorithms were equally fast. This descriptive effect is backed by inferential statistics. Employing a one-sided one-sample t-test in an analogous manner as for the choice proportion indicated that participants evaluated Algorithm A to be faster than Algorithm B; M = .12 on a scale from −1 to 1, μ = 0, t (96) = 1.8, p = .0351, d = .19, 95% CI
d
= [.00, .41]. Results are summarized in Figure 6(a). For an explanation regarding the scale, please consult Figure 6’s caption. Metacognitive ratings after choice blocks of Experiments 2a–d. Note. Individual data was based on three answer options for both a (A faster was coded as 1, equal was coded as 0, B faster was coded as −1) and b (A more reasonable was coded as 1, equal was coded as 0, B more reasonable was coded as −1). Data points from Reverse Observation Subblocks 2, 3, 4, and 5 relate to Experiments 2c, 2a, 2d, and 2b, respectively; compare Figure 2. Tests were one-sided one-sample t-tests against μ = 0. Error bars depict symmetric 95% CIs. ***p = .0004. *p < .0351. ns p = .3248.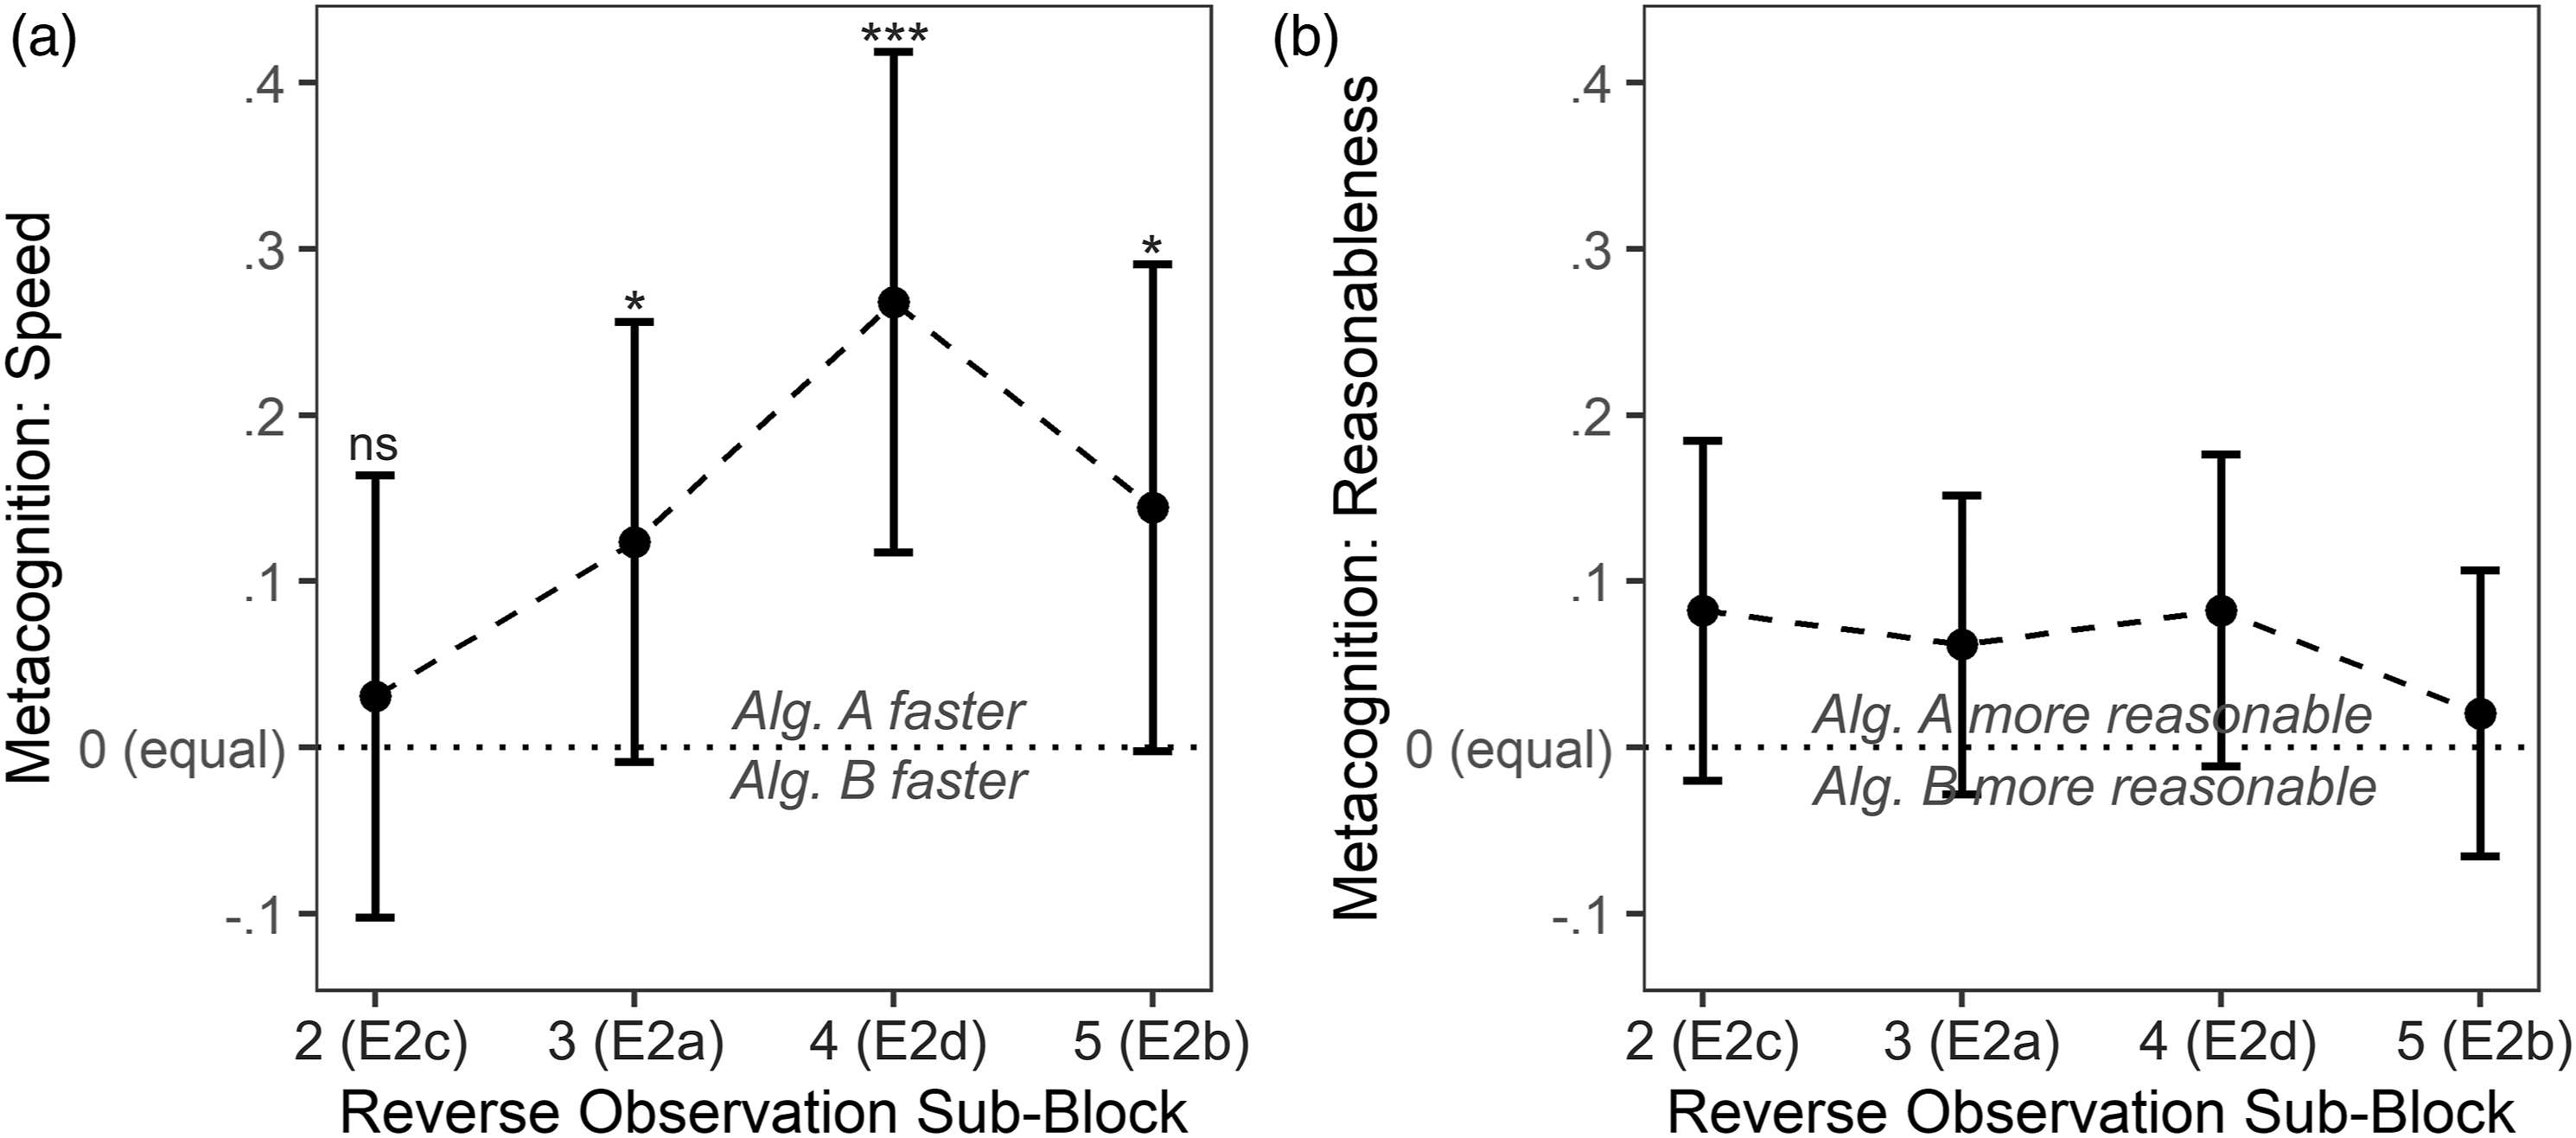
With 79%, a higher proportion of participants than in Experiment 1 indicated that both algorithms provided equally reasonable answers. This descriptive increase suggests that our design change implemented to decrease choice variance related to reasonableness considerations was successful. That participants were rating Algorithm A and B as similarly accurate can also be inferred from Figure 6(b) that mirrors Figure 6(a) and displays reasonableness metacognition rather than speed metacognition.
Discussion
In the present Experiment 2a, the primacy effect that only surfaced in speed-related metacognition but not algorithm preference in Experiment 1c was now evident in both metacognition and algorithm preference. The CS that was initially faster during observation was preferred in the choice block. With a difference in choice proportions of 12.4 percentage points (56.2% Algorithm A, 43.8% Algorithm B), the effect seems large enough to be of practical relevance. We want to emphasize that this substantial difference emerged despite the fact that both algorithms had an exactly identical processing speed when averaged over the whole observation block and that algorithm labels and order were carefully counterbalanced between participants.
EXPERIMENTS 2b–d
Experiments 2b–d were conducted to further explore the timeline of the primacy effect and also probe a possible recency effect. Methodically and conceptually, Experiments 2b–d were identical to Experiment 2a, the only difference being the position of the observation subblock in which the initially fast algorithm is slow (i.e., the reverse observation subblock); compare Figure 2. We decided to describe the manipulations in Experiment 2 with different letters a–d because we purposefully first showed the existence of a primacy effect in Experiment 2a before further exploring the effect. Here, we omitted numbered hypotheses to convey that the present hypotheses extend beyond the preregistered hypotheses and are of more explorative nature than H2.
So far, in Experiment 2a, a primacy effect has been found when comparing the first to the third observation subblock. With Experiment 2b, we investigated whether a primacy effect is also evident when comparing the first with the last observation subblock. If no primacy was found, or even an effect opposite to Experiment 2a was found, this would provide first evidence for a recency effect that counteracts primacy. Recency is well-documented for memory-based processing and relates to a better recall of recently presented items (e.g., Capitani et al., 1992; Glanzer & Cunitz, 1966; Tversky & Kahneman, 1973) but was also shown for performance evaluations (i.e., more recent performances have more weight in performance evaluation; Steiner & Rain, 1989). It thus seems reasonable that internally stored recent episodes of time monitoring are easier to access and thus overrepresented in decisions that are based on these observed durations. In other words, if solving a certain task with one CS took particularly long during the last few encounters, a performer should be more inclined to switch to another CS even if overall performance was comparable. However, contrarily, more recent episodes of time monitoring might also be underrepresented in memory: Resources allocated to time monitoring might linearly decrease over time due to lower general arousal (reviewed by, e.g., Treisman, 1963), less focus and more mind wandering (compare Terhune et al., 2017), or depleted resources (vigilance decrement; reviewed by Warm et al., 2008).
Experiments 2cd were conducted to investigate whether a primacy effect is still evident if the reverse observation subblock is close in time to the first subblock (Reverse Observation Subblock 2, Experiment 2c) or close in time to the last observation subblock, and thus closer to a possible recency effect (Reverse Observation Subblock 4, Experiment 2d). In other words, Experiments 2c was conducted to investigate if primacy-related processes extend from the first into the second observation subblock, which would manifest in a nonsignificant primacy effect in this specific case. Complementarily, Experiment 2d was conducted to investigate if potential recency-related processes extend from the last to the second-to-last observation subblock.
Methods
Participants
For Experiment 2b, 102 participants were measured and data from 97 participants (mean age 38.6 years; age range 19–75; 49 female, 48 male) were used for analyses. Five participants with a mean trial time (observation and choice trials combined) above or below 2.5 sample SDs from the grand mean were excluded from analyses.
For Experiment 2c, 105 participants were measured and data from 97 participants (mean age 35.1 years; age range 19–68; 46 female, 49 male, 1 nonbinary, 1 did not want to disclose) were used for analyses. Five participants with a mean trial time (observation and choice trials combined) above or below 2.5 sample SDs from the grand mean were excluded from analyses. Additionally, we excluded three participants because of a screen refresh rate below 10 Hz.
For Experiment 2d, 101 participants were measured and data from 97 participants (mean age 36.3 years; age range 19–64; 48 female, 49 male) were used for analyses. One participant with a mean trial time (observation and choice trials combined) above or below 2.5 sample SDs from the grand mean were excluded from analyses. Additionally, we excluded three participants because of a screen refresh rate below 10 Hz.
Sample sizes for all three experiments are based on a one-sided one-sample dependent t-test in G*Power (version 3.1.9.2, Faul et al., 2007); alpha = .05, 1 - beta = .9, small effect size d = .3.
Apparatus
The same setup as in Experiment 1a was used. Screen frame rates ranged between 12 Hz and 165 Hz with a mean of 69.5 Hz for Experiment 2b, between 11 Hz and 333 Hz with a mean of 62.7 Hz for Experiment 2c, and between 15 Hz and 248 Hz with a mean of 66.1 Hz for Experiment 2d.
Procedure, Task, and Stimuli
Experiments 2b–d were identical to Experiment 2a, the only difference being the position of the observation subblock in which the initially fast algorithm is slow (i.e., the reverse observation subblock); compare Figure 2.
Analyses
The same analyses as described for Experiment 2a were applied.
Results
Experiment 2b
In choice data, no primacy effect was found. Thus, a recency effect seems possible. Specifically, participants did not prefer choosing the algorithm in the choice block that was faster in the first observation subblock in comparison to the algorithm that was faster in the last (i.e., fifth) observation subblock. M = 52.0%, μ = 50.0%, t (96) = .7, p = .2562, d = .07, 95% CI d = [−.14, .27]. For reasons of comparability, the p-value is based on a one-sided test as also employed in, e.g., Experiment 2a. A two-sided t-test would have been an equally reasonable choice to allow for a recency effect that is stronger than a primacy effect, that is, an “opposite primacy effect,” which was however already impossible descriptively. Descriptively, differences were more pronounced but also not statistically significant when only considering the first choice trial; M = 55.7%, μ = 50.0%, t (96) = 1.1, p = .1331, d = .11, 95% CI d = [−.11, .29].
We also report metacognition in an analogous manner to Experiment 2a. Descriptively, results were highly similar to but a little bit less pronounced than in Experiment 2a: 35% of participants thought that Algorithm A was the faster algorithm whereas 21% thought that Algorithm B was faster; 44% of participants thought that both algorithms were equally fast. This effect is also backed by inferential statistics as indicated by a one-sided one-sample t-test employed analogously to the one in Experiment 2a; M = .14 on a scale from −1 to 1, μ = 0, t (96) = 1.9, p = .0282, d = .20, 95% CI d = [−.01, .40]. This finding would support a primacy effect and is contrasting the choice results. With 81%, a similar proportion of participants than in Experiment 2a indicated that both algorithms provided equally reasonable answers. Metacognition results are summarized in Figure 6.
Experiment 2c
Again, in choice data, no primacy effect was found. Specifically, participants did not prefer choosing the algorithm in the choice block that was faster in the first observation subblock in comparison to the algorithm that was faster in the second observation subblock. M = 49.0%, μ = 50.0%, t (96) = −.4, p = .6500, d = −.04, 95% CI d = [−.23, .16]. This finding was mirrored when only considering the first choice trial; M = 44.3%, μ = 50.0%, t (96) = −1.1, p = .8669, d = −.11, 95% CI d = [−.36, .05]. The data pattern is consistent with the assumption that the time window for evidence accumulation which produced a primacy effect in Experiment 2a expands at least up to the second observation block.
We also report metacognition in an analogous manner to Experiments 2ab. Descriptively, results were dissimilar to Experiments 2ab: only 24% of participants thought that Algorithm A was the faster algorithm whereas 20.5% thought that Algorithm B was faster; 55.5% of participants thought that both algorithms were equally fast. Consequentially, inferential statistics as indicated by a one-sided one-sample t-test employed analogously to the ones in Experiment 2ab did not indicate dissimilar speed evaluations between Algorithms A and B; M = .03 on a scale from −1 to 1, μ = 0, t (96) = .5, p = .3248, d = .05, 95% CI d = [−.15, .25]. This finding is congruent to the reported choice behavior. With 73%, a slightly lower proportion of participants than in Experiments 2ab indicated that both algorithms provided equally reasonable answers. Metacognition results are summarized in Figure 6.
Experiment 2d
A primacy effect was found. Thus, a possible recency effect is likely confined to the last ten trials. Specifically, participants preferred choosing the algorithm in the choice block that was faster in the first observation subblock in comparison to the algorithm that was faster in the second to last (i.e., the fourth) observation subblock. M = 57.2%, μ = 50.0%, t (96) = 2.4, p = .0102, d = .24, 95% CI d = [.03, .46]. This finding was mirrored when only considering the first choice trial; M = 59.8%, μ = 50.0%, t (96) = 2.0, p = .0266, d = .20, 95% CI d = [−.01, .39].
Again, we report metacognition in an analogous manner to Experiments 2abc. Descriptively, results were similar to Experiments 2ab with even more pronounced differences between Algorithms A and B: 45% of participants thought that Algorithm A was the faster algorithm whereas 19% thought that Algorithm B was faster; 36% of participants thought that both algorithms were equally fast. Inferential statistics as indicated by a one-sided one-sample t-test employed analogously to the ones in Experiment 2abc confirmed the difference; M = .27 on a scale from −1 to 1, μ = 0, t (96) = 3.5, p = .0004, d = .35, 95% CI d = [.13, .58]. This finding is in congruence with the reported choice behavior. With 77%, a proportion of participants comparable to in Experiments 2abc indicated that both algorithms provided equally reasonable answers. Metacognition results are summarized in Figure 6.
Discussion
Results from Experiments 2a–d strongly suggest that first encounters—and possibly also recent encounters—are of increased relevance not only for to-be remembered items but also for to-be monitored cognitive strategies. Additionally, data from Experiment 2c suggests that primacy is not confined to evidence accumulated in just the first 10 trials, but likely includes evidence accumulated in the first 20 trials (Experiment 2c) or possibly even 30 trials as suggested by the metacognitive primacy effect which peaked not until Experiment 2d.
Interestingly, as evident in Experiment 2b, a possible recency effect did not supersede the primacy effect (which contrasts findings from serial recall; Capitani et al., 1992; Glanzer & Cunitz, 1966). Quite contrarily, metacognitive speed evaluations suggest that primacy superseded recency. Given the present design, such a weak recency effect might however not be surprising. In their seminal paper, Glanzer and Cunitz (1966) were able to reduce or eliminate a recency effect by introducing a 10 or 30 seconds delay between learning and recall, respectively. Given the present block design and a participant-paced break between learning (i.e., observation) and choice, a delay of at least 10 s seems likely. Thus, weak or nonexisting recency in the present data is well in line with the classic working-memory-interpretation of recency. To more clearly delineate recency independently from primacy, we conducted Experiment 3.
EXPERIMENTS 3ab
Experiment 3 was conducted to investigate a possible recency effect in a similar manner we investigated the primacy effect. So far, to investigate primacy, one algorithm had always been faster in the first observation subblock. Analogously, in Experiment 3, one algorithm had always been faster in the last observation subblock; compare Figure 2. Specifically, we investigated the following hypothesis in Experiment 3a:
Recency Effect (within design): Algorithm A, which was fast at the end (last 20% of trials, i.e., Observation Subblock 5) is preferred over Algorithm B, which was fast in the middle (between 40% and 60% of trials, i.e., Observation Subblock 3) of an observation block. Preference is defined as Algorithm A choice proportion in a choice block. In Experiment 3b, we followed up on Experiment 3a and explored whether a recency effect is present when comparing Observation Subblocks 5 and 4 instead of 5 and 3. For Experiment 3b, no numeric hypothesis was used to emphasize the more exploratory nature of that experiment.
Methods
Participants
For Experiment 3a, 103 participants were measured and data from 97 participants (mean age 35.1 years; age range 19–68; 48 female, 47 male, 2 nonbinary) were used for analyses. Three participants with a mean trial time (observation and choice trials combined) above or below 2.5 sample SDs from the grand mean were excluded from analyses. Additionally, we excluded three participants because of a screen refresh rate below 10 Hz.
For Experiment 3b, 100 participants were measured and data from 97 participants (mean age 35.1 years; age range 19–68; 51 female, 46 male) were used for analyses. Three participants with a mean trial time (observation and choice trials combined) above or below 2.5 sample SDs from the grand mean were excluded from analyses.
Apparatus
The same setup as in Experiment 1a was used. In Experiment 3a, screen frame rates ranged between 20 Hz and 145 Hz with a mean of 69.0 Hz. In Experiment 3b, screen frame rates ranged between 10 Hz and 165 Hz with a mean of 63.5 Hz.
Procedure, Task, and Stimuli
Except for the changes mentioned at the beginning of section Experiment 3 (compare Figure 2), procedure, task, and stimuli were identical to Experiment 1c.
Analyses
As in Experiments 1 and 2, the DV was the proportion in which Algorithm A was chosen during the choice block. If that value was above 50%, H3 would be confirmed. The hypothesis was tested with a one-sided one-sample t-test testing against 50%.
Results
Experiment 3a
H3 is not confirmed: In Experiment 3a, participants exhibited no recency effect. Specifically, participants did not—not even descriptively—prefer the algorithm in the choice block that was faster in the fifth observation subblock in comparison to the algorithm that was faster in the third observation subblock; M = 47.8%, μ = 50.0%, t (96) = −.8, p = .7810, d = −.08, 95% CI
d
= [−.27, .13]; Figure 7, Reverse Observation Subblock 3. Results also provide no support for recency when only considering the first choice trial; M = 41.1%, μ = 50.0%, t (69) = −1.7, p = .9580, d = −.18, 95% CI
d
= [−.41, .01]; Figure S4, Observation Subblock 3. Algorithm preference in choice blocks of experiments 3ab. Note. Each dot summarizes data from one of the Experiments 3a–b. Specifically, data points from Reverse Observation Subblocks 3 and 4 relate to Experiments 3a and 3b, respectively; compare Figure 2. Values above 50% would be indicative of a recency effect. Within-experiment tests were one-sided t-tests against chance level μ = .5. The underlying averages of individual participants are depicted in Figure S1c. Note that, in contrast to Figure 5, reverse subblocks are defined as reverses of Subblock 5, not as reverses of Subblock 1; compare Figure 2. Error bars depict 95% CIs. Alg. = Algorithm. E = Experiment. p >= .7110.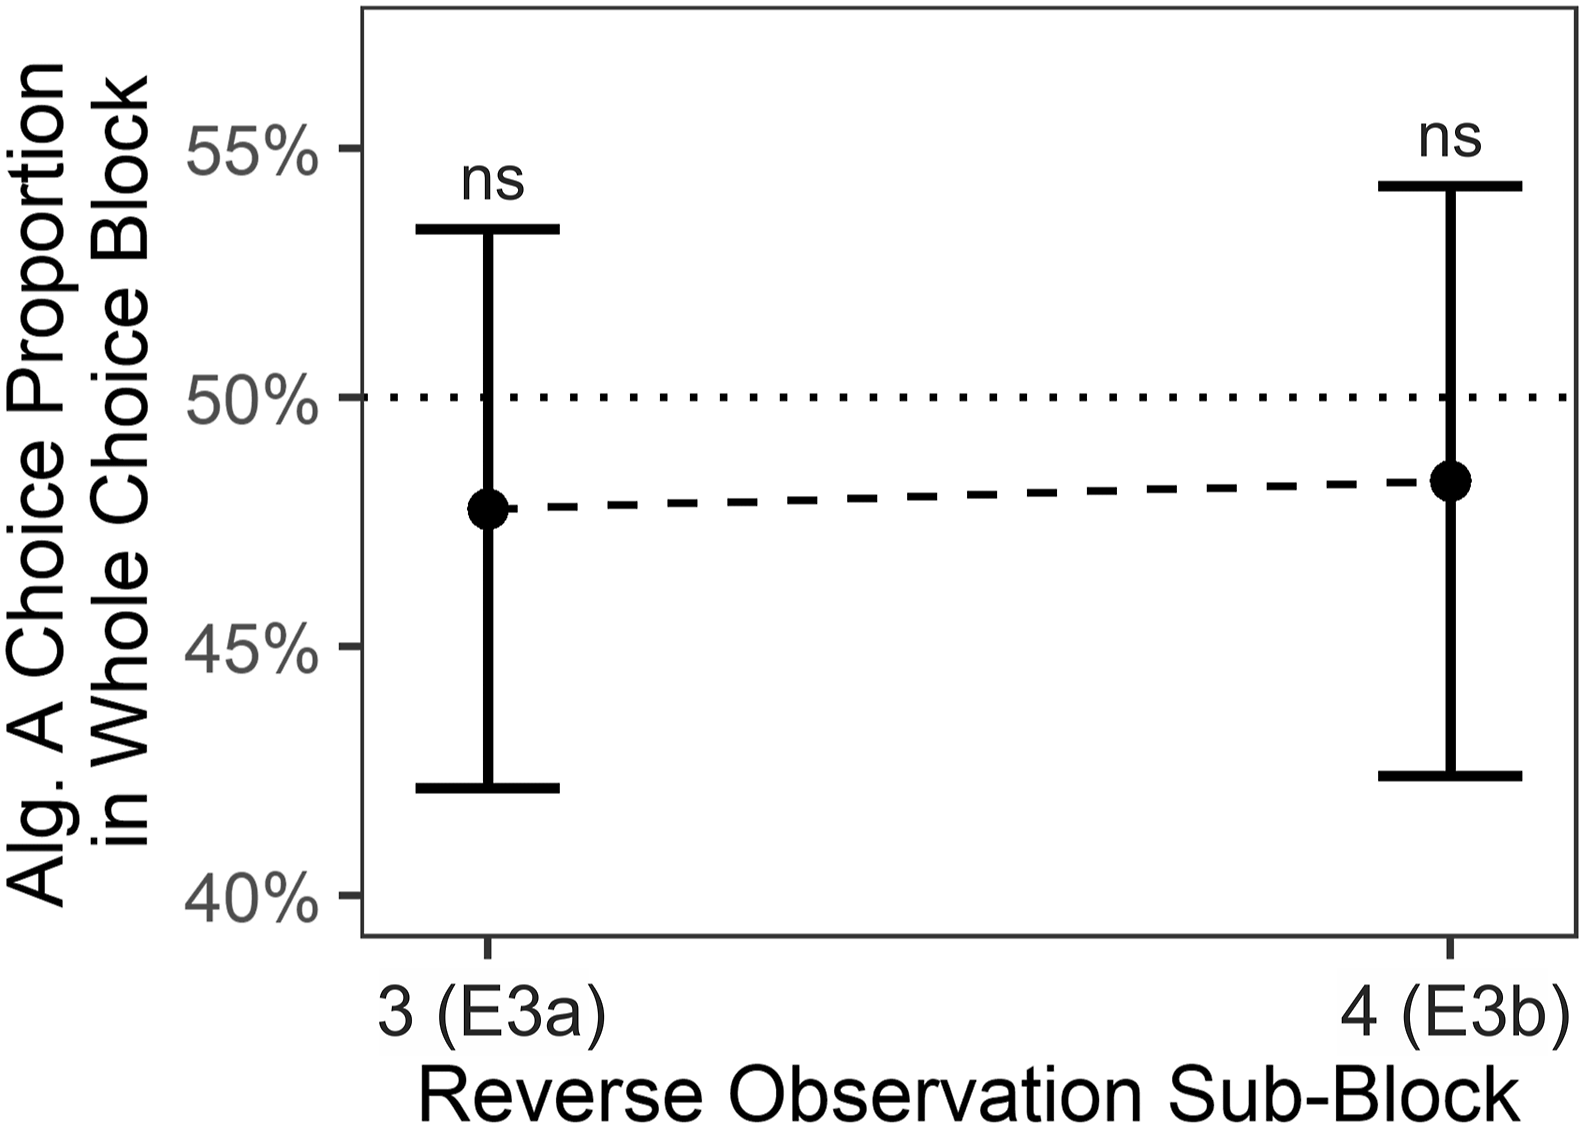
Metacognitive ratings also provide no support for a recency effect. Only 24% of participants thought that Algorithm A was the faster algorithm whereas 32% thought that Algorithm B was faster; 44% of participants thought that both algorithms were equally fast. Accordingly, a one-sided one-sample t-test employed analogously to the one in Experiment 2a did also not support a recency effect; M = −.08 on a scale from −1 to 1, μ = 0, t (96) = −1.1, p = .8607, d = −.11, 95% CI
d
= [−.31, .10]. With 87%, a high proportion of participants indicated that both algorithms provided equally reasonable answers. Metacognition results are summarized in Figure 8. Algorithm preference and metacognitive ratings in Experiment 3. Note. Individual data was based on three answer options for both a (A faster was coded as 1, equal was coded as 0, B faster was coded as −1) and b (A more reasonable was coded as 1, equal was coded as 0, B more reasonable was coded as −1). Data points from Reverse Observation Subblocks 3 and 4 relate to Experiments 3a and 3b, respectively; compare Figure 2. Positive values would be indicative of a recency effect. Tests were one-sided one-sample t-tests against μ = 0. Error bars depict 95% CIs. ***p = .0004. *p < .0351. ns p >= .5000.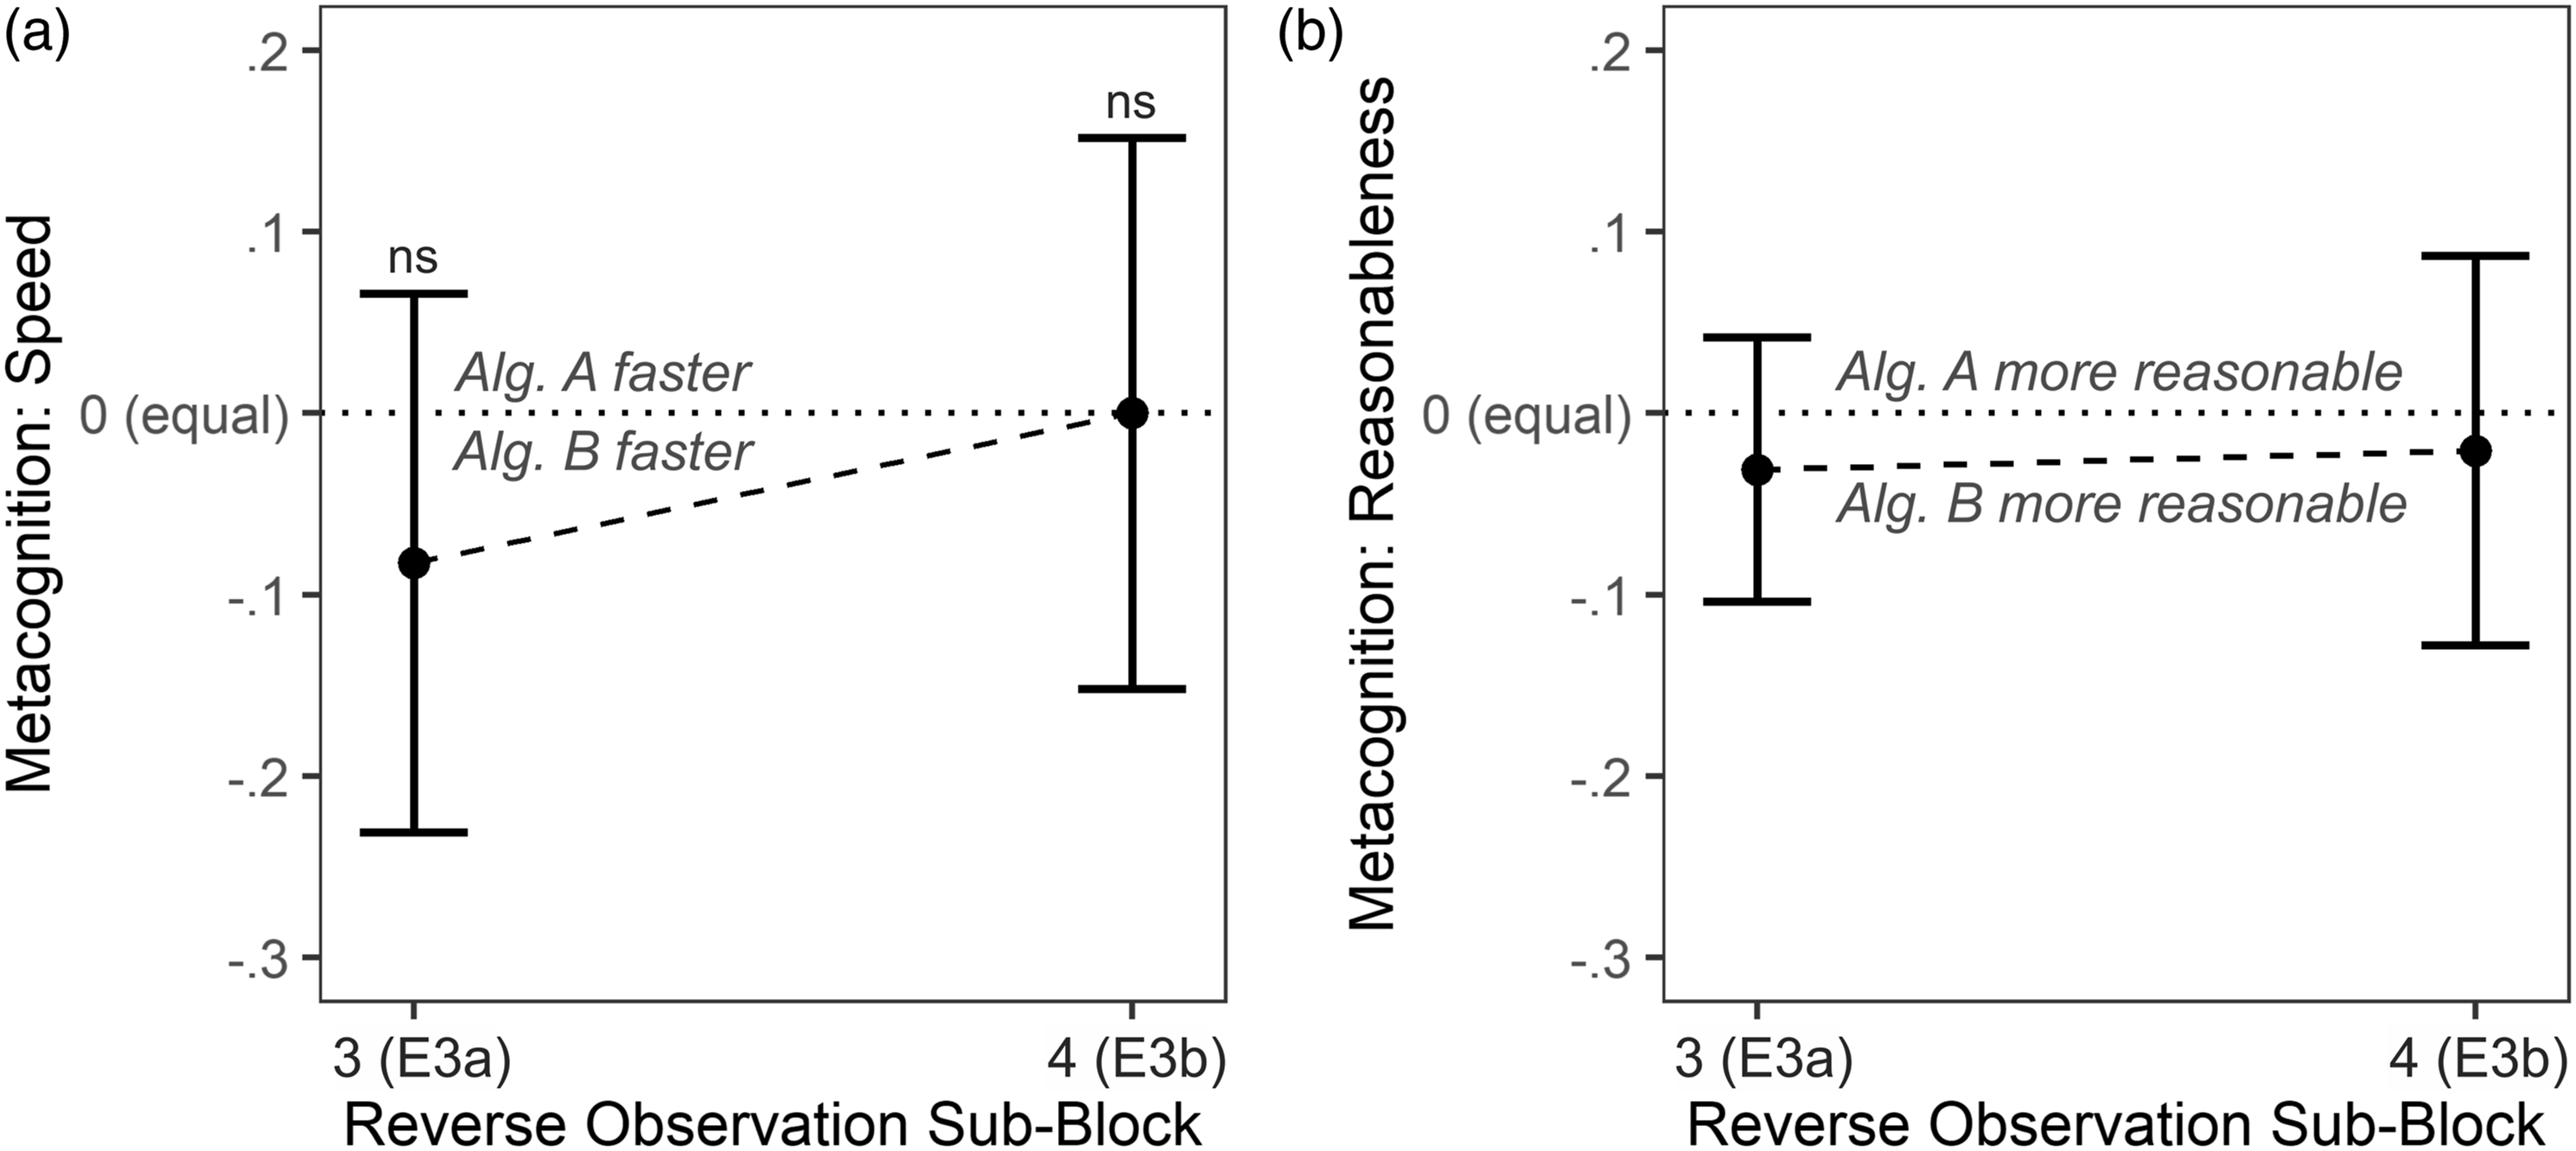
Experiment 3b
Results were highly similar to the results obtained in Experiment 3a. Again, participants exhibited no recency effect. Participants did not prefer the algorithm in the choice block that was faster in the fifth observation subblock in comparison to the algorithm that was faster in the fourth observation subblock; M = 48.3%, μ = 50.0%, t (96) = −.6, p = .7110, d = −.06, 95% CI d = [−.25, .16]; Figure 7, Reverse Observation Subblock 4. Results also suggest no recency effect when only considering the first choice trial; M = 46.4%, μ = 50.0%, t (96) = −.7, p = .7600, d = −.07, 95% CI d = [−.29, .09]; Figure S4, Observation Subblock 3.
As in Experiment 3a, metacognitive ratings supported the absence of a recency effect. Only 29% of participants thought that Algorithm A was the faster algorithm, just as 29% also thought that Algorithm B was faster; 42% of participants thought that both algorithms were equally fast. Accordingly, a one-sided one-sample t-test employed analogously to the one in Experiment 3a did also not support a recency effect; M = .00 on a scale from −1 to 1, μ = 0, t (96) = 0, p = .5000, d = .00, 95% CI d = [−.22, .18]. With 71%, a large portion of participants indicated that both algorithms provided equally reasonable answers. Metacognition results are summarized in Figure 8.
Discussion
Experiment 3 provided no evidence for a recency effect. Experiment 3 was not able to tie the absence of primacy in algorithm preference of Experiment 2b to a recency effect. Instead, descriptively, performance differences observed in the third or second-to last observation subblock were more relevant to participants than differences observed in the last subblock. Given the block design and the self-paced delay between observation and choice block, the absence of recency is in line with the classic working-memory-interpretation of recency (Glanzer & Cunitz, 1966). However, results are not in line with findings of long-term recency (Davelaar et al., 2005) that were also present in performance appraisal (Steiner & Rain, 1989).
GENERAL DISCUSSION
How do people monitor different means of information acquisition and processing? The present results suggest that novel means are monitored more closely during an initial phase and monitored less thoroughly thereafter. This primacy effect was evident in two measures. First, participants preferred solving trivia questions with an algorithm that was fast at the beginning of an observation phase in comparison to an algorithm that was fast in the middle, even though both algorithms performed absolutely identical when considering the whole observation phase. Given the overall identical performance, the preference for the initially fast algorithm was, with 12–14 percentage points, substantial. Second, the primacy effect was also evident in metacognitive speed evaluations: participants perceived the initially fast algorithm as being faster overall. Again, the preference emerged despite the fact that both algorithms were, when considering the whole observation phase, equally fast. That primacy is not only evident in choice but also in metacognition data suggests an underlying mechanism that is related to performance monitoring and results in explicit knowledge. Surprisingly, exploring a possible recency effect with the same sensitivity as for primacy was to no avail.
Possible Underpinnings of Primacy
Delineating the mechanism behind the primacy effect was out of scope of the present investigation. Nevertheless, we engage in some speculations. If we accept the notion that monitoring a CS’s—here, an algorithm’s—performance is costly and can be modulated, it would be reasonable to put most effort in monitoring when the expected information gain is highest. For a naive observer, information gain should be highest when first encountering a novel CS, which would explain primacy. But how exactly could an effort modulation look like? One possibility is increased attention to sensory input during initial CS observation. With heightened attention, time estimates would be more precise (e.g., Grondin, 2010), which would justify primacy. A similar possibility is increased initial monitoring-related processing that is later on disengaged either to safe effort (cf. Kool et al., 2010) or to be able to engage in other processing (as indicated by mind wandering; Terhune et al., 2017). Relatedly, increased initial attention might mediate primacy by facilitating recall of initial encounters, including related metacognitive information, from long-term memory (cf. Capitani et al., 1992). More generally, less volitional attentional processes might also play a role: passively and continuously decrementing attention would be consistent with interpretations regarding primacy in impression formation (Hendrick & Costantini, 1970) and the inability of humans to consistently sustain high levels of attention (vigilance decrement; e.g., Warm et al., 2008).
Independent from such effort- and attention-related reasons for primacy, first encounters might set expectations that bias future perceptions and appraisals (cf. predictive coding; comprehensively reviewed by Clark, 2013). For example, it has been shown that the perceived performance of a fourth lecture was biased towards the performance of three previous lectures (Steiner & Rain, 1989), which is similar to the original change-in-meaning interpretation of primacy in impression formation (Asch, 1946). Thus, in the present study, participants might have established the expectation that Algorithm A is faster than Algorithm B, which might have biased future perceptions toward that expectation, cumulating in a primacy effect. Lastly, we want to note that since primacy was evident in both CS choice proportions and metacognition, our results would be consistent with a mediating role of metacognition in CS choice (e.g., Dunn et al., 2016; Risko & Gilbert, 2016; Weis & Wiese, 2020).
Limitations and Future Research
As discussed before, performance monitoring seems a tenable cause for primacy effects in the present study. Yet, other accounts cannot be excluded. For example, performance monitoring and thus information uptake might be constant across time but our memory might favor retrieval of initial memory episodes. Such deeper elaboration of initial items, possibly due to less inference, is a common explanation for primacy effects in serial recall (Murdock, 1962). Yet, it is unclear whether such deeper elaboration takes place under the present circumstances, which substantially differ from classic serial recall paradigms with word lists. Here, participants were instructed to monitor performance instead of explicitly recalling any of the monitored episodes.
In sum, the present research provides a promising starting point to understand the underpinnings of the reported primacy effect. Further research targeting these underpinnings might shed light onto whether the presently reported presence of primacy and absence of recency found when comparing two extended CSs generalizes to similar contexts, for example to situations in which exclusively mental CSs are compared to each other, or to real-life situations outside the lab.
CONCLUSION
Despite the mechanisms behind the reported technology-use primacy effect awaiting future research, the take-home message of the present research is clear-cut: The present results suggest that humans embedded in technologized environments tend to continue using whatever cognitive help they found beneficial in the beginning. Such an approach is adaptive when a CS continues being superior. But it can be bad news as primacy blinds users for future performance changes. So when users are acquainted to different CSs with time-varying performance, great care has to be taken to not induce strategy preferences that stand in the way of adaptive long-term performance.
Supplemental Material
Supplemental Material - Primacy Effects in Extended Cognitive Strategy Choice – Initial Speed Benefits Outweigh Later Speed Benefits
Supplemental Material for Primacy Effects in Extended Cognitive Strategy Choice: Initial Speed Benefits Outweigh Later Speed Benefits by Patrick P. Weis and Wilfried Kunde in Human Factors
Footnotes
Acknowledgments
This research was funded by the Deutsche Forschungsgemeinschaft (DFG, German Research Foundation)—463896411. We have no conflicts of interest to disclose. Special thanks go to Dr. Robert Wirth for psychological and content-related support during the design phase.
KEY POINTS
Human performers frequently use extended cognitive strategies to acquire or process information (e.g., acquire information with a search engine). Our results indicate that strategies that provided desired information faster during initial encounters are preferred (primacy). Furthermore, results also indicate that strategies that were faster during more recent encounters are not preferred (no recency). These effects, that is, primacy and no recency, hold even though speed of both available strategies was identical when averaged across all encounters. We conclude that great care is required when performers are first acquainted with novel cognitive strategies to avoid suboptimal long-term choices.
Author Contributions
This research was conceptualized by PPW, designed by PPW and WK, experimental code was written by PPW. Data collection was supervised, data was curated, and data was analyzed by PPW. Results were validated and visualized by PPW. The original draft was written by PPW with feedback from WK and reviewed and edited by WK. Funding was acquired by PPW. The project was administered and supervised by PPW.
Informed Consent
Informed consent was obtained from all participants included in the study.
Data Availability
Data, stimulus materials, and analytic code are available in an online repository [https://osf.io/r8wf7]. Experiment 1 was preregistered [![]() ].
].
IRB Approval
The research complied with the tenets of the Declaration of Helsinki and was exempt from review in accordance with the guidelines of the local Institutional Review Board.
Supplemental Material
Supplemental material for this article is available online.
Patrick Weis is a postdoc at the Cognition and Behavior Group at the Psychology Department of the Julius-Maximilians-Universität in Würzburg, Germany. He received his PhD in human factors and applied cognition from George Mason University in 2019. He also received an MS in Neuroscience from the University of Tübingen in 2014.
Wilfried Kunde is a professor of psychology and leading the Cognition and Behavior Group at the Julius-Maximilians-Universität in Würzburg, Germany. He received his diploma in psychology at the University of Hamburg in 1994 and his PhD at the Julius-Maximilians-Universität Würzburg in 1998.
References
Supplementary Material
Please find the following supplemental material available below.
For Open Access articles published under a Creative Commons License, all supplemental material carries the same license as the article it is associated with.
For non-Open Access articles published, all supplemental material carries a non-exclusive license, and permission requests for re-use of supplemental material or any part of supplemental material shall be sent directly to the copyright owner as specified in the copyright notice associated with the article.