
Abstract
Objective
This study uses a detection task to measure changes in driver vigilance when operating four different partially automated systems.
Background
Research show temporal declines in detection task performance during manual and fully automated driving, but the accuracy of using this approach for measuring changes in driver vigilance during on-road partially automated driving is yet unproven.
Method
Participants drove four different vehicles (Tesla Model 3, Cadillac CT6, Volvo XC90, and Nissan Rogue) equipped with level-2 systems in manual and partially automated modes. Response times to a detection task were recorded over eight consecutive time periods.
Results
Bayesian analysis revealed a main effect of time period and an interaction between mode and time period. A main effect of vehicle and a time period x vehicle interaction were also found.
Conclusion
Results indicated that the reduction in detection task performance over time was worse during partially automated driving. Vehicle-specific analysis also revealed that detection task performance changed across vehicles, with slowest response time found for the Volvo.
Application
The greater decline in detection performance found in automated mode suggests that operating level-2 systems incurred in a greater vigilance decrement, a phenomenon that is of interest for Human Factors practitioners and regulators. We also argue that the observed vehicle-related differences are attributable to the unique design of their in-vehicle interfaces.
Keywords
INTRODUCTION
Automated driving systems are designed to assist in the task of driving. Partially automated or level-2 systems (SAE, 2021) are among the most widely adopted, with recent data indicating the number of level-2 systems on the road grew by 78% worldwide in 2020 relative to the year prior (Canalys, 2021). When operational, a level-2 system can control vehicle’s acceleration and steering. However, it is still the responsibility of the human driver to monitor operations and resume manual control should the system disengage or an emergency takeover be necessary. Expectations are that level-2 systems will make driving safer by, for example, helping the human driver maintain control of the vehicle during the ebb and flow of driving dictated by the ever-changing road and traffic conditions. However, as suggested by the accidents and preliminary crash data involving vehicles equipped with level-2 systems (e.g., NHTSA, 2022; NTSB, 2020b, 2020a; Rocca, 2022; Smyth et al., 2018), operating these systems may incur in a higher risk of driver disengagement.
Greenlee et al. (2017) investigated driver engagement during automated driving by having participants operate a simulated vehicle in fully automated (or level-5) mode while completing a detection task. As part of this task, participants were instructed to press a button every time a hazard was detected on the roadway. Hazards were presented at a rate of 30 events per minute. Task performance decreased over time with slower response times and lower accuracy observed as drivers’ experience with the system increased. Similar patterns were found in a later study (Greenlee et al., 2022) where the authors investigated differences in task performance when driving a simulator in manual or partially automated (level-2) mode. Upon encountering a parked vehicle on the side of the roadway, participants were instructed to press a button when the vehicle was perceived as being parked in an unsafe location (hazard) and ignore it when it was parked safely (nonhazard). Thirty vehicles per minute were presented to drivers. Comparable reductions in detection task performance were observed in the two driving modes with the rate of correct detections declining over time during both manual and level-2 driving, a phenomenon the authors attributed to vigilance decrement.
Vigilance decrement is the inability to sustain attention during the completion of a continuous task. Detection tasks have commonly been adopted for measuring vigilance decrements. In manual driving, Schmidt et al. (2009) had participants drive a simulated vehicle while completing a detection task wherein drivers were instructed to press a button in response to the presentation of intermittent stimuli. Stimuli were presented every 4 to 6 seconds. Response times to the detection task increased over time; a trend indicating a reduction in driver vigilance resulting from the state of under arousal experienced during the monotonous drive. Consistent patterns were observed in the studies by Roge et al. (2002) and Matthews & Desmond (2002) who also used detection tasks for measuring declines in vigilance during sustained manual driving. Similar approaches have been adopted to investigate vigilance decrements during partially automated driving. Körber et al. (2015) and Solís-Marcos et al. (2017) had participants complete a driving task wherein the simulated vehicle was being operated in level-2 mode. Participants completed a detection task responding to intermittent stimuli presented every 1 to 6 seconds. Physiological metrics were also recorded. Both studies observed significant reductions in drivers’ physiological activation in level-2 mode relative to manual driving. However, no effects of driving mode was found on detection task performance (see Cisler et al., 2019, and Heikoop et al., 2017, for similar results), questioning the effectiveness of using detection tasks for measuring vigilance decrements during level-2 driving (McWilliams & Ward, 2021).
In investigating driver behavior during partially automated driving, the existing research has largely done so using simulators (Boelhouwer et al., 2019; Heikoop et al., 2019; Zangi et al., 2022). The growing literature adopting realistic driving has predominantly conducted single-vehicle assessments. For example, Banks et al. (2018), Tenhundfeld et al. (2020), and Gaspar and Carney (2019) all investigated driver use of a level-2 system by having participants drive a single Tesla vehicle equipped with its proprietary partially automated system. Likewise, Solis-Marcos et al. (2018) and Ahlström et al. (2021) investigated level-2 system use with participants operating Volvo’s Pilot Assist. Drivers in Biondi et al. (2017)’s study used Honda’s Highway Driving Assist level-2 system. Though useful, these studies are unable to isolate the role that unique system characteristics play in determining driver behavior. For example, the recent survey study by Mueller and Cicchino (2022) posits a selective effect of level-2 system type on driver engagement in the driving task with, for example, users of Tesla Autopilot and Cadillac Super Cruise reporting more secondary task engagement than owners of Nissan ProPILOT Assist. Consistent data are also found in the survey study by Teoh (2020) wherein vehicle owners expressed diverging opinions on the perceived capabilities of five distinct level-2 systems (for similar findings, see AAA, 2019; Consumer Reports, 2023).
Our study has two objectives: 1. To use the detection task to investigate the occurrence of vigilance decrements during real-world partially automated driving. Prior work found declines in detection performance attributable to vigilance losses during manual driving (Matthews & Desmond, 2002; Schmidt et al., 2009), but related studies failed to replicate this effect during simulated partially automated driving (Cisler et al., 2019; Heikoop et al., 2017). Our study aims to explore this effect with participants driving a real-world level-2 system. 2. To explore the effect that operating different real-world partially automated systems have on detection task performance. While recent research has shown distinct driver perceptions and use of different level-2 systems (Teoh, 2020; Mueller and Cicchino, 2022), we wish to explore the occurrence of possible system-related effects on driver vigilance with participants driving four different vehicles each equipped with a proprietary level-2 system.
By investigating temporal changes in driver vigilance with participants driving separate real-world level-2 systems, our work adds to the existing literature exploring the human factors of vehicle automation and potential differences induced by system-specific characteristics.
METHOD
Participant
Participants (N = 71; 25 females; average age 40.8 years, standard deviation: 6.11) were recruited by word of mouth, referrals, and flyers in the greater Salt Lake City area, UT. Eligible participants had a valid driver’s license, no loss of consciousness or at-fault accidents in the past two years, and no prior experience operating level-2 systems. Driving records were reviewed by the research staff prior to participant enrollment as required by the University of Utah Risk Management Division. Participants were paid $20/hour. This research complied with the application approved by the Institutional Review Board at the University of Utah (IRB_120183) and all participants gave consent before testing began.
Design
Three factors were considered: mode (2 modes: partially automated, manual); partially automated systems (4 systems: Cadillac Super Cruise, Tesla Autopilot, Volvo Pilot Assist, Nissan ProPILOT Assist); and time period (8 periods: 1 through 8). All participants drove each vehicle twice: once in partially automated mode and once manual mode. The order of condition and vehicles was fully counterbalanced across participants. Each drive of approximately 20 minutes in duration was split into eight periods of approximately 2 minutes and 30 seconds each to have a sufficient number (n = 30) of detection task events within individual periods. No interruptions occurred within each drive, and the splitting of the data occurred after the study at the time of data processing and analysis.
MATERIALS AND PROCEDURE
Vehicles
Four vehicles classified as level-2 partial automation were utilized in testing: a 2019 Tesla Model 3 equipped with Autopilot, a 2018 Cadillac CT6 with Super Cruise, a 2018 Volvo XC90 with Pilot Assist, and a 2019 Nissan Rogue with ProPILOT Assist. Consistent with the SAE taxonomy of driving automation systems, all four vehicles were equipped with level-2 systems that had the capacity to engage longitudinal (Adaptive Cruise Control) and latitudinal (Lane Centering) control simultaneously (SAE, 2021). Adaptive Cruise Control (ACC) is defined as the vehicle’s ability to dynamically adjust and maintain speed at a preset following distance. In all four vehicles, ACC is required to be manually engaged at the start of each drive by selecting a maximum speed and minimum following distance. Therefore, participants were instructed to set the vehicle’s speed to the legal speed limit of the interstate and to set the following distance to the highest distance possible for each vehicle (more details in Figure 1). For the purposes of the study, both ACC and Lane Centering remained engaged the whole drive when driving in level-2 mode. More information on the level-2 systems available on the four vehicles are presented in Figure 1. Selected differences between the four vehicles and systems. Table A includes information about the four systems, and data from the studies by Consumer Reports (2023)* and Teoh (2020)** collected with vehicle owners and expert assessors, respectively. B shows details of the four systems: Tesla (top left, credit: Tesla website), Volvo (top right, credit: Volvo website), Nissan (bottom left, credit: Nissan website), Cadillac (bottom right, credit: Cadillac website).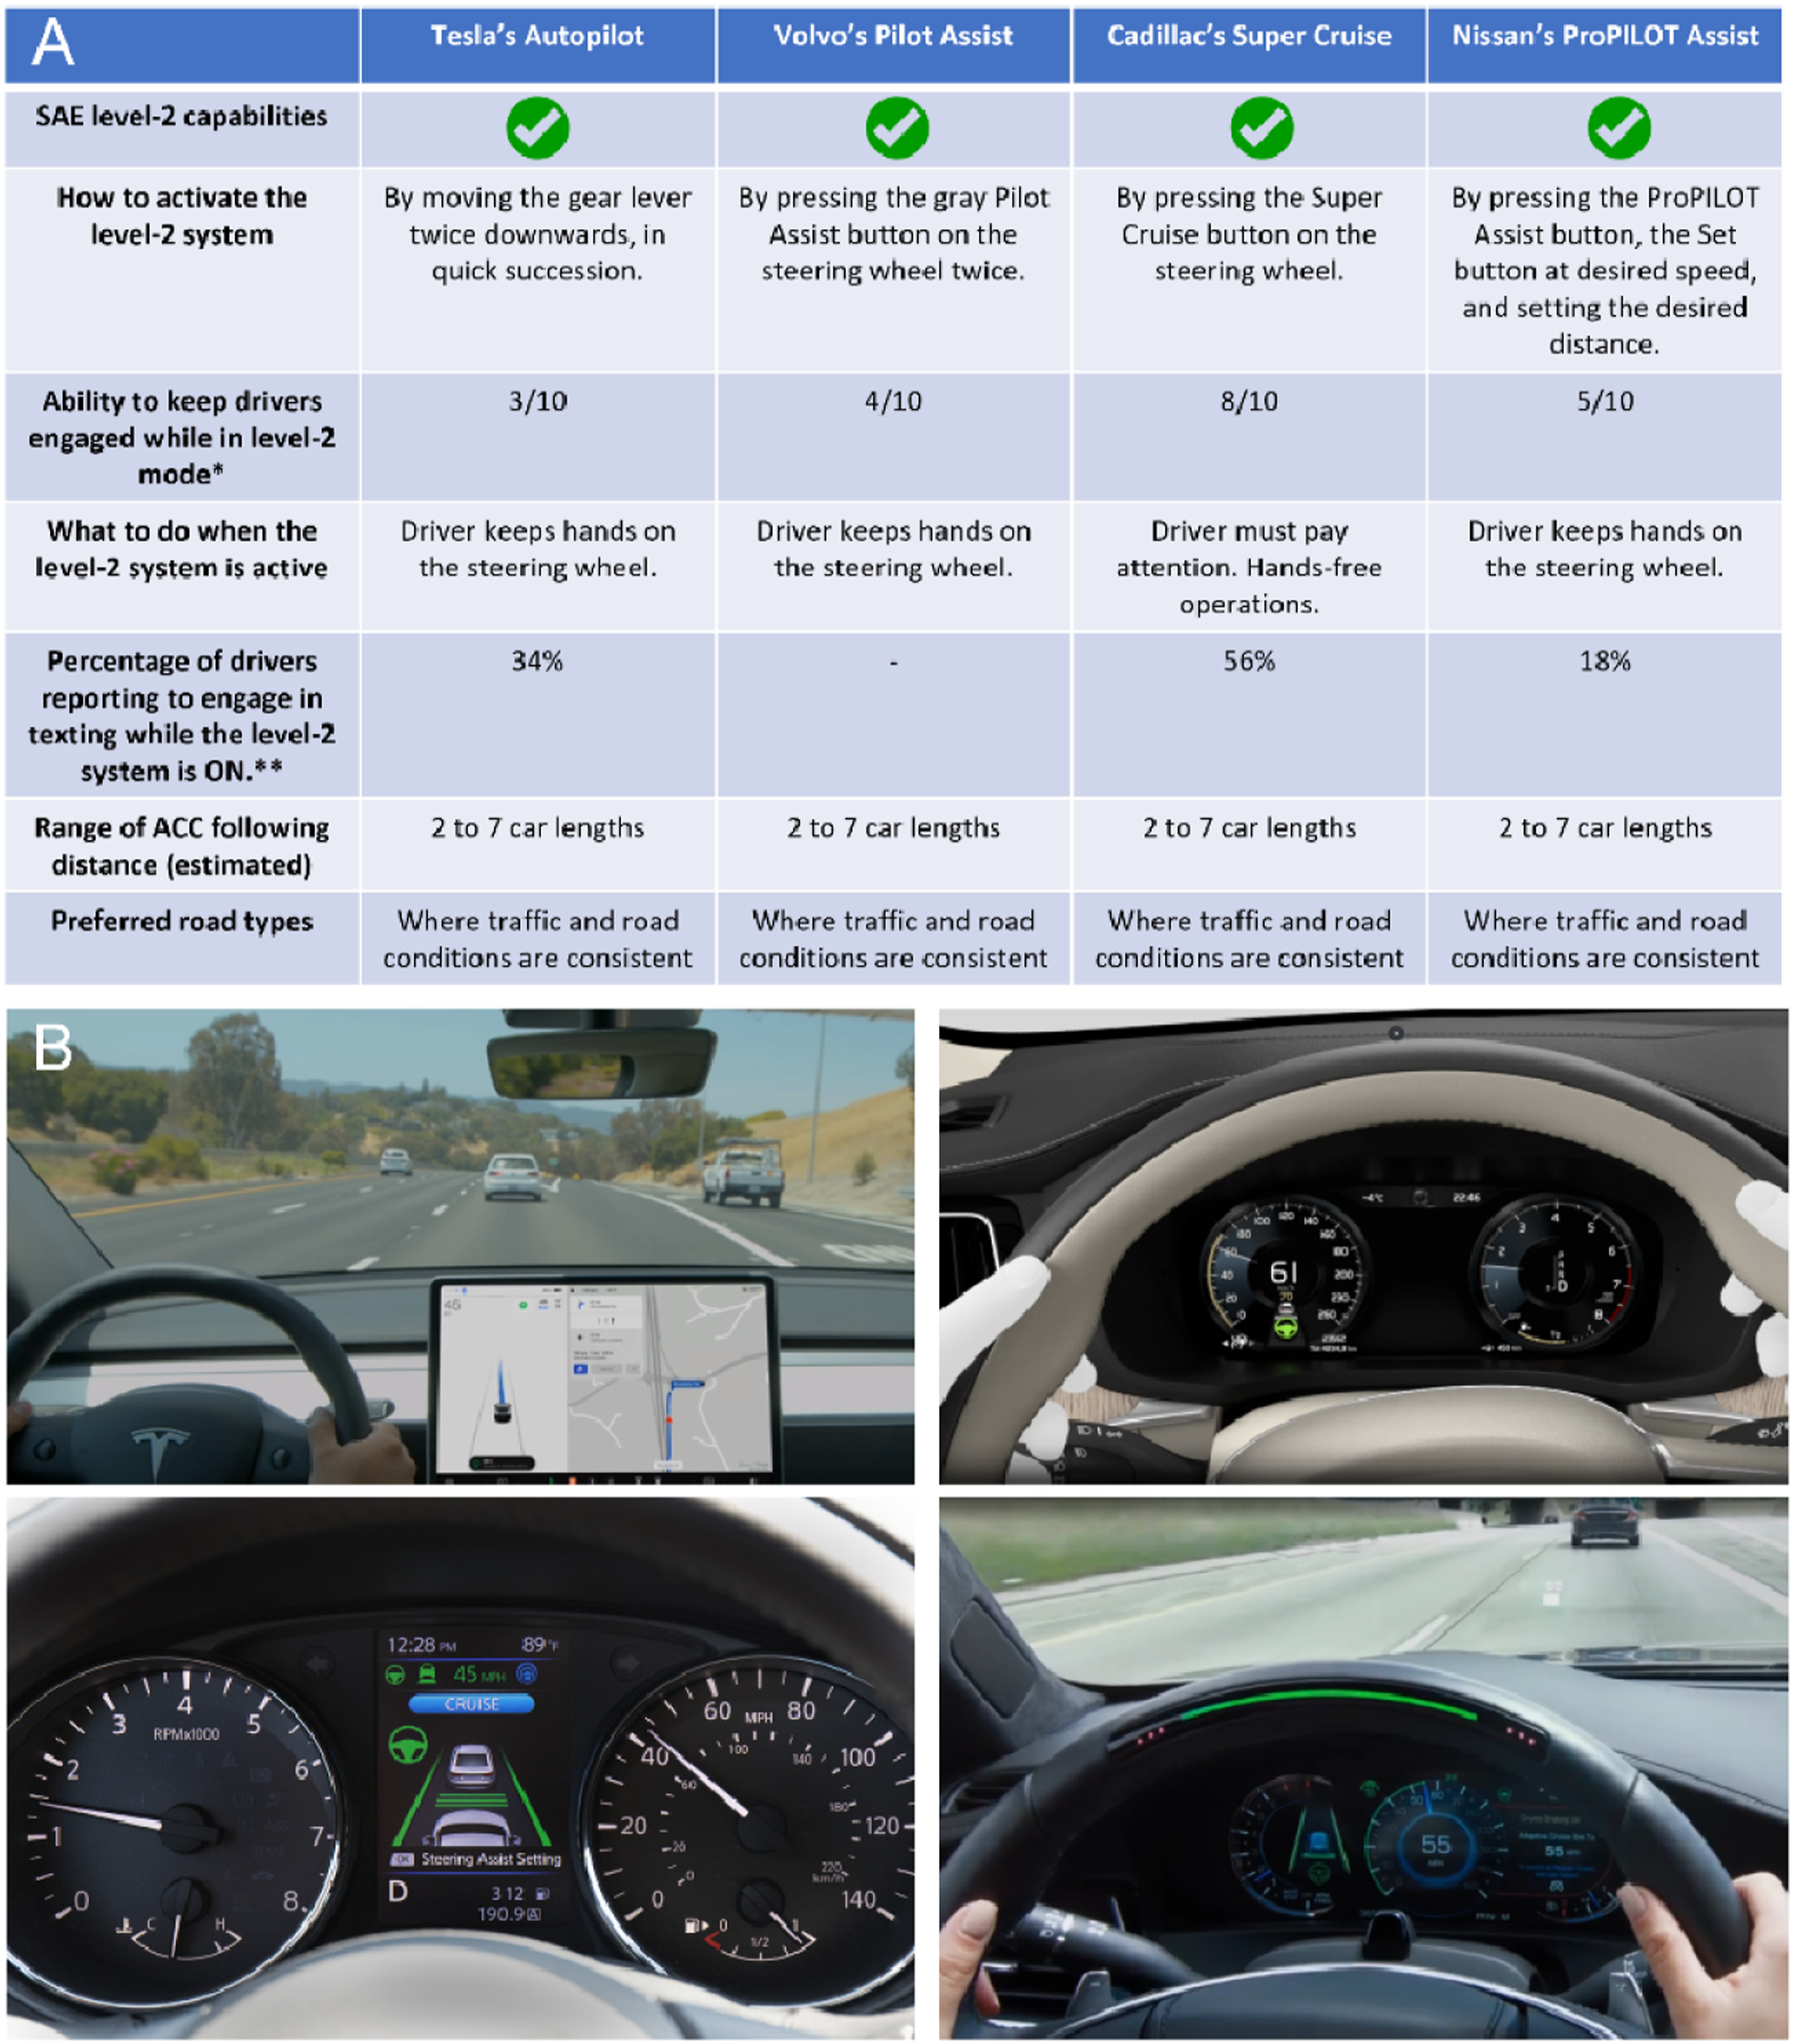
Route
The experimental phase of the study took place on US Interstate-80 between Exit 134 near Salt Lake City, UT, and exit 155 near Wanship, UT (Figure 2). This mountainous, curvy interstate was chosen as it provides a demanding but low-trafficked driving experience. The stretch of the interstate driven in this study has two to three lanes in each direction and a speed limit of 60 mph, though participants were instructed to drive with the speed of traffic but not exceed the speed limit. Participants were not instructed to drive in any particular lane of travel. Each participant drove on I-80 in both driving modes such that they drove one direction in manual mode and the opposite direction in partially automated mode. The Average Annual Daily Traffic (AADT) for this section of I-80 is 19,000 vehicles (Utah Department of Transportation). The study took place between 9am and 3pm on weekdays. Map of the training route on Interstate 215 and a section of Interstate 80 (in blue) and of the experimental route between exit 134 near Salt Lake City, UT, and exit 155 near Wanship, UT (in red).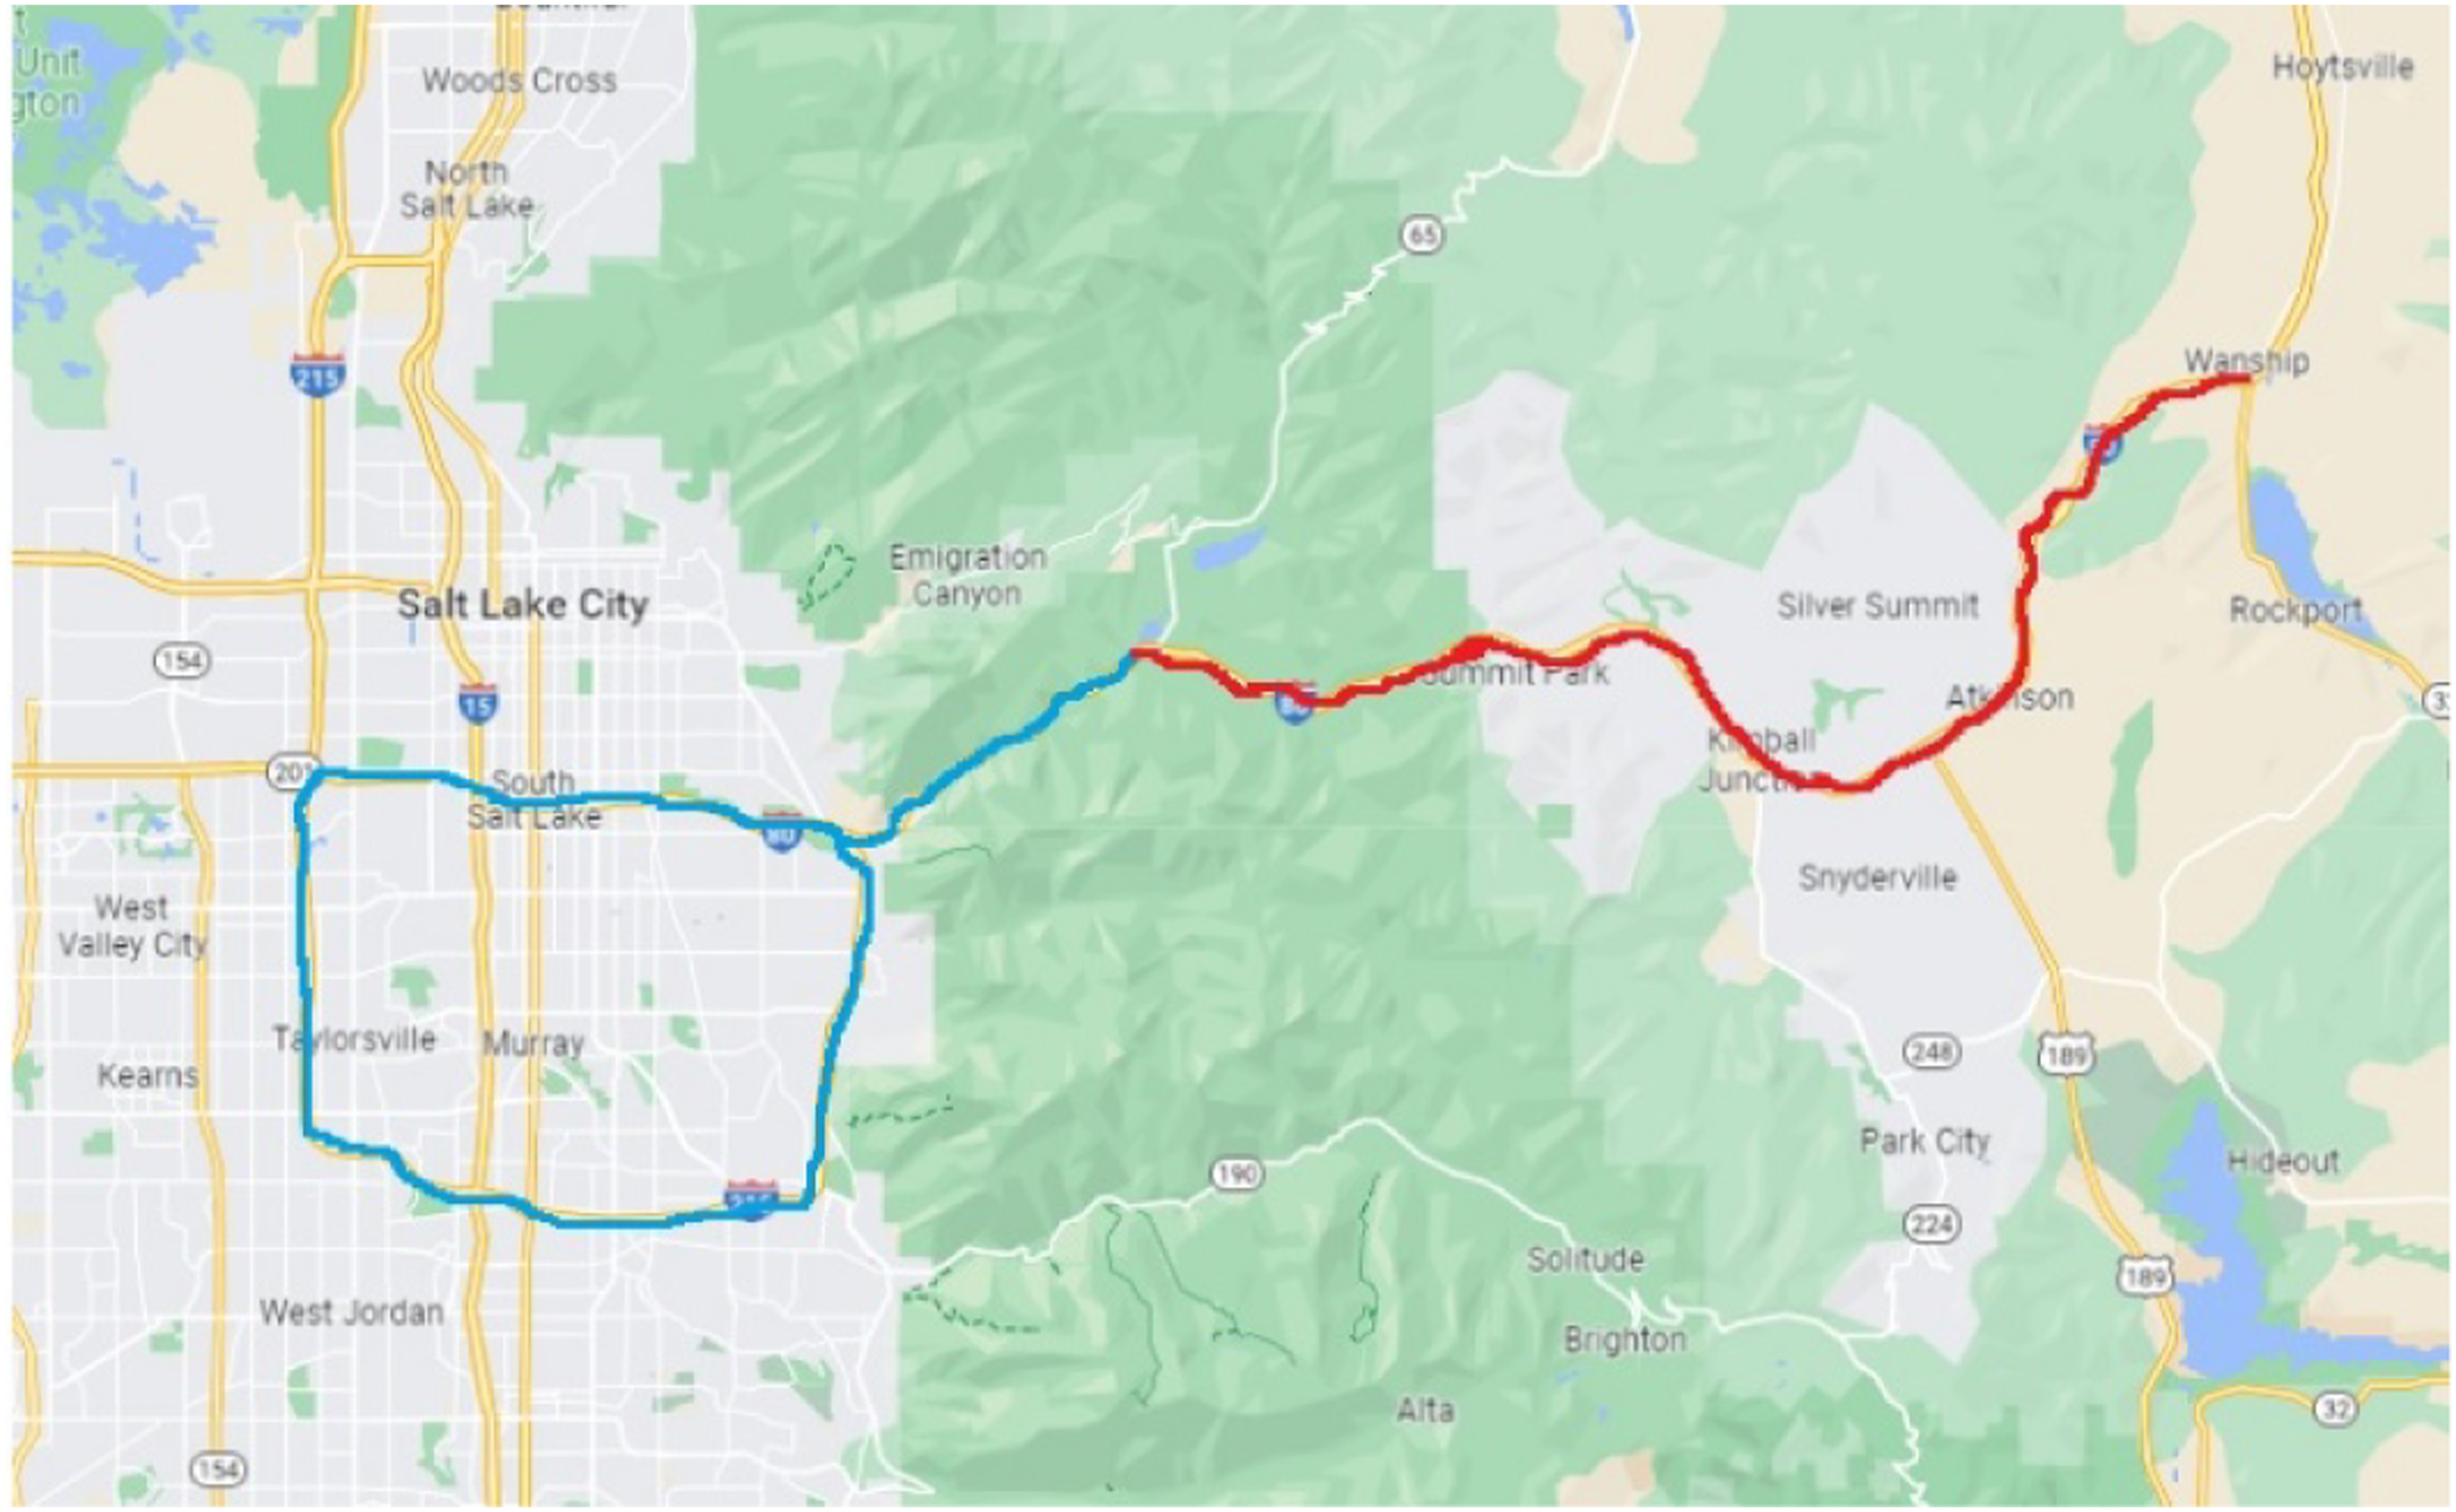
Detection Task
Participants were instructed to complete a detection task with characteristics similar to the one adopted by Schmidt et al. (2009), Körber et al. (2015) and Solís-Marcos et al. (2017). A small, vibrating motor device was fitted onto the participants’ left forearm and a microswitch response button on their right index or middle finger. The vibration lasted 1 second or until the participant responded. The vibration stimulus was presented quasi-randomly every 3–5 seconds and participants were instructed to respond to the stimulus as quickly as they could by pressing the microswitch against the steering wheel. Reaction times (RT; in milliseconds) were recorded. Detection response times were filtered to remove RT shorter than 100 ms and longer than 2,500 ms. Average RT were then computed for each participant, driving mode, vehicle, and time period. The characteristics of the chosen detection task were consistent with those of the ISO Detection Response Task (International Organization for Standardization, 2015).
Procedure
Prior to the day of the study, participants completed a defensive driver training required by the University of Utah Risk Management Division. They also watched a 30-minute training video on the level-2 technology available in the vehicles. In this video, researchers demonstrated how to engage and disengage Lane Centering and ACC as well as how to properly and safely utilize the technology. On the day of study, they signed the consent document, confirmed that they had slept at least 6 hours the night before testing, and verified that they had not consumed any alcoholic beverages that day (which was confirmed with a BACtrack breathalyzer). The researcher and participants then walked to the test vehicle, where the participants were further familiarized with the partially automated technology available in the vehicle while still parked in the parking lot. Participants then test drove the vehicle for about 20 minutes along a training route that started at Exit 126 on US Interstate-215 and ended at Exit 134 on US Interstate-80 near Salt Lake City, UT (Figure 2). While on the training route, participants were encouraged to ask the researcher any questions they might have about the vehicle. The participant drove on the training route until they felt comfortable with the level-2 system, at which point the experimental phase begun.
After the familiarization phase, the experimental data collection begun. This took place on US Interstate-80 between Exit 134 near Salt Lake City, UT, and exit 155 near Wanship, UT (Figure 2). Participants drove all vehicles twice, one in manual and one in partially automated mode. Each of the two drives lasted approximately 20 minutes, and the order of drives was counterbalanced. While driving, participants were instructed to prioritize safe driving (over responding to the detection task), if necessary. While participants drove and responded to the detection task, the researcher sat in the passenger seat for safety reasons and to monitor the data acquisition. At the end of the first drive, participants were instructed to safely exit the highway and drive to a nearby gas station where they could take a break. The data collection resumed only when participants felt ready to do so, at which point they reentered the highway in the opposite direction. When the two drives (manual and partially automated) for the first vehicle were completed, participants exited the highway and drove back to a parking lot in the vicinity of Exit 126 where the other vehicles were parked, at which point they were instructed to take a break. The data collection with the next vehicle started only when participants felt ready to do so. This procedure repeated until participants drove all four vehicles in the two modes. The order of vehicles was fully counterbalanced across participants. The entire data collection lasted up to 4 hours.
Data Analysis
Bayes factor analyses were conducted to investigate the effects of the factors time periods, vehicle, and driving mode on the dependent measure response times. The Bayesian approach was preferred over the traditional null-hypothesis statistical testing (NHST). NHTS relies on the p-value associated with a test to determine significant differences at α = 0.05. If the test’s probability is greater than α, the alternative hypotheses is rejected, and vice versa. Bayesian analysis set up two competing models, one in favor of the null hypothesis and the other in favor of the alternative hypothesis, and estimate which of the two models is more likely to generate the data at hand. The Bayesian approach transforms the p-values into direct evidence against the null hypotheses (Held & Ott, 2018). The Bayes Factor (BF) is used to determine the likelihood of the data under either the null or the alternative hypotheses, and it is calculated as the ratio between the marginal likelihood of the null model and that of the alternative model (Quintana & Williams, 2018). A BF equal to X indicates that the data is X times more likely under the alternative hypotheses than under the null hypothesis. For example, a BF of 10 indicates that the given data is 10 times likelier under H1, whereas a BF = 0.01 indicates that the same data is 10 times likelier under H0. According to Dienes (2014), BF varies between 0 and infinity. The bigger the BF (with BF >1), the stronger the evidence in support of the alternative hypotheses. Likewise, the smaller the BF (with BF <1), the stronger the evidence in support of the null hypotheses. BF = 1 indicate that the data is not supportive of either model. In short, unlike NHST which only yields a binary outcome (accept/reject H0), BF analysis allow for three separate conclusions (evidence in support of H0, evidence in support of H1, and insensitive evidence) as well as provides information on the strength of the evidence. Data processing and analyses were conducted using R (version 4.1.0) and RStudio (version 2023.03.0; Racine, 2012). The tidyverse (version 2.0) and BayesFactor (version 9.12) libraries were adopted for data processing and Bayesian analyses, respectively.
RESULTS
Distinct Bayesian models were set up to investigate our two objectives. Objective 1 was to investigate the detection task as a metric for the occurrence of vigilance decrements with drivers operating a real-world vehicle in partially automated mode. Objective 2 was to explore the effect that operating distinct real-world partially automated systems have on detection task performance.
Detection Task Decrements During Real-World Partially Automated Driving
A Bayesian model was set up with driving mode and time period as the independent factors, response times as the dependent measure, and participants as the random factor. A BF of 0.52 was found for the main effect of driving mode, suggesting that there is no difference in response times between the two modes. A BF of 52 × 104 was found for time period evidencing a reduction in detection response task over time (see Figure 3). A BF of 69 was found for the time period by driving mode interaction showing that response times increased at a greater rate during partially automated driving relative to manual driving (Figure 3). Similar traditional repeated-measure analysis of variance set up to investigate the same effects confirmed the results found with Bayesian analysis. Response times (in milliseconds) by mode (A: partially automated, M: manual) by time periods (1:8).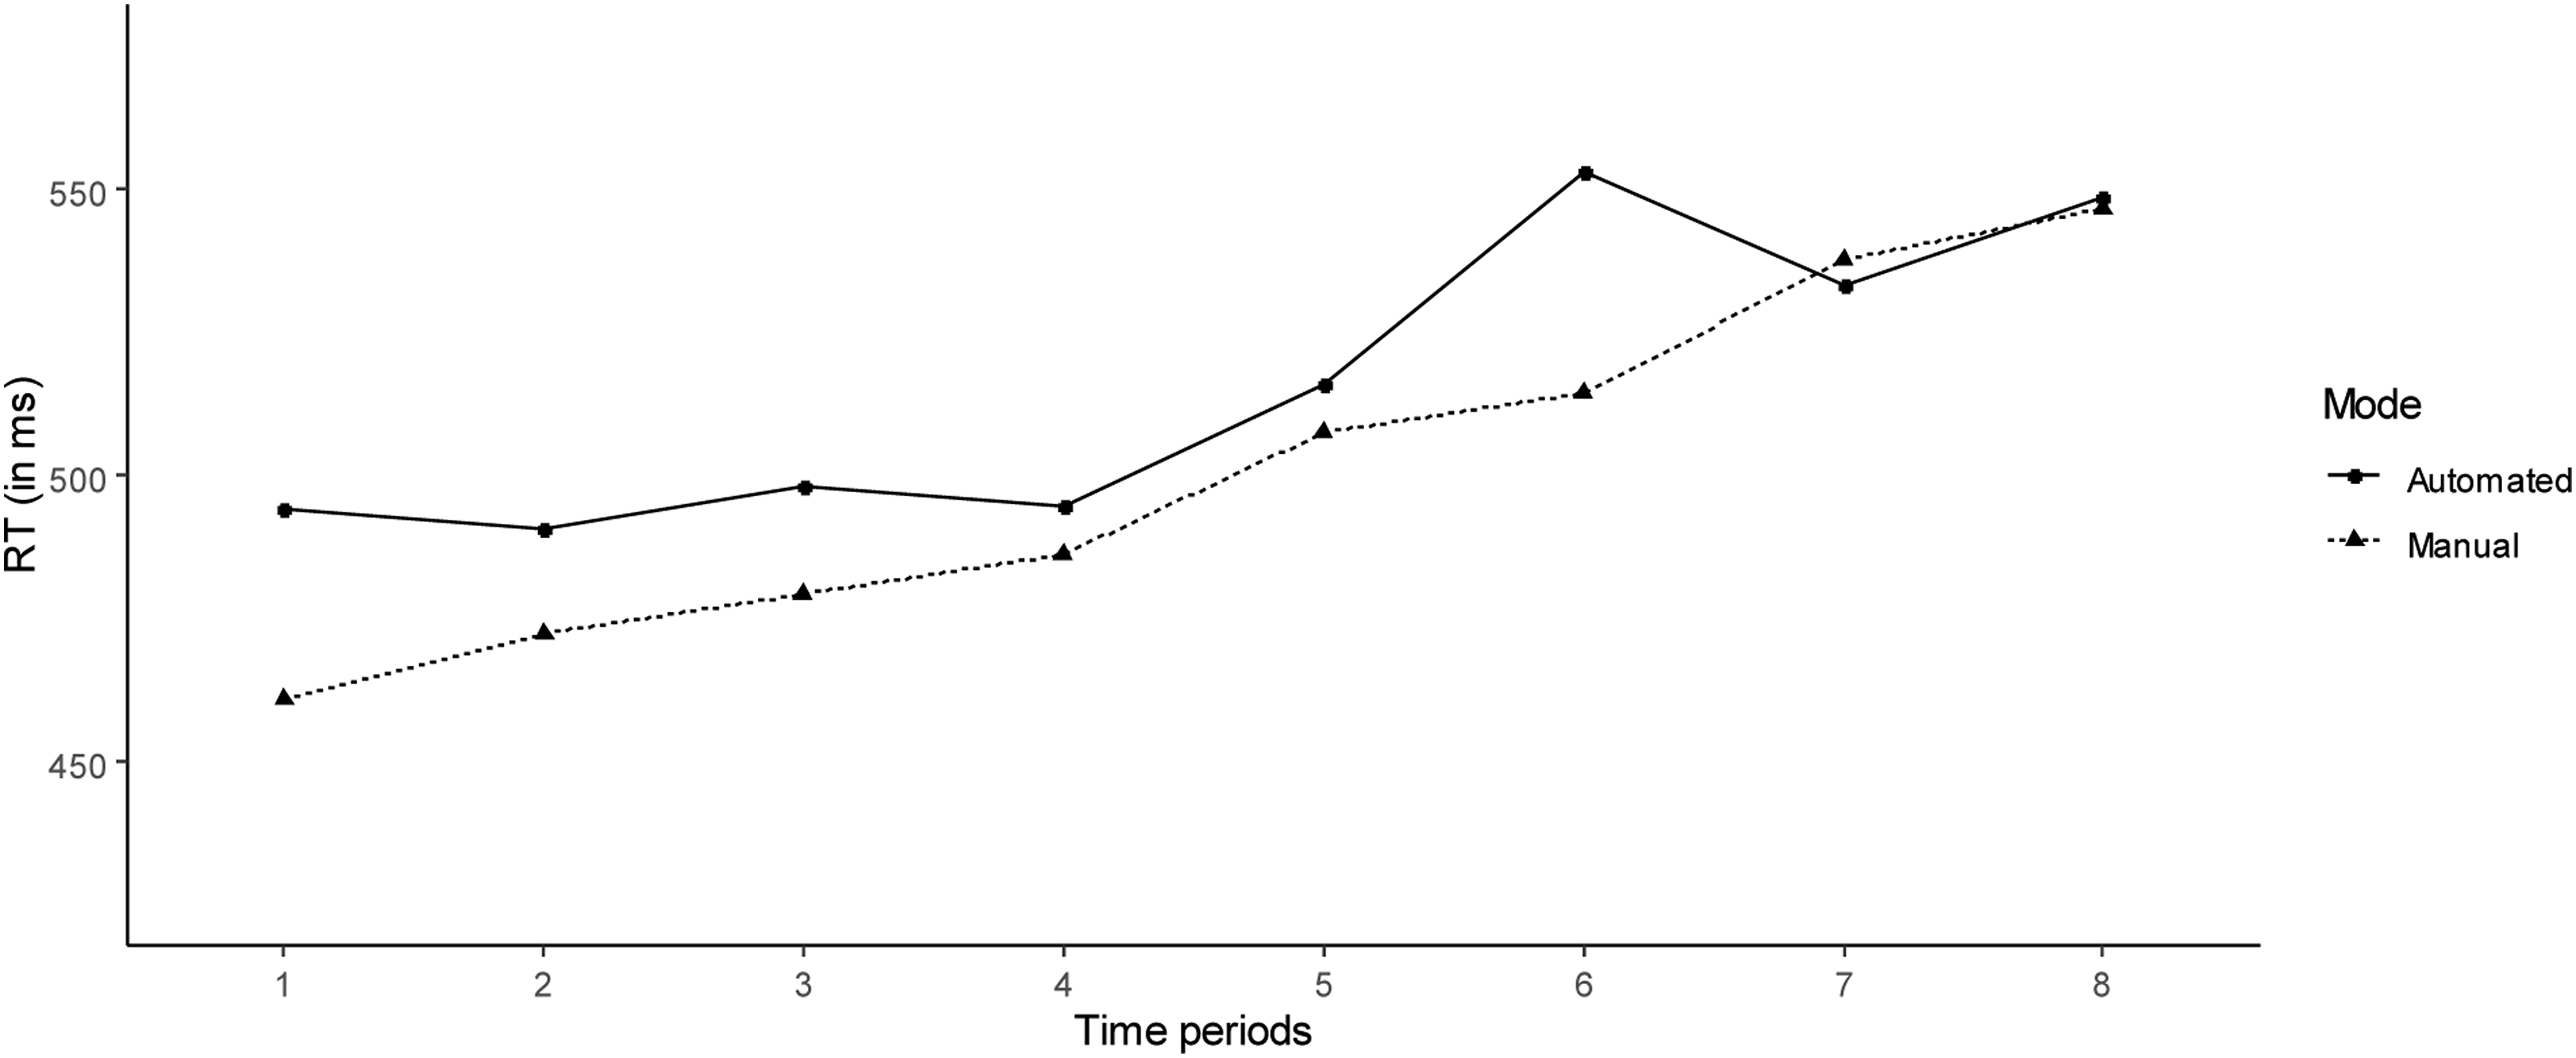
Detection Task Decrements Across Different Systems
A Bayesian model was set up with vehicle and time period as the independent factors, response times as the dependent measure, and participants as the random factor. A BF of 45.01 was found for the main effect of vehicle indicating that detection task performance was different across vehicles. A BF of 5.37 was found for the time period x vehicle interaction indicating that response times increased at a different rate depending on the vehicle. The interaction between vehicle and driving mode resulted in a BF of 0.21 indicating evidence in support of the null hypotheses.
Given that a main effect of vehicle was found and considering that response times in the Volvo appear to be the slowest (Figure 4), additional models (with vehicle and time periods as independent factors) were set up to investigate differences between pairs of vehicles. BF of 3.19 x 10³ and 15 were found when comparing the Volvo with, respectively, the Cadillac and the Tesla, indicating strong evidence that the detection task performance in the Volvo was in fact worse than that in the other two vehicles. A BF of 2.8 was found when comparing the Volvo with the Nissan. Similar analysis were run to investigate differences between the Nissan, Cadillac, and Tesla. Resulting BF were: 0.31 for the Nissan v. Cadillac comparison, 0.06 for the Nissan v. Tesla comparison, and 0.15 for the Tesla v. Cadillac comparison, suggesting that the detection task performance was comparable across these three vehicles. Similar repeated-measure analysis of variance set up to investigate the same effects confirmed the results found with Bayesian analysis. Response times (in milliseconds) by time periods and vehicles.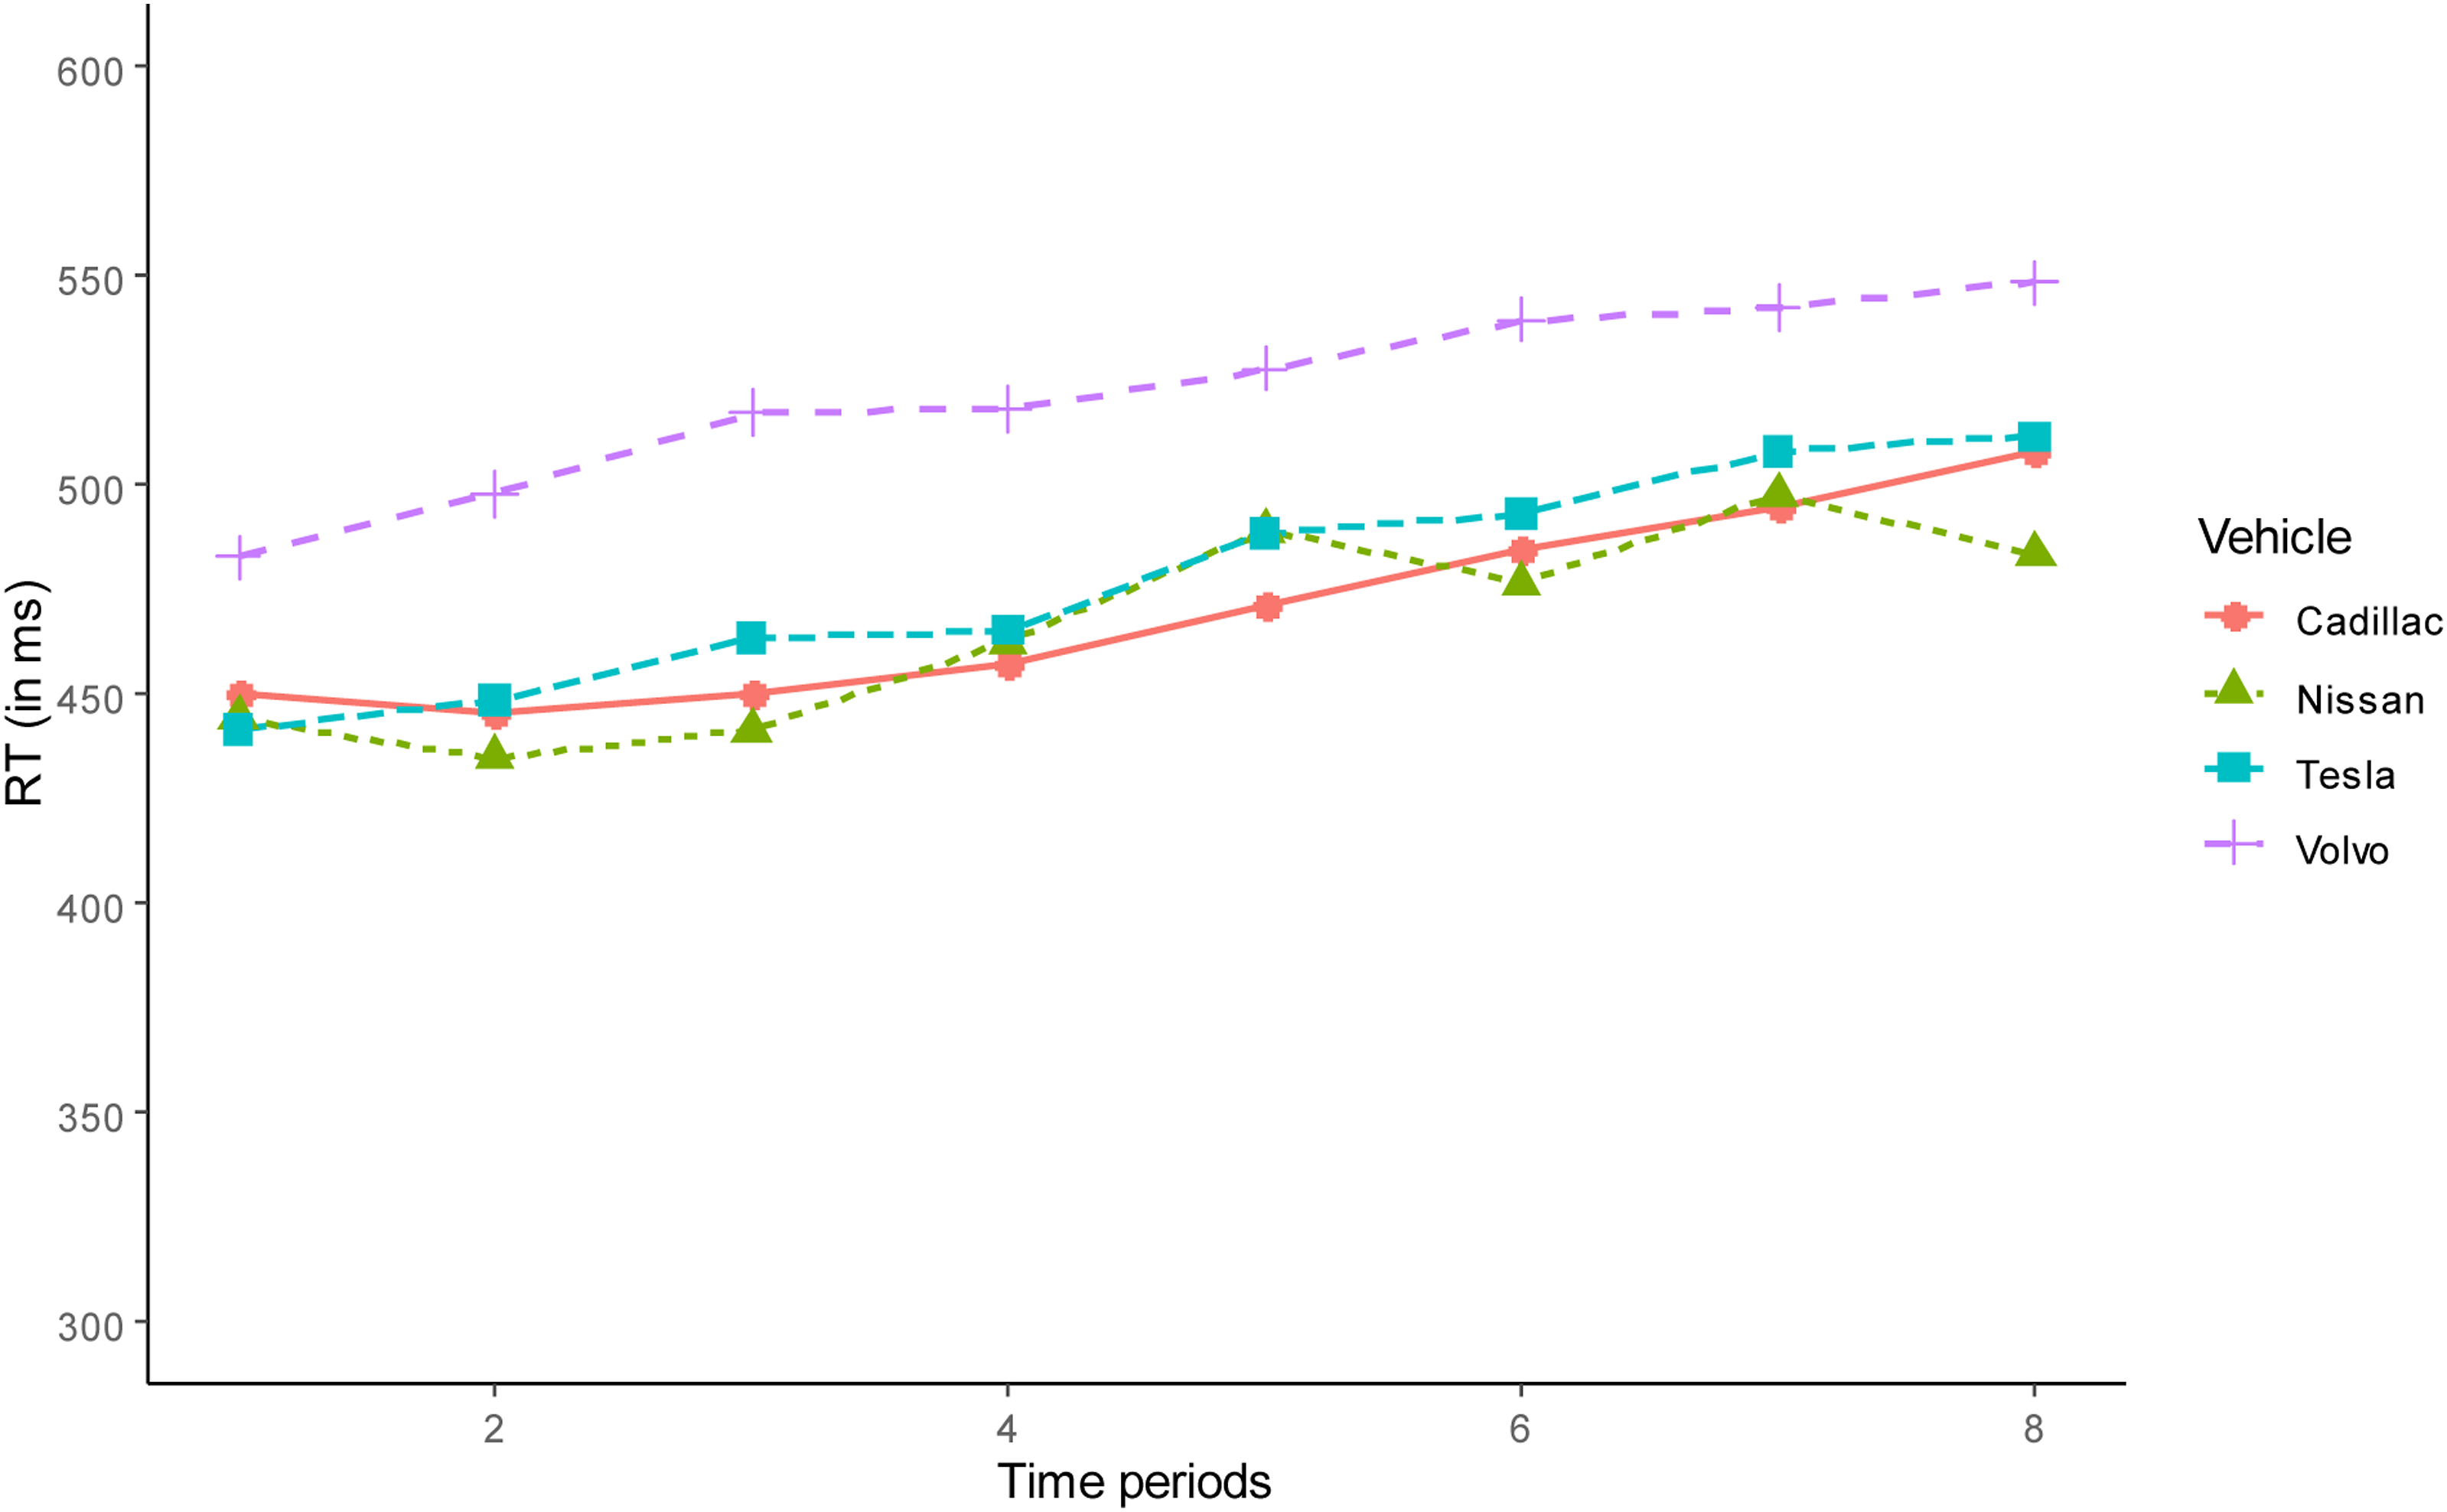
DISCUSSION
Our first objective was to investigate detection task decrements during real-world manual and partially automated driving. Our data showed a temporal reduction in detection performance with response times increasing, on average, from 477 ms in period 1 to 545 ms in period 8 across the two modes. This indicates that driver vigilance declined over time in both manual and partially automated driving. Although no evidence was found for the main effect of driving mode, strong evidence was observed for the interaction between driving mode and time periods, indicating that the rate at which the detection performance increased over time differed between the two modes. The longer response times in partially automated mode posit that, although a vigilance decrement was observed in both modes, it was further exacerbated by the level-2 system being operational.
The importance of these findings for the Human Factors practice is twofold. Detection tasks represent a common tool for assessing fluctuations in vigilance (Grier et al., 2003; McWilliams & Ward, 2021; Reinerman-Jones et al., 2016). Research conducted in simulated manual (Matthews & Desmond, 2002; Schmidt et al., 2009) and simulated fully automated (level-5) driving (Greenlee et al., 2017) showed vigilance decrements resulting from the driver’s inability to sustain attention toward the task of driving or supervising the operations of the fully automated system, respectively. Our work adds to this literature demonstrating the accuracy of detection tasks in tracking changes in vigilance during real-world partially automated driving. More importantly, the greater decline in detection performance in the partially automated mode (as evidenced by the significant mode x time interaction) also advances the hypothesis that operating vehicles in level-2 mode may come with an added cost when compared with manual driving. This datum is in conflict with the driving simulator studies by Körber et al. (2015), Solís-Marcos et al. (2017), and Greenlee et al. (2022) where no differences were found between simulated manual and simulated level-2 driving. It is plausible that the overall lower demand of driving in a simulated environment may have reduced or eliminated possible driving mode-related differences in detection task performance. This would be consistent with the findings by Strayer et al. (2015) wherein differences in detection task performance between secondary tasks were much attenuated when driving in a simulated scenario than on the road.
Our second objective was to explore differences in vigilance decrements across different partially automated systems. Bayesian analyses showed evidence in favor of the main effect of vehicle demonstrating that, overall, unique performance patterns were found for different vehicles. Further analysis revealed that the performance for the Volvo was worse than that found for the Tesla, Nissan, and Cadillac. This, combined with the lack of evidence for the vehicle by mode interaction, suggests the presence of an additive effect with vehicle-related characteristics having a similar effect on detection performance in both manual and level-2 driving.
We posit that the observed vehicle-specific differences in detection performance be attributable to the unique characteristics of the four vehicle systems. Work by Strayer et al. (Strayer et al., 2017, 2018) and Reimer et al. (Kidd et al., 2017; Reimer et al., 2021) on on-board infotainment systems in vehicles of different makes showed that, although participants completed the same comparable tasks (e.g., calling and navigation), the unique characteristics of each on-board system had a selective effect on the resulting levels of driver workload. For example, touchscreen characteristics such as display size and button dimensions were found to have a direct effect on the time took by participants to complete infotainment tasks and the resulting distraction potential. Consistent results were observed by Kidd et al. (2015) where the design characteristics of the same driving aid (e.g., rearview cameras) directly affected its use and the resulting safety benefits across different vehicles (also see Biondi et al., 2018). Within the context of our research, we argue that the distinct design characteristics of the four user interfaces had a direct effect on drivers’ detection task performance. In particular, whereas comparable detection task times were found for the Nissan, Tesla, and Cadillac, a worse performance was observed for the Volvo. This aligns with prior work by Strayer et al. (2017, 2018) and Mehler et al. (2015) wherein Volvo vehicles were associated with longer task times, and greater visual and cognitive demand relative to vehicles of other makes and models. Because such performance decline was found in both driving modes, this rules out that the observed differences are the direct result of the unique design of each vehicle’s level-2 system. Instead, it suggests that the design characteristics of this vehicle’s user interface affected drivers’ detection performance regardless of the driving mode. Following prior work by Biondi and colleagues (Biondi et al., 2019; Getty et al., 2018), we hypothesize that system designs be used to predict drivers’ behavioral patterns and adapt to changes in driving workload.
CONCLUSIONS
Our findings add to the literature on vehicle automation showing evidence of a potential safety risk of partially automated driving. The greater decline in performance observed during partially automated driving is symptomatic of a greater vigilance decrement, an interpretation that is consistent with the broader literature on user automation (Bailey & Scerbo, 2007; Biondi et al., 2019; Kidwell et al., 2014; Parasuraman & Manzey, 2010). Differences in detection task performance found across vehicles posit a possible relationship between vehicle or system characteristics and detection task performance (Reinerman-Jones et al., 2016; Strayer et al., 2015). However, the absence of a vehicle by driving mode interaction in part conflicts with the survey and expert studies by Mueller et al. (2019), AAA (2019), and Teoh (2020) showing how the reported use of the level-2 system changed depending on the vehicle’s make.
With this in mind, our study has some key limitations. Our participants had not prior experience with partial automation and, although they were provided with sufficient training prior to the study, they drove the four vehicles only for a limited period of time. Future research should consider recruiting more experienced level-2 systems users to investigate longer-term effects of operating a partially automated system on detection task performance. It is also of interest to explore the relationship between cognitive load and vigilance during level-2 system use.
Footnotes
Acknowledgments
We thank the AAA Foundation for Traffic Safety for their support to this research. Francesco N. Biondi also acknowledges the contribution of the Social Science and Humanities Research Council, the National Science and Engineering Research Council of Canada, and the Ontario Ministry of Transportation. This work was supported by the Social Sciences and Humanities Research Council of Canada, Canadian Network for Research and Innovation in Machining Technology, Natural Sciences and Engineering Research Council of Canada, Ontario Ministry of Transportation, and AAA Foundation for Traffic Safety.
KEY POINTS
A greater decrement in driver vigilance was found during partially automated driving. Overall worse performance was found in the Volvo when compared with the other vehicles. The observed vehicle-related differences are attributable to the unique design of their in-vehicle interfaces.