
Abstract
Objective
This study develops a computational model to predict drivers’ response time and understand the underlying cognitive mechanism for freeway exiting takeovers in conditionally automated vehicles (AVs).
Background
Previous research has modeled drivers’ takeover response time in emergency scenarios that demand a quick response. However, existing models may not be applicable for scheduled, non-time-critical takeovers as drivers take longer to resume control when there is no time pressure. A model of driver response time in non-time-critical takeovers is lacking.
Method
A computational cognitive model of driver takeover response time is developed based on Queuing Network-Model Human Processor (QN-MHP) architecture. The model quantifies gaze redirection in response to takeover request (ToR), task prioritization, driver situation awareness, and driver trust to address the complexities of drivers' takeover strategies when sufficient time budget exists.
Results
Experimental data of a preliminary driving simulator study were used to validate the model. The model accounted for 97% of the experimental takeover response time for freeway exiting.
Conclusion
The current model can successfully predict drivers’ response time for scheduled, non-time-critical freeway exiting takeovers in conditionally AVs.
Application
This model can be applied to the human-machine interface design with respect to ToR lead time for enhancing safe freeway exiting takeovers in conditionally AVs. It also provides a foundation for future modeling work towards an integrated driver model of freeway exiting takeover performance.
Keywords
INTRODUCTION
Conditionally automated vehicles (AVs), known as the third level of automation in driving (SAE International, 2016), are under development with the expectation of realizing attention-free driving within limited areas. A common approach to defining the operational needs and capability boundaries of automated driving systems (ADSs) is referred to as Operational Design Domain (ODD), which is a description of specific conditions (e.g., roadway features, speed range, weather) in which an ADS is designed to operate adequately (NHTSA, 2017). The Highway Pilot feature, for instance, enables a car to drive itself on some designated highways, but it requires the driver to take over control of the car before exiting (Hungar et al., 2017). To facilitate a successful exit and roadway safety, when the ADSs initiate a takeover request (ToR), drivers should be provided with appropriate information such as the reason for takeover, the remaining time or distance before exiting, and surrounding vehicles that need attention. This information conveyed by human-machine interfaces (HMIs) serves to assist drivers with a quick understanding and anticipation of the situation (namely situation awareness (SA); Endsley, 1988), getting prepared for driving maneuvers, and performing a takeover task safely.
Existing Computational Models of Driver Takeover Performance
The existing computational models for predicting drivers’ takeover performance were built using methods that can be classified into two categories: data-based modeling (e.g., statistics, machine learning) and cognitive architecture-based modeling. The data-based models were developed and tested using data collected from driving simulator experiments with the goal to identify the patterns in data and ultimately determine the function that maps predictors to outcomes. For example, Gold et al. (2018) presented regression models by drawing inferences from a sample of 753 time-critical takeover events in six experiments. The models captured takeover performance measures (i.e., takeover response time, minimum time-to-collision, brake application, and crash probability) as a function of predictors such as time budget, traffic density, non-driving related tasks (NDRTs), and driver age. Supervised machine learning classifiers were also trained on empirical data (which were labeled according to the ground truth) to recognize good or bad takeover performance based on traffic situation- and driver-dependent features (Braunagel et al., 2017; Du et al., 2020).
The other category of computational modeling methods for predicting drivers’ takeover performance is based on cognitive architectures, which is a theory-driven, top-down approach. Adaptive Control of Thought-Rational (ACT-R) is based on chunks of declarative knowledge and procedural knowledge that manipulates declarative knowledge and environment by firing condition-action production rules (Salvucci, 2006). The ACT-R architecture has been used to quantify the effects of NDRT complexity and traffic complexity on takeover response time (Scharfe & Russwinkel, 2019a). It has also been used to predict the time course for the individual takeover behavior, namely gaze on ToR, stopping NDRT, hands on steering wheel, and gaze on road (Scharfe & Russwinkel, 2019b). By combining the ACT-R cognitive architecture and queuing network (QN) mathematical foundations, Cao and Liu (2013) proposed the QN-ACTR architecture. To implement the QN-ACTR modeling, a computerized program built on Micro Saint Sharp is connected to a driving simulator program to produce predictions of driver performance, such as the trace of simulated mental activities, behavioral responses, reaction times, correct rates, and mental workload (Cao & Liu, 2013). To date, only Deng et al. (2019) has made an attempt to model drivers’ response time to emergency takeovers with visual or auditory concurrent tasks in conditionally AVs.
While ACT-R and QN-ACTR rely on computer simulations to model human performance, Queuing Network-Model Human Processor (QN-MHP) provides a theoretical framework to develop computational cognitive models that rely on a set of math equations, which are more rigorous to make predictions and more flexible to be integrated into systems for the purpose of application. QN-MHP integrates queuing networks and model human processor for predicting human performance and concurrent electrophysiological activities in the brain (Liu et al., 2006; Wu & Liu, 2008). The QN-MHP framework has been used to successfully model drivers’ takeover performance. Ko et al. (2019) developed a QN-MHP model of drivers’ takeover response time to different auditory ToR displays (i.e., speech, spearcon, and earcon) in emergency takeovers such as a deer, a parked car, or a service vehicle blocking the driving lanes. Based on that, Ko et al. (2022) enhanced the model by integrating the perceived intuitiveness and perceived urgency of different auditory warnings. Sanghavi (2020) focused on the driver state while performing takeover tasks to avoid an obstacle on road, specifically how anger affected drivers’ takeover response time and safety. In short, the existing QN-MHP models of takeover response time focused on emergency takeovers that require timely responses.
Existing models have successfully predicted drivers’ takeover behavior in time-critical scenarios. However, few attempts have been made in developing computational models to predict how drivers would behave in scheduled, non-time-critical takeovers in conditionally AVs. Drivers were found to take longer to resume control when there was no time pressure compared with that in time-critical scenarios (Eriksson & Stanton, 2017). Summala (2000) also argued that drivers may not be motivated to intervene if there is sufficient time. Thus, existing driver models may not be applicable for freeway exiting takeovers. Although less hazardous than imminent collisions, the freeway exiting entails a cautious takeover decision-making for stable vehicle control and safe driving maneuvers to exit a freeway. Modeling the driver response to freeway exiting takeovers will contribute to a better prediction of the post-takeover performance, and therefore improve driving safety.
Association Between Influential Factors and Takeover Response Time
In conditionally AVs, a takeover request (ToR) plays a crucial role in directing drivers’ attention from non-driving activities back to the driving task. The ToR lead time (or time budget) is one of key design parameters. It is defined as the time duration between the ToR onset and the car arriving at the target exit when it maintains the automated driving speed. Numerous empirical studies have examined the ToR lead time for the purpose of improving the HMI design for drivers’ better takeover performance. A meta-analysis of 129 studies (with a ToR lead time range of 1.5–30 seconds) has revealed that a higher urgency of the situation (with a shorter ToR lead time) was associated with a shorter mean takeover response time (Zhang et al., 2019). Tan and Zhang (2022) focused on scheduled takeovers for freeway exiting and examined 12 levels of ToR lead time within a range of 6–60 seconds. Results found that the takeover response time increased with ToR lead time, indicating drivers postponed their takeover actions further when they were given more time. A consistent trend was also found that a longer ToR lead time was associated with better driver SA, for instance, an increase of glance frequency to the road (Lu et al., 2017) and an enhanced ability to anticipate latent hazards (Samuel et al., 2016; Wright et al., 2016; Vlakveld et al., 2018). In all, the ToR lead time is an important factor that affects driver SA and response time for conditionally AV takeovers.
Many Human Factors researchers would agree that driver SA is a key component in the conditionally AV takeover process and it is predictive of takeover performance and safety. Van den Beukel and Van der Voort (2013), for instance, conducted a Pearson correlation analysis and found that the takeover success rate was positively correlated with drivers’ self-rated SA scores. Some studies did not conduct correlation analysis but observed drivers’ better SA and enhanced takeover performance under the effect of HMI design. For example, Cortens et al. (2019) found that drivers who had better SA were able to grip the steering wheel faster to avoid collisions in traffic congestion regardless of the ToR modality. When informed by a pre-warning of hazards prior to the ToR, drivers were able to build up better SA and react faster by braking or steering to take over (Ma et al., 2021). Stockert et al. (2015) demonstrated better driver SA regarding the automation status and drivers’ faster braking reactions when they were presented with system uncertainty information. Some other studies also provided evidence that poor driver SA was related to the impaired takeover performance. Agrawal et al. (2017) ascertained drivers’ compromised ability to anticipate possible hazards and lower variability in vehicle velocity in the complex driving environment, which indicated that drivers were less likely to brake for upcoming hazards. Yang et al. (2020) found that drivers being engaged with NDRTs in active interaction mode (i.e., playing games) resulted in less frequent road checking and more time needed for making a swerve and arriving at the safe position as compared to NDRTs in passive interaction mode (i.e., watching videos and reading news). To sum up, empirical findings suggest the existence of positive correlations between driver SA and takeover performance. Having the dynamic driver SA as a model input is expected to be an effective method to predict the takeover response time.
Drivers’ takeover performance is likely to be impaired when they were engaged in NDRTs during conditionally automated driving. In particular, drivers who were distracted by NDRTs need time for visual and cognitive processing of the road information to re-build SA and thus took longer to respond to ToRs compared with those without NDRTs (Eriksson & Stanton, 2017; Zeeb et al., 2015). A higher level of NDRT engagement (using the proportion of glance durations on NDRT and the time between NDRT sessions as two indices) was found to be associated with a longer delay in drivers’ response to ToRs (Rauffet et al., 2020). In addition to the abovementioned factors, driver characteristics and attitudes towards automation systems, such as age and trust, might also influence takeover response time. Old drivers had a significantly slower takeover response than their young counterparts (Li et al., 2018). The age difference also has a significant effect on driver trust, which plays a mediating role in explaining the variance in takeover response time (Gold et al., 2015). An increase of drivers’ subjective trust in automation was associated with a longer takeover response time (Jin et al., 2021; Payre et al., 2016).
Objectives
This study makes a first attempt to develop a computational cognitive model of drivers’ response time for scheduled, non-time-critical freeway exiting takeovers in conditionally AVs. The QN-MHP architecture is selected with consideration of its previous use in predicting drivers’ response time in critical takeover scenarios (Ko et al., 2019, 2022; Sanghavi, 2020) and its ability in quantifying the effects of a large range of warning lead time on manual driving performance (Zhang et al., 2016; 2022), which can provide a sound foundation for the present modeling work. In addition, the QN-MHP framework has successfully modeled the effect of age on driver performance (Wu & Liu, 2007; Zhao & Wu, 2013), which allows us to account for the age differences in affecting perceptual-motor reaction.
MODELING MECHANISM
QN-MHP Structure Involved in Conditionally AVs Takeover
QN-MHP was developed based on the similarities between the human cognition system and queuing networks (Liu et al., 2006; Wu & Liu, 2008). The QN-MHP is composed of three subnetworks of servers: perceptual, cognitive, and motor subnetworks. Each server represents a brain region with similar information-processing functions. A route represents the neural pathway that connects servers to process and transmit entities across the three subnetworks. For a general structure and detailed descriptions of QN-MHP and its servers, see Wu and Liu (2008).
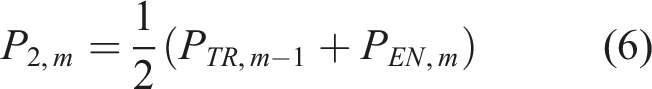
A few effective servers and routes of QN-MHP were used in the model of drivers’ takeover response time for freeway exiting in conditionally AVs as illustrated in Figure 1. Drivers using conditionally AVs are assumed to be out of loop engaging in NDRTs without monitoring the road. Based on Borowsky et al.’s (2022) interruption management strategies of handling scheduled, nonemergency takeover events, upon the delivery of an auditory ToR, drivers switch their attention to the road, possibly with an intentional delay to perform NDRTs. Then, relying mostly on visual cues, drivers build up SA to assess the urgency level of the takeover situation, based on which priority is given to either the takeover task or NDRT. When the takeover situation is perceived to be urgent in that there is shorter than acceptable remaining travel distance to exit a freeway, drivers will be more likely to get prepared for takeover. When the takeover situation is less urgent, drivers may alternate attention between the NDRT and the road until the perceived urgency becomes high when drivers think it is necessary to intervene for exiting a freeway safely. In the latter situation, every time when drivers redirect gaze from NDRT to the road, they will update SA, assess the takeover urgency, and select the task with higher priority. The desired model therefore involves two components: gaze redirection in response to ToR and task prioritization and execution. Servers and routes of QN-MHP used in the model.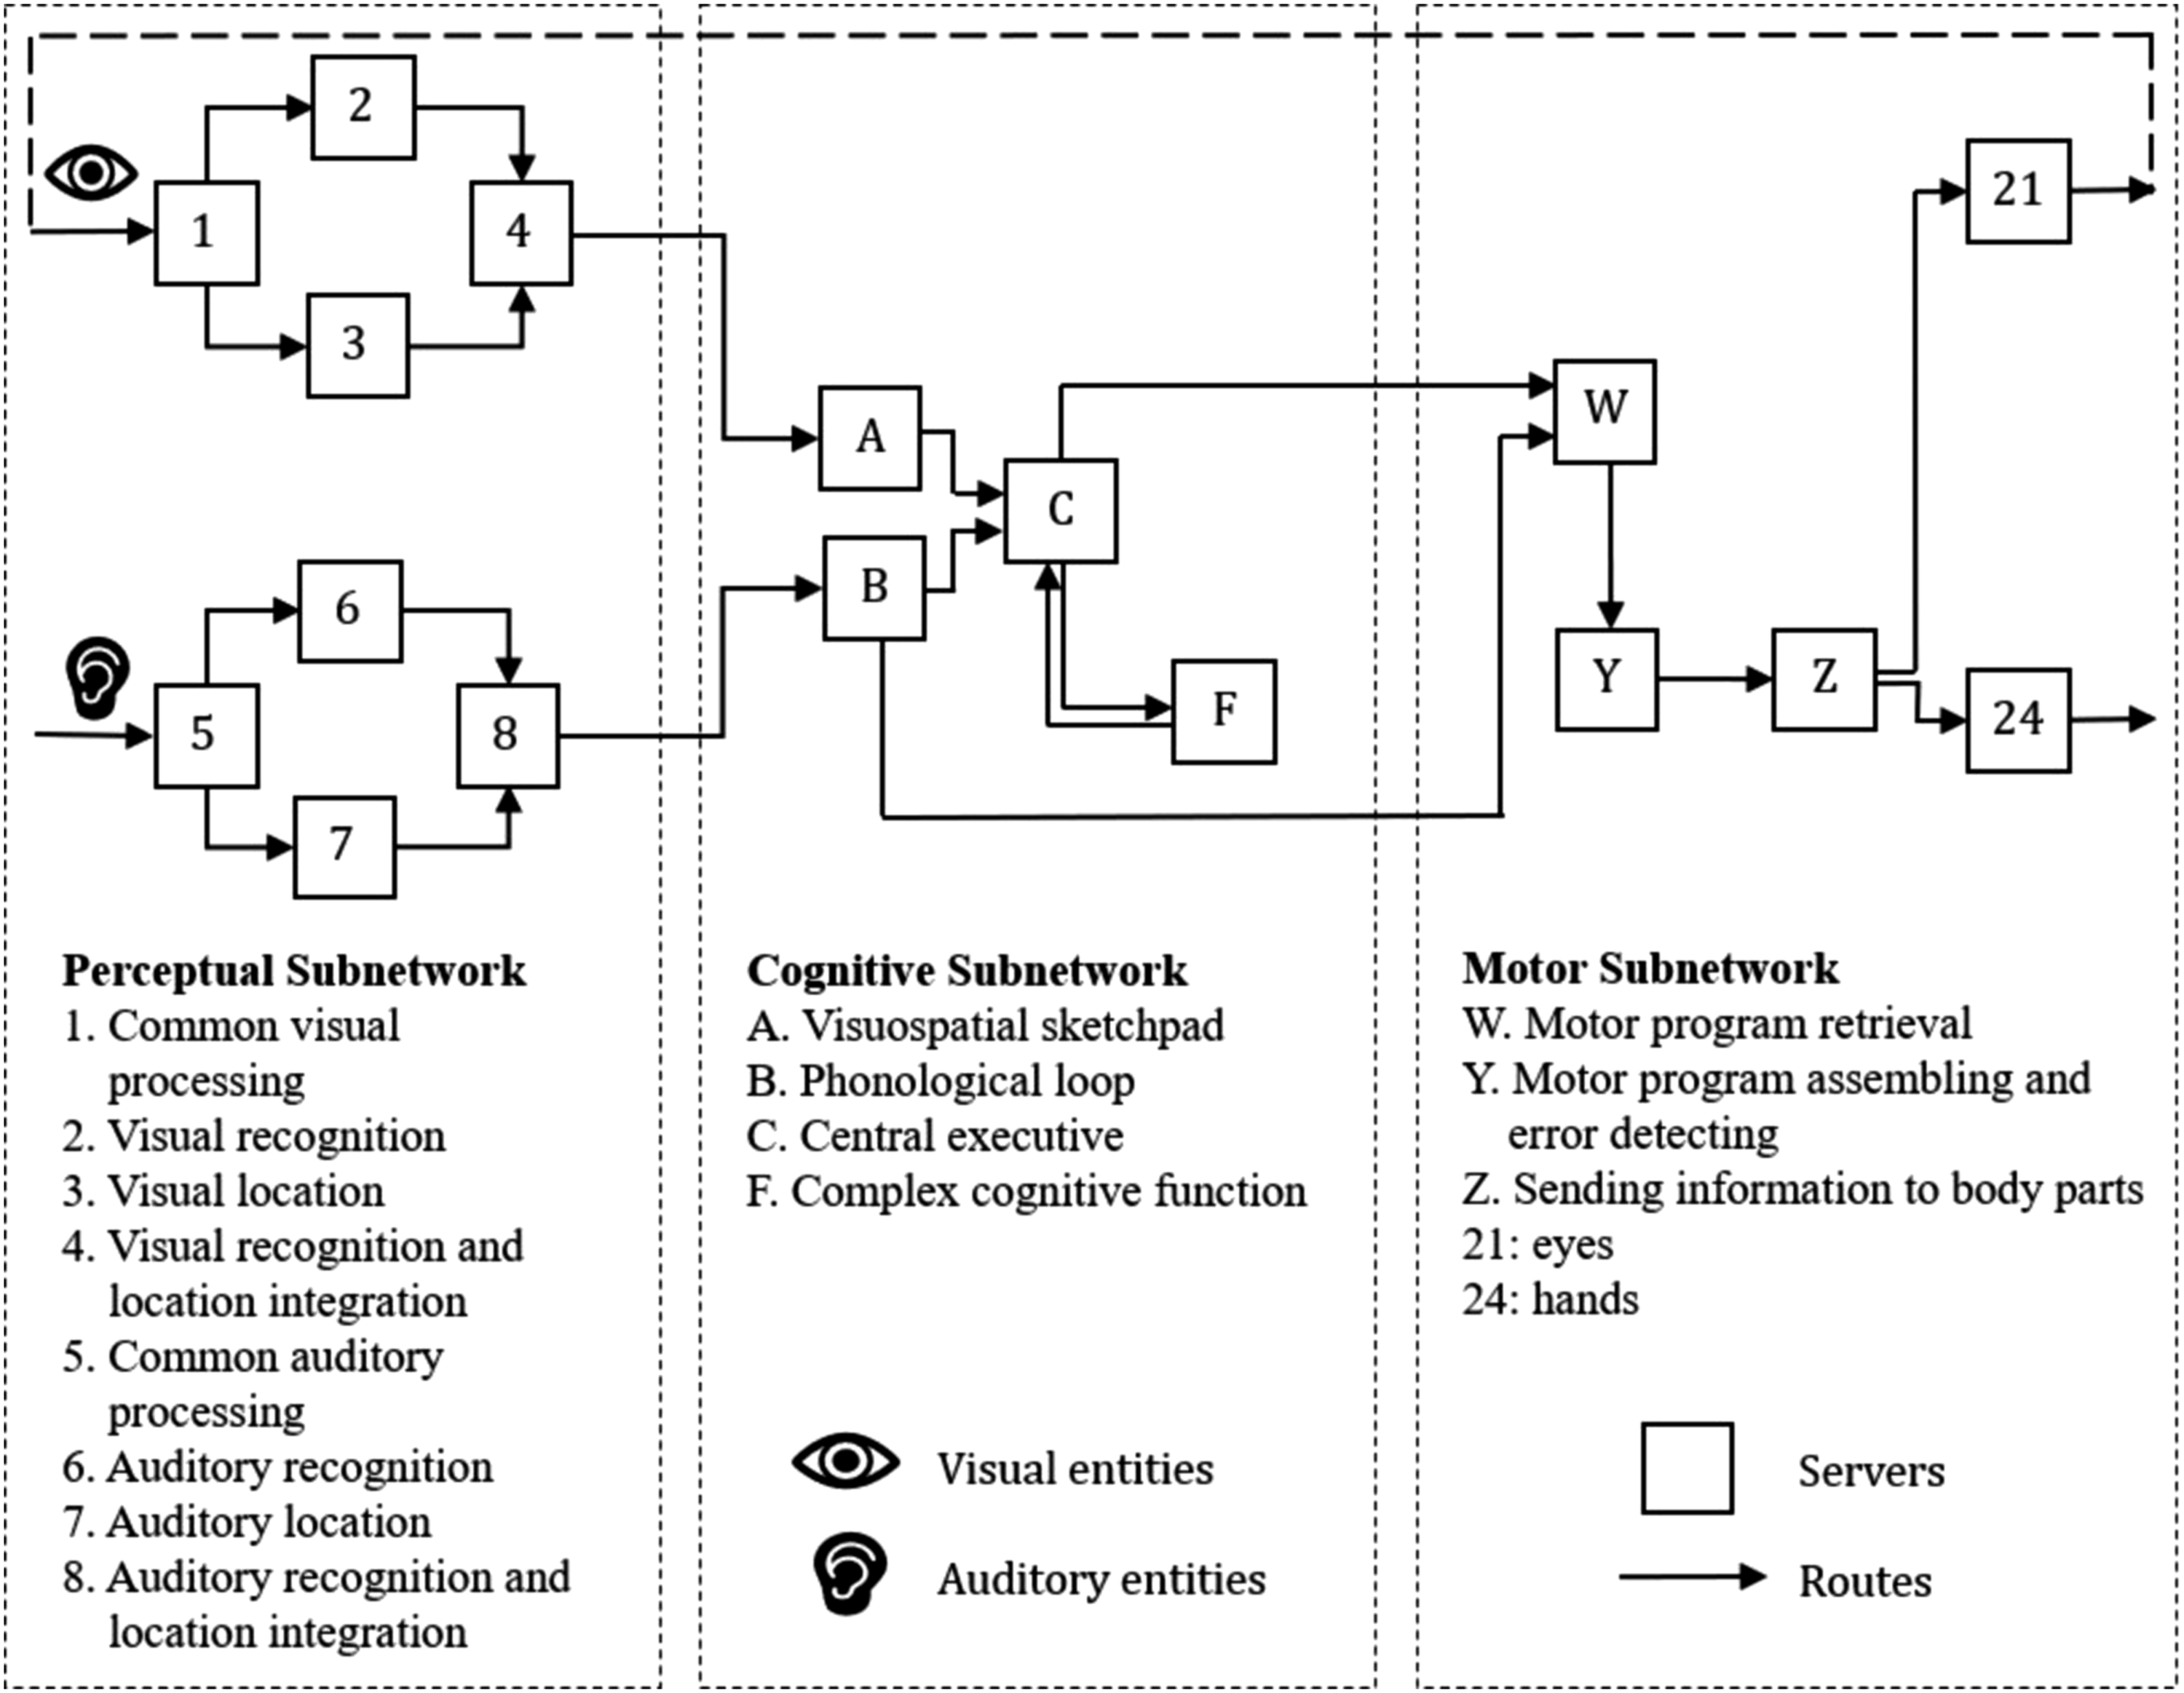
Gaze Redirection in Response to ToR
An auditory ToR enters the perceptual subnetwork at Server 5. The auditory information was then transmitted in parallel auditory pathways through Server 6 and Server 7, which processes content features (e.g., what does the auditory message convey) and location features (e.g., where does the sound come from), respectively. These features from two auditory pathways are integrated at Server 8 and then transmitted to Server B for cognitive processing.
To simulate the different pathways when drivers process the auditory information in cognition, a route choice mechanism developed by Zhang et al. (2022) was adopted. The shorter route when the auditory entity is transmitted from Server B directly to Server W represents an unconditioned, immediate motor response to the auditory stimulus. By contrast, the auditory entity passing through the longer route would take place when a driver is highly engaged in a NDRT, and consequently has a relatively slow response. In this process, the central executor (Server C) serves to suppress automatic responses and decide to direct attention.
In the motor subnetwork, motor programs are retrieved at Server W and assembled at Server Y. The Server Z transmits the neural signal to the head and eyes for looking up and scanning the road.
Task Prioritization and Execution
After drivers redirecting attention to the road, visual entities (e.g., lanes, the desired exit, the navigation map) enter the perceptual subnetwork at Server 1. The visual information was then transmitted in parallel visual pathways through Server 3 for processing location features (e.g., which lane is the car currently in) and through Server 2 for processing content features (e.g., which lane should the car be in and whether the car needs to change lanes to exit from the freeway). These features from two visual pathways are integrated at Server 4.
In the cognitive subnetwork, the visuospatial sketchpad (Server A) integrates the individual pieces of visual and spatial information, and generates a perception of the urgency level of takeover situation (Bear et al., 2001). In this study, a determinant factor of takeover urgency is the remaining travel distance to the desired exit. Drivers have their own thresholds (or preferences) for the remaining distance to take over for exiting a freeway. By comparing the actual remaining distance with the threshold at Server F (decision-making function), possibly weighing the loss (e.g., missing an exit) and the gain (e.g., performing NDRTs) of maintaining the automation mode, drivers will decide either to return gaze to NDRT or to continue monitoring the driving or to take over control immediately. A neural signal will be sent to Server C (central executive function) and then the motor subnetwork for executing the decision.
When drivers divert gaze away from the road and engage in NDRT, they will store the takeover task in the working memory (Server C). Depending on the progress of NDRT performance and the mental estimation of the remaining travel distance with the elapsed time (Server F), they redirect attention to the road to update the perceived takeover urgency and starting another round of task prioritization.
When entities travel to the motor subnetwork, the motor commands for each task prioritization decision are retrieved and executed at Server W and Y, respectively. Finally, Server Z transmits the neural signal to the corresponding body part, such as the head for redirecting attention, one hand for pressing the takeover button, etc.
Mathematical Modeling of Takeover Response Time in QN-MHP Structure
The general process of taking over control of conditionally AVs for freeway exiting is illustrated as Figure 2. A ToR is issued with the lead time ( A general process of conditionally automated vehicles takeover for freeway exiting.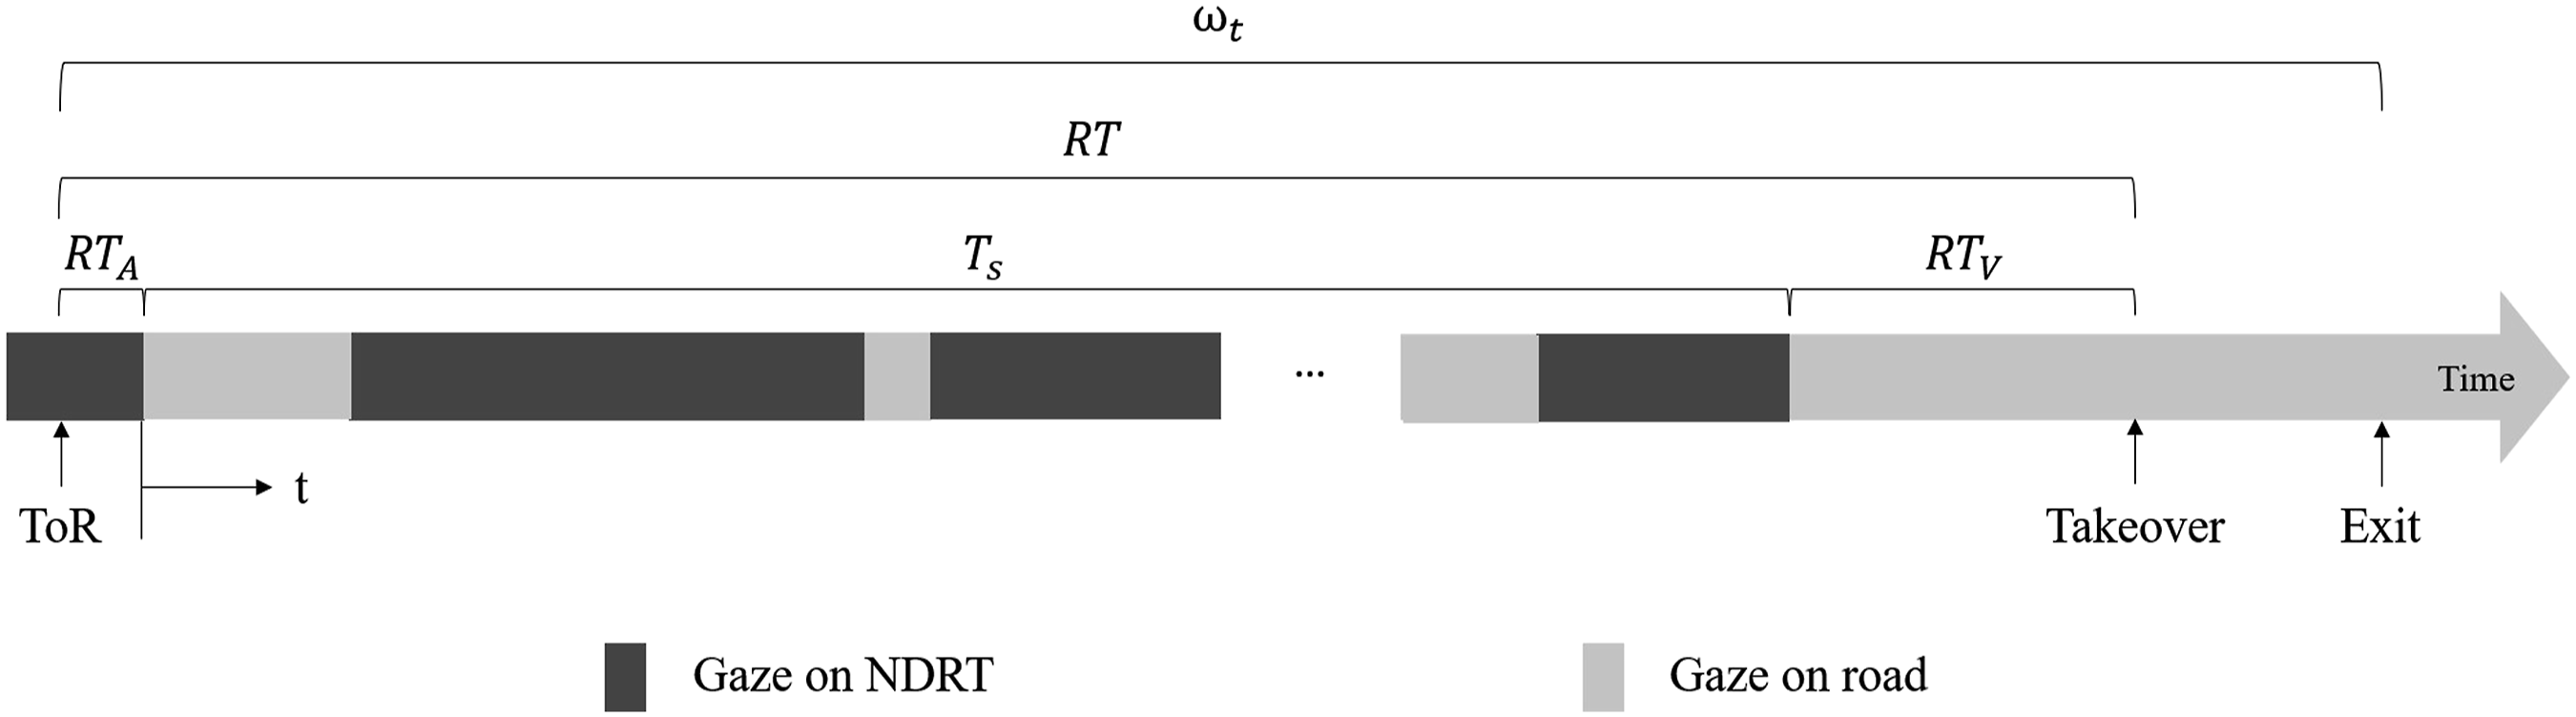

The desired model aims to predict the takeover response time at elapsed time
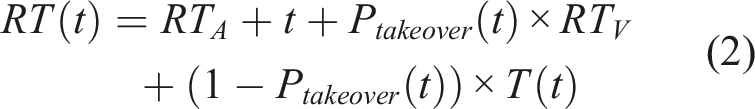
Modeling Driver Response Time (
) to Auditory ToR
As a route choice located at Server B was utilized to simulate two different pathways of auditory information processing, the driver response time (R
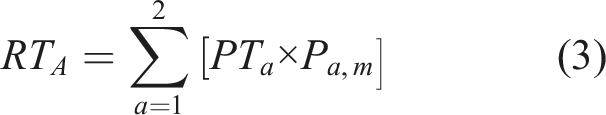
The processing time (


In equation (3), the probability of an auditory entity traveling through a route was modeled by driver trust in the previous takeover event based on the assumption that drivers are more likely to spend longer time to switch their attention back to the road when they have higher trust in automation systems. It is consistent with the empirical evidence that higher driver trust was associated with longer eyes-on reaction time (Vlakveld et al., 2018). Driver SA, which is influenced by the level of NDRT engagement, is also an influential factor of driver response time to ToR. An increased level of game engagement was found to reduce the quality of driver SA, which resulted in a delay in eyes-on response time to takeover requests (Rauffet et al., 2020). The probability of the TOR (an auditory entity) traveling through the longer route (
As the probability of an auditory entity choosing two different routes sums up to 1 in equation (3), the probability of an auditory entity choosing the shorter route (

Modeling Driver Response Time (
) to Visual Entities for Executing Takeover
When a driver decides to take over, visual entities will travel through the route (1→2/3→4→A→C→W→Y→Z→24) based on queuing network. The response time (

Modeling Task Prioritization Among NDRT, Monitoring AV Driving, and Takeover
After redirecting attention to the road at elapsed time Markov chains of state transitions.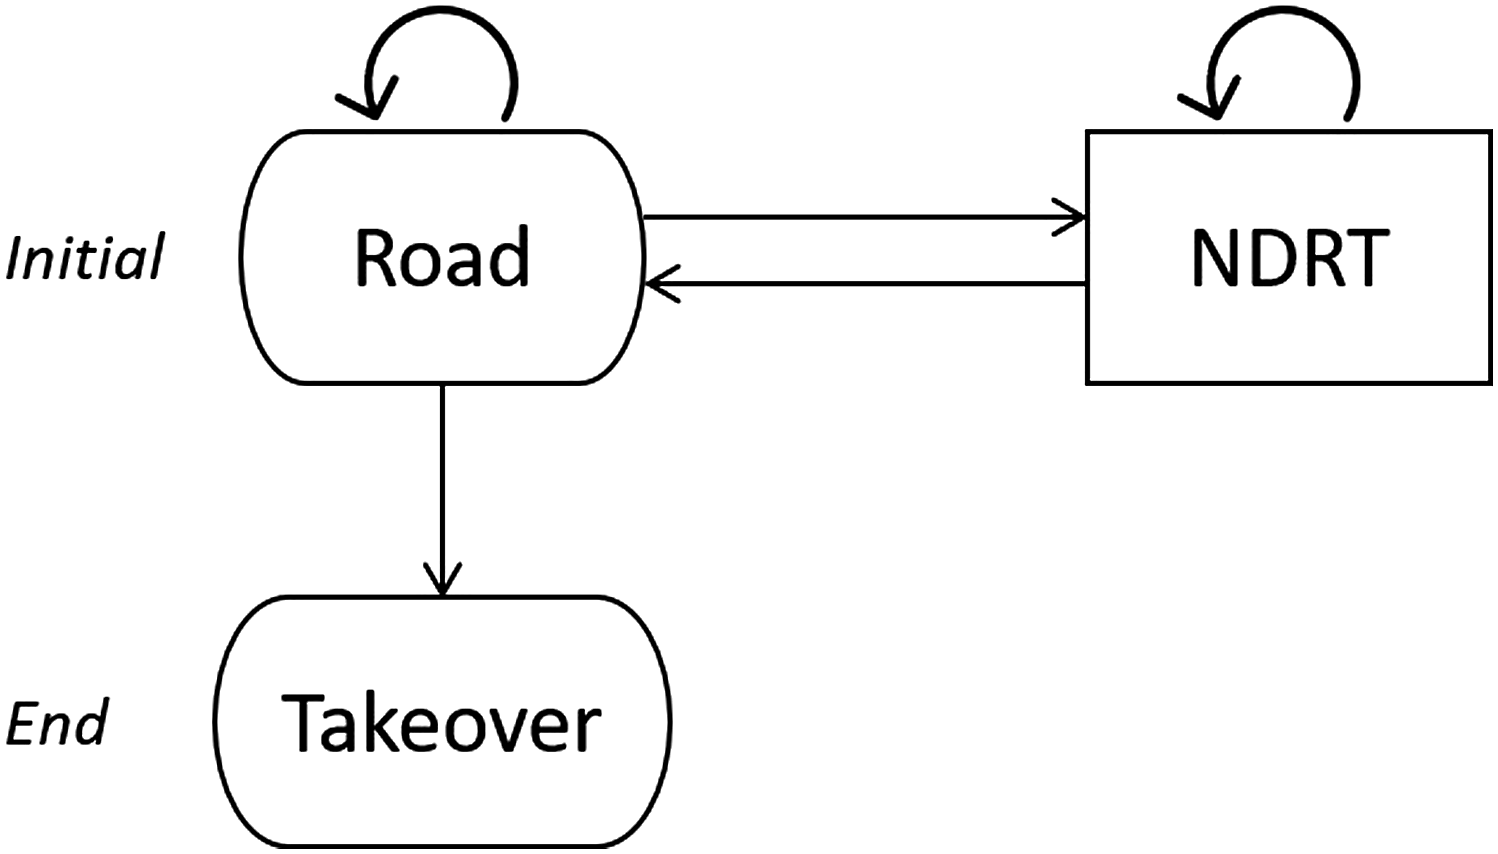
The state transition probability matrix
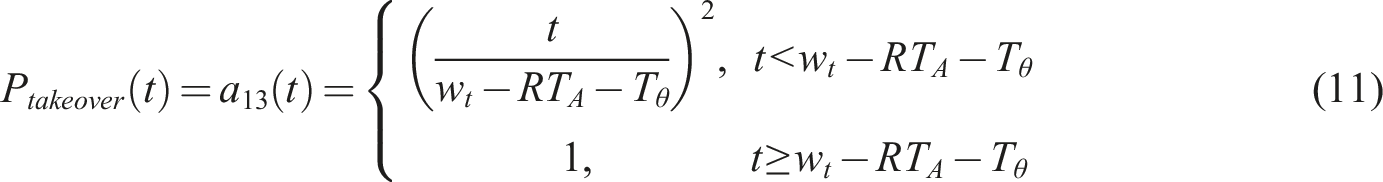
The likelihood of a driver deciding to take over (


The probability of a driver prioritizing the takeover task over NDRT and monitoring AV driving will increase as the remaining distance to exit decreases and gets closer to the driver’s threshold of distance ( A graph of linear function of the remaining distance to exit depending on the elapsed time starting from the first gaze after ToR.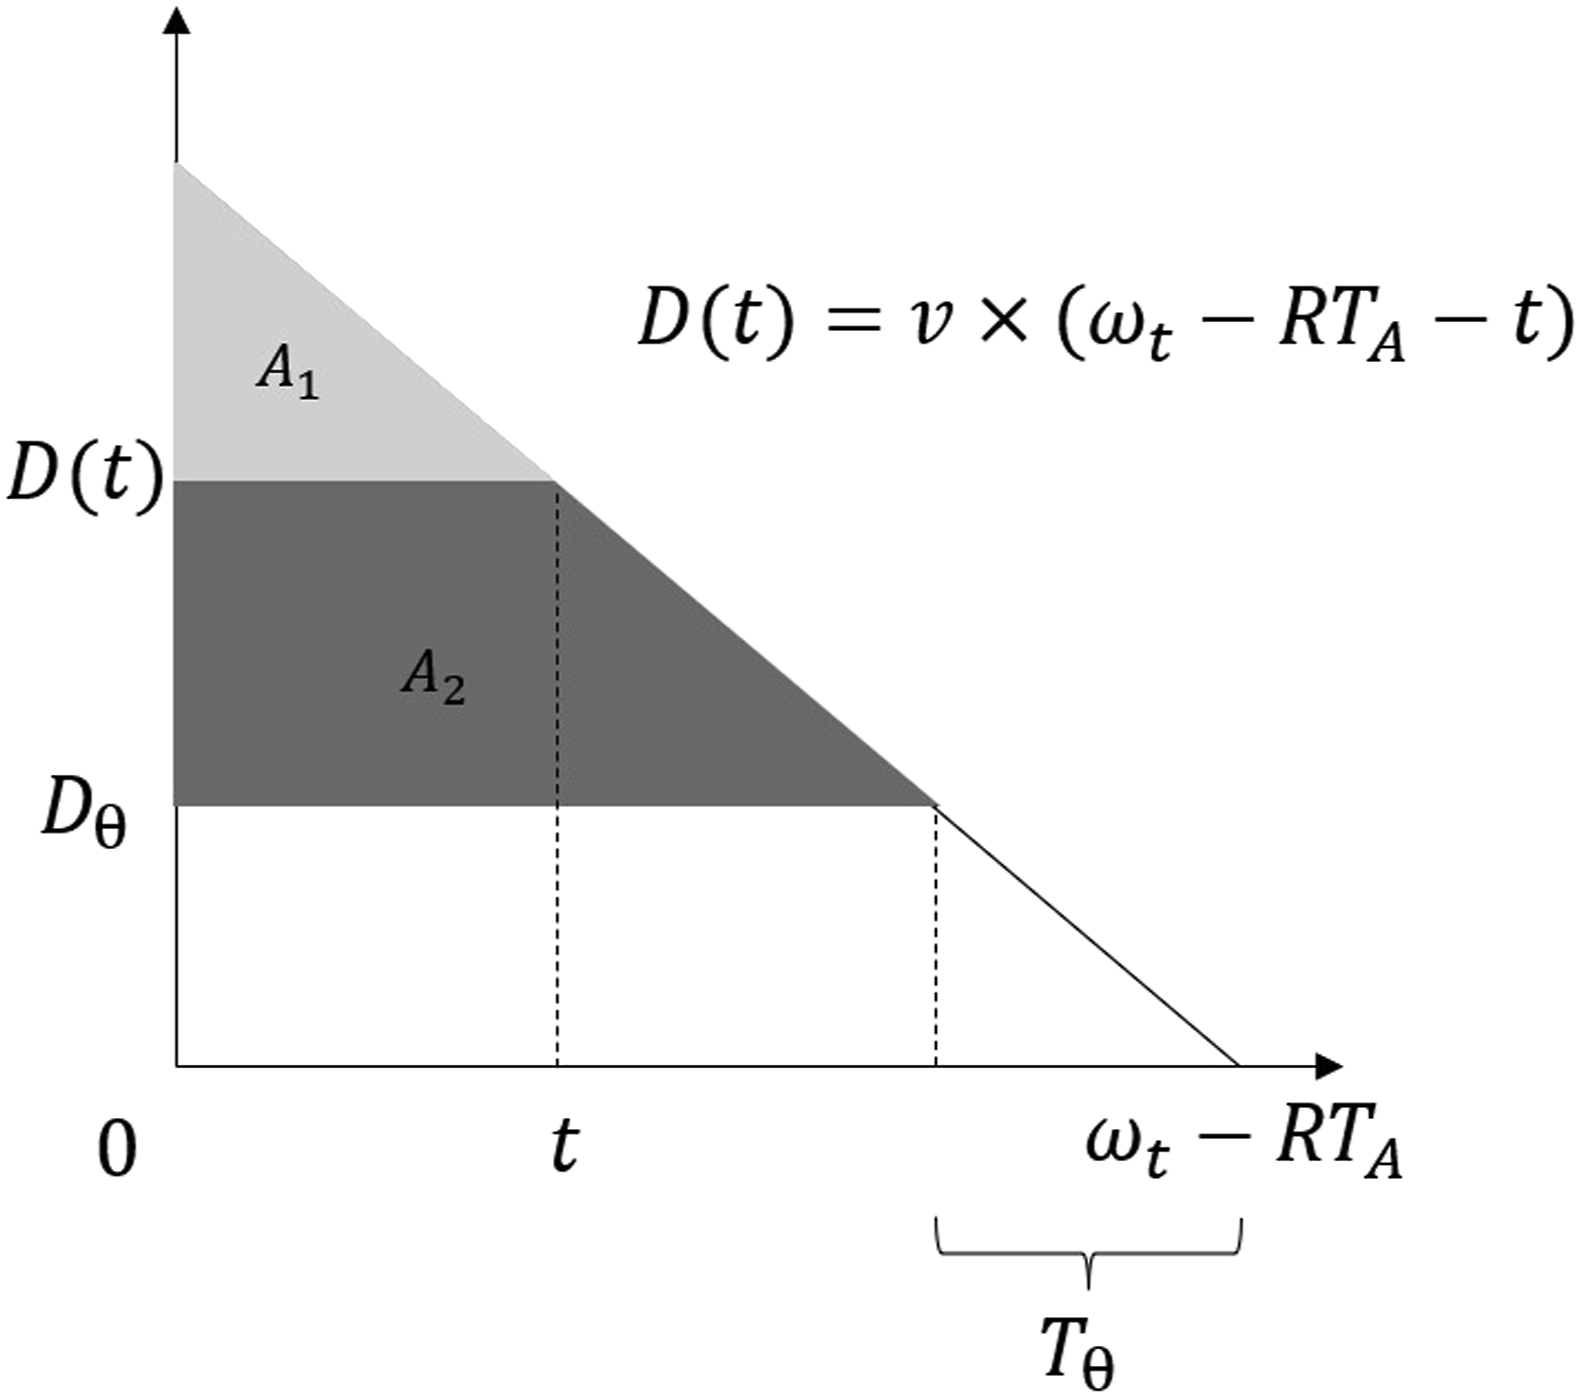
Given the time-varying state transition probability matrix
EXPERIMENTAL STUDY
A preliminary driving simulator study was conducted to validate the mathematical model of takeover response time for freeway exiting in conditionally AVs.
Participants
Ten people (1 male, 9 females) ranging from age 18–47−years old (M = 24.6, SD = 8.6) participated in this study. All of the participants were licensed drivers with an average driving experience of 8 years (SD = 9.0) and an average mileage of 6410 miles (10,316 km) per year (SD = 3011.6 miles (4846.7 km)). Their frequency of freeway driving a year was 11–20 times (10%), 21–30 times (20%), and more than 50 times (70%). To capture the gaze point data using an eye tracker, all of the participants either had normal vision or wore contact lenses for vision correction. People with hearing disabilities or being colorblind were not eligible for participating in the study. These participants were recruited from the general public in the United States via Penn State’s StudyFinder website. Each participant received a $20 eGift Card as compensation. The study was approved by the Institutional Review Board at Pennsylvania State University.
Apparatus
A fixed-based driving simulator (STISIM Drive M300WS-Console system) was used in this study which is installed on a DellTM Workstation. It includes three driving displays that enable a 135° field of view, a STISIM Drive® ADS high-fidelity, full-size steering wheel with active force feedback and 900° rotation, and two advanced foot pedals. The STISIM Drive® Software is programmable and expendable using Open Module, which allows for automated driving programming and control transitions from and to the human driver.
A wearable/head mounted eye tracking tool (Tobii Pro Glasses 2) was used to capture participants’ gaze behavior in real time. The Glasses are equipped with 4 eye cameras (each runs continuously at 100 Hz), a HD (1980 × 1080) scene camera with 90° field of view, and thin side pieces for completely unobstructed side view, which enables to capture wide angle views and ensures natural viewing behavior, including peripheral viewing. The dual image sensor technology enables accurate compensation for head movements and is also used for pupil size measurement compensations.
Experiment Design and Procedure
The independent variable was the lead time (within-subjects; 16, 30, 45, and 60 seconds) of ToRs for freeway exiting. The sequence of four takeover events within each participant was randomized. As a ToR, an auditory warning “Notice! Exit the freeway in XX mile.” in a digitized human female voice (∼150 words/min) was issued together with a hands-on-steering-wheel symbol in white showing up on the car dashboard.
The driving scenario was a simulated three- or four-lane (in the driver’s direction) freeway environment for high-speed vehicular traffic (Figure 5). The traffic density was 13–25 vehicles per mile per lane (8–15 vehicles/km/lane) with all vehicles observing the 4-second rule of following distance (Smithers, 2018). To reduce carryover effect, the freeway exit was on the left side of the road under 30 s and 60 s ToR conditions and on the right side of the road under 16 s and 45 s ToR conditions. At the time of ToR being issued in each takeover event, the subject vehicle was driving on the lane next to the exit-only lane. A car was driving 250 feet (76.2 m) in front of the driver in the same lane with its turning signals on and it changed to the exit-only lane when there was 10 seconds left before arriving at the exit. There was another car driving in the exit-only lane 80 feet (24.4 m) behind the driver. The travel distance was around 10,000 feet (approximately 2 minutes) in each takeover event. An example of driving scenario.
Upon arrival, participants signed a consent form and completed a demographic questionnaire including a 11-point Likert scale question for rating the initial trust in automated driving systems based on their knowledge and/or experience. Then, they were taken through an eye tracker calibration procedure. Only after calibrating the eye tracker successfully, participants went through a practice session containing four takeover events (with a ToR lead time of 45 s in each event) to get familiar with HMI features and practice automated driving in the simulator while playing a video game (Snake VS Block) on a smartphone. The game requires players to swipe from side to side to collect score balls and avoid numbered bricks, which needs to do simple math. After a ToR was issued, participants were told to intervene and resume control by pressing a button whenever they thought it was necessary. In the formal test, participants were encouraged to get high scores in the game, though they can still look up and check the driving status freely. After completing a takeover task, participants rated their trust in the automated systems using a single-item 11-point Likert scale.
Measurements
A Summary of Measures
MODEL VALIDATION
Free Parameters Settings in Driver Models
Validation Method 1: Split Dataset Based on Drivers
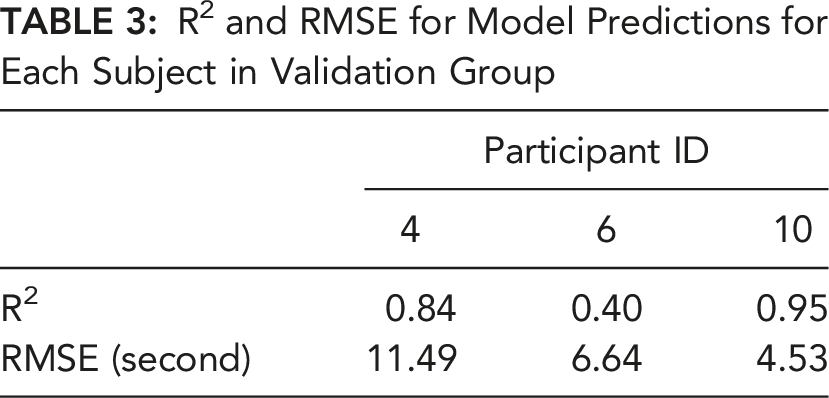
The analysis of eye-tracking data showed that four participants (ID: 1, 4, 8, 10) have alternated attention between the AV driving task and NDRT before takeover. We divided the data of these four participants into two groups, one for parameter setting and the other one for model testing. The dataset of seven participants (ID: 1, 2, 3, 5, 7, 8, 9) were used for estimating the free parameters. The model predictions were compared to the experimental data of the remaining three participants (ID 4, 6, 10). As shown in Figure 6, results showed that the model was able to explain 76% of the experimental data in terms of the takeover response time for freeway exiting with an RMSE of 8.10 seconds. Table 3 summarizes the R2 and RMSE for each of the three participants in the model validation group. The modeled takeover response time for three participants (error bars: ±1 SE). R2 and RMSE for Model Predictions for Each Subject in Validation Group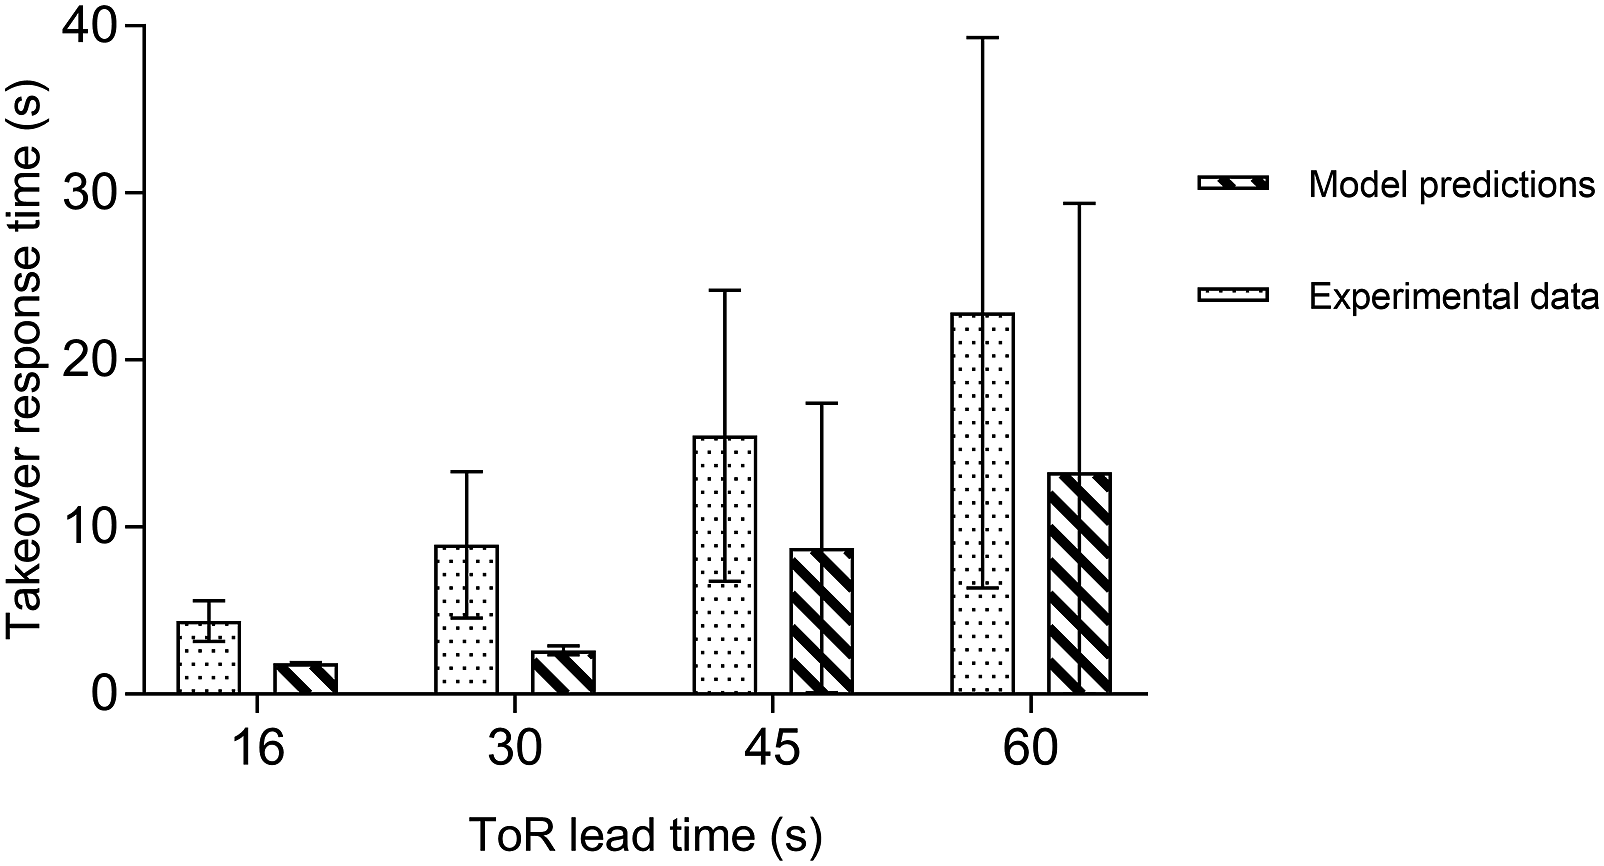
Validation Method 2: Split Dataset Based on Takeover Events per Participant
For each participant, three out of four takeover events were randomly selected for estimating the free parameter, and the data of the remaining takeover event was used for model validation. A total of eight out of 40 takeover events involved the alternating attention and they were divided into the parameter setting and model validation datasets with a ratio of 3 to 1. As shown in Figure 7, the model prediction explained 97% of the experimental takeover response time for freeway exiting with an RMSE of 3.02 seconds. The modeled takeover response time for the last six takeover tasks (error bars: ±1 SE).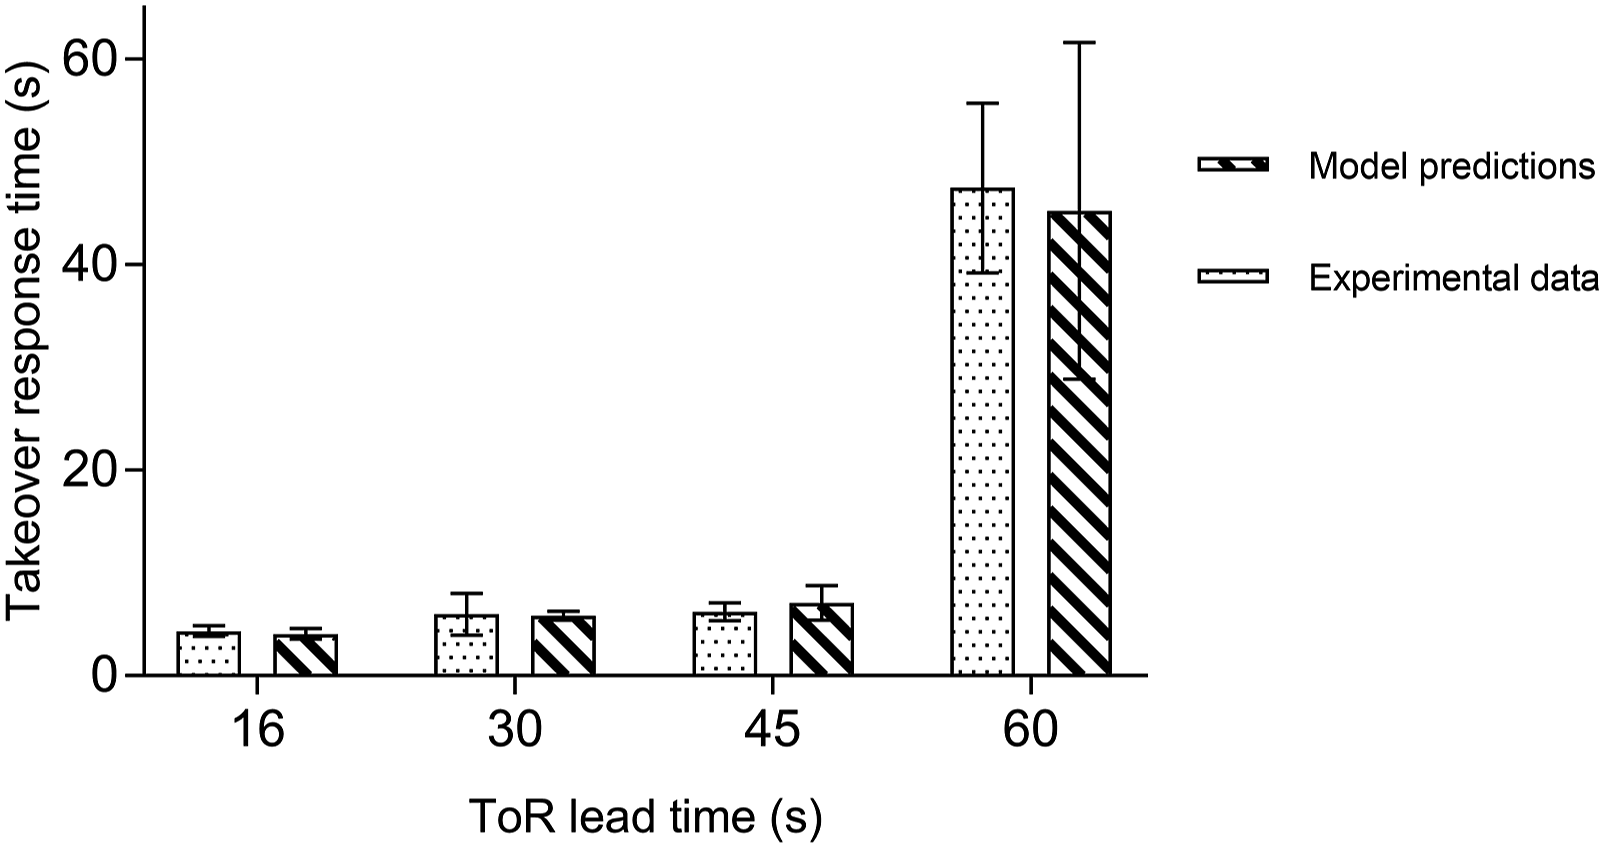
DISCUSSION
This study introduces a preliminary computational model of drivers’ takeover response time for scheduled freeway exiting in conditionally AVs. This model aids in understanding the cognitive mechanism underlying drivers’ information processing and takeover decision-making in non-time-critical takeovers by quantifying gaze redirection in response to takeover request (ToR), task prioritization, driver situation awareness, and driver trust. A laboratory experiment based on a driving simulator was conducted to validate the model. Results demonstrated its moderate-to-good ability to predict drivers’ takeover response time for freeway exiting, considering that the complex cognitive process involved in the alternating attention was modeled using a stochastic approach, not at the neurological level. Using two different methods to split the experimental data into two groups (with one group for free parameter estimation and the other one for model validation) have generated different model fit. Compared with Method 1 using seven participants to predict the remaining three, Method 2 that makes predictions based on other takeover events within participants has improved the R2 by 27% (from 0.76 to 0.97) and reduced RMSE by 63% (from 8.10 to 3.02 s). The improvement in model predictions using Method 2 suggested that individual differences may exist in the takeover response. When the ToR can be planned with ample time for drivers to perform a takeover task, four strategies have been examined by Borowsky et al. (2022) to regain control of conditionally AVs, varying in the prioritization of monitoring the road, performing NDRT, and executing takeover. Factors that affect drivers’ strategy selection include the long-term procedural information derived from their manual driving experience in freeway exiting, the mental model built upon previous takeover occasions in the experiment, and their spur-of-the-moment decisions. It provides a plausible explanation for the outperformance of predicting a driver’s takeover decision-making based on his or her own performance.
This work is one of the first attempts to study a driver’s behavior in non-time-critical takeovers using analytical solutions. Previous studies have successfully employed QN-MHP to model the takeover response time in emergency takeovers that require drivers’ quick intervention to avoid collisions within a short ToR lead time (7 s; Ko et al., 2019, 2022; Sanghavi, 2020). Few attempts have been made on the driver model in non-time-critical takeovers, which allows a larger variance in takeover response time among drivers. The current model fills the research gap by focusing on freeway exiting takeovers that enable a ToR to be scheduled way ahead of time. Based on the QN-MHP architecture, the current model contributes to the literature by: a) modeling the route choice of processing an auditory ToR as a function of driver trust and the level of NDRT engagement, b) modeling the response time to visual entities for executing takeover as a function of driver perception (Level 1 SA), and (c) modeling the stochastic decision-making for alternating attention using Markov chains.
The laboratory experiment has revealed drivers’ delayed gaze redirection and takeover decision-making in non-time-critical takeovers. The finding is consistent with previous research that argues for a distinction between drivers’ ability and motivation to intervene when sufficient time exists (Summala, 2000). Unlike those who respond as rapidly as possible in emergency takeovers, drivers spend more time for assessing the situation before takeover when there is no time pressure (Gold et al., 2013; Pampel et al., 2019). The preliminary work modeled the intentional delay by introducing a free parameter that was estimated by experimental data. The time spent for alternating attention was read from eye-tracking data directly but not modeled at neurological level. More efforts are needed to dive into the theory of psychology and neurosciences for understanding drivers’ selection of strategies in non-time-critical takeovers.
This work applied Markov chains to model drivers’ stochastic decision-making in non-time-critical takeovers. The probabilities of a driver’s attention state transitions were modeled using his or her alternating attention behavior in the same takeover event as a reference and using the driver’s threshold of remaining time as a baseline. The good fit of the model suggests future work to consider each individual driver’s preference of choosing takeover strategies with regard to the timing as well as the driver’s attention state transitions in the current event, such as the proportion of transitions from NDRTs to monitoring AV driving.
In addition, the present study modeled driver perception (Level 1 SA) in the response time to visual entities for executing takeover. The dynamically formulated driver SA acts as the main precursor to decision making, despite the probabilistic relationship between SA and performance (Endsley, 1995). The time spent before a driver executing takeover is partly used to develop SA. Thus, the current model incorporates the fixation count as an input to predict the time of cognitive processing before implementing the takeover decision. Unlike existing empirical studies and modeling work that usually take driver SA as an outcome variable with the purpose to investigate SA bolstering approaches, this study contributes to indicate the potential use of driver perception (Level 1 SA) in modeling the temporal aspect of driver decision making and takeover performance.
Limitations and Future Work
Despite the good model performance, it is important to acknowledge its limitations and discuss possible ways to overcome the limitations in future studies. First of all, the preliminary model did not quantify the effects of driver factors on takeover response time. For instance, drivers’ personality, driving style, and the manual driving experience of freeway exiting might influence their takeover strategies in conditionally AVs. The NDRT type and task demands also could affect drivers’ alternating attention behavior. Moreover, many system characteristics (e.g., reliability, automation level, HMI design) and driving environment (e.g., traffic density and complexity) that are associated with takeover response time need to be integrated into the model in future. Future work could also be done to integrate the present model with other computational cognitive models to model different ToR characteristics, such as fundamental frequency and the number of repetitions of ToRs for emergency collision avoidance takeovers (Ko et al., 2022), warning reliability, and speech warning style for avoiding collisions in connected vehicle systems (Zhang et al., 2022). After an initial ToR is issued, there could be additional auditory and/or visual information provided to assist drivers with scanning the road and making takeover decisions to exit a freeway. Future efforts are suggested to model these HMI technologies and integrate them into the current model. Secondly, the current model was developed and validated using a small sample experimental data (N = 10 × 4). In particular, a portion of the data was used to estimate the free parameters in the model. Future laboratory sessions with a larger sample size can be conducted to further improve the model prediction accuracy and validate the model.
Further efforts can also be made to model the manual driving behavior after takeover, which is crucial for the road safety. When it is still far away from the desired exit after takeover, the driver needs to maintain a high speed on the freeway and keep the car centered in the exit lane or move into the exit lane smoothly if necessary. When a driver takes over as the car arrives at the desired exit, the driver needs to slow down according to the exit ramp speed limit and make an exit possibly on a curvy road. Therefore, the post-takeover driving performance should be modeled in the future work to improve the takeover safety.
KEY POINTS
Existing driver models of takeover response time in time-critical scenarios cannot be directly applied to freeway exiting takeovers, which can be scheduled and non-time-critical. Computational models of takeover response time for freeway exiting in conditionally AVs are still lacking. This work introduces a computational cognitive model of drivers’ takeover response time for freeway exiting in conditionally AVs. The model quantifies the effects of ToR lead time over a large range (16–60 sec), driver Level 1 SA, driver trust, the level of NDRT engagement on the takeover response time. The model validation results demonstrate its moderate-to-good ability to predict drivers’ takeover response time for freeway exiting, accounting for 97% of the experimental data collected from a driving simulator study. The model can be used by designers and developers to test the HMI design in an effective and less costly way. This work also serves as a foundation for the future modeling work towards an integrated driver model of takeover performance in conditionally AVs.
Footnotes
ACKNOWLEGMENTS
The authors gratefully acknowledge the support by the National Science Foundation under Grant No. (1850002) and PSU/Technion Marcus Funds.
Appendix
The model parameters were set based on existing studies as shown in Table A1. Parameter Settings in the Current Model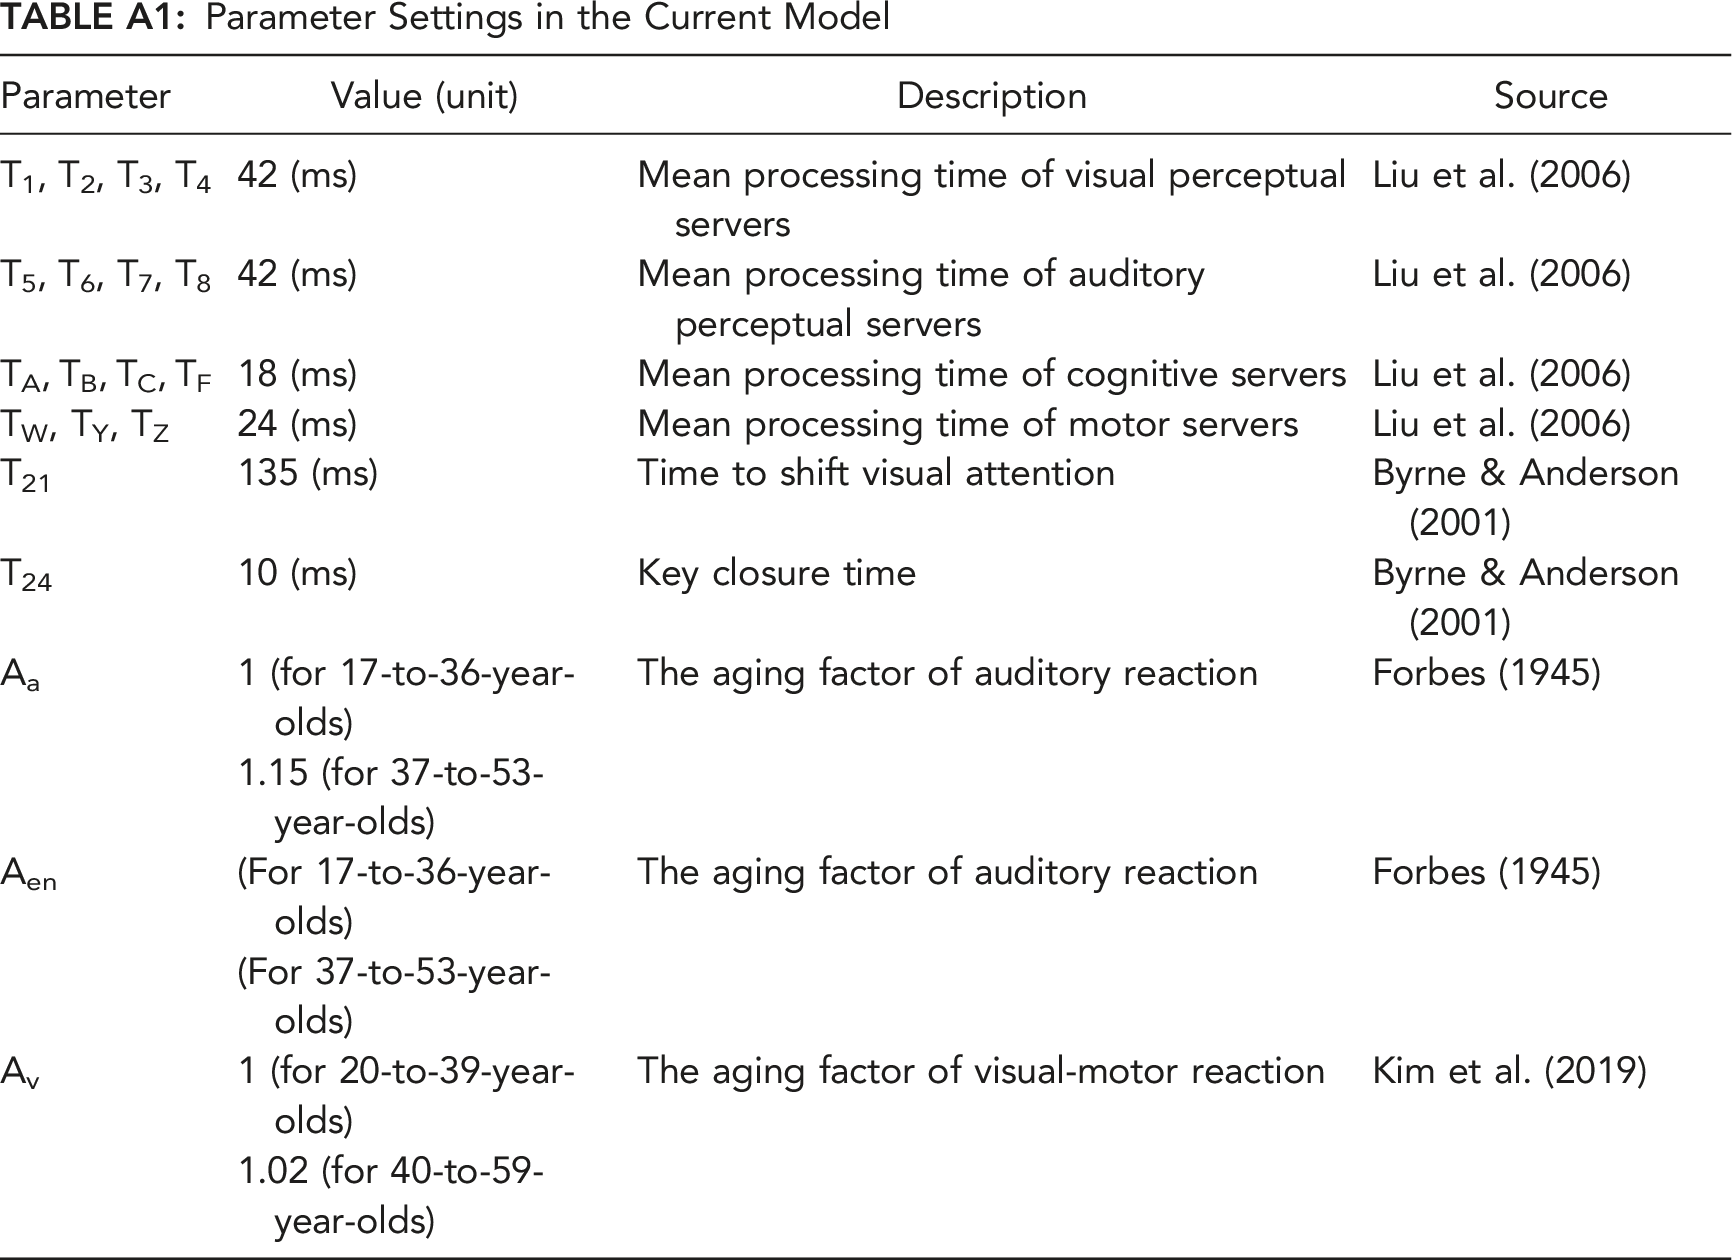
Parameter
Value (unit)
Description
Source
T1, T2, T3, T4
42 (ms)
Mean processing time of visual perceptual servers
Liu et al. (2006)
T5, T6, T7, T8
42 (ms)
Mean processing time of auditory perceptual servers
Liu et al. (2006)
TA, TB, TC, TF
18 (ms)
Mean processing time of cognitive servers
Liu et al. (2006)
TW, TY, TZ
24 (ms)
Mean processing time of motor servers
Liu et al. (2006)
T21
135 (ms)
Time to shift visual attention
Byrne & Anderson (2001)
T24
10 (ms)
Key closure time
Byrne & Anderson (2001)
Aa
1 (for 17-to-36-year-olds)
The aging factor of auditory reaction
Forbes (1945)
1.15 (for 37-to-53-year-olds)
Aen
(For 17-to-36-year-olds)
The aging factor of auditory reaction
Forbes (1945)
(For 37-to-53-year-olds)
Av
1 (for 20-to-39-year-olds)
The aging factor of visual-motor reaction
Kim et al. (2019)
1.02 (for 40-to-59-year-olds)
Xiaomei Tan is currently a PhD candidate in the Department of Industrial and Manufacturing Engineering (Human Factors) at the Pennsylvania State University. Her research focuses on the design and evaluation of human-machine interfaces (HMIs) in connected and automated vehicles, using experimental and computational modeling approaches to assess the effects of HMI design on situation awareness and performance.
Yiqi Zhang is an Assistant Professor in the Department of Industrial and Manufacturing Engineering at the Pennsylvania State University, University Park. She is the director of Human-Technology Interaction Lab and affiliated with the Larson Transportation Institute at Penn State. She received a PhD degree in Industrial and System Engineering at the University at Buffalo in 2017. Her research interests lie in the area of human performance modeling, driver behavior and driving styles, situation awareness, and warning system design. Dr Zhang has served as the editorial board member for Human Factors and Ergonomics in Manufacturing & Service Industries since 2018 and the associate editor for IEEE Transactions on Intelligent Transportation Systems.