
Abstract
Objective
Use Fitts’ law to compare accuracy and throughput of three flight deck interfaces for navigation.
Background
Industry is proposing touch-based solutions to modernize the flight management system. However, research evaluating touchscreen effectiveness for navigation tasks in terms of accuracy and throughput on the flight deck is lacking.
Method
An experiment was conducted with 14 participants in a flight simulator, aimed at creating Fitts’ law accuracy and throughput models of three different flight deck interfaces used for navigation: the mode control panel, control display unit, and a touch-based navigation display. The former two constitute the conventional interface between the pilot and the flight management system, and the latter represents the industry-proposed solution for the future.
Results
Results indicate less accurate performance with the touchscreen navigation display compared to the other two interfaces and the throughput was lowest with the mode control panel. The control display unit was better in both accuracy and throughput, which is found to be largely attributed to the tactile and physical nature of the interface.
Conclusion
Although performance in terms of accuracy and throughput was better with the control display unit, a question remains whether, when used during a more realistic navigation task, performance is still better compared to a touch-based interface.
Application
This paper complements previous studies in the usage of aircraft touchscreens with new empirical insights into their accuracy and throughput, compared to conventional flight deck interfaces, using Fitts’ law.
Keywords
Introduction
The modern-day flight management system (FMS) was introduced on the Boeing 767 in 1982 (Bulfer, 1991) to assist pilots in both lateral navigation (LNAV) and vertical navigation (VNAV). As an interface to the FMS, the control display unit (CDU) was introduced and remains the industry standard to date. For example, when the CDU on the Boeing 787 was replaced with a digital copy, the look and feel remained the same.
However, looking ahead at future developments in LNAV procedures, the necessity to modernize the FMS interface becomes evident. The SESAR Joint Undertaking expects the number of flights in European airspace to have increased by 52% in 2035 compared to 2012 (SESAR Joint Undertaking, 2014). As a result, Huisman, Verhoeven, Van Houten, and Flohr (1997) expect an increased frequency of en-route route adjustments. Van Marwijk, Borst, Mulder, Mulder, and Van Paassen (2011) call for “a redesign of the navigation planning interface [due to] increasing punctuality in, [amongst others,] European SESAR concepts, [which will] make airborne flight plan amendment increasingly complex.”
Touchscreens have the potential to reduce cognitive workload and increase situation awareness due to their “intuitive” way of interaction and their flexibility in displaying additional task-relevant information, respectively (Dodd et al., 2014; Hutchins, Hollan, & Norman, 1985; Kaminani, 2011; Rogers, Fisk, McLaughlin, & Pak, 2005; Shneiderman, 1982). As such, aircraft and equipment manufacturers have been proposing touchscreens on their newest flight decks in anticipation of increased complexity in future navigation tasks. However, concerns have been voiced about the loss of tactile feedback, usability in dynamic environments (e.g., turbulence), and physical fatigue of operation (Degani, Palmer, & Bauersfeld, 1992; Dodd et al., 2014; Kaminani, 2011; Stuyven, Damveld, & Borst, 2012).
Previous research has been done evaluating touchscreen interfaces in general and comparing them to less direct interfaces such as trackballs, trackpads, and rotary controllers (Ballas, Heitmeyer, & Pérez-Quiñones, 1992; Bjørneseth, Dunlop, & Hornecker, 2012; Degani et al., 1992; Forlines, Wigdor, Shen, & Balakrishnan, 2007; Stanton, Harvey, Plant, & Bolton, 2013). In the aviation domain, Dodd et al. (2014) found increased task execution time, error rates, and subjective workload for touchscreen usage in turbulence and at specific cockpit positions. However, a truly comparative study between a touchscreen and conventional flight deck interfaces on a fundamental input level, quantified in terms of input accuracy and information throughput as a function of task complexity, has not yet been carried out.
The goal of this research is to develop and compare accuracy and throughput models of three flight deck interfaces used during LNAV. These interfaces are the mode control panel (MCP), the CDU, and a touch-based navigation display (TND), illustrated in Figure 1. The models will be developed based on variations of Fitts’ law (Fitts, 1954). This law, first published in 1954, has been used by human–machine interaction researchers for analysis of the speed-accuracy trade-off and movement time (MT) in rapid aimed movement tasks (Jagacinski & Fisch, 1997; Jagacinski, Repperger, Ward, & Moran, 1980; Stoelen & Akin, 2010; Trudeau, Udtamadilok, Karlson, & Dennerlein, 2012), and as a valuable tool for human–machine interface design (Flach, Hagen, O’Brien, & Olson, 1990; Francis & Oxtoby, 2006; Gao & Sun, 2015; Jax, Rosenbaum, Vaughan, & Meulenbroek, 2003; MacKenzie, 1992; Soukoreff & MacKenzie, 2004). Fitts’ law models also enable quantitative comparison of the effectiveness of different interfaces based on their throughput (Jagacinski & Fisch, 1997; MacKenzie, 1992; Soukoreff & MacKenzie, 2004), describing how many bits of task difficulty, as defined by an index of difficulty (ID), an interface can handle per second.
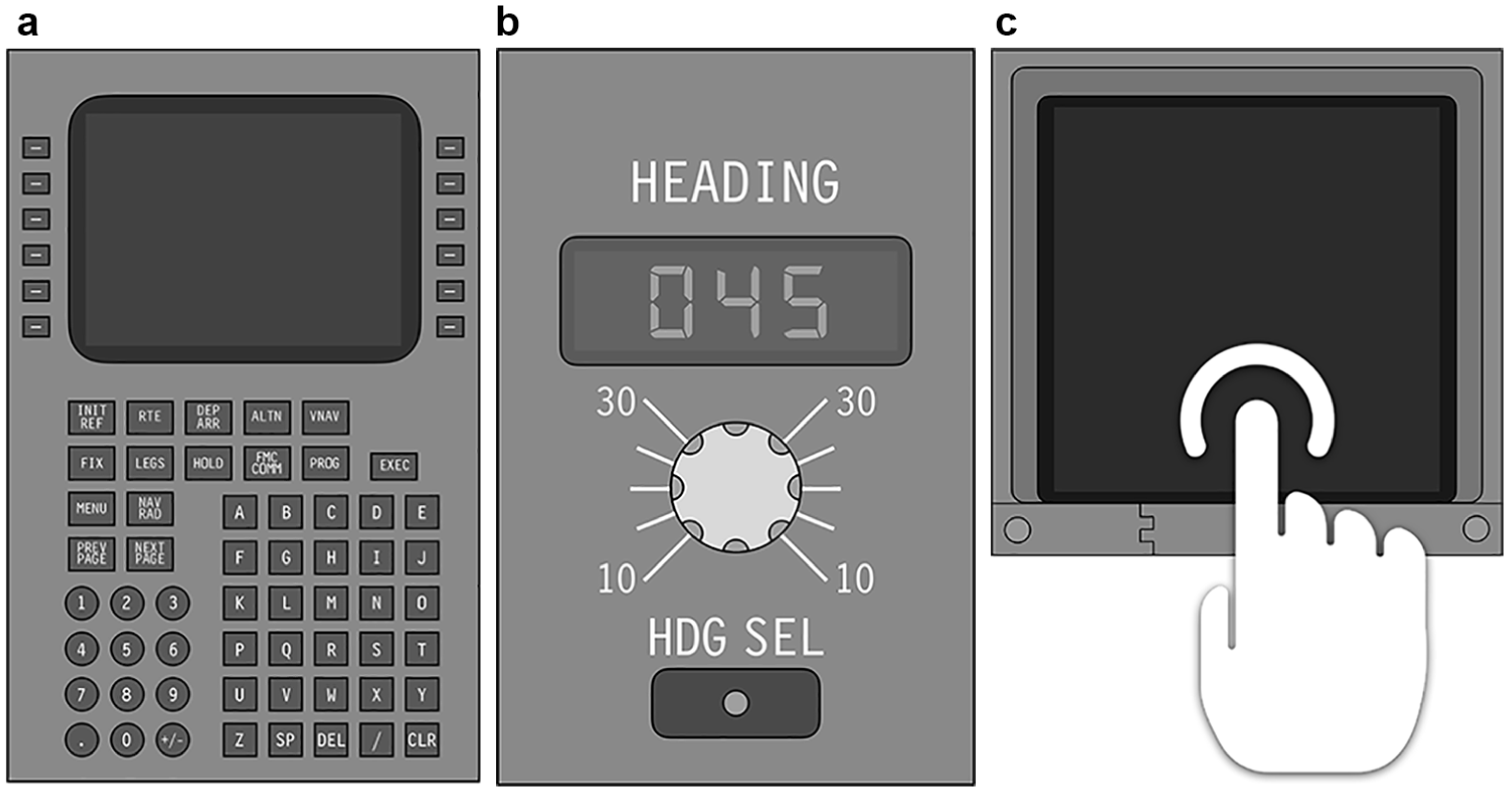
Three flight deck interfaces that are to be investigated: (a) heading control knob on the mode control panel (MCP), (b) control display unit (CDU), and (c) touch-based navigation display (TND).
Fitts’ Law
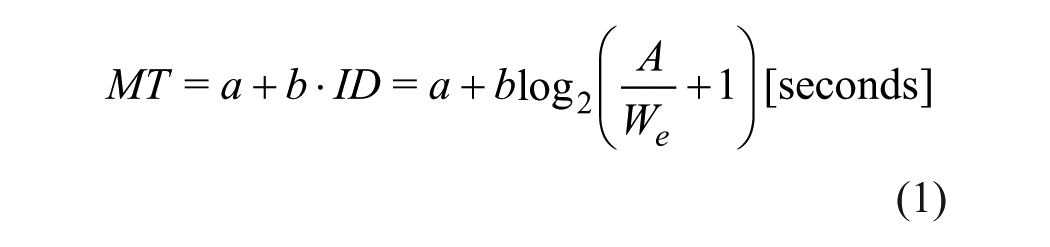
The complete and original Fitts’ law model (Fitts, 1954) that describes MT as a function of ID in a high-accuracy pointing task is presented in Equation 1. Here, a and b are empirical linear regression constants, A is the amplitude (distance to be traversed), and We is the effective width of the target. The latter is empirically calculated using the standard deviation of measured endpoint coordinates (Soukoreff & MacKenzie, 2004).
The usefulness of Fitts’ law in this study is twofold. First, it can help build models of task execution time for a particular interface. Second, it can provide a quantitative description of the FMS interface by comparing the throughput (TP) of individual interfaces. Equation 2 defines the throughput in bits per second, which is calculated by dividing the ID by the measured MT for each participant and experimental condition. The total numbers of conditions and participants are defined by x and y, respectively.

Mode Control Panel (MCP)
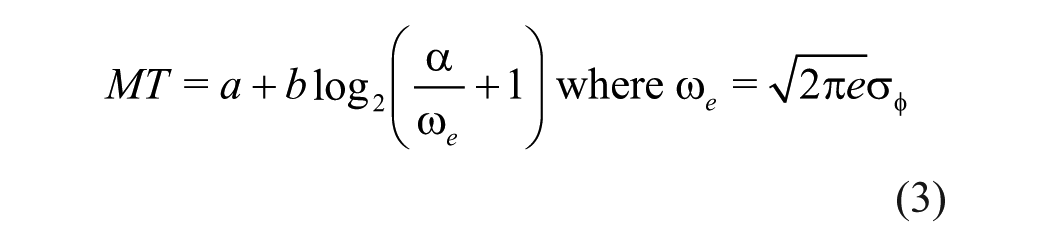
The MCP is the standard interface between the pilot and the autopilot and uses, among others, a rotary heading control knob with which the horizontal flight direction (i.e., heading) can be changed. Research by Stoelen and Akin (2010) has shown that Fitts’ law can be extended to rotational input tasks by replacing the linear width and amplitude with an angular width ω and amplitude α, respectively. The effective angular width ω
e
can be calculated based on the standard deviation in endpoints
Control Display Unit (CDU)
The CDU is a keyboard-type input device by which pilots can change a planned flight route by entering or deleting waypoints. Research by MacKenzie and Buxton (1992) and Soukoreff and MacKenzie (1995) has shown that Fitts’ law can be extended to keyboard data-entry tasks. The model, shown in Equation 4, is based on an assumption that using either the minimum height H or width W of the target in the computation of the ID is sufficient. MacKenzie and Buxton (1992) have found this to provide adequate results. In the case of a key-repeat task, the amplitude is zero and thus the ID, namely
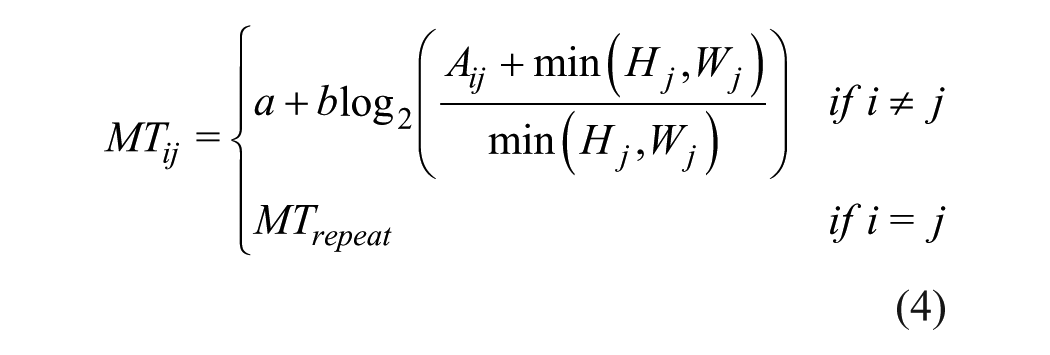
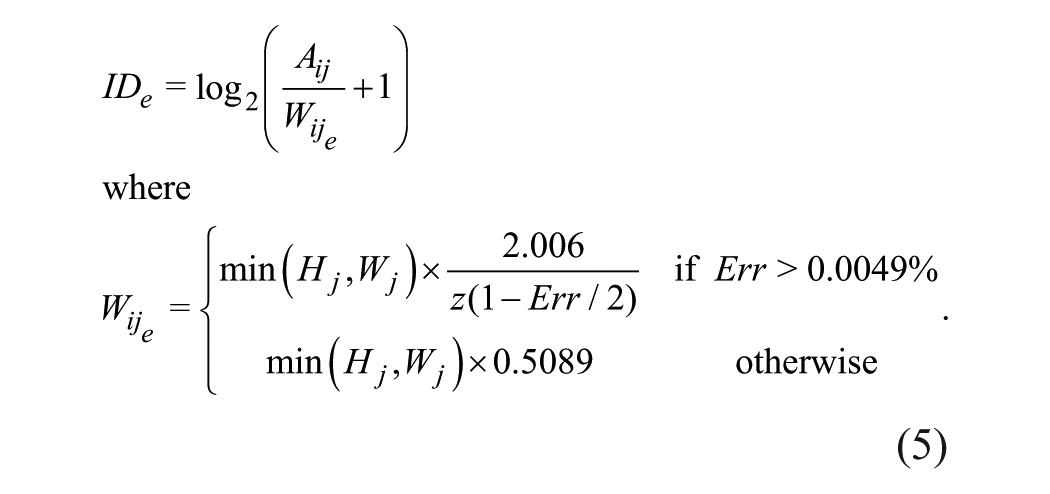
Furthermore, due to the physical inability to measure movement endpoints on the keys, the computation of the effective width is troublesome. As such, an alternative approach was proposed by Soukoreff and MacKenzie (2004) based on error rate, as presented in (Equation 5) and used in this research. Here,
Touch-Based Navigation Display (TND)
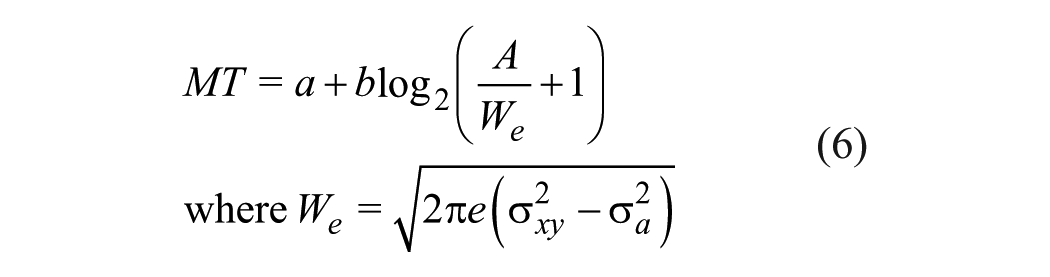
Research by Bi, Li, and Zhai (2013) has extended the original Fitts’ law to produce the Finger Fitts’ Law, shown in Equation 6. Their research proved effective in modeling finger input using touchscreens. Two new parameters are introduced: σ, the variation in movement endpoints, and σ a , the variation in input device precision (e.g., finger width). The former is calculated using the distribution in endpoint coordinates during the task, where a bivariate standard deviation σ xy is used for two-dimensional (2D) movements. The latter can be measured using a finger calibration task, where users are asked to repeatedly touch an identical (in size, not location) target; exact touch locations are used in this research to calculate the bivariate standard deviation σ xy instead of σ.
Method
The objective of the experiment was to develop and compare Fitts’ law models for each of the three interfaces using the respective models described earlier. The experiment consisted of three separate, but similar sub-experiments corresponding to the interfaces. The overarching design of the experiment is discussed here, followed by a brief discussion of each sub-experiment focusing on one interface. Each experiment explicitly measured the effect of ID on the observed MT for participants engaged in an aimed rapid movement task using the respective interface.
Participants
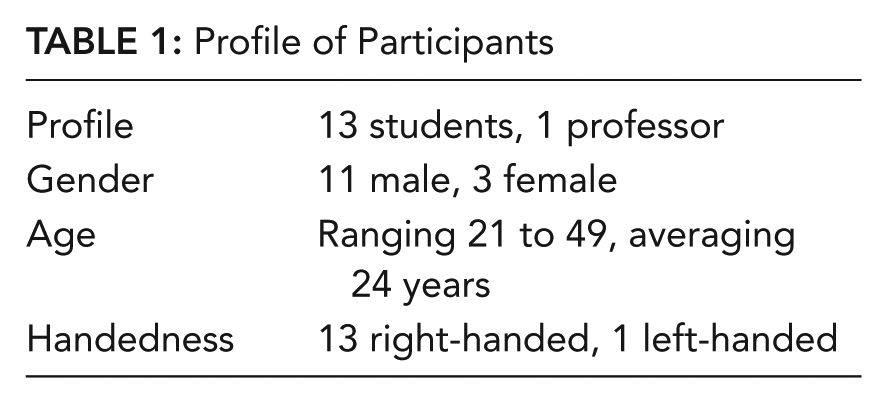
Given that the goal of the experiment was to describe human performance in performing a precision pointing task for a specific interface using Fitts’ law, prior experience with piloting aircraft and/or interacting with the interfaces was not relevant. The lack of previous encounters with either the MCP or CDU (for example by naive participants) was dealt with during a training phase, where each participant got sufficiently accustomed to the input device (see “General Procedure”). Right-handed participants were preferred given the positioning in the left seat and thus interface operation with the right hand. A total of 14 people participated in the experiment, of which a brief profile is given in Table 1. Note that one left-handed participant was invited in order to see the effect of handedness in using the TND.
Profile of Participants
Experiment Design
The experiment had a within-participants design. Figure 2 illustrates the different orders employed in presenting the conditions for 12 participants. Three groups of four participants (A, B, C) were administered the same interface order. The remaining two participants followed the order of the first two groups and of which one was left-handed. Given that each interface was different, different manipulations were required to achieve comparable indices of difficulty. The design was such that number of repetitions per unique ID per participant ranged between 10 and 12, similar to that found and recommended in literature (Accot & Zhai, 1997; Bi et al., 2013; Soukoreff & MacKenzie, 2004; Stoelen & Akin, 2010). The specific manipulations per interface condition will be detailed in the description of the interface conditions. Finally, the ranges of the evaluated inputs per interface condition were representative for a realistic LNAV re-routing task to avoid a weather cell (i.e., dialing in a heading with the MCP, inserting a new waypoint using the CDU, and finger dragging a waypoint using the TND).
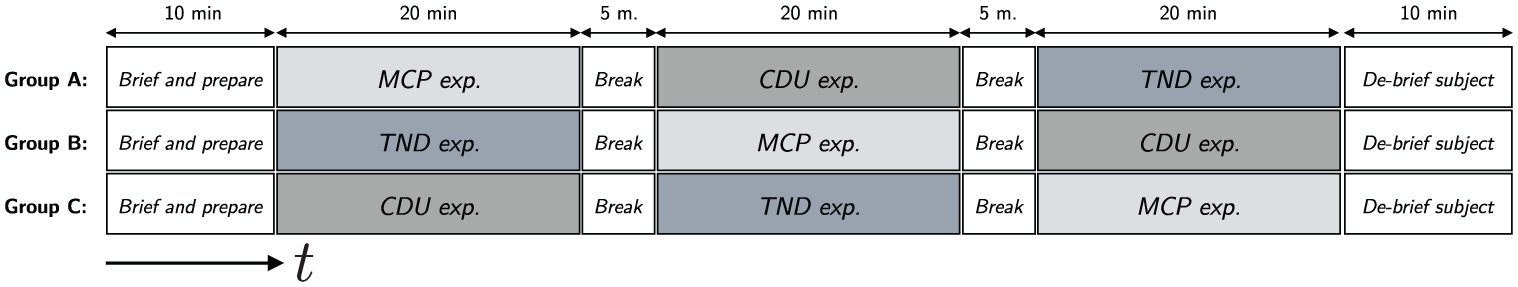
Schedule of the experiment per participant group.
Apparatus
The experiment was conducted in the SIMONA Research Simulator (SRS) at the Delft University of Technology, shown in Figure 3. Motion and outside visual capabilities were not utilized; however, the interior cabin provided a realistic look and feel to the interaction between participants and the three flight deck interfaces. Similar to a real flight deck, the locations and sizes of the interfaces, as well as the position of the participants in the left seat, and left of the interfaces, were fixed.
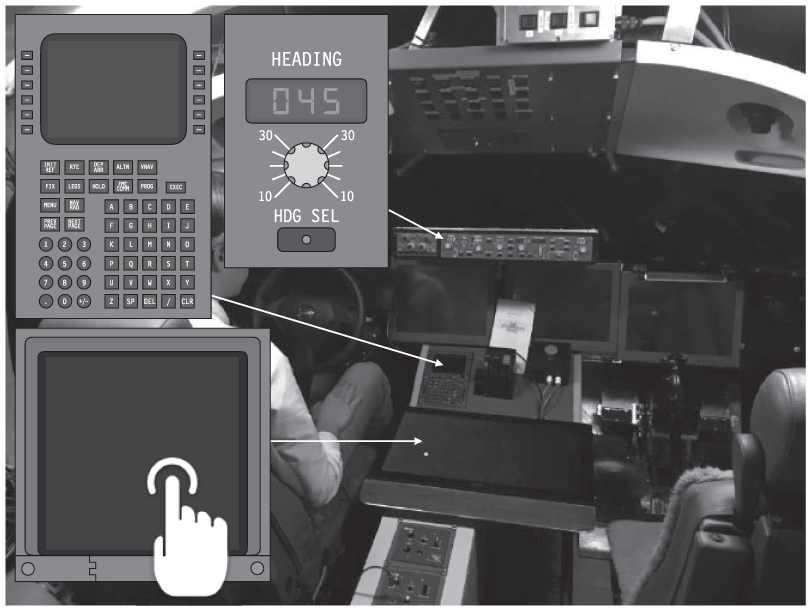
Cabin of the SIMONA Research Simulator (SRS) showing each of the three flight deck interfaces.
Due to space confinements in the SIMONA Research Simulator, the touchscreen was located below the CDU (see Figure 3). As a result, to allow for a proper comparison, the participants were required to put their seat backwards when using the TND. Markers were installed on the cabin floor to ensure constant seat positioning. As such, the participant’s relative location to the touchscreen was comparable to that of the CDU and MCP.
General Procedure
This research complied with the tenets of the Declaration of Helsinki and was approved by the Human Research Ethics Committee of TU Delft. Informed consent was obtained from each participant. Participants received a briefing document a few days prior to the experiment. An introduction was given concerning the relevance of the experiment, the task to be conducted, and the expected time schedule. Prior to each interface condition, following a standardized procedure, a verbal briefing was given. Most importantly, and “essential for any Fitts’ law experiment” (Soukoreff & MacKenzie, 2004), the participant was requested to put specific emphasis on speed and accuracy in order to achieve an approximate 96% target hit-percentage with a smooth consistent input motion. Feedback on actual hit-rates was provided during all runs of the experiment. Training runs preceded data measurement and provided participants with time to master the speed-accuracy trade-off. When they reached the 96% target, they were considered to be sufficiently trained. More details on specific procedures per interface condition will be provided later.
Mode Control Panel (MCP) Condition
The MCP setup is presented in Figure 4. On the inboard screen, the navigation display (❶) is shown, on which the task information was presented. A magenta heading bug (see ❷) indicates the heading commanded on the MCP. At the start of each trial, the bug was reset to the north-up position. Two independent variables were used: the angular amplitude α and angular width

These combinations resulted in an ID range of
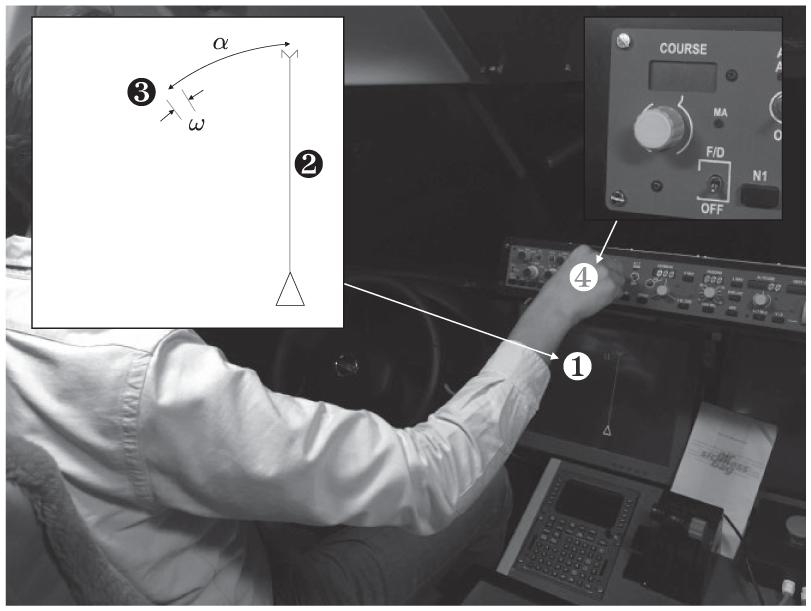
Experiment procedure for mode control panel (MCP) experiment, showing an illustration of the navigation display and heading control knob.
Participants needed to use the course select rotary knob to hit the target ω at a certain amplitude α. The course select knob (illustrated by ❹) on the MCP is a standard rotary encoder with 24 “clicks” per full rotation. Note that for this study, the course knob was used due to a malfunction in the heading knob. Because both knobs operate in the same fashion (although they are used in a different navigation context) and initial hand movements toward the knob was not included in movement time measurements, this was not considered problematic. A small LCD display above the knob reflected the commanded heading. The movement time MT to hit the target was measured in milliseconds. In accordance with recommendations in literature (Soukoreff & MacKenzie, 2004) only the actual time the participant moved the heading knob was measured, thereby omitting engage, homing, dwell, and reaction times. Hereby, confounding factors such as cognitive effort required to understand the task and initial hand movements toward the interface were mitigated. Accuracy was measured by recording the physical endpoints of each individual movement. During the experiment the success rate in acquiring the target was displayed in the control room and communicated to the participant to provide feedback on their adherence to the speed-accuracy trade-off governing Fitts’ law.
The training phase for the MCP condition contained one full set of 24 combinations. The measurement phase constituted eight sets of 24 combinations, totaling 192 measurements runs.
CDU Condition
The experiment setup is shown in Figure 5. An illustration of the CDU including the display is shown in ❶. In a re-routing LNAV task, pilots use the CDU to insert new waypoints by entering their name in the scratchpad (see ❷) and inserting it in the list of waypoints through one of the line select keys (LSK; see ❸). The
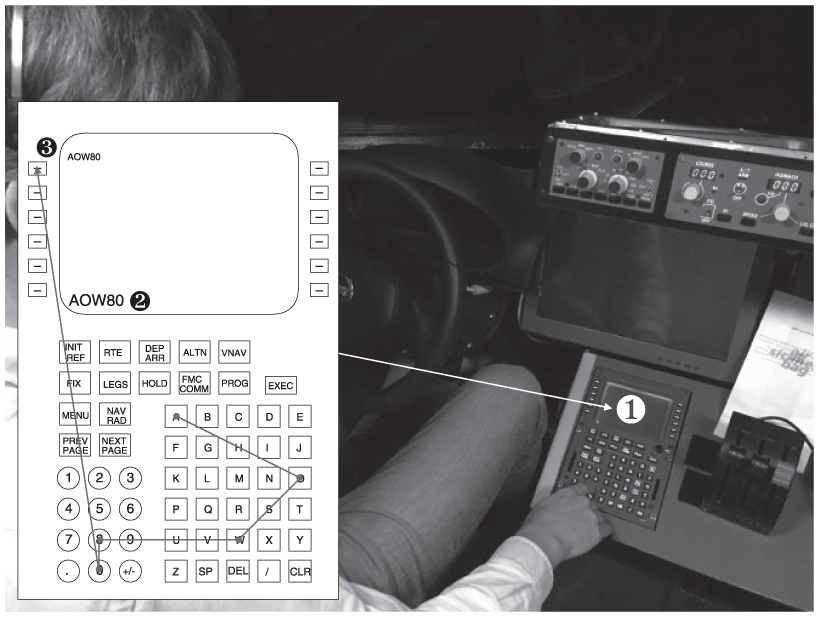
Experimental setup for control display unit (CDU) experiment, showing an illustration of the control display unit and location within the flight deck.
In this experiment, the variables A and W were defined by a set of words that needed to be entered and subsequently moved to target line select keys. Figure 5 shows an example where a participant is required to enter the word
In order to complete the model, one word consisted of repeated keys in order to determine

An accurate technical drawing of the CDU used during the experiment was consulted to calculate A and W and resulted in an ID range of
The combinations of words and LSKs provided a total set of 36 different conditions, each of which consisted of five Fitts’ law movements. Therefore, a minimum of 180 Fitts’ law measurements could be made during one set of combinations.
Similar to the MCP experiment, the movement time MT, excluding homing, dwell, and reaction times, was measured in milliseconds. The accuracy, measured as the number of correct inputs divided by the total amount of keystrokes, was measured and used to provide as feedback to participants. Endpoint distributions of the inputs (i.e., finger locations) on the keys could not physically be measured, however. The training consisted of one block of all 36 conditions (in a random order) and the measurement phase featured two blocks of 36 conditions.
TND Condition
The experiment setup is shown in Figure 6. A large touchscreen was installed horizontally on the center pedestal of the SRS cockpit. An illustration of the display presented on the screen is shown in ❶. A white object was shown with a magenta crosshair at its center (see ❷), which could be moved around using touch-based input.
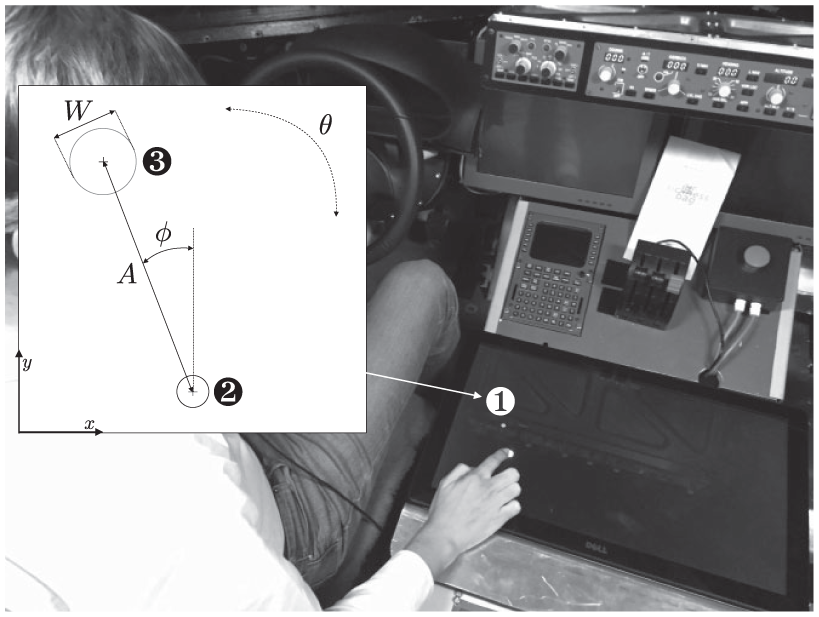
Experimental apparatus for the touch-based navigation display (TND) experiment, showing an illustration of the touchscreen display and its location on the flight deck.
The target was depicted using a cyan circle (see ❸) with a black crosshair. The distance to be traversed, the amplitude A, and the diameter or width W of the circular target constituted the two variables that were manipulated. A representative and wide variety of variables A and W were selected. Finally, given that literature has found direction to be a confounding factor (Soukoreff & MacKenzie, 2004), a direction “heading” variable ϕ and display rotation variable θ were introduced, as illustrated in Figure 6. The rotation angle θ rotates the entire reference frame of the display.

The choice in variables resulted in a total set of 192 different input combinations. However, only 16
Consistent with the MCP and CDU experiments, the MT, excluding homing, dwell, and reaction times, was measured in milliseconds. Accuracy was the other dependent variable and was measured by recording physical endpoints of each individual movement. Given the 2D nature of the task, a bivariate endpoint standard deviation
For the finger calibration task to calibrate
The task setup in both the training and measurement phases were equal. Once the participant was ready, a set of 192 conditions were loaded, and both the object and target were reset to their respective positions. Measurement started when the participant had successfully acquired the object and started to move it. Object acquisition was done by providing a touch input within a touch area equal in size and location of the object. During the experiment, the success rate in acquiring the target was displayed in the control room and communicated to the participant to provide valuable feedback on their adherence to the speed-accuracy trade-off governing Fitts’ law.
Training consisted of 192 runs containing all possible combinations, and the measurement phase features again 192 runs, albeit in a different (randomized) order.
Results
The numerical results of the three interface conditions are summarized in Table 2, the model fits are shown in Figure 7, and the distributions of accuracy values per interface are depicted in Figure 8. For the MCP condition, the proposed adjustment based on accuracy was done by computing the effective width We based on the actual distribution of movement endpoints per ID. Based on the effective width We, an effective index of difficulty
The Fitts’ Law Model, Quality of Fit
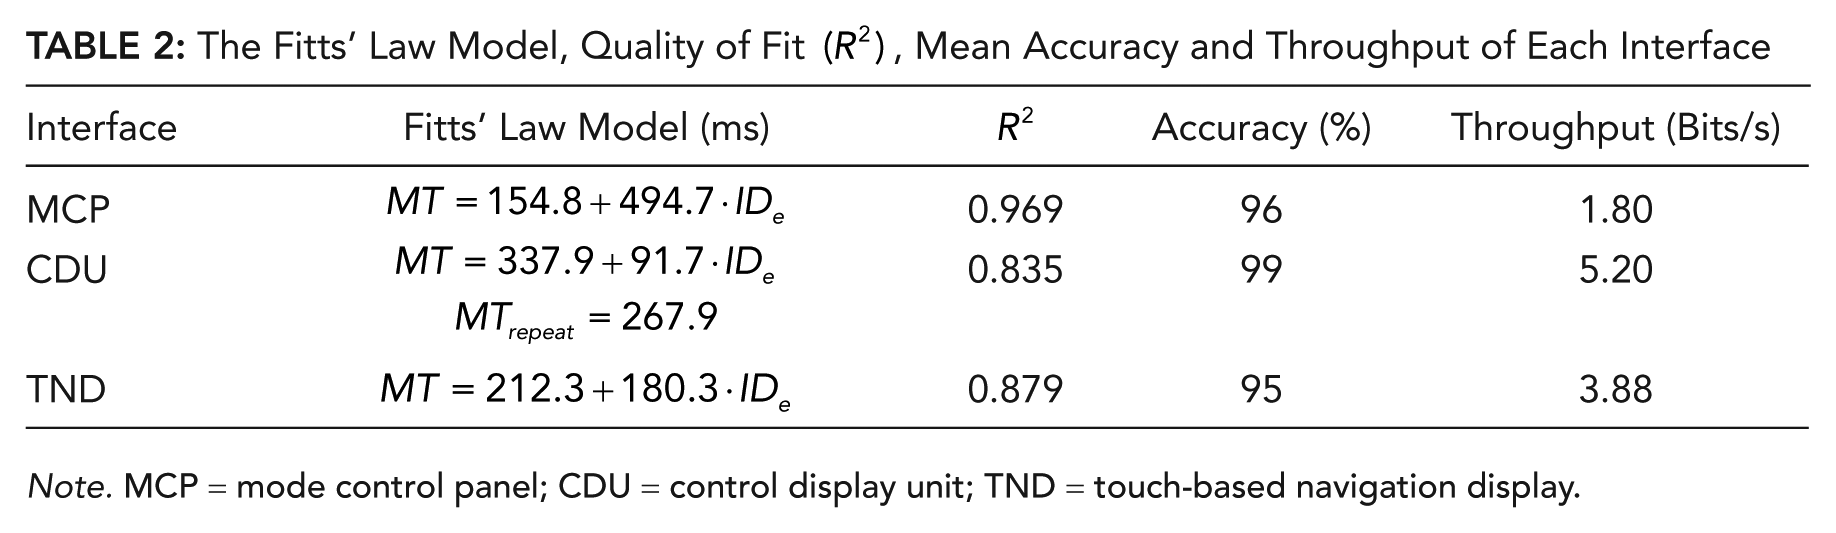
Note. MCP = mode control panel; CDU = control display unit; TND = touch-based navigation display.
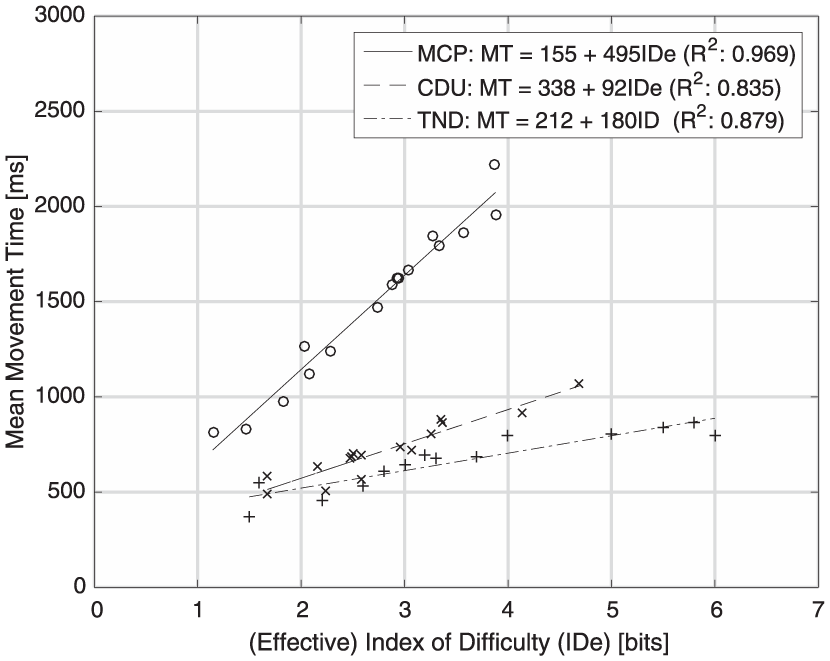
Final Fitts’ law models of each individual interface plotted on the same graph for comparative purposes.
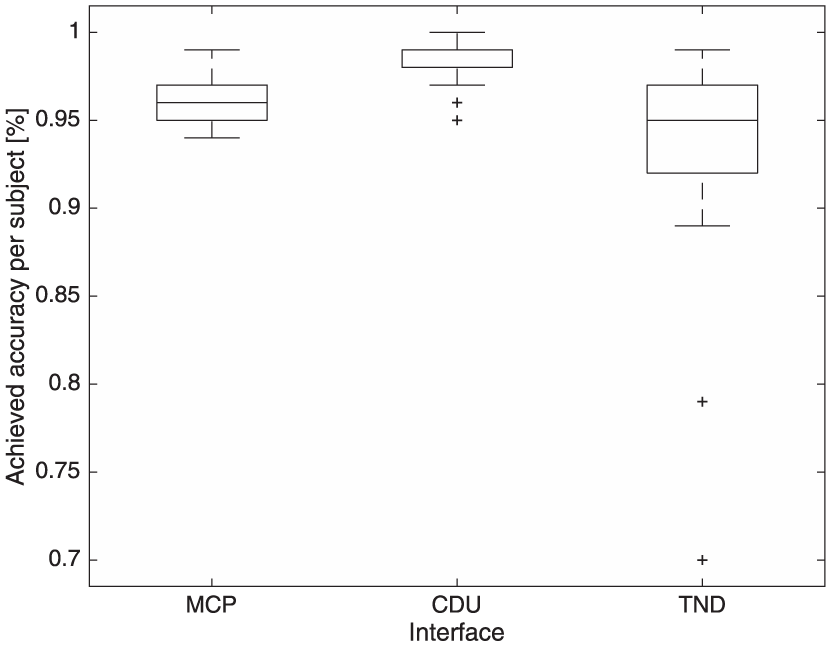
Observed accuracy scores per participant per experiment.
For the CDU condition, the proposed adjustment for accuracy was done by computing the effective width We based on the error percentages per ID. Based on this effective width We, an effective index of difficulty IDe was calculated (plusses in Figure 7). An ANOVA test showed a significant effect of ID on mean MT,
For the TND condition, the proposed adjustment for accuracy was done by computing the effective width We as shown in Equation 6. Based on We, an effective index of difficulty IDe was calculated (crosses in Figure 7). An ANOVA test concluded that there was a significant effect of ID on MT,
Discussion
The results of all three interface conditions show that the different variations of Fitts’ law, acquired from literature and introduced in this article, are adequate ways to develop and compare accuracy and throughput models for the MCP, CDU, and a TND. This is illustrated by Figure 7, and the
Furthermore, when scrutinizing the y-intercept parameter (a) of each Fitts’ law model, the CDU indeed results in the largest expected movement time for tasks of zero difficulty, namely 338 ms. The TND follows with 212 ms. Interestingly, the
In terms of accuracy, the MCP scores similar to the TND, but the variability is much smaller than for the heading control knob on the MCP. This finding is very similar to that of Stanton et al. (2013), who also compared a rotary controller with a touchscreen. Interesting to note is that even though data were only available from one left-handed participant, these scores were 70% on the TND compared to 96% and 99% on the MCP and CDU, respectively. This suggests that using the traditional interfaces with a non-dominant hand is easier than with a touchscreen. This finding is intriguing, given that the pilot position within the flight deck relative to interfaces is fixed and cannot easily be adjusted by the pilot. Further research on the effect of handedness on flight deck performance is therefore warranted. Following discussions with participants and observations made during the experiment, the accuracy results could also have been attributed to the tactile nature of and the fixed physical locations of the dials and buttons on the traditional interfaces. Due to the lack of tactile feedback and high freedom of movement with the touchscreen, precise inputs were sometimes more difficult to achieve.
Regarding throughput, scores were highest with CDU, followed by the TND and MCP, respectively. According to Figure 7, the TND and CDU result in similar movement times at low ID values (i.e., 1.5) as their Fitts’ law models converge. At higher ID values, however, the lines diverge and the TND is at a disadvantage compared to the CDU. Based on these results it can be said that for a given short time interval, the CDU can handle more difficult tasks compared to the other two interfaces. This may be explained by the calculation of ID, which is defined by the movement amplitude and target width. On the CDU the target width remained constant, given that the keys had a pre-defined size. Hence, the difficulty in movements was reflected in the distance to be moved. Thus, moving a larger distance was observed to be easier than acquiring a very narrow target, which is reflected by Equation 4. In addition, the physical keys on the CDU make it fairly easy to acquire the target successfully. On the contrary, with the MCP and TND, target difficulty varied both by amplitude and width. For the latter, it was observed on both interfaces that a very narrow target slowed down participants and required them to be more accurate. Finally, movement times were found to be substantially longer for the MCP than for the other two interfaces. This may be attributed to the latency and nonlinear movement of the heading control knob noted by several participants. Research by Stanton et al. (2013) also found that use of a rotary controller resulted in longer task times compared to a touchscreen interface.
Although scores with the CDU were highest on both accuracy and throughput, this does not imply that it is therefore the most optimal interface with the FMS. During the experiment, participants were asked to locate the necessary keys prior to key entry to keep cognitive effort at a minimum. Hence, good performance with the CDU reflects that the user is fully aware of the necessary steps to execute. However, during a more complex task, a substantial amount of cognitive effort is expected in determining the necessary actions with the CDU. Thus, the question remains whether, when used during a more realistic navigation task, the CDU is still better than a touch-based interface.
In addition, during a realistic LNAV task, for example, to avoid bad weather, pilots generally use both the CDU and MCP. In most cases, however, pilots will not use these interfaces concurrently. That is, they use the MCP to deviate from the planned route by dialing in a heading to fly around a weather cell and finally use the CDU to fly directly toward the nearest route waypoint when they cleared the weather cell. On one hand, it can be said that our results could shed light on the expected total task difficulty and completion times for realistic flight navigation tasks requiring combined inputs, given the current focus on modeling the accuracy and throughput of the interfaces in isolation. On the other hand, our results may not be as simple as summing the throughput values and task completion times. In combined inputs with multiple interfaces, time delays associated with re-directing hand movements, distributing visual attention over multiple interfaces, time to engage, homing, and dwell will also play important roles. How such combined interactions with two different interfaces at separate locations on the flight deck compare to a TND, and to what extent our obtained Fitts’ models can predict the results of such interactions, is therefore worth exploring further in a follow-on experiment.
Key Points
The accuracy and throughput characteristics of three flight deck interfaces, that is, the MCP, the CDU, and a TND, were accurately modeled with Fitts’ law.
The Fitts’ law analysis showed the CDU as most effective in both accuracy and throughput, which indicates that more difficult tasks can be handled better with the CDU within a short time frame.
Although the Fitts’ law models derived in this research described individual input movements, they may enable improved analysis and prediction of total task difficulty and completion times for realistic flight navigation tasks that would require a series of combined movements.
Footnotes
Author Biographies
Nout C. M. van Zon is a consultant at Simon-Kucher & Partners. He received his MSc degree (cum laude) in aerospace engineering in 2017 from Delft University of Technology.
Clark Borst is an assistant professor at Delft University of Technology, Faculty of Aerospace Engineering, Department of Control & Operations. He received his PhD degree in aerospace engineering in 2009 from Delft University of Technology.
Daan M. Pool is an assistant professor at Delft University of Technology, Faculty of Aerospace Engineering, Department of Control & Operations. He received his PhD degree (cum laude) in aerospace engineering in 2012 from Delft University of Technology.
Marinus M. van Paassen is an associate professor at Delft University of Technology, Faculty of Aerospace Engineering, Department of Control & Operations. He received his PhD degree in aerospace engineering in 1994 from Delft University of Technology.