
Abstract
Objective:
The aim of this study was to examine individual markers of resilience and obtain quantitative insights into the understanding and the implications of variation and expertise levels in train traffic operators’ goals and strategic mental models and their impact on performance.
Background:
The Dutch railways are one of the world’s most heavy utilized railway networks and have been identified to be weak in system and organizational resilience.
Method:
Twenty-two train traffic controllers enacted two scenarios in a human-in-the-loop simulator. Their experience, goals, strategic mental models, and performance were assessed through questionnaires and simulator logs. Goals were operationalized through performance indicators and strategic mental models through train completion strategies.
Results:
A variation was found between operators for both self-reported primary performance indicators and completion strategies. Further, the primary goal of only 14% of the operators reflected the primary organizational goal (i.e., arrival punctuality). An incongruence was also found between train traffic controllers’ self-reported performance indicators and objective performance in a more disrupted condition. The level of experience tends to affect performance differently.
Conclusion:
There is a gap between primary organizational goals and preferred individual goals. Further, the relative strong diversity in primary operator goals and strategic mental models indicates weak resilience at the individual level.
Application:
With recent and upcoming large-scale changes throughout the sociotechnical space of the railway infrastructure organization, the findings are useful to facilitate future railway traffic control and the development of a resilient system.
Introduction
Resilience engineering studies are relevant in multiple domains, especially in those that are highly complex and known for their hazards (Nemeth, Wears, Patel, Rosen, & Cook, 2011). Domains that are most heavily investigated are aviation (22%), health care (19%), the chemical and petrochemical industry (16%), nuclear power plants (10%), and railway (8%) (Righi, Saurin, & Wachs, 2015).
For the Dutch railway infrastructure managing organization ProRail, the notion of resilience and robustness strongly resonates in the organization to improve the system along these concepts (Meijer, 2012). The idea is that when the system cannot maintain the regular way of working, resilience is required to respond through the adaptation of strategies (Burnard & Bhamra, 2011; Hollnagel, 2014; Hollnagel & Woods, 2005).
However, resilience is linked across different levels with influencing mechanisms on the industry at the highest level, followed by plant and operations (organization), and teams and individuals at the lowest level (Back, Furniss, Hildebrandt, & Blandford, 2008; Sheridan, 2002). Research often focuses on a specific unit of analysis, as it is not yet well understood how resilience is linked across these different levels (Righi et al., 2015). The study of cross-level interactions inside the system is, however, crucial to prevent brittleness in the overall system, which can be facilitated through proactive safety management (Gomes, Woods, Carvalho, Huber, & Borges, 2009).
An analysis of railway safety operations in the Netherlands revealed poor to mixed resilience levels (Hale & Heijer, 2006). The debundling and privatization of the railway system that was widely introduced across Europe in the 1990s, causing extensive institutional fragmentation of the system, is a possible reason for the low resilience levels (Hale & Heijer, 2006; Knieps, 2013). The debundling of the railway system inextricably led to more brittle operational processes for railway traffic operators, resulting in, for example, unclear and conflicting goals and the development of multiple coping strategies (Steenhuisen & De Bruijne, 2009; Veeneman, 2006). This phenomenon can be also be labeled as a gap between the system as designed or imagined and the system as it is actually operated, which results in a distance between the various levels (Dekker, 2006).
At an individual level, resilience engineering can help operators to develop robust yet flexible responses to disturbances inside or outside the organization (Chialastri & Pozzi, 2008; Lengnick-Hall & Beck, 2005). As such, performance variability is normal, though it needs to be controlled. Performance variability that leads to positive outcomes should be promoted (Hollnagel, 2008, 2014). Having shared goals and experiences, robust responses to simple problems, and flexible responses to complex problems is essential to the development of a resilient organization (Lengnick-Hall, Beck, & Lengnick-Hall, 2011).
Departing from resilience studies in the Dutch railways at a system and organizational level, this study focused on the individual level of railway traffic operators in order to provide recent and quantitative insights to further the understanding of variations in their cognition and behavior and the implications thereof. The central research questions were as follows: To what extent do organizational and individual goals correspond? What is the level of diversity in the goals and strategic mental models of train traffic operators given operators’ work experience, and how does it relate to their performance?
The following section briefly introduces the Dutch railway system from a number of perspectives. This overview is followed by a brief presentation of the theoretical background to goals and strategic mental models. The subsequent sections present the method, results, and discussion and conclusion.
A Multilevel Overview: Railway Transport in the Netherlands
The Dutch railways transport more than 1 million passengers and operate about 350 freight trains per day in a relatively small country, making it one of the busiest railway systems in Europe and even the world (Meijer, 2012; ProRail, 2013; Ramaekers, De Wit, & Pouwels, 2009). The debundling and privatization of the Dutch railway sector in 1995 initially led to a decrease in the performance of the system: Between 2000 and 2001, arrival punctuality dropped from about 87% to 80% (Algemene Rekenkamer, 2012; Steenhuisen, 2009). Although the punctuality of trains has recovered over the years, reaching 92% in 2014, both the principle passenger transport manager (Nederlandse Spoorwegen [NS]) and the infrastructure manager (ProRail) were penalized for performing insufficiently on the agreed performance indicators: NS for passenger dissatisfaction in terms of punctuality and quality of service (e.g., number of available seats, crowdedness during peak hours) and ProRail for the insufficient availability of the infrastructure due to malfunctions (Rijksoverheid, 2015).
Organizational Performance Indicators
Safety, reliability, service, and capacity use can be seen as key public values in the railway domain (Wilson, Farrington-Darby, Cox, Bye, & Hockey, 2007). The general public values that are held in the governance of railway transport are rather stable over time, unlike the operationalization and quantification of these values into goals or performance indicators (Veeneman & Van de Velde, 2006). For instance, reliability can be conceptualized in a number of ways, such as punctuality, which can be further operationalized in terms of, for example, arrival, departure, or overall (arrival and departure) punctuality. Departure punctuality was a performance indicator until 2006, when arrival punctuality became the indicator (Veeneman, 2006). However, both railway infrastructure and passenger transport managers set different thresholds in arrival punctuality, namely, <3 min and <5 min, respectively (NS, 2015; ProRail, 2015a). The formalization of performance indicators is an annual iterative process with occasionally ad hoc organizational reactions throughout the year in the case of unexpected large-scale disruptions that are subject to media scrutiny.
Train Traffic Control
Railway traffic operations differ between European countries in a number of ways, such as organization, roles and responsibilities, and level of automation (Golightly et al., 2013). In the Netherlands, a train traffic management system is used to execute the timetables, which are operated by train traffic controllers. The primary responsibility of these controllers is to execute train timetables in an accurate and punctual manner (Sulmann, 2000). Maintaining the operational safety of the rail system and recovering after disruptions and accidents is an essential part of their job (Crawford, Toft, & Kift, 2014). Train traffic controllers do not perceive their primary task as challenging as long as routes are already scheduled (Roth & Patterson, 2005). However, a more active role is needed in unsafe situations that cannot be controlled by the automated safety system or when there is a system malfunction (Sulmann, 2000).
Future Developments
In terms of future developments, ProRail and the government stated their intention to double the railway track capacity between 2008 and 2020 (now extended to 2028), which should lead to a timetable that supports both an intercity and a local train service six times per hour in both directions between major cities (Meijer, Van der Kracht, Van Luipen, & Schaafsma, 2009; ProRail, 2015b). Given the restriction of a capacity increase through the mere addition of tracks, a change in the organizational processes is also required. As such, process optimization programs are being implemented that focus on, for instance, increasing the centralization of decision making to the national control center (operational control center rail [OCCR]) for disruption mitigation procedures and restructuring the roles and responsibilities of operators. Switches are increasingly being removed at major stations (e.g., 110 of the 170 switches are being removed at Utrecht Central Station) in order to, for example, facilitate corridor management, shorter travel times, and more reliable traffic control, while bottleneck areas in the infrastructure are being expanded and upgraded. Finally, the replacement of the current traffic management system is being explored.
Goals and Mental Models
Goals
Goals are states or ends that someone wants to achieve (Latham & Locke, 1991; Mohammed, Klimoski, & Rentsch, 2000; Popova & Sharpanskykh, 2011). Operators’ goals influence their mental model selection and therefore their decision making and performance (Endsley, 1995). In a dynamic environment, individuals focus on elements in the environment that are goal related. Deriving the meaning of the elements and the projection to the future is done in light of the goal and the active mental models (Endsley, 1995). Goals influence the valuation of multiple options during decision making (Mohammed et al., 2000). In order to achieve resilience, operators need to have a common set of goals (Lengnick-Hall et al., 2011).
Mental Models and Expertise
Mental models are mental representations of humans, systems, artifacts, and situations formed by experience, observation, and training (Endsley, 1995; Schaffernicht & Groesser, 2011; Wilson, 2000). Mental models store knowledge that is necessary for human–environment interaction (Klimoski & Mohammed, 1994; Mathieu, Heffner, Goodwin, Salas, & Cannon-Bowers, 2000). This knowledge is crucial for effectively solving problems, such as those faced by train traffic controllers when confronted with multiple disruptions to the train schedule. Visual attention and evaluation of relevant information in complex problem situations improve when mental models are well developed.
The degree of development of mental models differs between novices and experts. Experts with extensive domain knowledge have developed the ability to perceive important patterns and features that are not seen by novices (Bogard, Liu, & Chiang, 2013; Bransford, Brown, & Cocking, 2000; Glaser & Chi, 1988). Experts also have the capacity to better recognize meaningful patterns due to their superior knowledge organization and extensive domain knowledge (Glaser & Chi, 1988). In contrast, novices’ knowledge consists of facts, procedures, and formulas that are not as well organized, as they do not have integrated mental models. Novices are therefore oriented toward surface characteristics in problem solving (Bogard et al., 2013; Glaser & Chi, 1988). Furthermore, experts have developed a condition–action ability through practice. Experts have conditioned knowledge: The recognition of specific patterns triggers an appropriate response that is useful for problem solving (Bransford et al., 2000; Glaser & Chi, 1988). Different levels of expertise may influence the performance of train traffic controllers and therefore resilience at an individual level (Lengick-Hall et al., 2011).
Method
Experimental Setting
A simulator session was used to familiarize train traffic controllers with the new infrastructure that would result from the removal of 66 switches in 3 months’ time. The simulator was strongly focused on the logistical aspects of train traffic control and much less on technical safety-related aspects. The infrastructure that was simulated was the train traffic area around Utrecht Central Station. This area is operated by two train traffic workstations. One controller was responsible for the trains that belong to the “turn” (in Dutch, keer) area, and a second controller was responsible for the “through” (in Dutch, door) area. The role allocation was reversed in the second round.
Two scenarios were designed for the participants: Scenario 1 consisted of a light disruption in the train traffic flow caused by minor train delays, whereas Scenario 2 represented a moderately to severely disrupted flow. In the first round, train traffic controllers participated in Scenario 1. In the second round, 10 participants participated in Scenario 1 and 12 participated in Scenario 2. Both scenarios were designed in collaboration with two senior train traffic controllers. Train traffic controllers were asked to perform their job as they typically would at their actual workstation. No interaction between the train traffic controllers was needed to conduct their tasks.
Participants
All 22 train traffic controllers (18 males, four females) worked at Utrecht Central Station. They took part in a 2 (workstation area: turn or through) × 2 (severity of disruption: high vs. low level of train delays) within-subject experimental design.
Materials
Work experience and job role were assessed using questionnaires. Participants were assigned to a high- or a low-experience group based on their work experience as train traffic controllers. The cutoff point was set at 10 years, as a new traffic management system had been implemented 10 years earlier (Bary, 2015).
Operator goals were operationalized through performance indicators (Popova & Sharpanskykh, 2011). A list of performance indicators for train traffic controllers was created prior to this session by six senior train traffic controllers. Participants ranked these performance indicators on a scale of 1 to 7 (1 = most important, 7 = least important).
Speed of acquaintance was included to find out how fast the participants were able to get accustomed to the new infrastructure. This item was measured on a 5-point Likert scale, ranging from fully disagree to fully agree. Participants could also opt for I do not know as an answer.
Performance was measured using five performance indicators, namely, arrival punctuality, departure punctuality, amount of arrival delay, amount of departure delay, and platform consistency. Arrival and departure punctuality was operationalized through trains that arrive at (or depart from) Utrecht Central Station on time or with less than a 3-min delay. These trains were counted, summed up, and divided by the total number of arrived/departed trains. For the arrival and departure delay in minutes, the amount of delays in minutes was summed up and divided by the total number of arrived/departed trains. With regard to platform consistency, all trains that did not arrive at the planned track were counted and summed up, and the same was done for all trains that did not arrive at the planned platform. Second, the total number of trains that did not arrive at the planned platform and at the planned track were summed up and divided by the total number of arrived trains for each train traffic controller.
Strategic mental models
Mental models can be conceptualized as declarative (knowledge of what), procedural (knowledge of how), or strategic (knowledge of what and how, and applied to the context) (Mohammed, Ferzandi, & Hamilton, 2010; Salas, Stout, & Cannon-Bowers, 1994). Strategic mental models can also be operationalized by generating lists of actions with subject matter experts (Webber, Chen, Payne, Marsh, & Zaccaro, 2000). As such, the completion strategies of a train traffic controller could be an indicator of the controller’s strategic mental model. Simulator logs were used to analyze the completion strategies when different ways of dealing with the train delays (i.e., the different order of departure of trains that were handled given their delay) were expected to be possible. Given the length of Scenario 1, three conflict points for completion strategies for the through workstation and one conflict point for the turn workstation were identified; for Scenario 2, one and two completion strategies were identified for the through workstation and the turn workstation, respectively. Different completion strategies were subsequently assessed by analyzing whether the completion strategies were followed according to the preferred completion strategy (as was scheduled) and the different strategies applied, to assess the variability per operator and per conflict point. Analyses were done based on participants who enacted Scenario 1 in both rounds and those who enacted Scenario 1 and subsequently Scenario 2, in order to obtain four conflict points per individual.
Simulator validity was measured through three components—structural validity (the degree of similarity in structure between the simulated and the reference system), processes validity (the degree of similarity in processes between the simulated and the reference system), and psychological reality (the degree to which the participants perceived the simulated system as realistic)—in line with Raser (1969), using a questionnaire designed by Lo, Sehic, and Meijer (2014). An example of a structural validity item is “I can apply the information from the information sources in the simulator in a similar way as in the real world” (α = .65 with the removal of one item). The item “The train traffic flow in the simulator is similar in their [sic] processes to the real world train traffic flow” represented process validity (α = .60). An example of psychological reality (α = .67) is “The simulation environment feels more or less like my own work environment.” These items were measured on a Likert scale.
Procedure
The participants completed a questionnaire before the start of the session. They then enacted the two 40-min scenarios. At the end of each round, they completed another questionnaire. During the second round, knowledge probes were administered for the purpose of another study. Video recordings were made throughout both sessions.
Results
Six of the 22 participants were excluded from the simulator data analysis because they had known about the train delays. Another two participants were excluded as they enacted Scenario 2 twice. As there were a few problems with the simulator, not all train traffic controllers received the same number of trains. This issue was controlled for by using an average score of the objective performance measures and reviewing the severity of issues through video recordings for events that hindered participants in their options or decision making.
The average score of the participants’ work experience in their current function was 10.3 years (SD = 9.24).
Simulator Validity
The findings show that the participants tended to be slightly positive about the validity of the simulator considering the task they were given (see Table 1). The participants also indicated that they had quickly gotten used to the simulator.
Descriptive Statistics of the Validity of the Simulator on the Three Validity Components and Speed of Acquaintance With the Simulator and the Two Workstations, Measured on a 5-Point Likert Scale
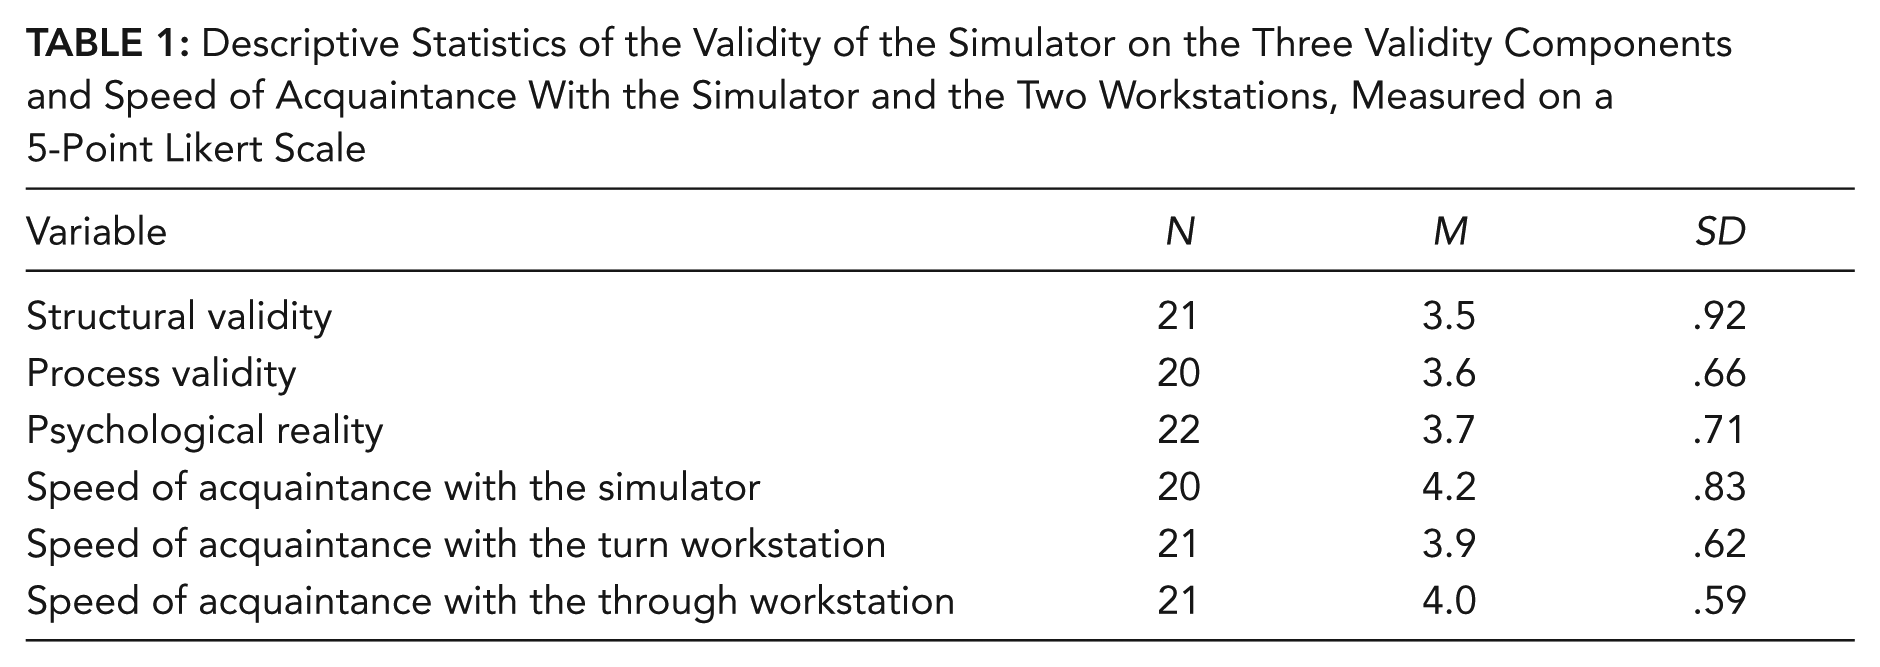
Regarding learning effects between scenarios, the participants indicated that they had gotten used to both workstations relatively quickly.
Goals
Figure 1 shows a relative moderate goal consistency among the train traffic controllers. Three controllers added two more performance indicators, but they were not included in the analysis.
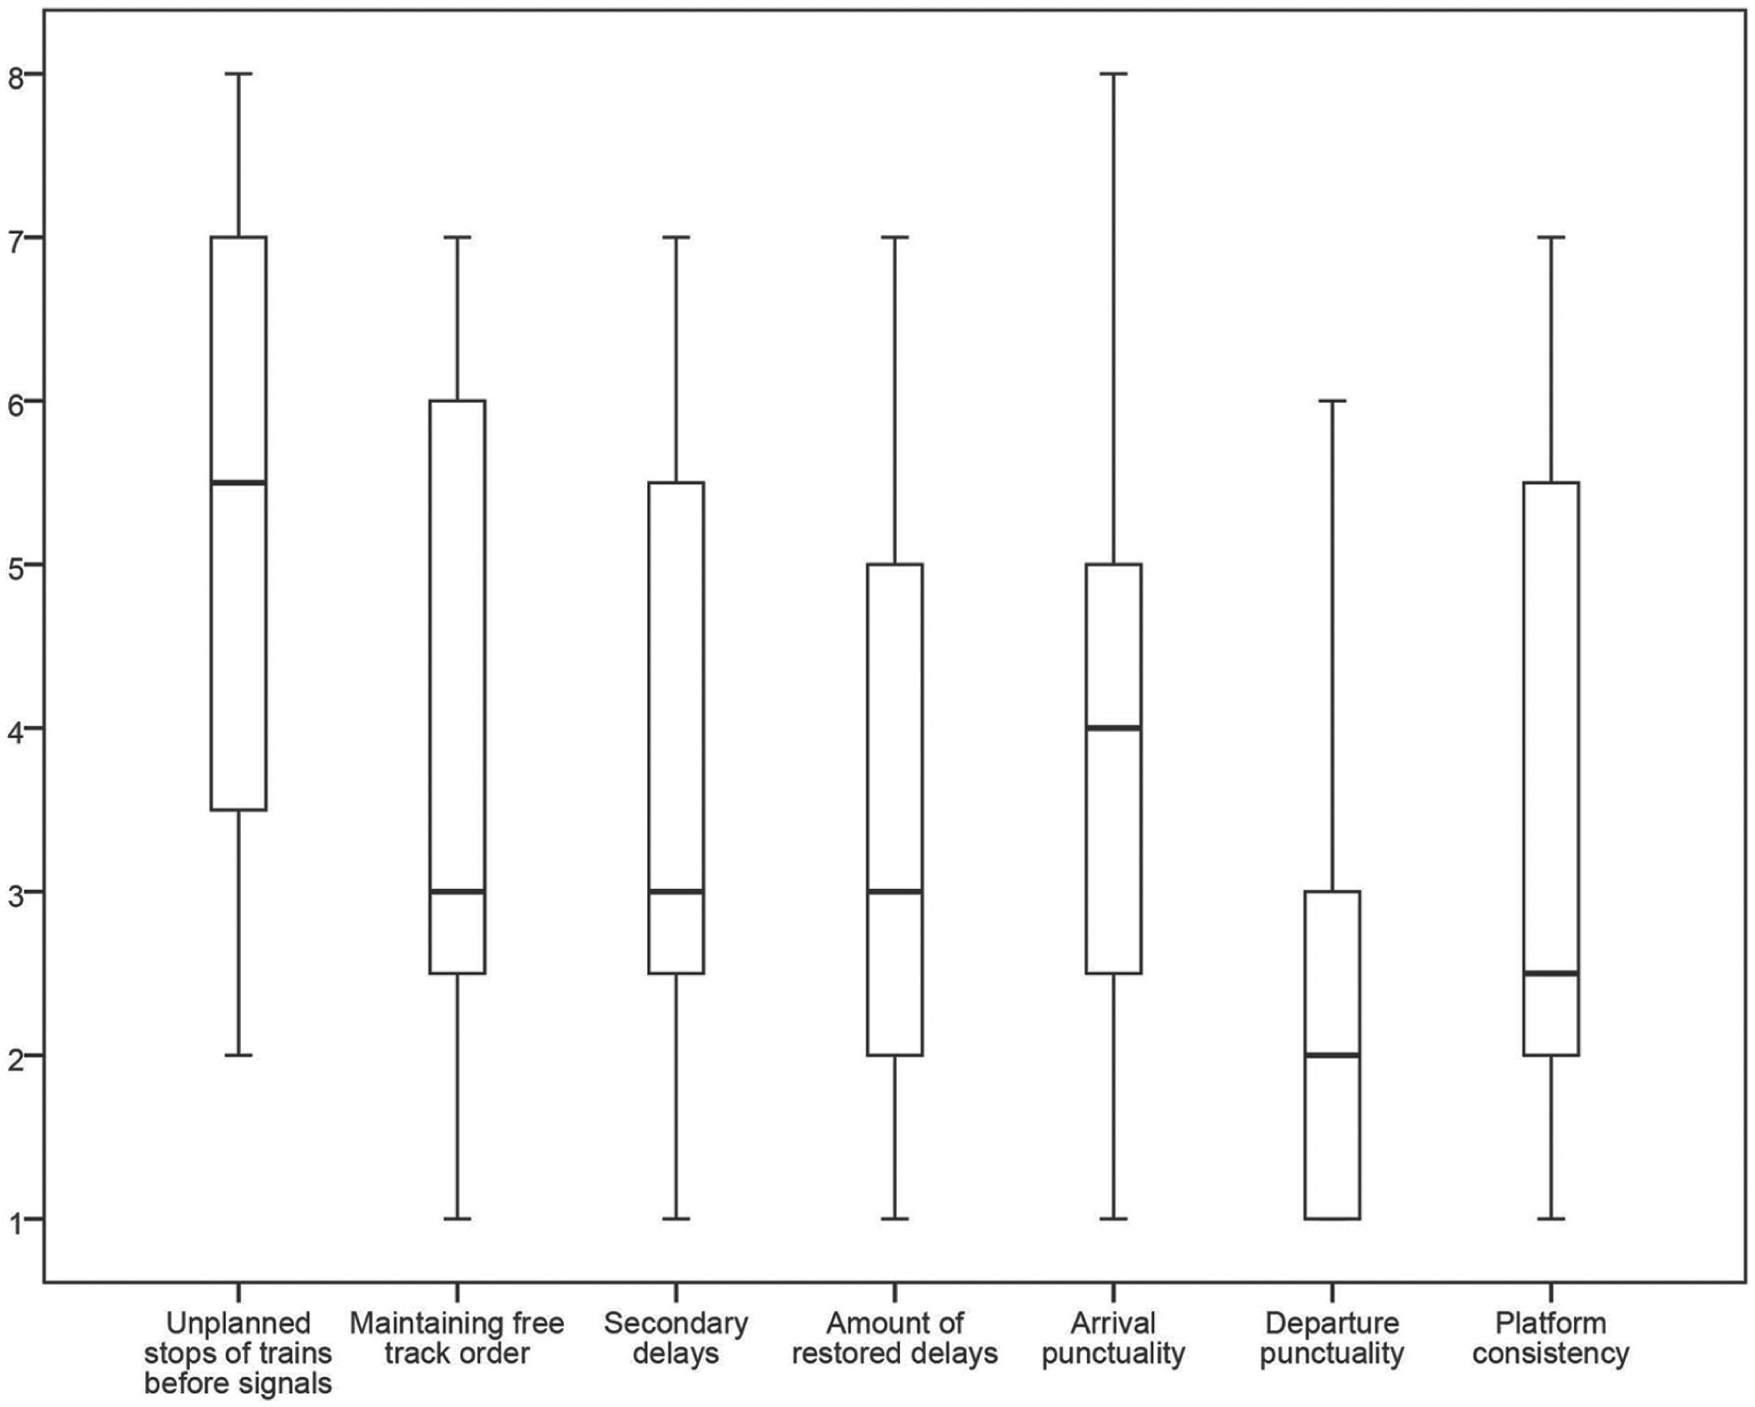
Median distribution of self-reported performance indicators (x-axis) with the ranking scale depicted on the y-axis (N = 20).
In the assessment of primary preferred performance indicators (N = 17), however, departure punctuality was consistently perceived as most important (36%). This indicator was followed by achieving high platform consistency (18%), arrival punctuality (14%), maintaining free track order (i.e., track use between stations in the planned order; 9%), the number of restored delays and secondary delays (both 5%), and the avoidance of unplanned stops of trains before signals (0%). As such, these results show a very fragmented preference with regard to primary key performance indicators.
Strategic Mental Models
The operators’ strategic mental models were analyzed to obtain insights into the diversity of their individual completion strategies. The overall findings show that participants handled on average 61% of the completion strategies in the preferred manner (SD = 31.5). Those who enacted Scenario 1 twice handled 53% of the completion strategies in a deviating manner (SD = 21.1). Participants who enacted Scenarios 1 and 2 handled on average 37% of the completion strategies in the preferred manner (SD = 14.2) and 65% in an alternative manner (SD = 24.2) (see Figure 2). Based on Figure 2, a qualitative assessment supports the variation in completion strategies with regard to the operators’ individual completion strategies.
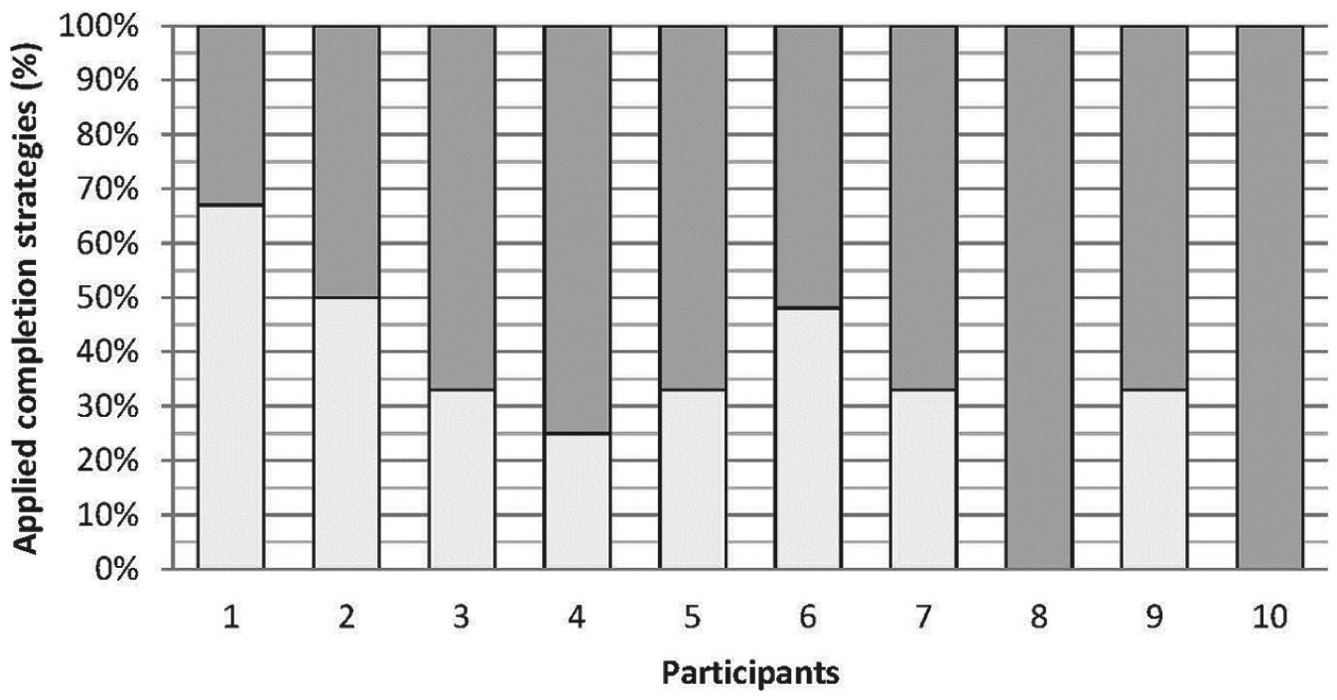
Applied completion strategies per participant for operators who enacted Scenarios 1 and 2. A white band indicates a preferred completion strategy being followed, and a gray band indicates alternative completion strategies. Even numbers represent participants from the through workstation; odd numbers, those from the turn workstation.
An analysis of the level of variation in completion strategies for each conflict point revealed diversity based on between one and three different completion strategies for four conflicting points in Scenario 1 and on five different variations of completion strategies for three conflicting points in Scenario 2 (see Figure 3). A qualitative assessment would show that there is a level of variation in the completion strategies with regard to different conflict points and that this variation differs between scenarios: Operators dealt with these conflict points with more diverse completion strategies in the moderately disrupted scenario than in the lightly disrupted scenario. Further, it is notable that preferred completion strategies were implemented more frequently in Scenario 1.
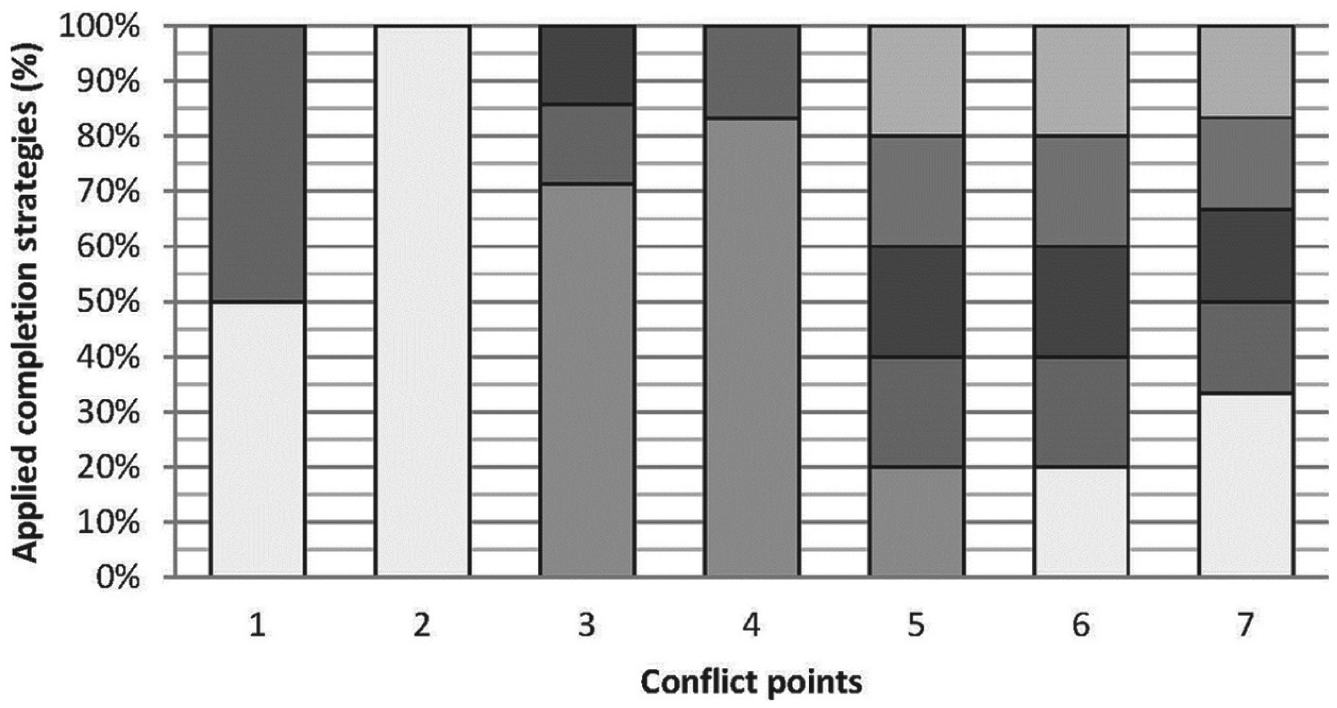
Applied completion strategies per conflict point for Scenario 1 (1–4) with n =14 and Scenario 2 (5–7) with n = 10. A white color indicates a preferred completion strategy being followed, whereas different shades of gray indicate different completion strategies. Numbers 1, 2, 5, and 6 represent conflict points from the through workstation, and numbers 3, 4, and 7 represent conflict points for the turn workstation.
Performance
Spearman correlation tests were performed to test whether there is a congruence between the self-reported relative importance of performance indicators and objective performance (see Table 2). Although Scenario 1 does not reveal any significant correlations, Scenario 2 does, namely, a strong positive correlation between self-reported departure punctuality and objective arrival delay. Also a strong negative correlation was found between self-reported arrival punctuality and objective departure delay. A trend for a negative correlation between self-reported platform consistency and objective arrival delay was also found.
Correlation Between Self-Reported Performance Indicators and Objective Performance Indicators for Scenario 2
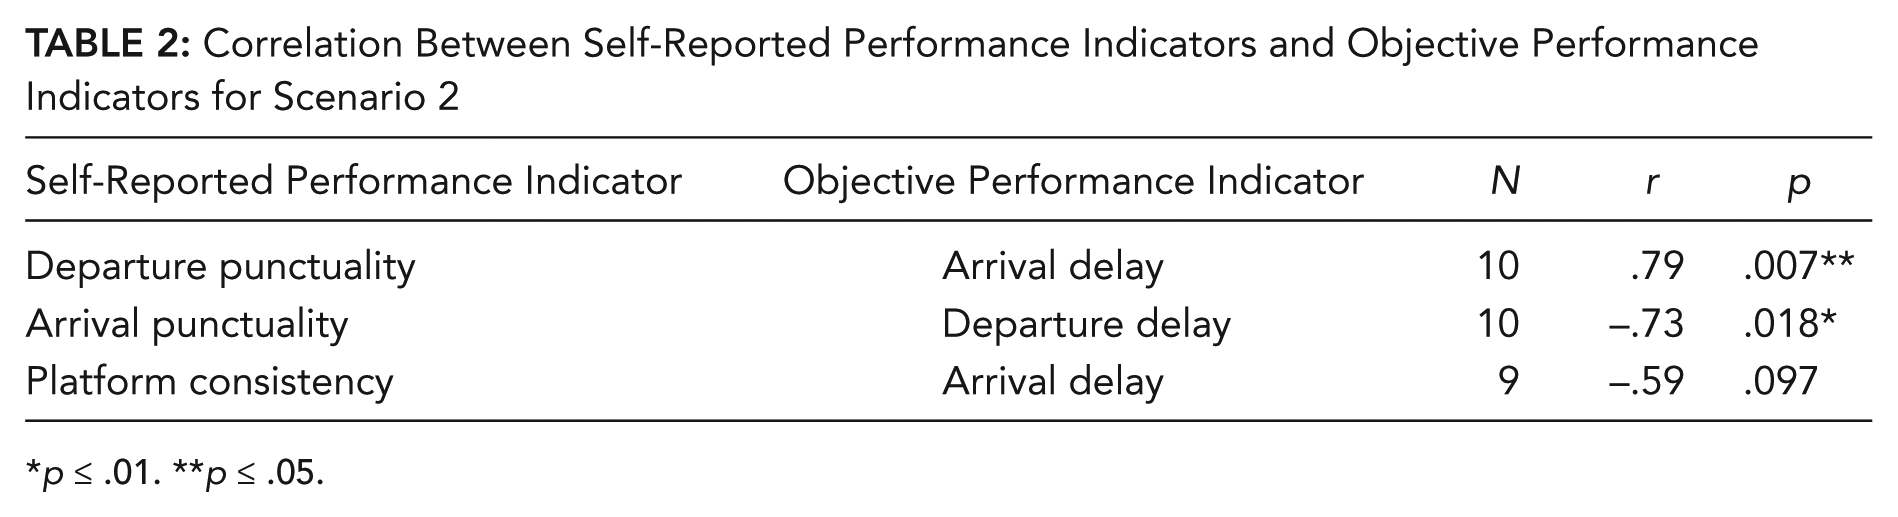
p ≤ .01. **p ≤ .05.
Although unexpected, these results provide interesting insights into goal competition, as they suggest that arrival punctuality and departure delay, departure punctuality and arrival delay, and platform consistency and arrival delay are competing goals.
A Spearman correlation test was also performed between the applied preferred and alternative completion strategies and performance. No significant relations were found.
Experience
It was expected that the more experienced controllers would outperform the less experienced controllers due to their better organized mental models. The analyses showed a significant tendency in Scenario 1 for controllers with less experience in their current function to have a higher arrival punctuality score than the more experienced controllers (see Table 3). An opposite tendency was found in Scenario 2: The controllers with more experience in their current function have a higher arrival punctuality score than the controllers with less experience in their current function.
Differences in Objective Performance Between More and Less Experienced Train Traffic Controllers in Their Current Function
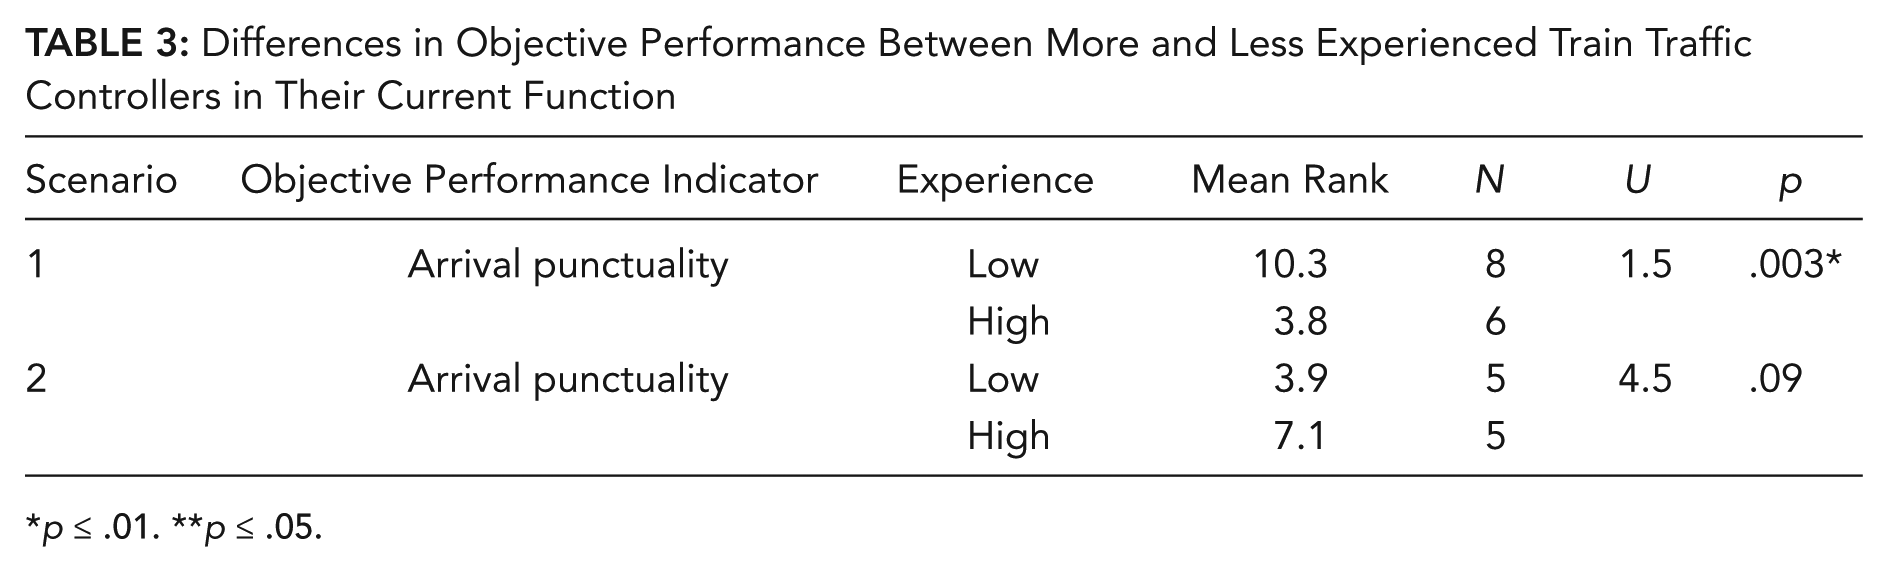
p ≤ .01. **p ≤ .05.
It was also investigated whether the applied completion strategies and performance indicators preference differed between the high- and the low-experience group. No significant difference was found for the variation in applied completion strategies, indicating that both more and less experienced operators show diversity in their completion strategies. For the different primary performance indicators, a trend was found for a difference in the importance of maintaining free track order (U = 17.0, p = .073) and unplanned stops of trains before signals (U = 20.5, p = .095). More experienced operators indicated these goals as being more important compared to the less experienced operators. This finding is possibly because both goals are felt to be of importance to achieve a good performance in their train traffic operations, whereas less experienced controllers do not yet feel so.
Discussion and Conclusion
We investigated the following research questions: To what extent do organizational and individual goals correspond? And what is the level of diversity in the goals and strategic mental models of train traffic operators given operators’ work experience, and how does it relate to their performance?
First, the level of correspondence between organizational and individual goals was explored. This correspondence appeared to be moderate when looking at the median distribution. However, when assessing the preference for arrival punctuality, this goal ranked in the third position, with 14% of the controllers adhering to the primary organizational goal. Operators indicated that they valuate departure punctuality (36%) and platform consistency (18%) as more important than the primary organizational goal, arrival punctuality. The low absolute percentages spread over multiple goals revealed a strong diversity in operators’ goal preference. A diversity between operators in completion orders was also found: As many as five different completion strategies were identified in the moderately-to-severely-disrupted scenario. It is notable that in this study, the level of diversity in strategic mental models could not be related to worse or better performance.
The valuation of the controllers’ goals was not reflected in their performance. The results show that in a moderate-to-severe traffic condition, controllers who highly value arrival punctuality showed more departure delay. Controllers who focused on departure punctuality had less arrival delay, and those who focused on a high level of platform consistency had less departure delay. Although these results do not confirm the expectations, they are in line with the fact that individual goals do not always lead to the system performance that corresponds to personal goals. In fact, the presence of multiple and competing goals can be seen as characteristics of complex, ill-structured environments, as they have to be weighed and prioritized, and compromises have to be made (Amelung & Funke, 2013; Funke, 1991; Hong, 1998). To obtain resilience, performance requires certain goals to take precedence over other goals (Woods, 2006). The moderate-to-severe traffic condition was a more complex situation, and the controllers possibly had to make more compromises. These goals were probably not as conflicting in the less complex situation because the scenario did not cause a conflict between arrival and departure goals.
This study also revealed a difference in the valuation of the goals “maintaining free track order” and “unplanned stops of trains before signals” between the more and the less experienced operators: The former considered these goals to be more important. As such, more experienced operators appear to be more comfortable about satisfying lower-prioritized organization goals. A trend was found for the level of experience affecting performance: Less experienced controllers showed better arrival punctuality than experienced controllers when no complex disruptions were introduced (Scenario 1). In contrast, the opposite trend was found when more train delays were introduced (Scenario 2). The results of Scenario 2 are in agreement with previous studies, following the line that more experienced controllers perform better in complex situations because of their well-developed mental models (Bogard et al., 2013).
Some limitations to this study should be mentioned. Although the simulator problems were controlled for, they nonetheless necessitated a small sample size. Also, given the length of each scenario, the number of conflict points per workstation was rather small. A limitation of this study in terms of goals trade-off consequences is that the level of violations was not assessed; we did not assess when a certain goal was violated during the simulator study or what the implications were of prioritizing one goal over another in these scenarios. These points should be taken into consideration in future studies.
Further, in line with the measured individual markers of resilience in this study, authors of future research could investigate the diversity of strategic mental models in the actual work environment. The level of diversity of completion strategies between workstations could also be further investigated.
In sum, the primary organizational goal was not reflected at the operational level. An explanation for this finding might be the difference in the realization of operator’s goal versus the evaluation of operator’s performance. In an exemplary case, train traffic controllers may recognize arrival punctuality as both a primary organizational goal and an individual goal; however, due to external factors influencing the train traffic flow, a high arrival punctuality cannot be guaranteed by the operator alone. As such, operators may develop different preferences and coping mechanisms to better reflect their performance.
Although variability in cognition and behavior is both healthy and allowed, it can be argued that the revealed goals and strategic mental models of operators are too diverse and therefore are unpredictable and most probably weaken the resilience at the system level. These results could be used as an indicator of brittle points that prevent the creation of a resilient organization (Gomes et al., 2009). It is observable that there are gaps between the work that is expected and the work that is done. Especially with the upcoming and planned large-scale changes in the railway system, it could be undesirable to continue with the redesign without involving the operational layer. Participatory design could be used as a joint approach to shape these changes (Falzon, 2008), enabling a new generation to work in a restructured work environment and to resonate these changes throughout all the levels.
Key Points
There is an incongruence between organizational and individual goals, indicating a gap between the work that is expected and the work that is done.
The resilience of the Dutch railway system is low due to rather strong variations in the goals and strategic mental models as the behavior of operators becomes more unpredictable.
In a more complex state of the traffic system, there is an incongruence between train traffic controllers’ self-reported performance indicators and objective performance, possibly indicating goal competition.
Footnotes
Acknowledgements
This study was funded through the Railway Gaming Suite program, a joint project by ProRail and Delft University of Technology. We thank Guido Band from the University of Leiden and Emdzad Sehic from ProRail for their involvement. We also thank the editor and the reviewers for their involvement and constructive feedback.
Julia C. Lo is a PhD candidate at the Faculty of Technology, Policy, and Management of Delft University of Technology. She obtained her master’s degrees in social psychology (2007) and organizational communication (2008) at the University of Amsterdam.
Kari R. Pluyter obtained her master’s degree in applied cognitive psychology at the University of Leiden in 2015.
Sebastiaan A. Meijer is a full professor at KTH Royal Institute of Technology, School of Technology and Health, and is associated with Delft University of Technology, Faculty of Technology, Policy, and Management. He received his PhD in gaming and supply chain management in 2009 from Wageningen University.