
Abstract
This article reviews the experimental research on the level of anxiety or depression in gifted individuals. Twenty-seven studies compared gifted and typically developing individuals for the anxiety level and 15 studies for the depression level comparison. This current meta-analysis was performed on the anxiety and depression levels distinctly. We found a non-significant negative effect size for both anxiety, g = −0.14, k = 27, and depression, g = −0.14, k = 15. These values should be taken cautiously given that a high heterogeneity was also found, which remained largely unexplained by the moderators tested. Only age and type of anxiety assessment emerged as significant moderators for the anxiety domain. The observed effect size for depression was not significantly affected by the subgroups analyzed.
Gifted individuals are recognized to have higher cognitive performance (i.e., inductive reasoning, working memory, inhibition control, etc.). However, the association of giftedness, mental health, and well-being is debated in the literature (e.g., Bergold et al., 2021; Williams et al., 2023). Well-being applies usually to physical, economic, cognitive, psychological, and social domains (Pollard & Lee, 2003). Psychological well-being, in particular, refers to positive and negative elements such as emotional adjustment, self-concept, social competence, psychiatric disorders, depression, anxiety, and suicidal ideation. The literature on gifted well-being is characterized by significant variability across studies (Neihart, 1999). While some studies indicate giftedness is a protective factor of well-being (e.g., Eklund et al., 2015), others show the opposite, that giftedness is a risk factor of well-being (e.g., Blaas, 2014). Furthermore, Casino-García and colleagues (2019) noted a significant mediating effect of sadness on the well-being of gifted individuals. In other words, the relationship between gifted individuals’ well-being and emotional competence appears to be moderated by their mood (Casino-García et al., 2019).
Empirical studies have shown that giftedness provides advantages in cognitive, social, and emotional domains (see Ogurlu, 2021b for a synthesis). However, some authors have reported a higher risk of mental disorders for gifted individuals (Baker, 1995; Bartell & Reynolds, 1986; Guénolé et al., 2013; Jackson & Peterson, 2003; Karpinski et al., 2018; MacCabe et al., 2010). This topic is still hotly debated (Baudson, 2016; Gale et al., 2013; Plomin & Deary, 2014; Wraw et al., 2016). The current study aims to shed light on the relationship between mood disorders and giftedness.
Individuals are labeled gifted if they demonstrate superior performance in one or more specific domains than their peers (Worrell et al., 2019). Intelligence is an essential characteristic of giftedness (Thompson & Oehlert, 2010; Warne, 2016). Thus, giftedness is usually identified by an IQ higher than two standard deviations above the mean on a standardized intelligence test (Carman, 2013). However, giftedness can also be related to higher academic performance (McBee & Makel, 2019; Peters, 2016). Intelligence and academic achievement are closely related constructs (Kaufman et al., 2012). Although these two constructs are not isomorphic, some empirical research shows similar cognitive characteristics in intellectual and academic giftedness (Leikin et al., 2013; Paz-Baruch et al., 2014, 2016). Consequently, in the current study, we consider intellectual and academic giftedness to be similar.
The distinctions between gifted and typically developing individuals are more often quantitative than qualitative (Baudson, 2016). Giftedness is related to higher performance in inductive reasoning (see Geake, 2008, for discussion), working memory, and executive control than their peers (Kornmann et al., 2015; Rodríguez-Naveiras et al., 2019; Shi et al., 2013). Together, these findings support the idea that high intelligence is associated with speed and ease in learning (Gottfredson, 1997; Wang et al., 2017). Gifted individuals are more likely to succeed in academic areas (Guez et al., 2018), but this is not a guarantee (Gottfredson, 1997).
In terms of social-emotional development, meta-analyses focused on this field of research have identified many strengths in this population, including higher levels of global self-concept, academic self-concept, and life satisfaction (see Ogurlu, 2021b for a synthesis). This result is consistent with other studies that have reported lower levels of anxiety (Williams et al., 2023), better self-regulation (Calero et al., 2007), and fewer attentional difficulties when they have attention deficit hyperactivity disorder (ADHD; Gomez et al., 2020; Rommelse et al., 2017). Yet, many media outlets and clinicians suggest that giftedness renders subjects particularly vulnerable, whereas empirical research shows the opposite (Bergold et al., 2021), especially regarding anxiety.
Anxiety
Anxiety is “a cognitive-affective structure composed of high negative affect, a sense of uncontrollability, and a shift in attention to a self-focused concentration or state of self-preoccupation. The feeling of uncontrollability is centered on a future threat, danger, or other negative events” (Barlow, 1991, p. 60). About 4% of the world population is affected by anxiety disorders (World Health Organization, 2017), which is distinct from fear, referring to a single emotion that is focused on an object (Zeidner & Shani-Zinovich, 2011). There are several distinct types of anxiety. Performance anxiety is a negative emotion or cognitive response to a situation in which performance is observed or evaluated (Cassady & Johnson, 2002). State anxiety is in-the-moment anxiety and is, therefore, distinguished from trait anxiety, which refers to a personality with a tendency to feel anxiety on an ongoing basis (Bardel & Colombel, 2009). Social anxiety (also known as social phobia) is another kind of anxiety, characterized by a negative affect and an uncontrollable fear related to a feeling of being judged by the gaze of others (Stein & Stein, 2008). Generalized Anxiety Disorder is defined by the Diagnostic and Statistical Manual of Mental Disorders (5th ed.; DSM-5; American Psychiatric Association [APA], 2013), with anxiety and worries appearing in different contexts and generally lasting more than 6 months. The anxious individual may experience various symptoms, such as agitation, fatigability, loss of concentration, irritability, muscle tension, or sleep disturbance. These symptoms may significantly impair social, occupational, or academic functioning (APA, 2013).
There is no consensus about the association between giftedness and higher anxiety levels. Parents and psychologists can have incomplete or erroneous representations of gifted children’s characteristics (Sanchez et al., 2022). In practice, these children are mostly seen in the context of an anxiety disorder (Kermarrec et al., 2020). Clinicians in the media may thus convey a media overrepresentation of the gifted individual as socially and emotionally maladjusted. In the empirical literature, some studies indicate that gifted individuals are less anxious than their peers (Bracken & Brown, 2006; Mousavi et al., 2008; Reynolds & Bradley, 1983; Richards et al., 2003; Zeidner & Shani-Zinovich, 2011). However, other studies have found no significant differences between gifted and nongifted individuals (Beer, 1991; Guénolé et al., 2013; Norman et al., 1999) or even more anxiety (Elliott, 2013; Roberts & Lovett, 1994; Tong & Yewchuk, 1996). Thus, the literature is inconsistent on this topic.
The rate of anxiety among gifted individuals could have significant implications for public policy regarding their support. If gifted individuals were found to have a higher level of anxiety than their counterparts, it would be crucial to investigate evidence-based interventions to reduce anxiety rates in this population. Anxiety seriously affects life outcomes such as academic performance (D’Agostino et al., 2022; DordiNejad et al., 2011; Nadeem et al., 2012; Ramirez et al., 2013) and may contribute to academic maladjustment in gifted students (Guignard & Zenasni, 2004).
The complexity of this debate stems in part from the heterogeneity inherent in the sampling bias often found in this field of research (e.g., Martin et al., 2010). The gender effect can at least partially explain this heterogeneity. Gender appears to affect the prevalence of affective disorders, as women have higher incidence of affective disorders than men (see Faravelli et al., 2013 for a meta-analysis). Women are also more predisposed to experience anxiety disorders than men (Faravelli et al., 2013; Lewinsohn et al., 1998; Somers et al., 2006). Similar results have been found in gifted children (Moore, 2006; Tong & Yewchuk, 1996; Zeidner & Shani-Zinovich, 2011), including for social anxiety (Rovan & Vlahovic-Stetic, 2008). Some results support gifted girls being more anxious than typically developing girls, while no difference is present in boys (Zeidner & Schleyer, 1999). Therefore, gender might be taken as a moderator variable of the effect of giftedness on anxiety.
The diversity of anxiety types could also explain the inconsistency of results observed in studies on gifted individuals. This population may experience anxiety in specific situations, such as in the context of testing or social interactions, leading to varying levels of anxiety. In addition, studies differ in the measurement of anxiety (i.e., the occurrence of a diagnosis or level of anxiety) and the type of anxiety (i.e., state, trait, social, academic performance, etc.). The diversity of tools and types of anxiety covered by the scales is partly attributable to the lack of consensus regarding the definition and functioning of anxiety, which may help explain the heterogeneity observed among studies of giftedness.
Anxiety disorders in childhood increase the risk of developing other mental disorders in adulthood (Cervin et al., 2021). Anxiety is also associated with depressive symptomatology (Finch et al., 1989; King et al., 1991; Ollendick et al., 2005 as cited by Anderson & Hope, 2008). Although there is a two-way direction between anxiety and depression, anxiety cannot be considered as a prodrome of depression and they must therefore be considered as distinct constructs (see Jacobson & Newman, 2017 for meta-analysis). In the current study, we examined separately the studies dealing with anxiety and depression in gifted individuals.
Depression
According to the Diagnostic and Statistical Manual of Mental Disorders (DSM-5), depressive disorders are characterized by changes in inner functioning, such as depressed mood and loss of interest or pleasure. In other words, depression is a state of an individual having a sad and irretrievable mood with indifference toward their previous interests. Depression is an illness that abnormally disrupts the functioning of the child, adolescent, or adult. The prevalence of depressive symptoms can be measured by various methods, including psychiatric evaluation and self-report questionnaires such as the Beck Scale, the Reynolds Adolescent Depression Scale, and the Strengths & Difficulties Questionnaires. The WHO (2017) reports that approximately 4% of the global population is affected by depressive disorders. This prevalence varies according to age, increasing from 3% in childhood to about 6% in adolescence and adulthood (Costello et al., 2005; WHO, 2017). In addition, about 17% of young people experience one or more depressive episodes before the end of adolescence (Glowinski et al., 2003).
Neihart (1999) found a similar or lower rate of depressive symptoms in gifted students. Most research confirmed that giftedness is a protective factor against depression (see Martin et al., 2010 for a meta-analysis; Missett, 2013). Despite the vast majority of studies supporting the idea that giftedness is a protective factor, a few studies have yielded no significant differences (Baker, 1995; Eren et al., 2018; Peyre et al., 2016) and some have even suggested some vulnerability (Bénony et al., 2007; Karpinski et al., 2018). Regarding gender, girls appear to have a higher likelihood of depression overall (Parker & Brotchie, 2010). Some studies consider gender in the gifted population in affective disorders. However, few studies directly investigated the difference between boys and girls in depressive symptoms. Eren and colleagues (2018) showed that gifted boys had more significant depressive symptoms than gifted girls. Gender might affect the giftedness effect in depression. Therefore, we used it as a moderator variable in this meta-analysis.
Some risk factors can reduce or attenuate the influence of protective factors such as giftedness (Mueller, 2009). Factors like violence or extreme conflict within the immediate family, dysfunctional coping style (such as withdrawal and avoidance), or adverse life events appear to increase the level of depression (Mueller, 2009). For instance, some gifted children would experience depressive episodes following life events such as divorce or bullying at school (Beljan et al., 2006). During adolescence, the idealism and loneliness of gifted students can lead to depression (Beljan et al., 2006). Metaphysical worries and fears (Harrison & Van Haneghan, 2011) and social difficulties (Matta et al., 2019) may also contribute to their difficulties. Overall, the literature seems inconsistent. An analysis of the literature is necessary to explore the effect of giftedness on affective disorders and the variables that moderate this effect.
The Present Study
The inconsistency of studies regarding the effects of giftedness in anxiety and depression makes it difficult to confirm an association between giftedness and mood disorders. The debate remains as to whether giftedness confers protection against mood disorders or if it renders subjects more vulnerable. The only meta-analysis conducted by Martin et al. (2010) revealed no difference between gifted and typically developing individuals with regard to the level of depression, but individuals with giftedness were reported to have a lower level of anxiety than their peers, d = −0.72, 95% confidence interval (CI) = [−0.90, −0.54]. However, Martin et al. (2010) misinterpreted a result from Tong and Yewchuk (1996); that is, this effect size was interpreted as a measure of anxiety when in fact it represented a lack of anxiety: “significant program effects were found on the Anxiety Subscale [. . .] with gifted students (M = 8.99) having a higher level of anxiety than regular program students (M = 10.36)” (Tong & Yewchuk, 1996, p. 18). The effect size should have been positive and not negative as indicated by Martin et al. (2010). 1 The heterogeneity of the results is likely related to a large variability in the methodology used in the studies (Francis et al., 2016; Tordjman & Kermarrec, 2019). This undoubtedly impacts the generalization of the results in this topic. Due to the lack of a consensual definition of giftedness, identification tools and thresholds differ widely among studies (see Hodges et al., 2018, for a meta-analysis; McBee & Makel, 2019). Recruitment methods may also play an important role, as some authors contacted school-based giftedness programs directly, while some others contacted hospitals or counseling or psychological services. Therefore, subgroup analyses and meta-regressions will be conducted to estimate the moderating effect of some variables such as age, schooling context, gender, recruitment type, and the criterion for identifying giftedness (see Steenbergen-Hu & Olszewski-Kubilius, 2016 for a discussion). In addition, the role of anxiety type will be investigated, which may be significant in assessing the psycho-emotional profile of giftedness. In the current study, we used a systematic and meta-analytic approach to clarify the effects of giftedness in anxiety and depression for two main reasons: (a) updating the data collected by Martin et al. (2010) and (b) investigating the role of moderating variables that may explain the intra- and inter-study heterogeneity by conducting a multilevel meta-analysis.
Method
Literature Search
To conduct the literature search, we followed the Preferred Reporting Items for Systematic reviews and Meta-Analyses (PRISMA) guidelines (Page et al., 2021). We selected studies published in English and French between 1995 and 2020 from the following databases from the beginning to the end of July 2020: PsycINFO, PsychARTICLES, PubMed, Web of Science, and Open Dissertation. In the initial search, the following terms were combined in order to collect a large number of references: high intellectual, gifted, talent*, high IQ, high achievement, high ability, depress*, dysphori*, dysthym*, anxi*, fear, worr* (see Table 1 in the Appendix [see Supplemental Materials]). Application of the keywords allowed us to collect 1,427 references, including articles published in peer-reviewed journals, books, theses, doctoral dissertations, and preprints. Among the 1,427 references, we selected articles, theses, as well as preprints (n = 1,258), and then we excluded 287 duplicates using the screen_duplicates() function of Revtools package (Westgate, 2019). This package allows any duplicates present in the dataset to be identified and the relevance of the deletion to be checked: Two authors shared the examination of the duplicates. Reading the title, abstract, and keywords of the 971 remaining references was shared randomly between three authors using the allocate() function of Revtools package. Each record was screened by one author, applying the inclusion criteria listed below.
Eligibility Criteria
Studies were considered eligible if they followed the following two criteria:
Definition of Giftedness
Studies including a high potential sample, that is, individuals with superior performance in one or more specific domains compared with their peers (Francis et al., 2016; Martin et al., 2010; Worrell et al., 2019). The domains considered are cognitive skills (general intelligence, fluid reasoning, comprehension-knowledge) and/or academic performance (general academic performance, mathematics, literature, science; McBee & Makel, 2019).
Type of Measure
Studies should address the level of anxiety (worry, social anxiety, performance anxiety, test anxiety, etc.) or depression (e.g., negative mood, etc.), or the presence of a diagnostic of anxious or depressive disorder.
When deciding on the inclusion of a reference, three authors voted. If there was no unanimity, the article was accepted to explore it entirely (doubts about the population, the presence of a variable relating to the level of anxiety and depression). After reviewing the abstracts, we retained 156 references. The complete data of 133 references were extracted. To expand our data set, we explored the bibliography of literature reviews on giftedness and psychopathology (Francis et al., 2016; Gauvrit, 2014; Martin et al., 2010; Tordjman & Kermarrec, 2019), which allowed us to include six additional references (Černova, 2005; Chuderski, 2015; Gallucci et al., 1999; Loureiro et al., 2010; Messier & Ward, 1998; Shaywitz et al., 2001).
Study Inclusion and Exclusion Criteria
The inclusion criteria set the methodological requirements for including studies in the meta-analysis. These criteria allow us to avoid the “garbage-in, garbage-out” effect and to perform a quantitative synthesis with the best available evidence (Slavin, 1995). Thus, the full version of 139 articles was reviewed through 10 eligibility criteria: (1) Accessibility. The study had to be available and readable in its entirety. The first author contacted authors whose articles were only available in part. Among the six authors contacted, three responded to the request. (2) Language. All articles had to be published in English or French. No criteria were set on the country of origin. (3) Date. The article had to be published between 1995 and 2020 in order to collect the most recent data. (4) Definition. The definition of giftedness previously applied in the abstract review was reapplied to all articles to exclude high potentials in the creative, artistic, and athletic fields. (5) Type of measure. The study had to include a measure of anxiety (worry, social anxiety, performance anxiety, academic anxiety, etc.) and/or depression (negative affect, negative mood, etc.) and present quantitative data on these. When several outcomes were present in one study, all the outcomes that respected the criteria were extracted. (6) Presence of a control group. The study had to include a suitable control group for comparison with a gifted group on our measures of interest. Studies comparing the gifted group to a norm were therefore excluded (k = 24). (7) Health. The gifted and the control groups were not to be characterized by any disorder (i.e., neurodevelopmental, motor, etc.). (8) Ecological samples and settings. Participants were not part of a specific living environment that could alter the relevance of the data. We have not included studies involving individuals in prison or precarious situations. We also excluded anxiety outcomes collected after a performance test. (9) Available data. The article had to report sufficient quantitative information to estimate and calculate an effect size (e.g., sample size, mean, standard deviation, occurrence, or Student’s t). The selected data must come from scales or diagnostic occurrences in a sample. When some of the calculation data were unavailable in the article, the first author was contacted. Among the six authors contacted, none responded to the request. (10) The uniqueness of the sample. The data from a gifted sample and its control group on one measure are unique and were not considered more than once. Application of the eligibility criteria allowed us to select 32 separate studies, including 83 effect sizes of anxiety and depression in giftedness (see Figure 1).
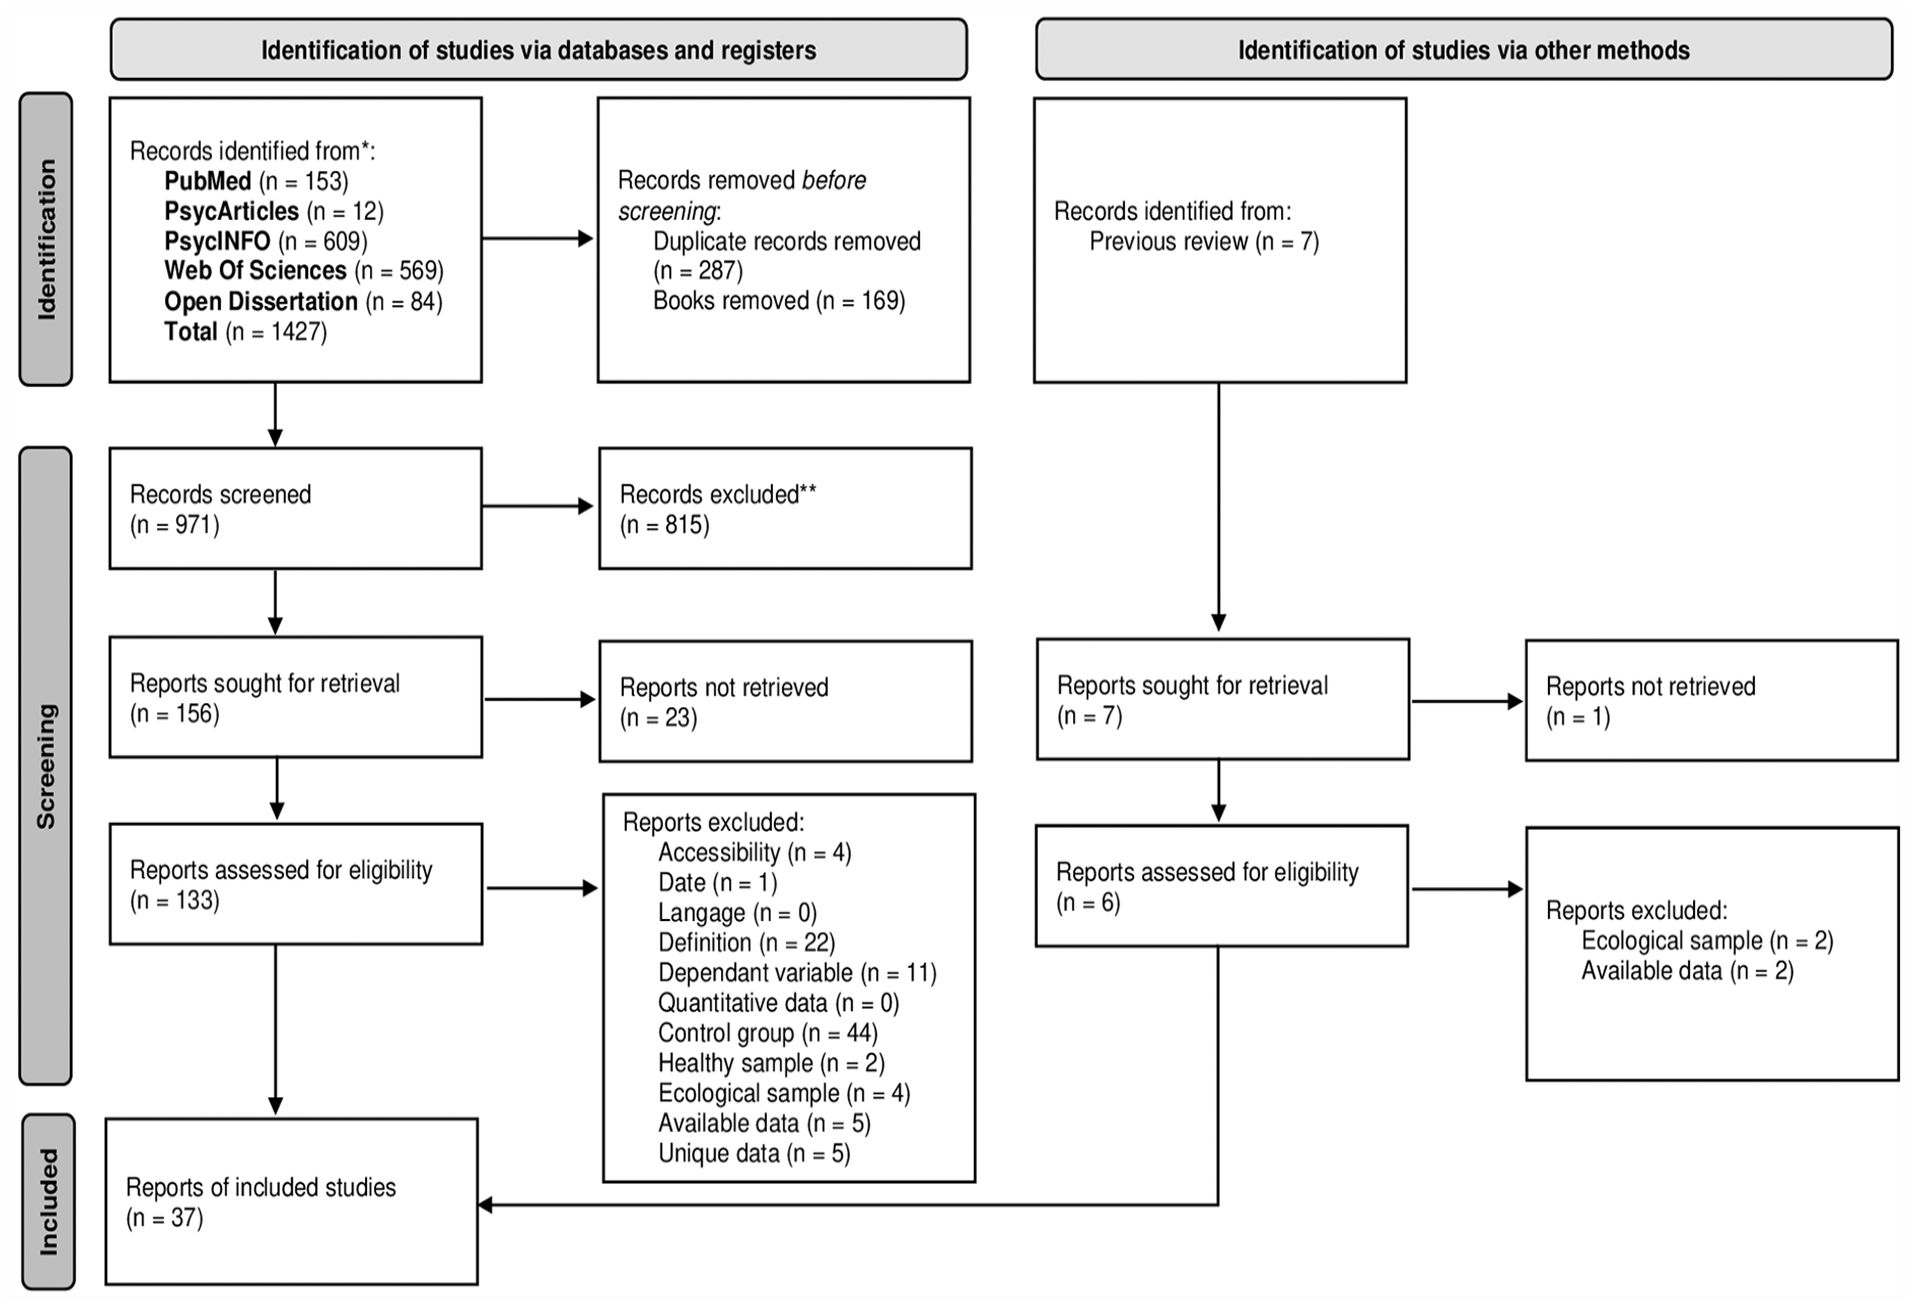
Flow Diagram of the Systematic Review.
Statistical Analysis
All statistical analyses were performed using R (version 4.1.2; R Core Team, 2021) with the metafor package (version 3.8-1; Viechtbauer, 2010). To facilitate the reproducibility of the statistical analyses, all data and R scripts are available from [https://osf.io/ya836/?view_only=ad2bdc0088d44c8f95b2801c9f787bd9].
Calculating Effect Size
The standardized mean difference (SMD) was chosen because multiple instruments or scales were used across studies to measure the same outcome domain. The effect size of each study was estimated using Cohen’s d (see Equation 1 from Lakens, 2013). The small sample size tends to inflate the magnitude of the effect size. Hedges’ g was therefore applied to handle the influence of sample size (see Equation 4 from Lakens, 2013). We estimated the sampling variance for each study’s effect size to synthesize the overall effect size. As Suero et al. (2021) recommended, we used Hedges’ unbiased estimator to estimate the variance of g (see Equation 9 from Hedges, 1983). We obtained the overall effect size from the SMD and the weight of each study (defined by the inverse of sampling variance, see Equation 3 from Steenbergen-Hu & Olszewski-Kubilius, 2016). The overall effect size and 95% CIs were also calculated for two interest variables, anxiety and depression.
One study (Elliott, 2013) reported the frequency of diagnosis of anxiety (e.g., general anxiety disorder) and depression (e.g., major depressive disorder) rather than a value on a quantitative scale. In order to get the same metric for the meta-analysis, the Odds Ratio was calculated and converted to a Hedges’ g.
From a normative perspective, the magnitude of the effect size is often interpreted as a function of the standardized values given by Cohen (1988). This effect size guideline tends to overestimate the magnitude sense of the effect size (Funder & Ozer, 2019). Moreover, the benchmark proposed by Cohen (1988) is not based on the distribution of effect sizes from empirical literature (Schäfer & Schwarz, 2019). Interpretation of the effect size magnitude can affect the implications and recommendations in a meta-analysis. Gignac and Szodorai (2016) proposed a benchmark to interpret the magnitude of r effect size in the domain of individual differences research. These magnitudes of effect size converted to Cohen’s d equate to: 0.22 for small, 0.39 for medium, and 0.61 for large effect size (Gignac & Szodorai, 2016). This benchmark was used to interpret the magnitude of overall effect size.
When a non-significant result emerges, it does not mean that there is no effect. Therefore, we performed a two one-sided test (TOST) for meta-analysis (Lakens, 2017b). This approach allows us to test the equivalence between the gifted group and the typically developing group in the area of anxiety and depression, consecutively. The equivalence test was performed on the non-significant results of the meta-analyses. The TOST procedure consists of pre-specifying upper and lower bounds to test the equivalence of both groups. If the results of the TOST procedure were between these two bounds, then we concluded that there was no meaningful effect and that the two groups were equivalent (Lakens, 2017a). The null hypothesis for the TOST procedure posits a significant effect size between the gifted and typically developing groups. A significant result corresponds to the rejection of this null hypothesis and suggests that the two groups could be considered equivalent. To our knowledge, no consensus exists regarding what constitutes a statistically meaningful effect size for anxiety or depression (see Steinert et al., 2017 for a discussion). Consequently, equivalence test bounds were set at ± .22, based on the benchmark for a small meaningful effect size (Gignac & Szodorai, 2016).
Heterogeneity Analysis
Some studies may provide many effect sizes and perform multiple comparison tests with the same control group. In this situation, there is a dependence between effect sizes. However, the independence between effect sizes is an important assumption of univariate meta-analysis. A three-level meta-analysis is an approach to handling the dependence on effect size (Moeyaert et al., 2017). This approach estimates the sampling variance for each effect size (Level 1), the variation over effect sizes within each study (Level 2), and the variation over effect sizes between studies (Level 3); (see Van den Noortgate et al., 2015 for a detailed description). In other words, the three-level multilevel modeling considers the heterogeneity within and between studies to estimate the overall effect size (Konstantopoulos, 2011). The magnitude of Level 2 and Level 3 variation may also allow the inclusion of predictors to explain heterogeneity within these levels (Cheung & Chan, 2014).
The Q statistic (Cochran, 1954) can serve as an index of between-study heterogeneity. A significant Q-test suggests that there is more heterogeneity between effect sizes than expected on the basis of the sampling error within studies. Effect sizes between studies cannot be considered equivalent due to moderating factors such as publication type, country, and so forth. A random-effects model is more appropriate than a fixed-effects model to estimate the overall effect size (Pastor & Lazowski, 2018). The heterogeneity of estimated effect sizes can be due to the variation between true effect sizes (i.e., the observed effect sizes without the sampling error; Borenstein et al., 2017). The I2 statistic also estimates this heterogeneity across effect sizes, but in a relative way (Higgins & Thompson, 2002). The I2 refers to the proportion of the total variance that could be attributed to a “true” heterogeneity between effect sizes (i.e., without sampling error; Borenstein et al., 2017). In the three-level multilevel modeling, two kinds of I2 are estimated which correspond to the proportions of heterogeneity in the true variance within- and between-study, respectively. The magnitude of heterogeneity was interpreted using the benchmarks provided by Higgins and Thompson (2002): less than 30% as low impact of heterogeneity, from 30% to 50% as moderate impact of heterogeneity, and above 50% as notable impact of heterogeneity. The estimator of the within and between variance was calculated using the restricted maximum likelihood estimator (Cheung & Chan, 2014; Langan et al., 2019; Pastor & Lazowski, 2018; Viechtbauer, 2010). We expressed the heterogeneity of this current meta-analysis in another way using the 95% prediction interval. The prediction interval is used to express a 95% interval where the actual effect would be expected in similar future studies (IntHout et al., 2016). In other words, the effect from a prospective study would have a 95% chance of being in the prediction interval. The prediction interval is identical to the CI when the meta-analysis has no heterogeneity between-studies. A prediction interval may thus cover a broader range than a CI because of the heterogeneity of the meta-analysis.
Moderator Analysis
In this current meta-analysis, the moderator analyses refer to subgroup analyses in order to examine potential sources of heterogeneity in observed effect sizes. This type of moderator analysis investigates the factors that explain the variability among within- and between-study effect sizes. A moderator was retained if there were at least two studies per modality. Concerning the publication, we considered the following information: (a) the place and year of publication, (b) the referencing in SCImago, n.d. (SJR) and the status of publication, (c) the study’s origin where we merged into the four following continents: America, Europa, Asia, and Oceania.
Some characteristics of participants in the selected study were taken into account for the moderator analyses. The studies were split into three categories according to the age of the gifted groups: (a) children (0–11 years), (b) adolescents (12–17 years), and (c) adults (18 years and above). Gender was used to explain the within-study heterogeneity. Effect sizes for girls and boys were then compared. The mode of identification used to label individuals was coded into three categories of giftedness identification: (a) ability, which is an identification based on an assessment of cognitive skills such as a standardized intelligence test, (b) academic, which is an assessment of academic performance based on tests of academic achievement, grade, performance, or school success, and (c) mixed, which refers a combination of tests that assess both cognitive skills and academic performance. There is still variability in the chosen threshold for identifying giftedness (Carman, 2013). However, most studies used a 97.78 percentile threshold (i.e., two SDs above the average) to identify giftedness (Carman, 2013; Vaivre-Douret, 2011). This threshold is thus considered a moderator variable in subgroup analysis. In other words, we tested the effect of the use of this threshold on the observed effect size between gifted and typically developing groups on anxiety and depression consecutively. The mode of recruitment was identified in each study. This variable refers to how the authors recruited the gifted individuals for their study. Three methods of recruitment were identified: (a) a screening method, where a large sample was recruited irrespective of giftedness, and gifted and typically developing individuals were thereafter identified and compared, (b) a pedagogical method, where gifted individuals were recruited for a particular pedagogical program, and (c) a clinical method, where gifted individuals were recruited through clinical settings, for instance when consulting a psychologist. The type of school program was listed. Gifted samples were distinguished into two categories: (a) those enrolled in specific programs such as enrichment, acceleration, or undefined special curriculum and (b) those not enrolled in specific programs.
The reliability (estimated mainly by the value of a Cronbach’s alpha reliability coefficient), the category (i.e., anxiety or depression), and the names of scales were recorded for moderating analysis of the overall estimated effect size. Anxiety is usually broken down into different types, including state anxiety, trait anxiety, performance anxiety, social anxiety, and others.
All moderator analyses were performed independently of each other. However, the subgroups are potentially correlated with each other. These multiple tests increase the inflation of the Type I error. Therefore, we applied a Holm correction (Holm, 1978) on the p-values for each moderator test.
Sensitivity Analysis
Examining the influential outliers is an essential step in statistical analyses. Indeed, an influential outlier can disproportionately affect the conclusions (Aguinis et al., 2013). An investigation was performed on the significant deviation of each effect size from others (i.e., outliers). The influence of each detected outlier on the results of statistical models was gauged. If an effect size was greater than or equal to the median ±2.5 times the median absolute deviation (MAD), this effect size was considered an outlier (Leys et al., 2013). Then, Cook’s distance was computed to assess whether the outlier was influential. The outlier was considered influential if its Cook’s distance was greater than the threshold determined by 4/n, where n refers to the number of effect sizes (see Altman & Krzywinski, 2016 for the similar method). A first analysis was performed with the influential outliers. The results section contains the results of this first analysis. A second analysis was conducted without influential outliers to estimate the robustness of the conclusion.
A leave-one-out procedure was used to estimate the influence of each effect size and study on the overall effect size and the proportion of heterogeneity within and between studies heterogeneity (see Dodell-Feder & Tamir, 2018 for a similar procedure). The multilevel model was a rerun, leaving one effect size or one study out at a time. This procedure was repeated as many times as there were effect sizes and studies included in the analysis. At each rerunning of the multilevel model, the overall effect size and amount of heterogeneity were calculated without the effect size or study left out.
Publication Bias
We followed several steps to determine the possibility of publication bias. The final analyses included both published and unpublished data. The status of each publication was determined according to the referencing of its journal in the SCImago platform. This platform references and gauges the scientific influence of academic journals. We tested the moderating effect of this publication status.
Small samples tend to have greater effect sizes than larger samples. This difference is likely due to the sampling variance used to estimate the effect size, combined with a differential publication bias (Slavin & Smith, 2009). This phenomenon is called the small sample effect. This effect will involve a publication bias in that it implies an overestimation of the overall effect size. A funnel plot was generated to visually assess the presence of this effect. This plot allows us to investigate the symmetry of estimated effect sizes as a function of standard sampling error. Thus, an asymmetry in the dispersion of estimated effect sizes would indicate a small sample effect. The judgment of the asymmetry of the funnel plot is still subjective. Egger’s regression test allows the skewness of the estimated effect size distribution to be assessed as a function of sampling error (Egger et al., 1997). This test could be adapted with effect size dependence (Fernández-Castilla et al., 2021; Rodgers & Pustejovsky, 2021). This statistic tests the effect of sampling variance on the overall effect size estimate. The funnel plot is significantly skewed if the sampling variance significantly affects the overall effect size.
Results
In the current study, 83 effect sizes were calculated from 32 studies selected using the eligibility criteria among 1,427 studies initially collected (see Table 4 in the Appendix [see Supplemental Materials]). There are 27 studies on anxiety (73% of the selected articles), 15 studies on depression (41% of the selected articles). Seven studies focused on both anxiety and depression (i.e., Altaras-Dimitrijević, 2012; Bracken & Brown, 2006; Eren et al., 2018; Fillmore, 2019; North, 2015; Peyre et al., 2016; Richards et al., 2003). Martin et al. (2010) collected four studies for anxiety and six separate studies for depression, so we were able to collect a larger number of studies allowing us to calculate the effect of potentially moderating variables. In addition, we also rectified the error in one of the effect sizes, which had been inverted (Tong & Yewchuk, 1996).
Anxiety
Twenty-seven studies with 61 effect sizes met the inclusion criteria for subsequent analyses. These studies were published between 1996 and 2020 (M = 2008; SD = 6.85 years) and were conducted in North America (nine studies, i.e., 33%), Asia (seven studies, i.e., 26%), Europa (nine studies, i.e., 33%) and Oceania (two studies, i.e., 7%). Participants ranged in age from 5 years and 8 months to 20 years and 8 months (M = 13.48; SD = 3.17 years). Sample sizes by study ranged from 55 to 1,081 participants (Mdn = 200; MAD = 188.29).
The overall ES was slightly negative but not statistically significant, g = −0.14, 95% CI = [−0.27, 0.01], p = .058 (see Figure 2). The equivalence tests indicated that the observed overall ES was not within the equivalence bounds of g = ± 0.22, Z = 1.147, p = .126. In other words, we do not conclude that both groups are equivalents.
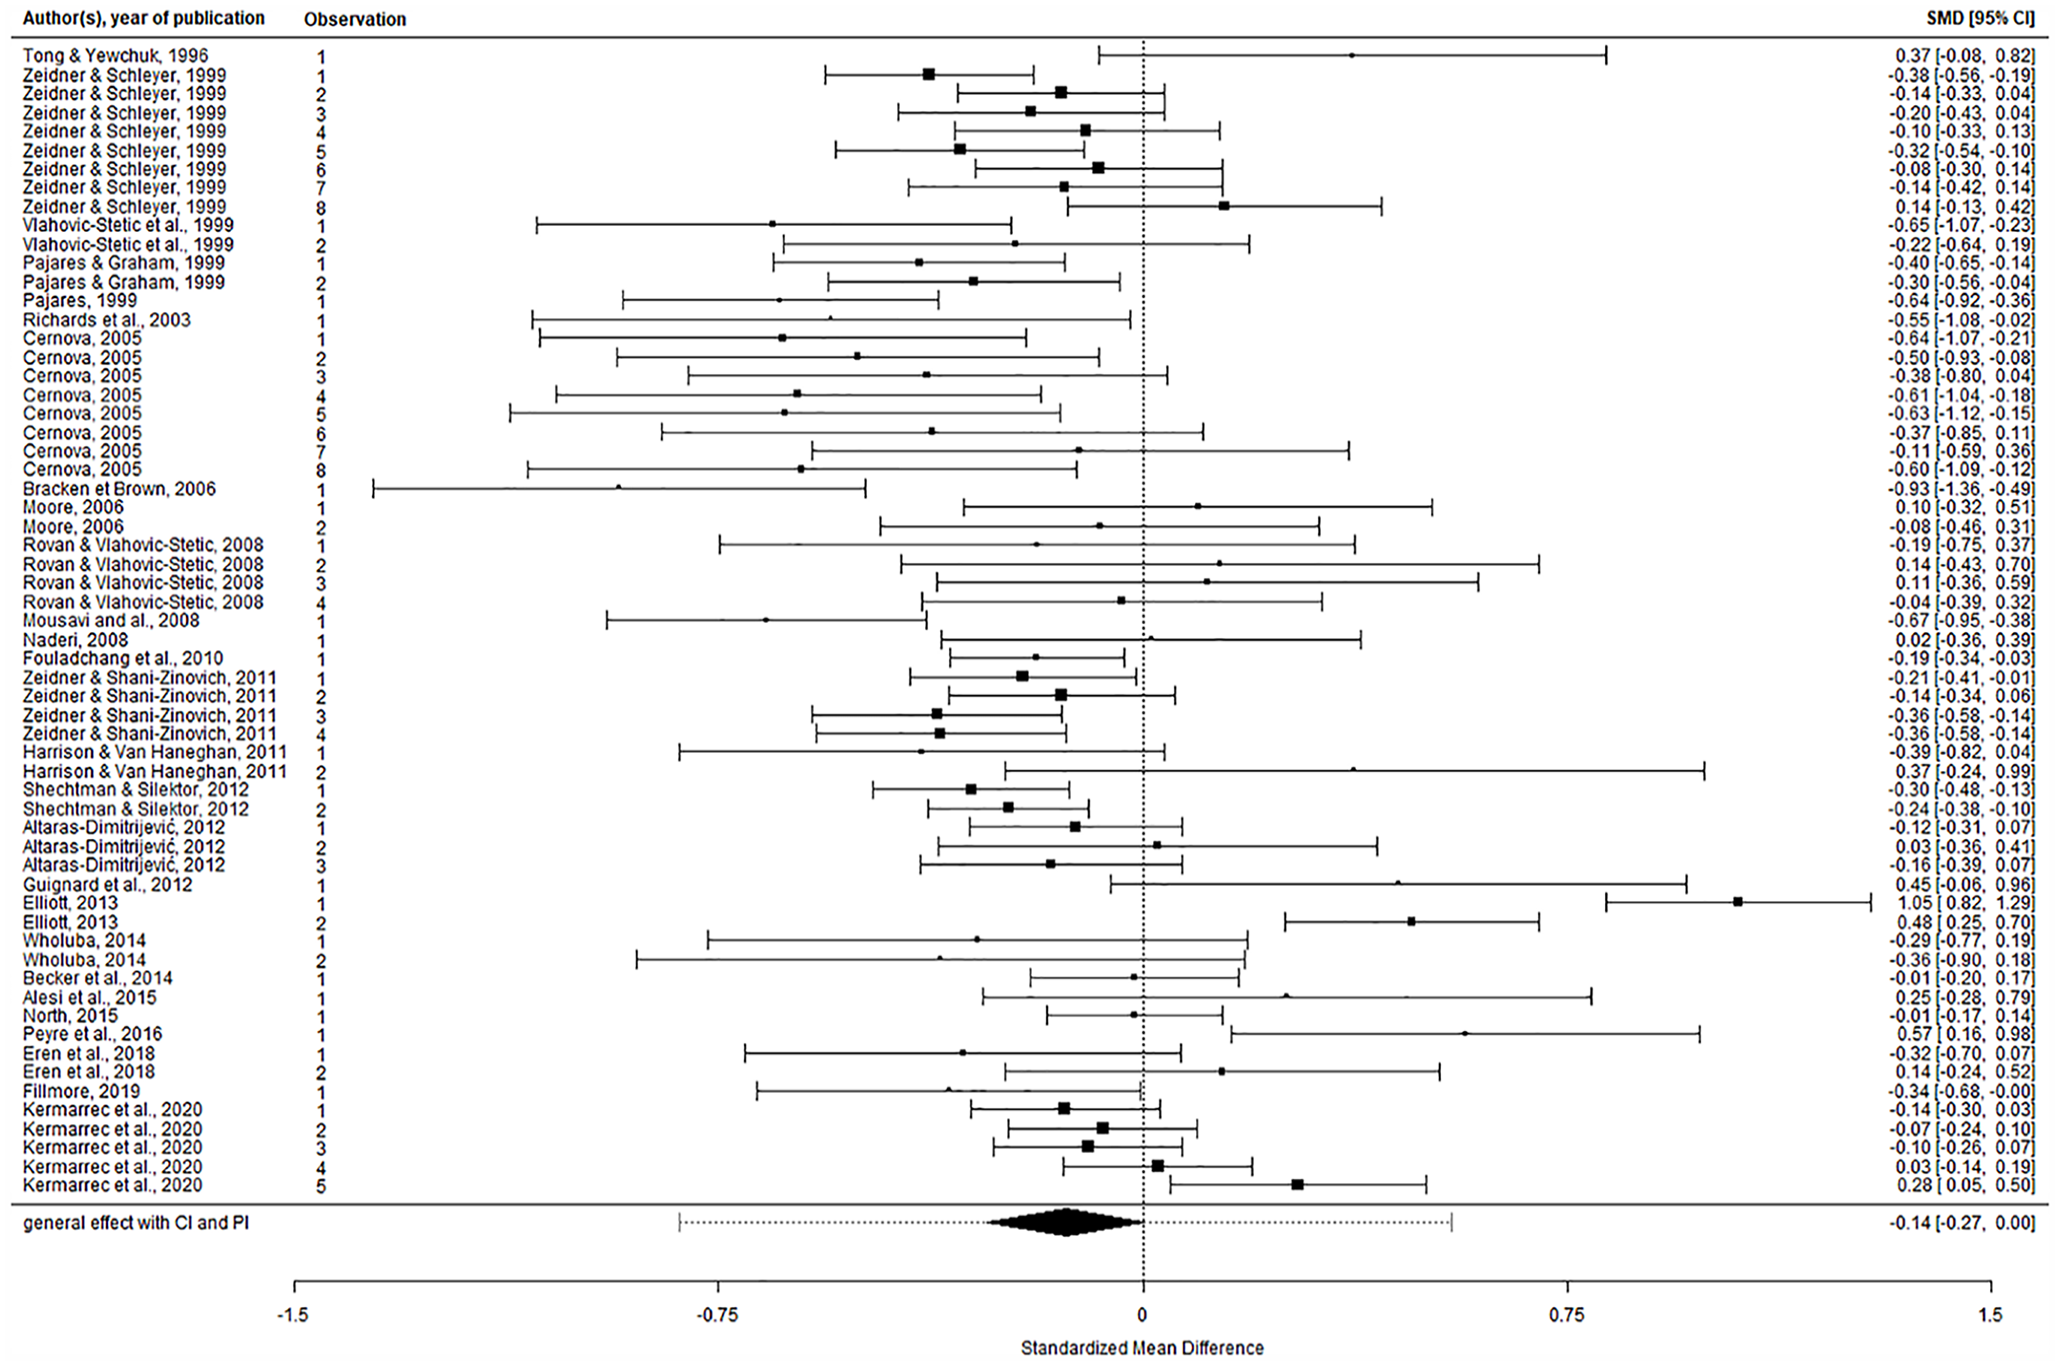
Forest Plot for Anxiety Based on Random Effect Model.
The effect sizes were heterogeneous, Q(60) = 289.95, p < .001. Total I2 was 86.39% indicating a large amount of true variance in effect size estimates. The likelihood ratio test showed that
The overall effect size increased but still had a small magnitude after treatment of the influential outliers. Outlier and influence diagnostics did not identify any influential outlier. Leave-one-out analysis at the individual effect size level showed that the magnitude of the effect was robust (range g = −0.16 to −0.11). The overall effect size remained non-significant in 88.52% of cases. As in the previous analysis, the true effect size variance remained high in total (low
Age, gender, year of publication, type of publication, continent of study, type of identification, IQ cut-off, type of anxiety evaluated, school program, and reliability of the measure were examined as potential sources of heterogeneity in moderator analyses (see Table 2 in the Appendix [see Supplemental Materials]). There was no significant moderating effect of gender, year of publication, type of publication, continent of study, type of identification, IQ cut-off, school program, or reliability of the measure (see Table 2 in the Appendix [see Supplemental Materials]). Only the effect of measure type affected the observed effect size of anxiety in gifted individuals relative to their peers, F(4, 22) = 6.24, p = .018.
No evidence of publication bias was found. The type of publication did not significantly moderate the difference between gifted and nongifted group for anxiety (p = 1.000) The funnel plot was also examined (see Figure 3). The inspection suggested no small-sample bias. The Egger’s regression test was non-significant. The overall effect size was not affected by the small sample variance. In other words, the magnitude of the overall effect size was not overestimated.
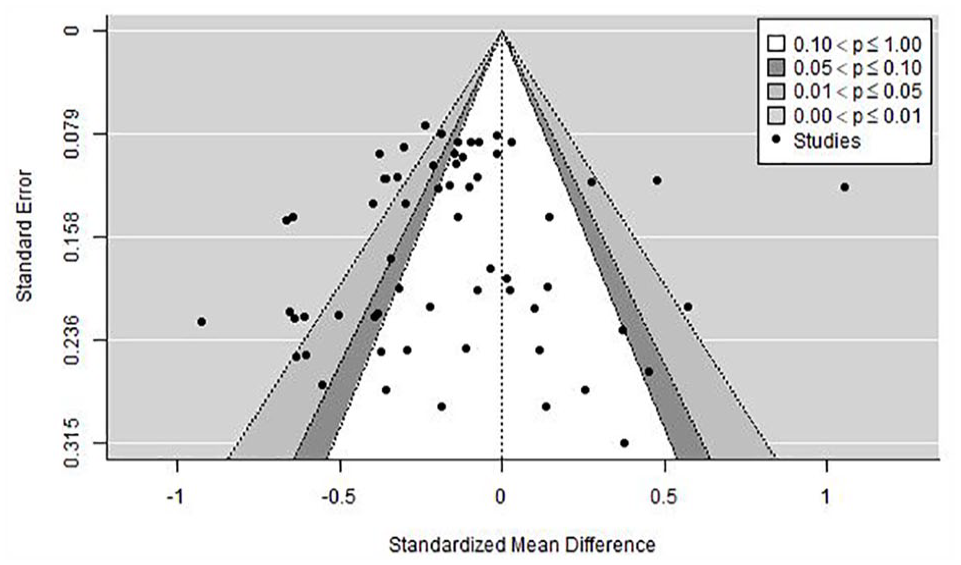
Funnel Plot for Anxiety.
Depression
Fifteen studies with 22 effect sizes met the criteria for inclusion in the current meta-analysis. These studies were published between 1995 and 2019 (M = 2010; SD = 7.13 years) and were conducted in America (six studies, i.e., 40%), Asia (three studies, i.e., 20%), Europe (four studies, i.e., 27%), and Oceania (two studies, i.e., 13%). Participants ranged in age from 5 years and 8 months to 20 years and 8 months (M = 13.46; SD = 4.11 years). Sample sizes ranged from 46 to 1,524 participants (Mdn = 90; median absolute deviation, MAD = 44).
The overall effect size had a small magnitude and was not significantly different from zero for depression, g = −0.14, 95% CI = [−0.29, 0.00], p = .057 (see Figure 4). The equivalence tests indicated that the observed overall ES was not within the equivalence bounds of g = ± 0.22, Z = 1.060, p = .145. In other words, we do not conclude that both groups are equivalent.
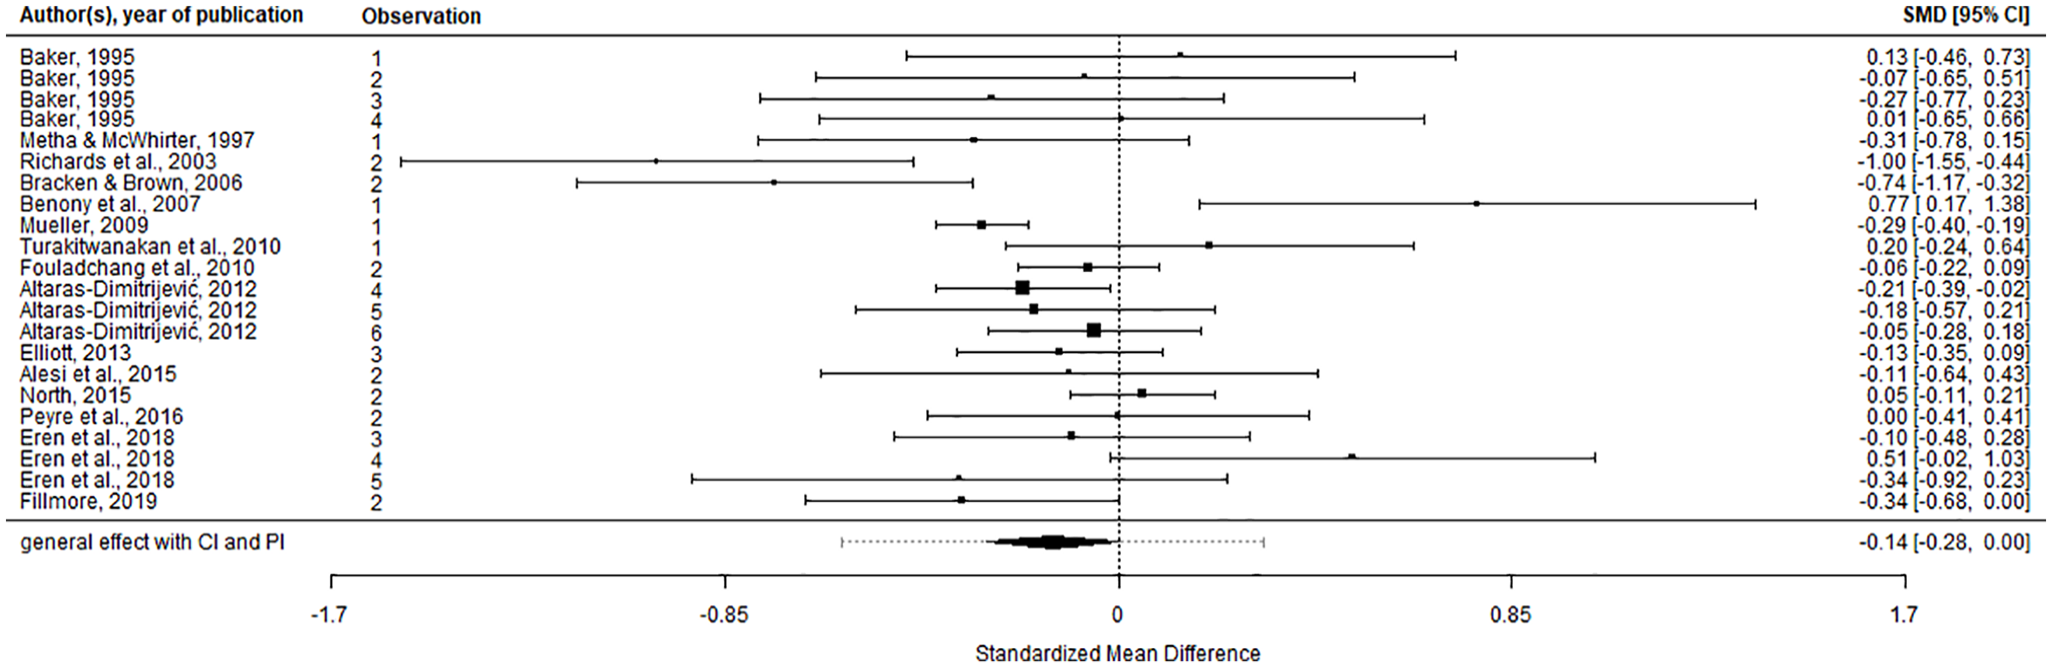
Forest Plot for Depression Based on Random Effect Model.
The observed effect was heterogeneous, Q(21) = 54.46, p < .001. Total I2 was 68.51%, indicating a large amount of true variance in effect size estimates.
No influential outliers were found. Only the leave-one-out analysis was, therefore, performed for the sensitivity analysis. The leave-one-out analysis at the individual effect size level showed that the magnitude of effect was robust (range g = −0.16 to −0.11). However, the overall effect size remained non-significant in 54.46% of cases. The effect sizes from Fillmore (2019) and Mueller (2009) seemed to have a notable impact on the significance of the null hypothesis significance testing. However, these effect sizes did not appear to influence the estimation of the overall effect size. The true effect size variance remained notable in total (low
Age, gender, year of publication, type of publication, continent and country of study, type of identification, IQ cut-off, school program, and reliability of the measure were examined as potential sources of heterogeneity in the moderator analyses (see Table 3 in the Appendix [see Supplemental Materials]). No significant moderating effect was found. Type of publication did not significantly moderate the difference between gifted and nongifted group for anxiety, F(1, 13) = 0.43, p = .522. Visual inspection of the funnel plot suggested there was no small-sample bias (see Figure 5). The Egger’s regression test was non-significant, p = .361: the overall effect size did not appear to be stronger for small sample studies.

Funnel Plot for Depression.
Discussion
Summary of Findings
The objectives of our study were twofold: (a) to investigate the relationship between anxiety, depression, and high intellectual potential and (b) to examine the role of potential moderating variables that could account for the heterogeneity observed in studies investigating anxiety and depression in gifted children. In this current systematic review and meta-analysis, we included 27 studies on anxiety and 15 on depression in giftedness, all published between 1995 and 2020. In this same issue, the published corrigendum from Martin et al. (2010) indicates a moderate effect size in anxiety level (d = −0.48), but nonsignificant at the 5% significance level, between gifted and typically developing children. The average true effect of giftedness on anxiety estimated in the current study (−0.14) was not significant either and was much smaller than that found in the subsequent analysis by Martin et al. (Corrigendum, 2023). In addition, the between-study heterogeneity was substantial, suggesting that the true effect might also be positive in some settings. The level of depression between gifted and typically developing individuals does not significantly differ from zero. We find an observed effect size magnitude relatively close (g = −0.14) to that of Martin et al. (d = −0.17) for depression with a large heterogeneity. The results were robust with respect to sensitivity analyses, and we found no evidence of publication bias in this field of research. The weak magnitude of these effect sizes can be explained by a small positive correlation (r = .16) between intelligence and emotional regulation (see Joseph & Newman, 2010 for meta-analysis). Anxiety and depression are often associated with emotional regulation (see Daros et al., 2021, for a meta-analysis). Gifted individuals perceive, use, understand, and regulate their emotions more efficiently than their counterparts (see Alabbasi et al., 2020; Ogurlu, 2021a for meta-analyses). The higher the intelligence, the more effective the strategies for regulating emotions. However, this effect is small, which should explain the small magnitude of the observed effect size in this current meta-analysis. Moreover, we had no significant effect on anxiety or depression. We had a large between-studies heterogeneity which may explain the lack of evidence to reject the null hypothesis. Large individual sampling variances increase standard error. This enhancement of standard errors can increase Type 2 error estimates (i.e., fail to reject a wrong null hypothesis). In a large sample recent study, Williams and colleagues (2023) showed a significantly small effect size (odds ratio = 0.69 or d = −0.20) between gifted and typically developing individuals regarding anxiety disorder, but found no significant difference for depression. Their magnitudes of effect size are similar to our current meta-analysis.
Beyond our non-significant results, this current study showed that this dichotomous vision of giftedness (i.e., “mad genius” vs. “perfect individual”) is not adequate with scientific literature. From a clinical perspective, our findings indicate that giftedness should not be considered comorbid with affective disorders. Although some high-quality studies (such as Williams et al., 2023) present convincing evidence that giftedness may be a protective factor in developing mental health disorders, our study shows that gifted individuals may experience this type of psychopathology. Based on our data, the prediction intervals showed that individual study effects would likely be either positive or negative in future studies about affective disorders. Our results contradict the representation that gifted individuals would have more emotional difficulties than peers. The inaccurate representation of this characteristic of giftedness is still present in the media (Bergold et al., 2021) and most of the population (Sanchez et al., 2022). This current study moderates this point of view (i.e., “mad genius”) and pushes to investigate the reasons for this heterogeneity in the observed effect sizes.
Studies comparing labeled and unlabeled gifted individuals have shown differences in social-emotional domains such as self-esteem (Litster & Roberts, 2010). Moreover, well-behaved individuals are less likely to be identified as gifted (Freeman, 2006). Studies are often unclear on this type of sample description (i.e., labeled or not labeled gifted). It might have been interesting to use this information in the moderator analysis to explain the heterogeneity in effect sizes observed.
In order to explain the significant between-study heterogeneity, we investigated moderating variables such as the type of identification and the type of recruitment. We found that identification of the gifted was evenly split between measures of cognitive skills and mixed measures (10 studies, i.e., 42%), with identification by purely academic performance being rarer (4 studies, i.e., 17%). This lack of consensus is characteristic of this field of research and remains a problem although it does not appear to play a moderating role in studies of anxiety and depression. In terms of recruitment, the majority of studies appear to recruit through gifted programs, from a population already identified and with educational accommodations adapted to their profile. Martin and colleagues (2010) also made this observation and suggested that the gifted who do not have specialized services or those who have not been identified for various reasons (notably the existence of certain disorders) could present much higher levels of anxiety and depression (Martin et al., 2010). It is partly for this reason that recruitment by screening seems to be the most relevant method to accurately represent this population, but it requires important financial and human resources, which greatly limits its application. As with the type of identification, we did not find a moderating effect of recruitment on anxiety or depression, which could be partly explained by the small number of studies that used screening (five studies for anxiety, i.e., 18%).
Labeling the studies according to their type of recruitment and identification allowed us to observe different methodologies from one country to another. The American, Oceanic, and Asian studies recruited only gifted subjects from specialized educational facilities, and more often used mixed criteria in the identification (10 studies for anxiety, i.e., 62%). On the contrary, European studies seem to diversify more the type of recruitment but the majority of studies consider only cognitive skills (six studies for anxiety, i.e., 66%) in the identification of the gifted. In addition, the continent variable borders on significance for depression, and American studies tend to associate less depression with gifted subjects (g = −0.29). It would therefore be interesting to explore further the reasons for differences between certain cultures, especially as recruitment and identification do not seem to be sufficient elements to explain the heterogeneity.
At the measurement level, the type of anxiety acts as a moderating variable, as gifted children seem to experience significantly lower levels of performance anxiety than the typically developing children. This may be due to the fact that they perform significantly better academically, which is a widely accepted criterion for identification. For the gifted children identified solely on the basis of their cognitive abilities, they also perform better in school (Guez et al., 2018), with IQ being an excellent predictor of school performance (Watkins et al., 2007). The most investigated types of anxiety in the gifted seem to be performance anxiety and trait anxiety, which are particularly low in gifted subjects. In contrast, social anxiety is the type of anxiety most similar to the control group, and it is the least investigated type of anxiety, with only four studies. Similarly, the majority of studies have focused on gifted adolescents (g = −0.25), for which the benefit associated with giftedness is most pronounced, compared with children (g = −0.09) and adults (g = 0.32). Anxiety in gifted adults has been little investigated (two studies for anxiety, i.e., 7%) and given the width of the confidence interval, it is difficult to attribute a specific profile to them. The performance in emotional inhibitory control is lower in adolescence than in childhood and adulthood in typical development (Aïte et al., 2016), which tends to affect emotional regulation (Telzer et al., 2015). The developmental trajectory of emotional regulation refers to a quadratic curve (Silvers et al., 2012). In other words, emotional regulation strategies’ effectiveness increases linearly from childhood to adulthood, where an asymptotic curve appears. Gifted adolescents have higher inhibitory control than their peers (Aubry & Bourdin, 2021). Moreover, gifted individuals would have an early development of control inhibitory. Gifted and typically developing individuals would have different developmental trajectories (Hilscher, 2022). The gap between gifted and typically developing individuals can thus increase from childhood to adolescence and become less critical in adulthood. This phenomenon could explain the differential effect size in adolescence on anxiety.
Adolescence involves higher stakes in schooling with the decision-making regarding vocational choices (Lannegrand-Willems et al., 2016). School investment is intimately linked to the ongoing experience of success in school. The personal importance of doing well in school is dependent on this experience (Wigfield & Eccles, 2000). For example, the underachievement of some gifted individuals may decline this value of school achievement (Snyder & Linnenbrink-Garcia, 2013) and act on their emotional competencies (see White et al., 2018 for a meta-analysis). Among the studies included in this meta-analysis, only two compared a group of gifted achievers with a group of gifted underachievers. Neither of these studies allowed us to analyze a possible moderating effect of underachievement on anxiety. The first (Moore, 2006) did not find significant differences between the two groups for test anxiety. The second study (Vlahovic-Stetic et al., 1999) found that mathematically gifted achievers had significantly less math anxiety than typically developing individuals, while mathematically gifted underachievers did not differ significantly from either group. These initial findings suggest that, an underachiever student tends to have a high level of anxiety, regardless of intellectual level. Because anxiety seems linked to academic underachievement among gifted children (Obergriesser & Stoeger, 2015), future studies on anxiety should take into account the academic performance profile of gifted students.
The social background (or socio-economic level) could also explain the divergence of results in the literature. Indeed, the majority of studies select their samples from specialized classes for children and adolescents with giftedness. However, individuals from disadvantaged classes or ethnicities are frequently and implicitly excluded from these settings (List & Dykeman, 2021), while social background is a factor in the tendency to experience anxiety (Eisenberg et al., 2007). Advanced learning programs (e.g., acceleration, enrichment, ability grouping, etc.) are only mentioned. Few studies indicate whether their gifted group favored enrichment or acceleration-type support. Providing more information on the context and content of these programs would be of particular interest in the future, to evaluate their effect in greater detail. Overall, the gifted do not seem to benefit from any protective factor with regard to anxiety and depression, even when advanced learning programs are available to them. The difficulties that some gifted may encounter could be associated with many other environmental factors (separation, moving, bereavement, boredom, school maladjustment, failure situations, etc.), neurodevelopmental factors (learning disorders, genetic diseases, autism spectrum disorder, etc.), or interpersonal factors (attachment, relationship with others, identification, self-representation, etc.) that we did not investigate in our study. Twice exceptionality could also be an avenue, as many gifted with one or more disorders may experience significant disappointment with the school system, with frequent episodes of frustration (Beckmann & Minnaert, 2018), when accommodations focus only on their weaknesses and do not exploit their high potential in different skill areas (Gierczyk & Hornby, 2021).
Study Limitation and Future Research
The results obtained in our meta-analysis study should be considered under the limitations of this study. First, the lack of descriptive data in the selected articles limits the scope of our results. Data related to the socio-economic status (SES) of the samples were not considered in the moderator analysis due to lack of content. Moreover, the accuracy of coding was hindered by inadequate information about the advanced learning programs available to children. Although specific services were grouped under a single denominator, special attendance, a more detailed specification and comparison of the different types of service (e.g., enrichment, acceleration) would have been highly informative. To address these limitations, future empirical studies should refine this descriptive information to better understand the causes of heterogeneity and to advance the current state of research.
Second, the generalizability of our results is also limited by the methodological parameters of the selected studies. We only selected studies that defined the giftedness according to academic or intellectual criteria, as these constructs are similar. Therefore, our study focuses on a large population (i.e., identification by an IQ and identification according to various academic performances), but also has limitations (e.g., exclusion of giftedness in the arts and sports). In parallel, the measurement of anxiety and depression is limited by the use of scales that do not necessarily evaluate the same theoretical concepts in the same way (e.g., interview, hetero-report, self-report, observation), which may contribute to heterogeneity. Comparing the representation of anxiety and depression in parents and teachers with that of the gifted children would be an interesting line of future research.
Therefore, for future research, in order to confirm the general benefit of giftedness in anxiety and depression and to decrease the between-study heterogeneity, more appropriate research methodologies are highly needed. In particular, great care must be taken in the choice of the sampling method (e.g., random multistage cluster sampling), of the mode of identification (e.g., belonging in the top 2.22% of the population in intellectual abilities), and in the selection of the instruments (i.e., well-validated and reliable). In order to better understand what causes the heterogeneity of the results, the characteristics of the populations (i.e., both gifted and typically developing individuals) need to be assessed and reported more precisely and in a more comprehensive manner (e.g., socio-demographic characteristics, SES, educational programs attended). In addition, few studies to date adopted a longitudinal framework in this field of research. This methodological design would be interesting to understand the difference between age categories observed and also to explain the heterogeneity observed in these populations.
Finally, some limitations are specific to the meta-analytical methodology used in this study. First, the absence of a registered protocol of this meta-analysis is a limitation. Second, the moderator variables selected from these studies do not fully explain the heterogeneity between studies, which may be due to the choices made in the coding process and eligibility criteria. The significant heterogeneity obtained could also be attributed to the methodological quality of the selected studies. Assessing the quality of these studies and investigating their potential influence would be a fruitful avenue to explore in the future.
Supplemental Material
sj-docx-1-gcq-10.1177_00169862231208922 – Supplemental material for Anxiety and Depression in Gifted Individuals: A Systematic and Meta-Analytic Review
Supplemental material, sj-docx-1-gcq-10.1177_00169862231208922 for Anxiety and Depression in Gifted Individuals: A Systematic and Meta-Analytic Review by Léo Duplenne, Béatrice Bourdin, Damien N. Fernandez, Geoffrey Blondelle and Alexandre Aubry in Gifted Child Quarterly
Footnotes
Declaration of Conflicting Interests
The author(s) declared no potential conflicts of interest with respect to the research, authorship, and/or publication of this article.
Funding
The author(s) received no financial support for the research, authorship, and/or publication of this article.
Open Science Disclosure
The data analyzed in this study are available for purposes of reproducing the results at ![]() . The computed effect sizes and RStudio script used to generate the findings reported in the article are available for purposes of reproducing the results or replicating the study. The unique materials used to conduct the research are available for the purposes of replicating the procedure.
. The computed effect sizes and RStudio script used to generate the findings reported in the article are available for purposes of reproducing the results or replicating the study. The unique materials used to conduct the research are available for the purposes of replicating the procedure.
This journal operates a double-anonymized peer review process. Due to a technical error, this article was initially reviewed using the double-anonymized process and subsequent reviews were conducted through a single-anonymized peer review process. All authors and reviewers were made aware of the error and agreed to proceed with the peer-review process with the identity of the authors known to the reviewers. No reviewers reported conflicts of interest.
Notes
Author Biographies
References
Supplementary Material
Please find the following supplemental material available below.
For Open Access articles published under a Creative Commons License, all supplemental material carries the same license as the article it is associated with.
For non-Open Access articles published, all supplemental material carries a non-exclusive license, and permission requests for re-use of supplemental material or any part of supplemental material shall be sent directly to the copyright owner as specified in the copyright notice associated with the article.