
Abstract
In this preregistered study, we confirmed a transition-planning construct and determined its relationship with an established economic-hardship construct using parent- and youth-reported data from the National Longitudinal Transition Study 2012 and following established quality indicators of preregistered secondary data analyses studies. Transition planning was made up of seven items relevant to individualized education program (IEP) meeting participation. We examined measurement invariance on the basis of disability category and race/ethnicity as well as the intersection of these student characteristics in order to make unbiased group comparisons on key latent parameters. Contrary to our hypotheses, there was no meaningful correlation between transition planning and economic hardship. Moreover, we were unable to establish measurement invariance of transition planning because the item “youth's role in IEP meeting” functioned differently on the basis of disability category. Implications for practice are discussed regarding how decisions about IEP meeting participation are made, by whom and why, and whether evidence-based practices are effectively disseminated. Future research should ensure adequate sampling plans for national survey attempts in order to conduct an in-depth examination based on intersectional student characteristics.
Legally mandated by the Individuals With Disabilities Education Act (IDEA; 2004), transition planning is a crucial educational service meant to prepare youth who receive special education services. Researchers in the field of secondary transition have identified evidence-based practices designed to teach academic and transition skills to support pos-school attainment as well as identified predictors of postschool success (e.g., Haber et al., 2016; Mazzotti et al., 2021; Test et al., 2009). Active participation of youth in their individualized education program (IEP) meetings is one such evidence-based practice with positive impacts on postschool outcomes (e.g., Burnes et al., 2018; Martin et al., 2006; Newman, 2004; Wagner et al., 2012; Wehmeyer & Palmer, 2003; Wehmeyer & Schwartz, 1997). These and other studies have identified a range of predictors, including those at the student level (e.g., level of school engagement, self-determination skills, self-directed IEP meetings, functional skills), parent or family (e.g., parent expectations for the child's future, parent involvement in IEP transition meetings), and school-related factors (e.g., access to college- and career-readiness courses, vocational experiences) that can potentially be addressed by the educational system.
Although there is a substantial body of research on transition planning, the vast majority of studies have focused on a single aspect, such as youth and parent attendance at the transition planning meeting (Test et al., 2004; Wagner et al., 2012), youth-directed IEP meetings (Martin et al., 2006; Woods et al., 2010), or vocational rehabilitation's participation in planning (Oertle & Bragg, 2014). Moreover, intersectional student characteristics (e.g., race, ethnicity, and socioeconomic differences) are rarely addressed despite recent calls for prioritization of intersectionality within secondary transition research (Trainor et al., 2020). Consequently, a holistic understanding of the transition-planning process based on diverse intersectional student characteristics is missing from the literature.
Recently, there has been some effort to address this gap. Using National Longitudinal Transition Study 2012 (NLTS2012) data, Johnson, Wu, and colleagues (2020) conducted a factor analysis with 13 items from the youth and parent survey and found four subconstructs of transition planning that are consistent with the literature: invitation (whether parent or youth are invited to the meeting), youth/parent attendance (whether parent or youth attend the meeting), contribution (the degree to which youth with disabilities actively participate or direct the meeting by coming up with transition-planning goals), and community involvement (the involvement of community agency, such as vocational rehabilitation). This study examined differences based on gender, race and ethnicity, free and reduced lunch status, and English language learner status, none of which were significant (Johnson, Wu, et al., 2020). The race and ethnicity groups of interest in this study included non-Black, Black, Hispanic, and multiple races (Johnson, Wu, et al., 2020). Additionally, these researchers did not examine differences based on disability, and thus intersectionality of student characteristics was not prioritized.
However, in other studies focused on transition planning, researchers did explore student differences based on disability category (Davenport et al., 2022; Johnson et al., 2022; Johnson, Thurlow, et al., 2020). Both Johnson et al. (2022) and Johnson, Thurlow, et al., (2020) used logistic regression to examine differences in transition planning by disability. Johnson et al. (2022) examined all 12 IDEA-recognized disability categories, whereas Johnson, Thurlow, et al. (2020) studied specifically students with significant cognitive disabilities. Both studies found differences in whether the student took a leadership role in their transition-planning meeting based on disability category. Specifically, for youth with autism, intellectual disability (ID), and multiple disabilities, the odds of meeting with school staff to set transition goals and taking an active role in their transition-planning meeting were far lower compared with those for youth with specific learning disabilities (Johnson et al., 2022). Johnson, Thurlow, et al. (2020) similarly found that students with the most significant cognitive disabilities were less likely to be invited and take a leadership role in their transition-planning meetings. Also looking at differences in disability, Davenport et al. (2022) conducted cluster analyses to examine differences of students with various disabilities based on aspects of transition-planning experiences. Results indicated differences in disability groups, with the categories of autism, multiple disabilities, and orthopedic impairments always clustering together (Davenport et al., 2022). They also noted that grouping together students with “high-incidence disabilities”—including learning disabilities, speech and language impairments, other health impairments, and emotional disturbance—is problematic due to potential differences between these categories, calling for future research to further separate disability type when studying transition planning (Davenport et al., 2022). Importantly, these studies focused solely on group differences based on disability, rather than examining intersectionality of student characteristics.
Other relevant studies examined the additional student characteristic of English learner status (Trainor et al., 2019; Wu et al., 2023). Trainor et al. (2019) investigated five aspects of transition-planning experiences: (a) parent attendance, (b) student participation, (c) contribution in coming up with transition goals, (d) whether student interest had been discussed, and (e) whether parents communicated with staff about postsecondary education and employment among English learners with disabilities. It was noted that the transition plans for English learners with disabilities were more likely to be developed by school personnel rather than students and family members (Trainor et al., 2019). Using logistic regression, Wu et al. (2023) examined the transition-planning and IEP meeting experiences of English learners with disabilities. Results indicated that English learners with disabilities were less likely to take an active role in their transition-planning meeting and to be involved in writing their transition goals (Wu et al., 2023). These researchers took a step further toward intersectionality as both English language learner status and disability category were examined.
With regard to socioeconomic status and race, some findings show variation of aspects of transition services based on these student characteristics (Newman et al., 2011; Wagner et al., 2014). Specifically, Newman et al. (2011) examined the intersection of disability and socioeconomic status with race and ethnicity and family support of self-determination and found mixed results based on the combination of these characteristics. Wagner et al. (2014) showed that socioeconomic status was a significant factor in predicting high school graduation, attending college, and positive employment outcomes. The higher the socioeconomic status, the better postschool outcomes for these youth. Finally, Lipscomb et al. (2017) found that youth with ID and emotional disturbance were the most socioeconomically disadvantaged and most likely to attend lower-performing schools. Moreover, among these two disability groups—ID and emotional disturbance—Black youth were disproportionately represented (Lipscomb et al., 2017). Together, these findings demonstrate that intersectional approaches reveal greater inequities in the transition-planning process.
As summarized, although different aspects of IEP meeting participation were studied among certain groups, there is a lack of a holistic transition-planning construct that represents the IEP meeting process and demonstrates an intersectional approach using NLTS data. As such, there is a need to create a holistic transition-planning construct as well as examine differences based on intersectional student characteristics.
Research Questions and Hypotheses
In this study, we confirmed a transition-planning construct based on previous relevant literature in secondary transition (Davenport et al., 2022; Johnson, 2020; Johnson, Thurlow, et al., 2020; Johnson, Wu, et al., 2020). Additionally, we examined measurement invariance based on disability, race and ethnicity, and the intersection of these student characteristics. Last, we determined the relationship between transition planning and economic hardship (Lombardi, Wu, et al., 2022; Murray et al., 2015) and whether the relationship differs by the same set of student characteristics. Throughout, we closely followed quality indicators of preregistered secondary data analyses studies (Lombardi et al., 2023) in order to illustrate the practical application of this approach and promote openness and transparency (Nosek et al., 2018). We preregistered this study on Open Science Framework (OSF), a third-party registry website. The research questions and testable hypotheses that guided this study are detailed in the preregistration: https://osf.io/g5wkb/.
Method
Data Source
In this study, a large-scale nationally representative data set, the NLTS2012, was used. From 1987 to 2015, the U.S. Department of Education funded a series of three NLTS studies (Wave 1, NLTS 1990–1991; Wave 2, NLTS2 2001–2009; Wave 3, NLTS2012 2012–2013) to examine the characteristics, secondary school experiences, and postschool outcomes of youth with disabilities who receive services under IDEA. As the third study in the series, NLTS2012 provides the most recent nationwide sampling of youth with disabilities including their functional abilities, academic support received from schools, and postsecondary experiences (Burghardt et al., 2017).
Participants
The NLTS2012 data set includes an overall sample of 21,930 youth participants in the survey, of which 17,450 were students with IEPs in 432 school districts. The survey also included youth who received accommodations with 504 plans and youth with neither an IEP nor a 504 plan. In this study, we focused on the group of youth with IEPs, which included students across all the disability types recognized by IDEA.
Procedures
Data collection occurred in 2012 and 2013. In 2012, survey administration employed computer-assisted telephone interviewing, and in 2013, a web survey option and field interviewers were also introduced. Across the 2 years of data collection, there were a total of 10,460 parent surveys of youth on IEPs, representing a 60% unweighted response rate, and 8,960 youth surveys with IEPs, representing a 51% unweighted response rate. Youth ranged in age from 12 to 22 during the time of interview; the majority were between 13 and 21. All participating youth were in Grades 7 through 12 or in a secondary ungraded class at the time of sampling.
Weighting and Clustered Sampling
To ensure an appropriate representation of the target population, sampling weights must be considered due to the stratified random sampling design in the NLTS2012 data set. There are two sets of weights for the parent and youth survey data in NLTS2012, each of which has a different use. The all-youth weights p_weight_allyouth and y_weight_allyouth are designed for analyses using the full respondent sample, which are appropriate for analyzing measures that do not depend on youth age or grade at the time of the survey; the enrolled-youth weights p_weight_enrolledyouth and y_weight_enrolledyouth are designed for analyses using the population of youth who were enrolled in school in the reference school year, which is important for analyzing the results. Because a subset of the selected items depended on the youth's age or grade at the time of the survey, the enrolled-youth weight y_weight_enrolledyouth was used. In addition, because youth were clustered in districts, and those districts were stratified into different sizes of unit strata (such as small, medium, and large districts) based on their estimated number of age-eligible youth with an IEP, cluster variable c_apsu and stratification variable c_astratum were included to take into account the complex sampling design.
Variables
Transition Planning
Variables taken from the NLTS2012 youth and parent surveys were selected on the basis of previous studies (Davenport et al., 2022; Johnson, Thurlow, et al., 2020; Johnson, Wu, et al., 2020) as a starting point to identify theoretically and empirically relevant items. A total of 11 items were identified, including three youth (L1, L2, and L2a) and eight parent survey items (E1a, E1, E2, E4, E5, E6c, E6d, and E6e). Table 1 lists the items and accompanying text. Two of the parent-reported items, E1a and E5, asked the same question as the youth survey items L1 and L2a. In the current study, the parent-reported item responses (E1a and E5) were used rather than the youth-reported item responses (L1 and L2a) because more of the items selected for this study originate from the parent survey. If parent-reported item responses (E1a and E5) were missing, the youth-reported item responses (L1 and L2a) were used if available.
NLTS 2012 Transition Planning Items.
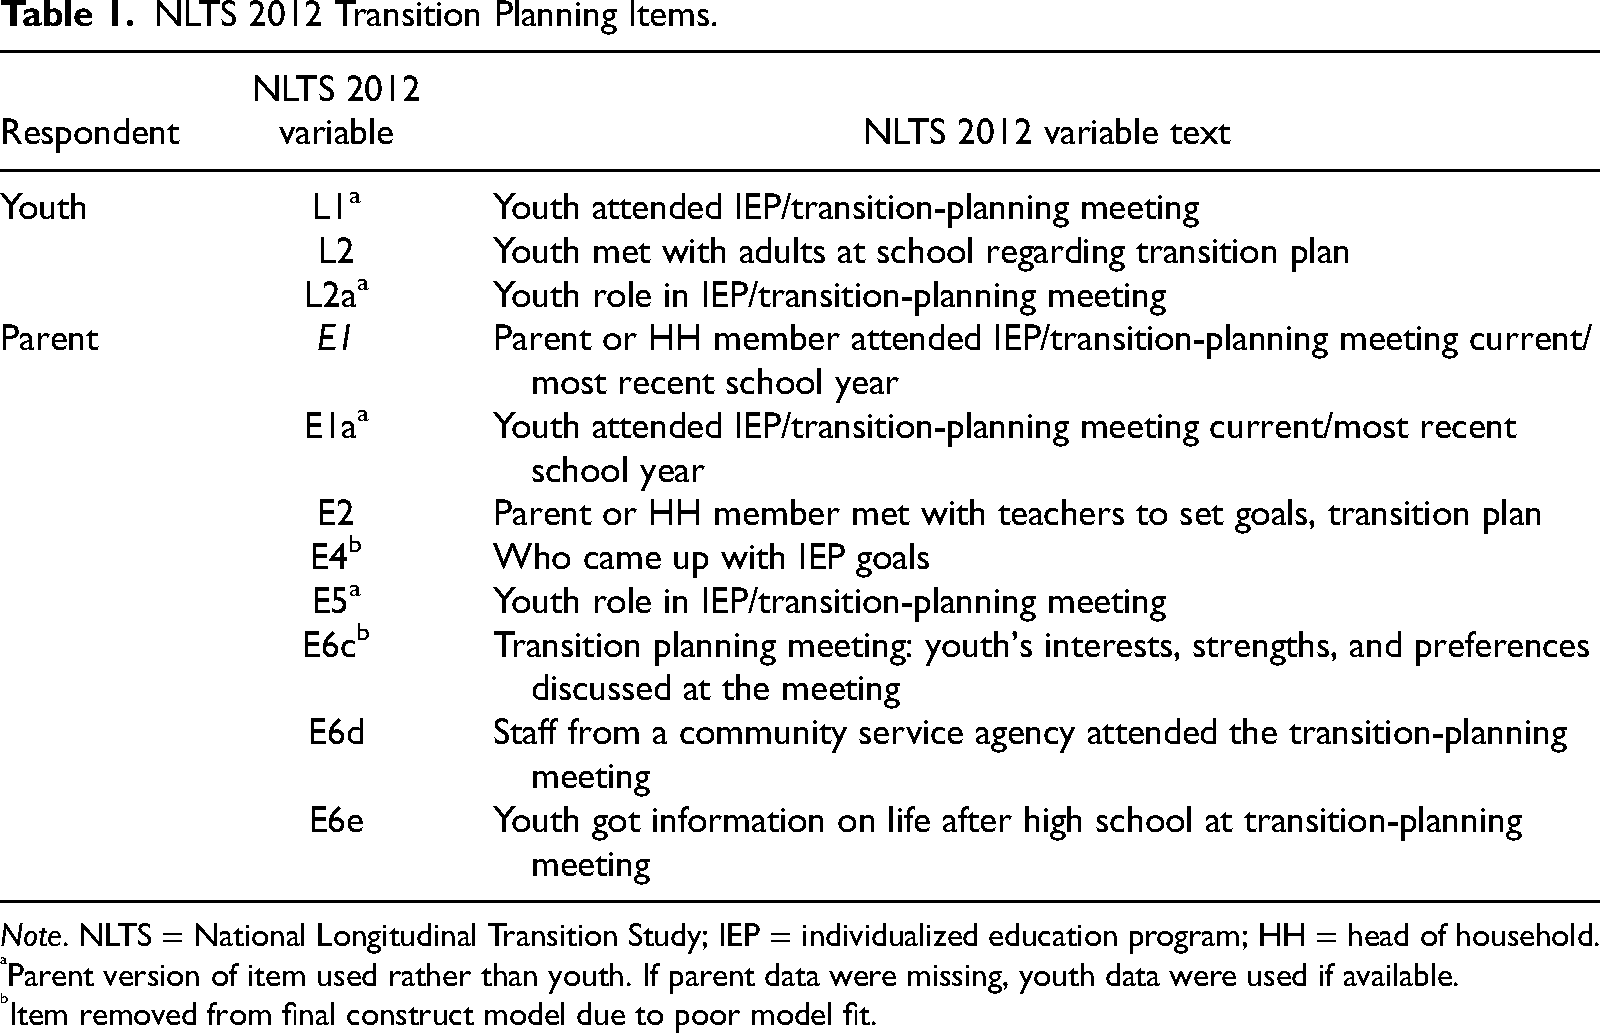
Note. NLTS = National Longitudinal Transition Study; IEP = individualized education program; HH = head of household.
Parent version of item used rather than youth. If parent data were missing, youth data were used if available.
Item removed from final construct model due to poor model fit.
Economic Hardship
Informed by a recent study using NLTS2012 data (Lombardi, Wu, et al., 2022), economic hardship is a unidimensional one-factor construct consisting of six theoretically relevant indicators: household income, parent education level, parent employment status, one- or two-parent household, household internet access, and participation in government-assisted social programs (Supplemental Nutrition Assistance Program [SNAP], Temporary Assistance for Needy Families [TANF], Supplemental Security Income [SSI]). In the current study, we correlated this factor with the newly created transition-planning construct to confirm the relationship.
Disability
For youth disability status and category, we used the district-reported variable (d_y_disability). Broadly, there are youth who are on neither a 504 plan nor an IEP (n = 1,590), youth on a 504 plan (n = 580), and youth with an IEP (n = 8,960). In our study, youth with an IEP age 16 years or older were the group of interest. Therefore, we grouped these youth on the basis of disability category: specific learning disability (n = 1,440), emotional disturbance (n = 1,050), speech or language disability (n = 940), other health impairment (n = 1,080), sensory disabilities (n = 670, including vision impairment and hearing impairment), multiple disabilities (n = 970, including multiple disabilities and deaf-blindness), autism (n = 950), orthopedic disabilities (n = 430), ID (n = 1,150), and traumatic brain injury (n = 240).1
Race and Ethnicity
Groupings of race and ethnicity were informed by a recent study using NLTS2012 data (Lombardi, Rifenbark, et al., 2022). We took the sum of all race categories: G3_01 (American Indian or Alaska Native), G3_02 (Asian, Native Hawaiian, or other Pacific Islander), G3_03 (Black), and G3_05 (White). Next, we took this summed race variable along with G2 (Hispanic, yes/no) and individual responses to the G3 variables to construct the following race-ethnicity groups: (a) White non-Hispanic (summed race = 1 and G2 = no and G3_05 = yes), (b) White Hispanic (summed race = 1 and G2 = yes and G3_05 = yes), (c) Black non-Hispanic (summed race = 1 and G2 = no and G3_03 = yes), (d) Black Hispanic (summed race = 1 and G2 = yes and G3_03 = yes), (e) Asian American or Pacific Islander (AAPI) (either summed race > 1 and G2 = yes or summed race = 1 and G3_01 = yes or G3_02 = yes or G2 = yes and missing on all G3 variables), and (f) missing-race non-Hispanic (G2 = no and missing on all G3 variables).
Data Analyses
Due to the categorical nature of the observed variables, we employed item factor analysis (IFA; Wirth & Edwards, 2007). Next, we leveraged multiple-group IFA to investigate measurement equivalence/invariance (ME/I) of the newly created transition-planning construct on the basis of disability type and race-ethnicity as well as the intersection of these student characteristics. All IFA models were fitted in Mplus Version 8.4 (Muthen & Muthen, 2019) and were identified by fixing the latent mean(s) and variance(s) to be 0 and 1, respectively. Because variables are categorical in nature, the weighted-least-mean and variance-adjusted estimator was used along with theta parameterization. Missingness across the selected variables ranged approximately from 18% (L2a) to 1% (L1); therefore, we elected to treat missing data via full-information maximum likelihood in which the recovery of missing data and parameter estimation occur simultaneously. Prior to fitting the IFA models, all data preprocessing was conducted in the R environment (v4.1.1; R Core Team, 2021); additionally, we used the semTools (Jorgensen et al., 2021) and lavaan (Rosseel, 2012) R packages to generate Mplus syntax files that are in accordance with Wu and Estabrook (2016) approach for testing measurement invariance. Moreover, we conducted a Monte Carlo power simulation to determine the minimum group size required for examining measurement invariance of the transition-planning and economic-hardship constructs. After consulting parameter recovery and coverage, we were able to determine a minimum group size of 250. Therefore, prior to investigating ME/I, we retained groups that met this sample size requirement. Details about our planned data analyses that were formed prior to viewing the data, the power simulation, and all data preprocessing and software code to produce the variables are available in the preregistration on OSF: https://osf.io/g5wkb/.
Results
Prior to investigating our first research question, we conducted a series of preliminary analyses to determine if all identified transition-planning items were suitable for IFA models. With respect to the binary items, parent and youth attendance had the highest rates of endorsement, with expected values of .867 and .779, respectively; whereas expected values for whether the youth met with an adult and whether adults met with teachers were slightly lower, at .648 and .583, respectively. The bivariate correlations among variables about the IEP meeting itself possessed the strongest associations, ranging from .800 to .859; whereas the remaining associations were weaker, with the exception of the relationship between whether the youth's interests were discussed at the IEP meeting and whether the parent met with teachers (r = .804). Item-total correlations ranged from .284 to .849; however, due to item skip logic and varying number of response levels, we decided to proceed with all variables to examine the structure of transition planning.
Research Question 1
To test our hypothesis that the transition-planning construct would be unidimensional, we fit an IFA using the full sample available of youth on IEPs (N = 4,140). Our initial model did not converge due to youth's interest (E6c) being flagged as problematic; therefore, because the flagged item stemmed from a set of items about the IEP meeting, we fitted a two-factor model in which information about the IEP meeting would serve as a separate but related construct. Although the two-factor model converged, its solution was inadmissible; namely, the latent correlation was estimated to be 1.061 (SE = 0.015), making this an out-of-bounds estimate, suggesting a single-factor model is more appropriate.
Next, a unidimensional model was fitted that omitted the problematic parent-report item, youth's interest (E6c). The fitted model, χ2 df :20 = 133.883, p < .001, was found to provide acceptable data-model fit when examining the approximate fit indices: The comparative fit index (CFI) and Tucker-Lewis index (TLI) were .987 and .982, respectively; and the root mean square error of approximation (RMSEA) and standardized root mean squared residual (SRMR) were .037 and .082, respectively. However, the standardized factor loading for goal origin (E4) fell below our prespecified threshold at .226; therefore, we omitted this additional parent-report item and fitted a subsequent model. This revised model resulted in standardized factor loadings that were greater than .30 for all indicators and provided marginally better data-model fit, χ2 df :14 = 122.948, p < .001. When examining the modification indices, we found that a sizable expected parameter change of 86.198 resulted for the residual covariance between parent- and youth-attendance items; seeing as 86.198 is much greater than its respective critical value (3.84 on 1 df with an alpha of .05), we fitted a final model that included this modification.
Explication of Transition Planning
By modeling the unexplained covariance between parent and youth attendance (r = .657, SE = .073), data-model fit greatly improved, χ2 df :13 = 39.678, p < .001; the CFI and TLI were estimated to be .997 and .995, respectively; and the RMSEA and SRMR were estimated to be .022 and .035, respectively. With respect to standardized factor loadings, important indicators were E2, “Parent met with teachers to discuss goals” (estimate (Est) = .923, SE = .073); E6d, “Staff from a community service agency attended the transition-planning meeting” (Est = .942, SE = .011); and E6e, “Youth got information on life after high school at transition-planning meeting” (Est = .942, SE = .978). All thresholds were estimated to be significantly different from zero.
Research Question 2
After completing the IFA model for transition planning, we revisited our minimum group size decision rules that were informed by the aforementioned power simulation. We confirmed transition planning with seven indicators; however, our a priori power simulation (see preregistration) was based on 11 indicators. After a closer examination of the factor loadings of the remaining seven items and calculating construct reliability (Gagne & Hancock, 2006), we determined that the group size threshold can be lowered to 150.
By Disability
We examined ME/I across nine disability categories: autism (n = 450), emotional disturbance (n = 470), ID (n = 640), multiple disabilities (n = 550), other health impairment (n = 480), orthopedic impairment (n = 200), sensory impairment (n = 340), specific learning disability (n = 570), and speech-language impairment (n = 200).2 As an initial step, we fitted the form invariant model in which the same pattern of fixed and free parameters was specified for all nine groups, χ2 df :117 = 388.903, p < .001, thus serving as the baseline model for evaluating equivalent thresholds for youth's role in IEP meeting. When specifying all other items as before, we failed to find a tenable constraint on the thresholds of youth's role in IEP meeting: all four thresholds, Δχ2Δdf:16 = 95.148, p < .001, or three thresholds with the closest being when the last three thresholds were constrained, Δχ2Δdf:8 = 21.904, p = .005. See Table 2 for the model-implied expected proportions by disability category for youth's role in IEP meeting.
Comparison of Youth's Role in IEP Meeting Across Disability Categories.
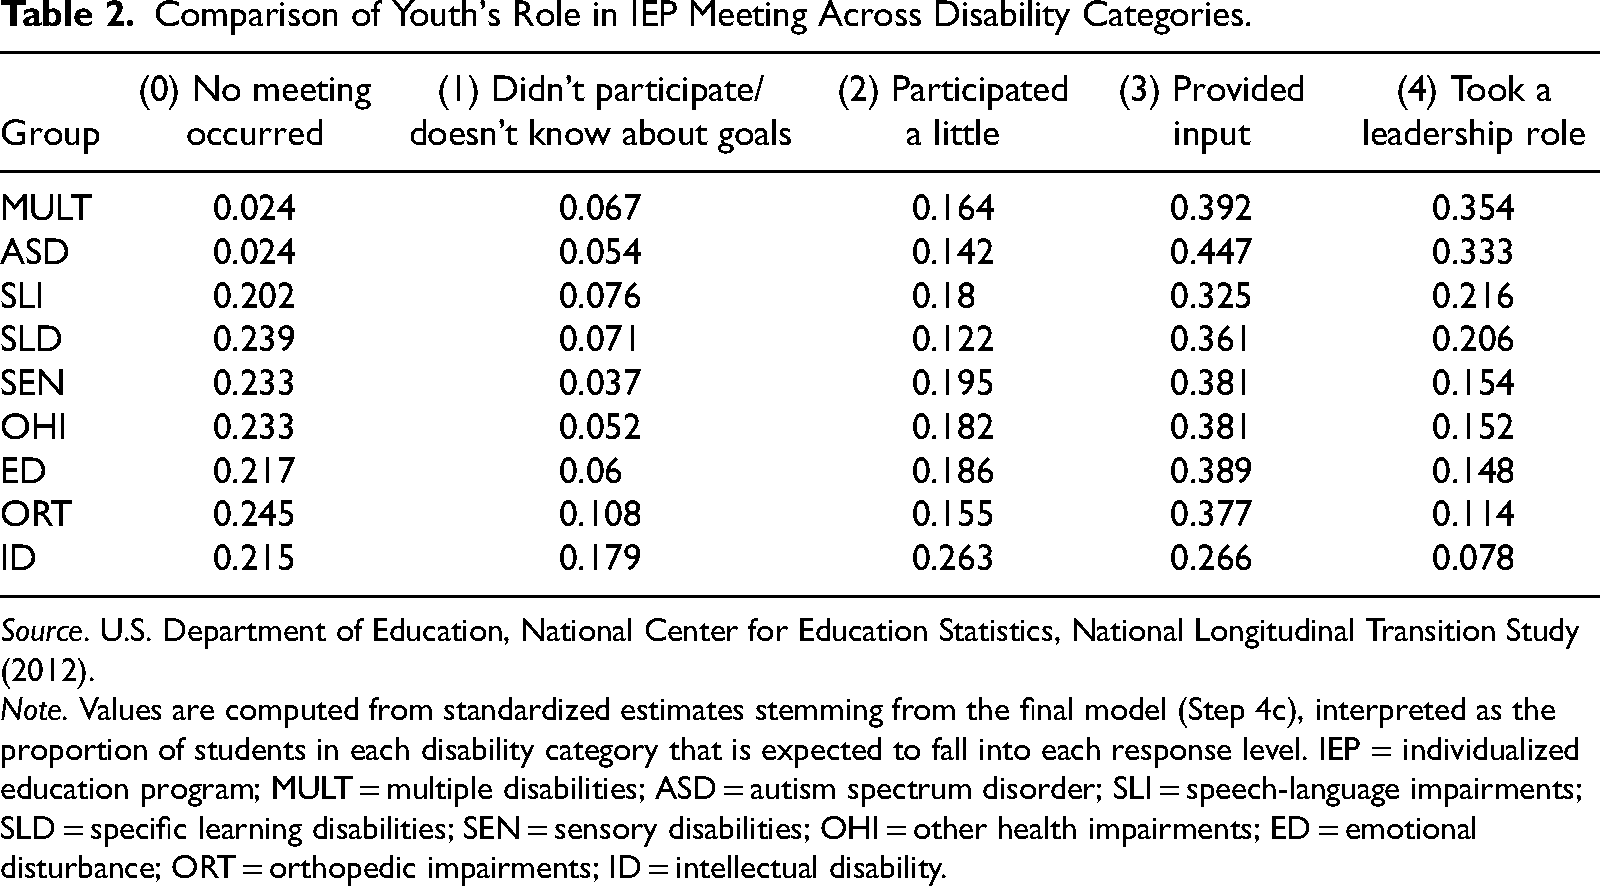
Source. U.S. Department of Education, National Center for Education Statistics, National Longitudinal Transition Study (2012).
Note. Values are computed from standardized estimates stemming from the final model (Step 4c), interpreted as the proportion of students in each disability category that is expected to fall into each response level. IEP = individualized education program; MULT = multiple disabilities; ASD = autism spectrum disorder; SLI = speech-language impairments; SLD = specific learning disabilities; SEN = sensory disabilities; OHI = other health impairments; ED = emotional disturbance; ORT = orthopedic impairments; ID = intellectual disability.
Because the remaining six indicators possessed either one or two thresholds, we estimated an updated baseline model in which constraints were placed on all thresholds, except youth's role in IEP meeting, across groups as it is not possible to test nonequivalence of their thresholds (Wu & Estabrook, 2016). Using this updated baseline model, χ2 df :117 = 401.430, p < .001, we proceeded to examine strong invariance by constraining all factor loadings and intercepts to be the same across groups for all indicators except youth's role; these constraints were found to be untenable, Δχ2Δdf:48 = 110.028, p < .001. Therefore, we fit partial invariant models in an independent fashion and established a suitable model that included factor loadings constrained to be the same across groups for “Youth attended IEP meeting,” “Youth met with adults at school,” and “Youth got information” while freely estimating the intercept for “Youth got information,” Δχ2Δdf:8: 9.996, p = .265. Having established a partial strong invariance model, we proceeded to test for residual invariance and determined the only constraint feasible was for “Youth got information,” Δχ2Δdf:8: 4.419, p = .817. Afterward, we attempted to examine whether the latent variance or latent mean could be constrained to be the same across groups; however, this exercise did not result in a more parsimonious model that was tenable. To view all ME/I modeling details on the basis of disability category, see Table S1 in the supplemental materials.
By Race/Ethnicity
When evaluating groups relative to our sample size requirement of 150, we determined five groups could be used to evaluate ME/I on the basis of race/ethnicity: White non-Hispanic (n = 2,120; reference group), Black non-Hispanic (n = 820), other/multiple/missing non-Hispanic (n = 350), White Hispanic (n = 560), and other/multiple/missing Hispanic (n = 330).3 As with ME/I on the basis of disability category, we fitted a configural model across the five groups, χ2 df :65 = 129.724, p < .001. Afterward, we found the constraints on the thresholds for youth's role in the IEP meeting across groups were tenable, Δχ2Δdf:8 = 11.279, p = .186. Having established equivalent thresholds for the 5-point ordinal indicator, we proceeded to fit a new baseline model to test for equivalent factor loadings across race/ethnicity groups in which the thresholds for the two 3-point ordinal indicators were constrained across groups, χ2 df :73 = 133.194, p < .001. From this updated baseline model, we established equivalent factor loadings across race-ethnicity groups, Δχ2Δdf:8 = 4.981, p = .759, and subsequently established equivalent intercepts for all three-level and five-level ordinal variables. Afterward, we proceeded to model strong invariance for all binary indicators to assess their functioning across groups. Constraints on all four binary indicators were not tenable, Δχ2Δdf:16 = 38.361, p = .001; however, a partial strong invariant model was determined feasible in which constraints were placed on “Youth attended IEP meeting” and “Parent met with teachers,” Δχ2Δdf:8 = 9.698, p = .287. See Table 3 for comparison of noninvariant invariant items and their parameter estimates by race-ethnicity groups.
Comparison of Noninvariant Parameters Across Race-Ethnicity Groups.
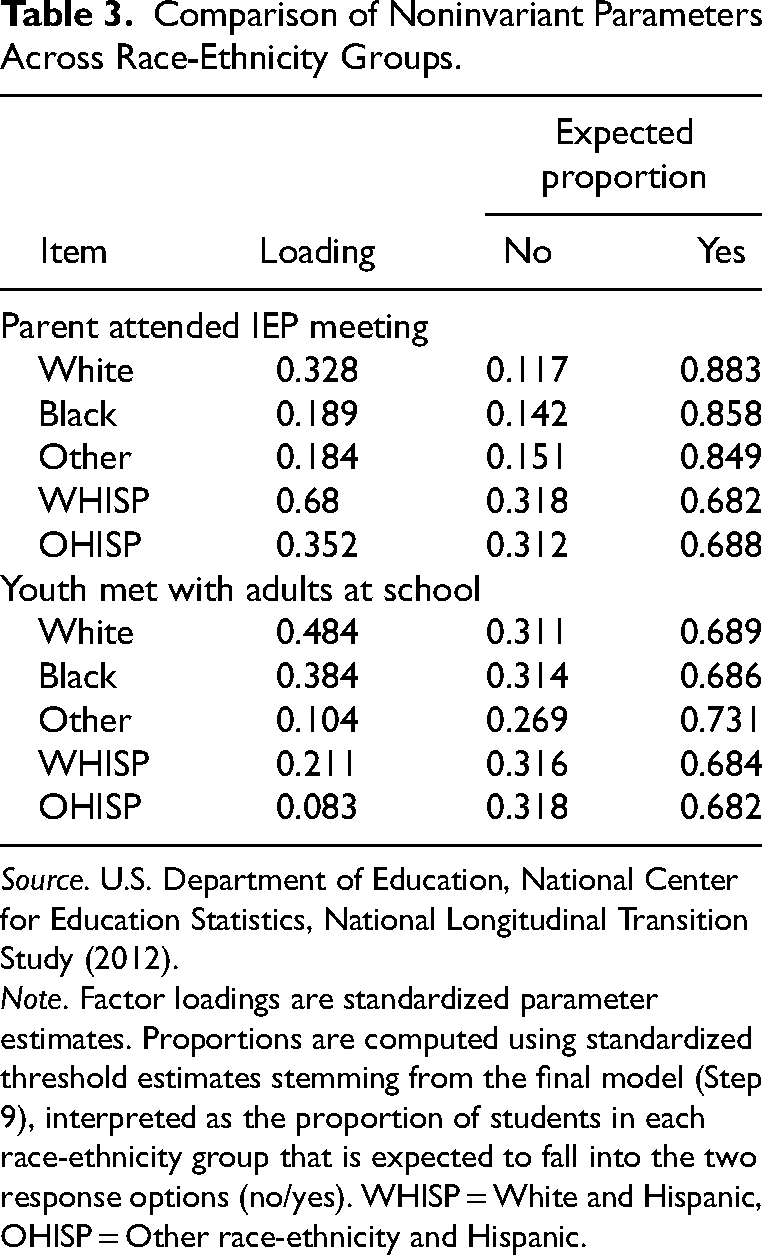
Source. U.S. Department of Education, National Center for Education Statistics, National Longitudinal Transition Study (2012).
Note. Factor loadings are standardized parameter estimates. Proportions are computed using standardized threshold estimates stemming from the final model (Step 9), interpreted as the proportion of students in each race-ethnicity group that is expected to fall into the two response options (no/yes). WHISP = White and Hispanic, OHISP = Other race-ethnicity and Hispanic.
Finally, we determined that constraints were tenable on the residuals, Δχ2Δdf:20 = 28.010, p = .109, as well as the correlated residual between parent and youth IEP meeting attendance, Δχ2Δdf:4 = 6.327, p = .176. Next, we determined that the latent variance could not be constrained across all race/ethnicity groups, Δχ2Δdf:4 = 10.586, p = .032; however, we found that freely estimating the latent variance for the Black non-Hispanic group produced a nonsignificant DIFFTEST, Δχ2Δdf:3 = 2.886, p = .409. Finally, we determined that all latent means could be constrained to be the same, Δχ2Δdf:4 = 8.619, p = .071. To view all ME/I modeling details on the basis of race/ethnicity, see Table S2 in the supplemental materials.
Disability by Race/Ethnicity
When crossing disability with race/ethnicity, we determined eight groups met the minimum threshold of 150: White youth with autism (n = 300; reference group), White youth with emotional disturbance (n = 230), White youth with ID (n = 300), White youth with multiple disabilities (n = 290), White youth with other health impairment (n = 250), White youth with sensory impairments (n = 170), White youth with specific learning disability (n = 250), and Black youth with ID (n = 160).4 Notably, only one non-White group was feasible after applying our group size rules based on the power simulation that was conducted as part of the study preregistration.
As before, we initially fit a configural model, χ2 df :104 = 359.010, p < .001, that imposed the same pattern of fixed and free parameters across all eight groups, allowing us to test for equivalent thresholds for youth's role in IEP meeting. We found that it was untenable to impose constraints on all four thresholds, Δχ2Δdf:14 = 77.686, p < .001; however, it was tenable to impose constraints on the first three thresholds across groups, Δχ2Δdf:7 = 11.007, p = .138, allowing us to freely estimate its intercept and residual. Next, we fitted a model that constrained the thresholds for the three-level ordinal variables to serve as a basis for examining whether the factor loadings of the nonbinary indicators, χ2 df :111 = 373.017, p < .001. Upon constraining the factor loadings for the three ordinal indicators, we found this constraint untenable, Δχ2Δdf:14 = 88.653, p < .001; therefore, in a serial fashion, we attempted to release one constraint at a time to determine if a combination of two constraints was tenable. No such combination was found to be tenable, with the closest being when the factor loading for youth's role in IEP meeting was freely estimated across groups, Δχ2Δdf:7 = 15.761, p = .027. Therefore, we fitted a model that added constraints on thresholds for all binary indicators, constrained all factor loadings to be the same across groups except for youth's role in IEP meeting, and constraints on intercepts for all items except for youth's role in IEP meeting to be the same across all groups. These constraints were found to be tenable, Δχ2Δdf:42 = 46.910, p = .278, thus establishing partial strong invariance.
Next, we evaluated whether indicator residuals could be constrained to be the same with the exception of youth's role in IEP meeting and determined this was not tenable, Δχ2Δdf:42 = 71.398, p = .003. Afterward, we fitted a partial residual invariant model and determined it was necessary to freely estimate the residuals for the following indicators: information, community agency, and parent attendance at IEP meeting, Δχ2Δdf:21 = 29.892, p = .094.
Next, we constrained all latent variances to be the same across groups and determined these constraints were tenable, Δχ2Δdf:7 = 11.321, p = .125. In a similar fashion, we found the latent means were not equivalent, Δχ2Δdf:7 = 19.706, p = .006; therefore, we freed the latent mean for the groups White youth with ID (.304, SE = .110) and Black youth with ID (.252, SE = .127), Δχ2Δdf:5 = 7.274, p = .201. As such, the majority of the model parameters could be constrained across the disability-by-race groups with the notable exception being the parameters related to youth's role in the IEP meeting, thus confirming our findings from Research Question 2 that youth's role in the IEP meeting differs across disability categories. To view all ME/I modeling details on the basis of the intersection between disability category and race/ethnicity, see Table S3 in the supplemental materials.
Research Question 3
As a starting point, we fitted the unidimensional construct of economic hardship using the entire sample available in the study, χ2 df :9 = 82.633, p < .001. When consulting the approximate fit indices, the data-model fit was determined to be acceptable: The CFI and TLI were estimated to be .943 and .905, respectively; and the RMSEA and SRMR were estimated to be .044 and .066, respectively. All standardized factor loadings were greater than .52, with the strongest being .96 for household income; the employment and enrollment-in-social-program indicators had factor loadings of .77 and .74, respectively; and the remaining indicator factor loadings ranged from .52 to .59.
Having completed this initial step, we proceeded to evaluate coverage of the economic-hardship indicators across the groups of interest: disability category, race-ethnicity, and the intersection of disability and race-ethnicity. We observed acceptable coverage for all disability groups and race/ethnicity groups. However, data were sparse for two groups: White youth with sensory impairments (n = 170) and Black youth with ID (n = 160). Among the White youth with sensory impairments, there were no instances of youth who received all three of the government-assisted social benefits (SNAP, TANF, SSI), and for the Black youth with ID, there were no instances of the highest income group. Due to this lack of coverage on the two economic hardship items, we decided not to carry out ME/I of the economic-hardship construct using the sample (N = 4,140) for the current study.
Research Question 4
To address Research Question 4 and test Hypothesis 4, we modeled the transition-planning and economic-hardship constructs simultaneously using the entire study sample (N = 4,140) to estimate their latent correlation. This fitted model, χ2 df :9 = 82.633, p < .001, was found to provide acceptable data-model fit, with CFI and TLI estimated to be .990 and .987, respectively; and the RMSEA and SRMR were estimated to be .017 and .074, respectively. In terms of factor loadings, the resulting standardized estimates for both transition planning and economic hardship were similar to before: Research Question 1 and Research Question 3, respectively. Our hypothesis regarding the association between the two constructs was disconfirmed; specifically, the latent correlation was estimated to be −0.014 (SE = 0.047) and was not significantly different from zero. Having a sufficiently large sample to estimate this parameter, we interpret this finding to mean that these constructs do not covary with one another; rather, they are orthogonal. Having come to this conclusion, we opted to forego addressing ME/I for this unrestricted IFA model.
Discussion
IEP meeting participation is an established evidence-based practice with positive impacts on postschool outcomes for youth with disabilities (e.g., Burnes et al., 2018; Martin et al., 2006; Newman, 2004; Wagner et al., 2012; Wehmeyer & Palmer, 2003; Wehmeyer & Schwartz, 1997). In this study, we used selected youth- and parent-reported items from the NLTS2012 that measure IEP meeting participation to conduct an in-depth examination and to better understand differences according to student characteristics based on not only disability but also race, ethnicity, and socioeconomic status. Throughout, we closely followed the quality indicators for preregistering secondary data analyses studies (Lombardi et al., 2023) in order to illustrate the practical application of this approach and promote openness and transparency (Nosek et al., 2018). Our goal was to establish a holistic measure of the transition-planning process that is facilitated by the IEP meeting based on diverse intersectional student characteristics.
Establishing the transition planning construct and conducting measurement invariance revealed interesting response patterns of the youth- and parent-reported items. First, we successfully confirmed a unidimensional construct, which is contrary to Johnson, Wu, et al.'s (2020) findings of a four-factor model. To improve model fit, we removed two problematic parent-report items (E6c and E4) that were included in previous studies (Davenport et al., 2022; Johnson, Thurlow, et al., 2020; Trainor et al., 2019; Wu et al., 2023). Moreover, we did not include parent-report items that were included in other studies related to transition planning: E6a (Davenport et al., 2022; Johnson, Wu, et al., 2020) and E6b (Davenport et al., 2022; Johnson, Thurlow, et al., 2020; Johnson, Wu, et al., 2020; Wu et al., 2023), which measure parent and youth invitation to the IEP meeting.
When we focused solely on disability category, we found it was tenable to model strict invariance for “Youth met with adults” and “Youth attended IEP meeting.” It was tenable to constrain the thresholds for community agency being at the IEP meeting and information given to the youth at the IEP meeting; with respect to the latter, we found that the factor loading could be constrained and thus this indicator was equally important regardless of disability category. On the other hand, we concluded that its intercept could not be constrained to be the same across groups, meaning that depending on the disability category, a shift in in thresholds is necessary. For the variables regarding a parent meeting with teachers and attending the IEP meeting, we were able to constrain their thresholds to be equivalent across disability categories; however, constraints on their factor loadings and intercepts were untenable, suggesting that the importance of these indicators varied across groups and that the thresholds required a shift depending on disability category. Finally, youth's role in the IEP meeting (the only variable for which it was possible to test equivalent thresholds) was found to function very differently across disability categories. Echoing these results, previous studies noted differences in IEP participation based on disability (Davenport et al., 2022; Johnson et al., 2022). As Davenport et al. (2022) suggested, we intentionally did not group students with high-incidence disabilities together in order to better understand the differences by category. These findings suggest that decisions about the extent to which the youth will be involved in the IEP meeting is dependent on disability.
When we focused solely on race and ethnicity groupings, we found nearly all latent variance could be constrained to 1.0, with the exception being for the Black non-Hispanic group (Est = .641, SE = .085). All latent means could be constrained to 0, meaning no latent mean differences, but the Black non-Hispanic group had less variability around the mean. Only the variables parent attendance and youth meeting with adults did not possess strong invariance. Previous studies examined transition-planning differences based on student race and ethnicity; however, their groupings were more limited, with only non-Black, Black, Hispanic, and multiracial (Johnson, Wu, et al., 2020). We examined six different race and ethnicity groupings, allowing for a better understanding of intersectionality, specifically with White non-Hispanic, White Hispanic, Black non-Hispanic, and Black Hispanic groups. Overall, when we examined the functionality of the transition-planning construct by race and ethnicity, we found it functioned similarly enough across these groups—a very different finding from when the sample was grouped by disability category.
Finally, we examined ME/I of transition planning based on the intersection of disability and race/ethnicity. First, we followed our a priori decision rules that were established on the basis of the power simulation completed in the preregistration for group sizes, which limited our investigation to mostly White students. In fact, only one group that represented youth of color was retained with the minimum group size of 150, which was Black youth with ID. On the basis of these groupings and limitations with establishing ME/I based on disability, we determined it is only appropriate to compare transition-planning construct scores for White and Black youth with ID. Moreover, we were able to constrain youth's role in IEP meeting across groups with the exception of the fourth thresholds; therefore, the expected proportions of youth providing input and taking a leadership role differed across disability and race/ethnicity groups.
In the study sample, there was no significant covariation between transition planning and economic hardship, which disconfirmed our hypothesis that was based on previous findings that showed differences in economic hardship based on disability category (Lombardi, Wu, et al., 2022b; Murray et al., 2015). Given that we preregistered this study, we opted to forego entering economic hardship in any other manner (e.g., using household income as a sole indicator to further intersect student characteristics). Importantly, there is no meaningful relationship between transition planning and economic hardship.
Limitations
As we reported, our final study sample size was inadequate when grouping disability by race and ethnicity. Although the analytic sample appeared large (N = 4,140), grouping by multiple intersectional characteristics revealed the limitations of a thorough examination of transition planning. This limitation affected youth of color in particular, as only one of eight intersectional groups was non-White (Black youth with ID) and was retained after applying our group size decision rule of 150. This limitation in sample diversity prevented us from carrying out a deeper investigation of intersectional student characteristics that we had intended in the preregistration.
Implications for Future Research and Practice
Our findings show that decisions about participation in the IEP meeting are dependent on disability category. This suggests educators and families may rely too much on category to determine whether or not the youth is capable of actively participating in the meeting. This finding is especially troubling because IEP meeting participation is an evidence-based practice that has positive impacts on postschool outcomes for youth with disabilities (e.g., Burnes et al., 2018; Martin et al., 2006; Newman, 2004; Wagner et al., 2012; Wehmeyer & Palmer, 2003; Wehmeyer & Schwartz, 1997). Notably, examples of evidence-based practices include a full curriculum dedicated to preparing youth to lead the meeting, the Self-Directed IEP (Arndt et al., 2006), as well as a curriculum dedicated to teaching self-determination skills, the Self-Determination Learning Model of Instruction (Shogren et al., 2020). Moreover, the National Technical Assistance Center for Transition: The Collaborative is dedicated to dissemination of evidence-based practices in secondary transition and maintains extensive online resources (https://transitionta.org/). Given these established products, lack of youth involvement clearly cannot be attributed to a lack of resources and evidence-based practices.
Given the plentiful resources available, our findings bring up further questions regarding how decisions about meeting participation are made, by whom, and why. A deeper investigation of the systemic barriers educators face in involving youth in the IEP meeting is warranted. Potentially, the problem may be due to lack of awareness of and exposure to evidence-based practices that could be traced back to teacher preservice programs and in-service opportunities for current teachers. Transition content remains a specialty set within the Council for Exceptional Children's standards. Furthermore, transition courses are more often than not electives rather than required in comprehensive K-12 special educator preparation programs. Inadequate exposure to transition content remains a persistent systemic barrier in teacher training, which in turn adversely affects the quality of support that educators provide to youth with disabilities in their preparation for college and careers.
Supplemental Material
sj-docx-1-ecx-10.1177_00144029231184568 - Supplemental material for An Intersectional Examination of Economic Hardship and Individualized Education Program Meeting Participation
Supplemental material, sj-docx-1-ecx-10.1177_00144029231184568 for An Intersectional Examination of Economic Hardship and Individualized Education Program Meeting Participation by Allison R. Lombardi, Graham G. Rifenbark and Ashley Taconet in Exceptional Children
Footnotes
Authors’ Note
This work was supported by the Institute of Education Sciences (Grant No. R324A210245).
Supplemental Material
The supplemental material is available in the online version of the article.
Notes
Open-Science Badges
For preregistering their research plan and for publishing their materials, Lombardi et al. received badges for preregistration, open materials. The public content may be retrieved from https://osf.io/y3abz and ![]() .
.
Manuscript received March 2023; accepted June 2023.
References
Supplementary Material
Please find the following supplemental material available below.
For Open Access articles published under a Creative Commons License, all supplemental material carries the same license as the article it is associated with.
For non-Open Access articles published, all supplemental material carries a non-exclusive license, and permission requests for re-use of supplemental material or any part of supplemental material shall be sent directly to the copyright owner as specified in the copyright notice associated with the article.