
Abstract
We used pupil-level data from the National Pupil Database in England to conduct a longitudinal analysis of the identification of moderate learning difficulties (MLD) and social, emotional, and mental health difficulties (SEMH) among 550,000 pupils ages 5 to 11 years. Survival analysis was used to determine the hazard ratios (HRs) for time to first identification, controlling for prior attainment and social-emotional development at age 5 as well as socioeconomic variables. For MLD, the overrepresentation of Black Caribbean and Pakistani pupils compared with White British pupils was eliminated following age 5 controls, and the predominant picture was of ethnic-minority underrepresentation. For SEMH, Black Caribbean and mixed White and Black Caribbean (MWBC) pupils continued to be overrepresented even after age 5 controls (HR = 1.36 and 1.44, respectively), although this was not true for the larger group of Black African pupils, who were underrepresented in the adjusted analyses (HR = 0.62), as were most other ethnic-minority groups. The results indicate most ethnic-minority groups are underrepresented for special educational needs after adjusting for pupil characteristics on entry to school, though this varies by ethnic group and type of need.
The results indicate most ethnic-minority groups are underrepresented for special educational needs after adjusting for pupil characteristics on entry to school, though this varies by ethnic group and type of need.
For over 40 years, there has been concern over the process of special education referral and the differential representation of ethnic-minority groups among pupils identified with special educational needs (SEN). There is substantial evidence from the United States for ethnic disproportionality with respect to students with special needs (Artiles et al., 2010; Coutinho et al., 2002; Donovan & Cross, 2002; Dunn, 1968; Skiba et al., 2008). The most recent national data (U.S. Department of Education [DOE], 2018, p. 49) reports that Black students—relative to the combined data for all other ethnic groups—are 2.2 times more likely to be identified with intellectual disabilities (ID), 2.0 times more likely to be identified with emotional disturbance, and 1.5 times more likely to be identified with specific learning disabilities (SLD). Similarly, in England, there is both historical (Coard, 1971) and more recent large-scale quantitative (Strand & Lindsay, 2009) evidence indicating ethnic disproportionality in the identification of SEN. The aim of this article is to explore the phenomenon in England, using national administrative data to track longitudinally a national cohort of 550,000 pupils from age 5 to age 11.
Ethnic Minorities in England: Patterns of Migration and Educational Outcomes
England is an ethnically diverse nation, with the most recent school census indicating one third of pupils in state-funded schools are from ethnic groups other than White British, with 12% Asian, 7% White other, 6% Black, 6% mixed heritage, and 2% any other ethnic group (Department for Education [DFE], 2018c). Some of the main ethnic groups are long established in England, reflecting historical links with Empire and the Commonwealth. At the end of the Second World War, there were significant labor shortages in Britain, and the government actively sought immigrant workers. The 1950s and 1960s saw workers from the Caribbean, India, and Pakistan arriving in large numbers, many of whom worked in public transport, the textile industries, manufacturing, car production, and food processing. In addition, there was a stream of migrants from East Pakistan (now Bangladesh), many of whom had formerly been rural agricultural workers (BBC, 2002). Migration of Black Africans to England started later, beginning in the 1990s and peaking in the mid-2000s. Many migrants during this period were seeking asylum from conflict or political repression, though the rapid growth of the U.K. economy also created substantial demand for skilled workers. Most recently, the expansion of the European Union in 2004 and the free movement of labor has seen increased migration from central and eastern Europe, with the proportion of the school population recorded as belonging to White other groups doubling between 2003 and 2013 (Strand, 2015).
Regarding educational outcomes at age 16, there has long been a concern with the low achievement of Black Caribbean pupils in particular, with a government committee of inquiry into the achievement of ethnic-minority pupils in 1985 concluding that Black Caribbean children as a group “are underachieving in our education system” (Department for Education and Science [DES], 1985, p. 3). Analysis in the 1990s revealed that Bangladeshi and Pakistani pupils also achieved less well than White British pupils but that Caribbean pupils were the lowest-scoring group (Gillborn & Gipps, 1996). A recent analysis of trends from 1991 to 2013 (Strand, 2015) indicates that educational attainment for ethnic minorities is improving, with Indian and Chinese young people substantially outperforming White British pupils, Bangladeshi and Black African young people achieving at or above the White British average, and Black Caribbean and Pakistani young people showing clear gains in the past decade. Nevertheless, Black Caribbean and mixed White and Black Caribbean (MWBC) pupils continue to be the lowest-achieving ethnic groups at age 16 and are also the only groups to underachieve relative to White British pupils after controlling for socioeconomic status (SES; Strand, 2014). Compared with White British pupils, they are also twice as likely to be excluded from school even after controlling for covariates (Strand & Fletcher, 2014); over twice as likely to be unemployed, particularly in the 16-to-24 age group (U.K. Government, 2019); as likely to attend university overall but only half as likely to attend the top third most selective universities (Crawford & Greaves, 2015); and 3 times more likely to be arrested (U.K. Government Race Disparity Unit, 2019). Further information can be found in Office for National Statistics data on population and migration (www.ons.gov.uk) and the government ethnicity facts and figures website (www.ethnicity-facts-figures.service.gov.uk).
The SEN System in England
The definition of SEN in England is contained in the Special Educational Needs and Disability Code of Practice: 0 to 25 Years (hereafter, SEND Code of Practice; DFE, 2015b). In the English system, “a pupil has SEN where their difficulty or disability calls for special educational provision, namely provision different from or additional to that normally available to pupils of the same age” and a child has a learning difficulty or disability if he or she has a significantly greater difficulty in learning than the majority of others of the same age, or has a disability which prevents or hinders him or her from making use of educational facilities of a kind generally provided for others of the same age in mainstream schools. (DFE, 2015b, p. 15)
The first definition is norm-referenced to the achievements of other children more generally, but the second definition is relative to “the facilities normally available.” A pupil can have SEN, for example, for social, emotional, or mental health difficulties (SEMH), at any level of academic achievement.
There are currently two levels of intensity of identified SEN. It is intended that the majority of pupils with SEN will have their needs met through mainstream education from within school resources. This level, called SEN support, accounts for around 81% of all pupils with identified SEN (13% of the total school population). At a higher level, around 19% of pupils with SEN (around 3% of all pupils ages 5 to 16 in England) have a formal education and health care plan. This means a legal document is in place that sets out the child’s needs and the extra help they should receive, and these are resourced by the local authority, whether in mainstream school or in specialist provision. Both groups of pupils receive provision that is “additional to or different from that made generally for others of the same age, and which goes beyond the differentiated approaches and learning arrangements normally provided as part of high quality, personalized teaching” (DFE, 2015b, p. 94). We therefore combine these two groups in our analyses.
Schools record the type of SEN in 12 categories, as fully described in DFE (2015b). Some pupils have more than one type of difficulty, and teachers are therefore asked to record the pupil’s greatest or primary need and, if appropriate, their secondary need. Although we recognize that needs are not restricted to a single domain, for reasons of comparability, we focus on the primary need, and indeed the vast majority of pupils with SEN (78%) have no secondary need recorded. The two most frequent types of SEN are moderate learning difficulties (MLD) and SEMH, accounting for 4.0% and 2.8%, respectively, of all pupils ages 5 to 16 in 2016 (see Strand & Lindorff, 2018, p. 33). Together, these two types include nearly half (43%) of all pupils with identified SEN. The definition of these categories is limited to one-and-a-half pages in the SEND Code of Practice (DFE, 2015b, pp. 97–98). MLD means pupils “may learn at a slower pace than their peers, even with appropriate differentiation” (DFE, 2015b, p. 97), whereas SEMH difficulties “may include becoming withdrawn or isolated, as well as displaying challenging, disruptive or disturbing behavior. These behaviors may reflect underlying health difficulties . . . [or] disorders such as attention deficit disorder, ADHD [attention deficit hyperactivity disorder] or attachment disorder” (DFE, 2015b, p. 98). 1
Ethnic Disproportionality in the Identification of SEN in England
A national study by the DES (1972) indicated that Black Caribbean students represented 1.1% of the school population in England but 4.9% of the pupils in special schools for pupils with MLD. In a highly influential pamphlet, Coard (1971) argued that many of these Black Caribbean pupils were wrongly placed in MLD schools because of biases in IQ testing, low teacher expectations, and cultural and linguistic differences, leading teachers to misinterpret their “emotional disturbance” as evidence of learning difficulties. The Warnock report (DES, 1978) removed the requirement for children to be identified in categories of disability before they were eligible for special education services. Although this put the focus firmly on the unique educational needs of each child rather than labels, it hindered the collection and analysis of evidence on disproportionality for different types of SEN. Subsequent research focused on the disproportionate representation of Black Caribbean pupils in special schools or settings. For example, Bagley (1982) analyzed data from the National Child Development Study and identified that Black students were 6 times more likely to be in special schools than White students, and Cooper et al. (1991) reported that Black boys were 4 times more likely to be in schools for pupils with emotional and behavioral difficulties than expected based on their proportion in the population.
An opportunity to reestablish a national picture on disproportionality in SEN came with the reintroduction by the DFE of 12 categories of SEN in the national school census from January 2005. Strand and Lindsay (2009) reported a detailed analysis of these data for over 6.4 million pupils ages 5 to 16 years in all maintained schools in England. The most frequent types of SEN were MLD and SEMH, 2 together accounting for nearly half of all identified SEN. The analysis revealed that the odds of Black Caribbean and Pakistani pupils being identified with MLD were, respectively, 1.32 and 1.46 times higher than the odds for White British pupils; and the odds of Black Caribbean and MWBC pupils being identified with SEMH were 2.3 and 2.0 times higher, respectively, than the odds for White British pupils. In contrast, most other ethnic-minority groups, including Black African, Indian, Bangladeshi, and Chinese pupils, were substantially underrepresented relative to White British pupils for both MLD and SEMH. In summary, the results for Black Caribbean pupils in England seem to mirror those for African American pupils in the United States, and indeed, similarities in the experiences of the two groups have been noted before (e.g., Chapman & Bhopal, 2019). Nevertheless, there are substantial differences in the two national contexts, and we should be cautious about any simple comparison.
Explanations of Ethnic Disproportionality
Some forms of SEN have a clear biological basis, for example, sensory impairments, physical disabilities, or profound and multiple learning difficulties. These categories are often contrasted with more judgmental categories, like MLD and SEMH, which are socially constructed in the sense that pupils’ behavior is defined in terms of their actions within a context, mainly the school and classroom, and interpreted against expected patterns or norms of behavior for that context, as evidenced in the definitions of SEN described earlier. Although this is a relative, not absolute, distinction, it is one that is widely made (e.g., Artiles et al., 2010, p. 281; Donovan & Cross, 2002, p. 55; Strand & Lindsay, 2009, p. 185). “Judgmental” categories are not the only SEN evidencing disproportionality, but they are those where the disproportionate identification of Black pupils is greatest (Skiba et al., 2008, p. 269). Consequentially a frequent explanation forwarded for the overrepresentation of Black pupils with SEN is the long history of ethnic stratification within education. In the United States, researchers have argued that disproportionality reflects inappropriate interpretation of ethnic and cultural differences, including teacher racism, low expectations, and a failure of schools to provide quality instruction or effective classroom management (e.g., Artiles et al., 2010; Coutinho et al., 2002; Skiba et al., 2008; Waitoller et al., 2010).
Risk of identification of SEN is associated with other demographic factors. Boys often have a raised risk of identification relative to girls. For example, Strand and Lindsay (2009) report the odds for boys of identification for MLD are 1.8 times higher; for any SEN, 2.5 times higher; and for SEMH, 4.2 times higher, relative to girls. Equally, pupils in a year group vary in age by up to 12 months, and this is an important consideration where there are strong age-related developmental effects. Thus, older, autumn-born children show a strong advantage in attainment over their younger, summer-born peers as well as raised risks for SLD (Martin et al., 2004); for speech, language, and communication needs (Lindsay & Strand, 2016); and more rarely, for emotional and behavioural disorders (Polizzi et al., 2007). SES may have a direct influence on the likelihood of SEN identification, for example, through an increased risk of a range of health and developmental problems and reduced access to mental health treatments, and an indirect influence through limited financial resources, low parental education, unemployment, maladjustment or neglect, housing instability or homelessness, family stress, and neighborhood quality (e.g., Bradley & Corwyn, 2002; McLaughlin et al., 2011; McLloyd, 1998; Reiss, 2013; Spencer, 1996). Ethnic-minority pupils may therefore be more at risk of identification of SEN because of the greater socioeconomic disadvantage they experience relative to the White majority. In England, 14% of White British pupils are eligible for a free school meal (FSM), but this more than doubles to 30% of Black Caribbean and 37% of Black African pupils (see Results section). Much research in the United States concludes that poverty is only weakly related to disproportionality, but this often arises from studies where the data are not the ethnicity, SEN, and SES of individual pupils but aggregate rates of occurrence of these variables at the district level (e.g., Skiba et al., 2005). As first noted by Strand and Lindsay (2009, p. 176), such aggregated data are prone to the “ecological fallacy,” that is, that relationships that hold at the group level hold for individuals (Robinson, 1950). Using pupil-level data, they showed that SES was strongly related to identification of SEN, particularly for categories like MLD and SEMH. For example, pupils entitled to FSM had odds of identification of MLD that were 2.3 times greater, and for SEMH, 2.4 times greater, than those who were not entitled to FSM, alongside a doubling in the odds for those living in more (+1 SD) compared with less (–1 SD) disadvantaged neighborhoods. Other studies in the United States with pupil-level data (e.g., Donovan & Cross, 2002; Kincaid & Sullivan, 2017; Shifrer et al., 2011) have also reported significant associations with SES.
Employing logistic regression, Strand and Lindsay (2009) further report that age, gender, and SES could account for the overrepresentation of Black Caribbean and Pakistani pupils among those identified with MLD and reduced the overrepresentation of Black Caribbean for SEMH from Odds Ratio (OR) = 2.28 to 1.50. Shifrer et al. (2011) analyzed data on 10,847 pupils ages 15 to 16 from the U.S. Educational Longitudinal Study and reported that Black pupils were overrepresented among those identified with learning disabilities, but this disappeared after controlling for SES. Sullivan and Bal (2013) analyzed six SEN categories for 18,000 pupils attending 39 schools from one midwestern state and reported that following controls for FSM and parental education, the substantial overrepresentation of Black pupils was eliminated for cognitive impairment and substantially reduced for emotional disabilities (ED; OR = 2.99 to 1.34). These findings suggest that SES plays a significant role, but other lines of explanation—for example, those related to teacher attitudes, expectations, and interpretations of cultural and linguistic differences—may also have some role in understanding ethnic disproportionality particularly in the identification of SEMH.
Recent U.S. Studies
Recent significant studies have emerged from the United States based upon longitudinal surveys suggesting that Black pupils are actually underrepresented for SEN. Hibel et al. (2010) analyzed the Early Childhood Longitudinal Study–Kindergarten (ECLS-K) 1998/99 tracking a sample of 11,000 pupils from age 5 to ages 10 and 11. They report that Black and Latino pupils were underrepresented for SEN compared with White pupils after controlling for educational achievement and teacher’s ratings of pupils’ behavior at kindergarten entry. Although ID (formerly mental retardation), learning disabilities, and speech and language impairments were analyzed, emotional and behavior disorders (EBD) was not analyzed as a separate outcome. Morgan et al. (2015) followed the same ECLS-K sample to ages 13 and 14, and with a larger sample size of 20,100 cases, they also concluded that Black pupils are underrepresented for SEN after controlling for prior attainment and behavior ratings, including for the ED outcome. Most recently, Morgan, Farkas, Cook et al. (2017) report a synthesis of 22 studies, concluding that among 48 coefficients estimated from studies with three “best-evidence” features (analysis of individual-level data, nationally representative samples, and a control for individual-level academic achievement), only one indicated significant overrepresentation. It is notable, though, that Hibel et al. (2010) and Morgan et al. (2015) do not report statistically significant overrepresentation of Black pupils for ID, ED, and learning disabilities even before any adjustment for behavior or attainment covariates, out of line with the findings from population data (e.g., Donovan & Cross, 2002; Skiba et al., 2008; U.S. DOE, 2018; Waitoller et al., 2010). The ECLS-K is representative and at 20,000 pupils is not a small sample, but the U.S. national incidence of ID and ED at 0.7%, and African American pupils at 15% of the population, would represent just 12 African American pupils with ID in Hibel et al. (2010) and just 22 African American pupils with ED in Morgan et al. (2015) before considering any splits by age, gender, SES, and so on. Such small numbers represent a substantial obstacle to accurate determination of ethnic disproportionality in longitudinal surveys. This also applies to the conclusions of the Morgan, Farkas, Cook, et al. (2017) best-evidence review, since 47 of the 48 coefficients are drawn from the ECLS-K, with the remaining study (Mann et al., 2007) drawing on a sample of just 999 pupils. Although there have been two recent U.S. studies with very large samples (Fish, 2019; Morgan, Farkas, Hillemeier, et al., 2017), these have been cross-sectional rather than longitudinal analyses, thus controlling for concurrent rather than prior achievement, with possible problems of endogeneity (an issue we revisit in our discussion). The ECLS-K 1998/99 eighth-grade SEN outcomes were drawn from 2006–2007, some 13 years ago, and more recent data would be of interest. Finally, many longitudinal surveys, at least in England, rely on parental report of SEN, often retrospectively, and this presents substantial challenges of under- and misreporting compared with administrative data (see Dockrell & Hurry, 2018). In summary, there is a need for a study using pupil-level data drawn from contemporary administrative records for a whole population.
The Current Study
We focused on the earliest years at school, and our study is, to our knowledge, the first to explore ethnic disproportionality in the emergence of SEN in a longitudinal study over ages 5 to 11 with national population pupil-level data. Our approach allowed us to account for the effects on identification of controlling for a range of socioeconomic variables and early educational achievement and development in the first year at school. Specific research questions addressed were as follows: (a) To what extent are any ethnic-minority groups in England overrepresented or underrepresented for SEN relative to the ethnic majority (White British)? (b) To what extent can any over- or underrepresentation in England be accounted for by pupils’ socioeconomic background or prior attainment or development at the start of school? (c) Do school factors (such as socioeconomic or ethnic composition) explain any additional variability in SEN identification in England after adjusting for pupil characteristics?
Method
Data Source
We conducted a secondary data analysis of the DFE January School Census, which is a census covering all pupils in nationally funded nursery, primary, secondary, and special schools in England. 3 The census includes pupils’ ethnic group and SEN information as well as other demographic data and achievement measures. Pupils in England start full-time education in Reception class at the start of the academic year (September 1) in which they will have their fifth birthday and are therefore on average a year younger than those in kindergarten in the United States. The cohort of interest was the 562,274 pupils enrolled in Reception at the time of the January census in 2009. To these records we matched in records from each subsequent January census for the same pupils from Year 1 (January 2010) up to and including Year 6 (January 2015). Pupils moving into the age cohort who had not been observed in Reception class were not added to the data set. Pupils who left the data set, either leaving the country or leaving the state sector, were not tracked beyond their first instance of leaving the cohort. The same was true for any pupils who left the cohort in one year but then rejoined the cohort subsequently. It should be noted that this represents not selective attrition from a sample but the genuine level of mobility within the population. Duplicate records (n = 307) and records missing values on any of the variables used in the analyses were excluded. The only pupil-level variables with missing values in any great number were neighborhood deprivation score (0.4% missing) and some components of the age 5 attainment measures (1.2%). We included all school types, including special schools and pupil referral units. A total sample of 553,264 pupils was included in the analysis.
Explanatory Variables
Ethnicity
Data on pupils’ ethnic background is requested from those with parental responsibility during primary school. The 18 ethnic categories used (see Table 1, discussed later) are standard throughout education databases in England. We use White British as the (majority) reference group and compare each of the 17 ethnic-minority groups with White British. In cases where ethnic background was not available in the Reception year, we drew ethnicity from the pupil’s Year 1 record.
Descriptive Statistics for the Longitudinal Sample.
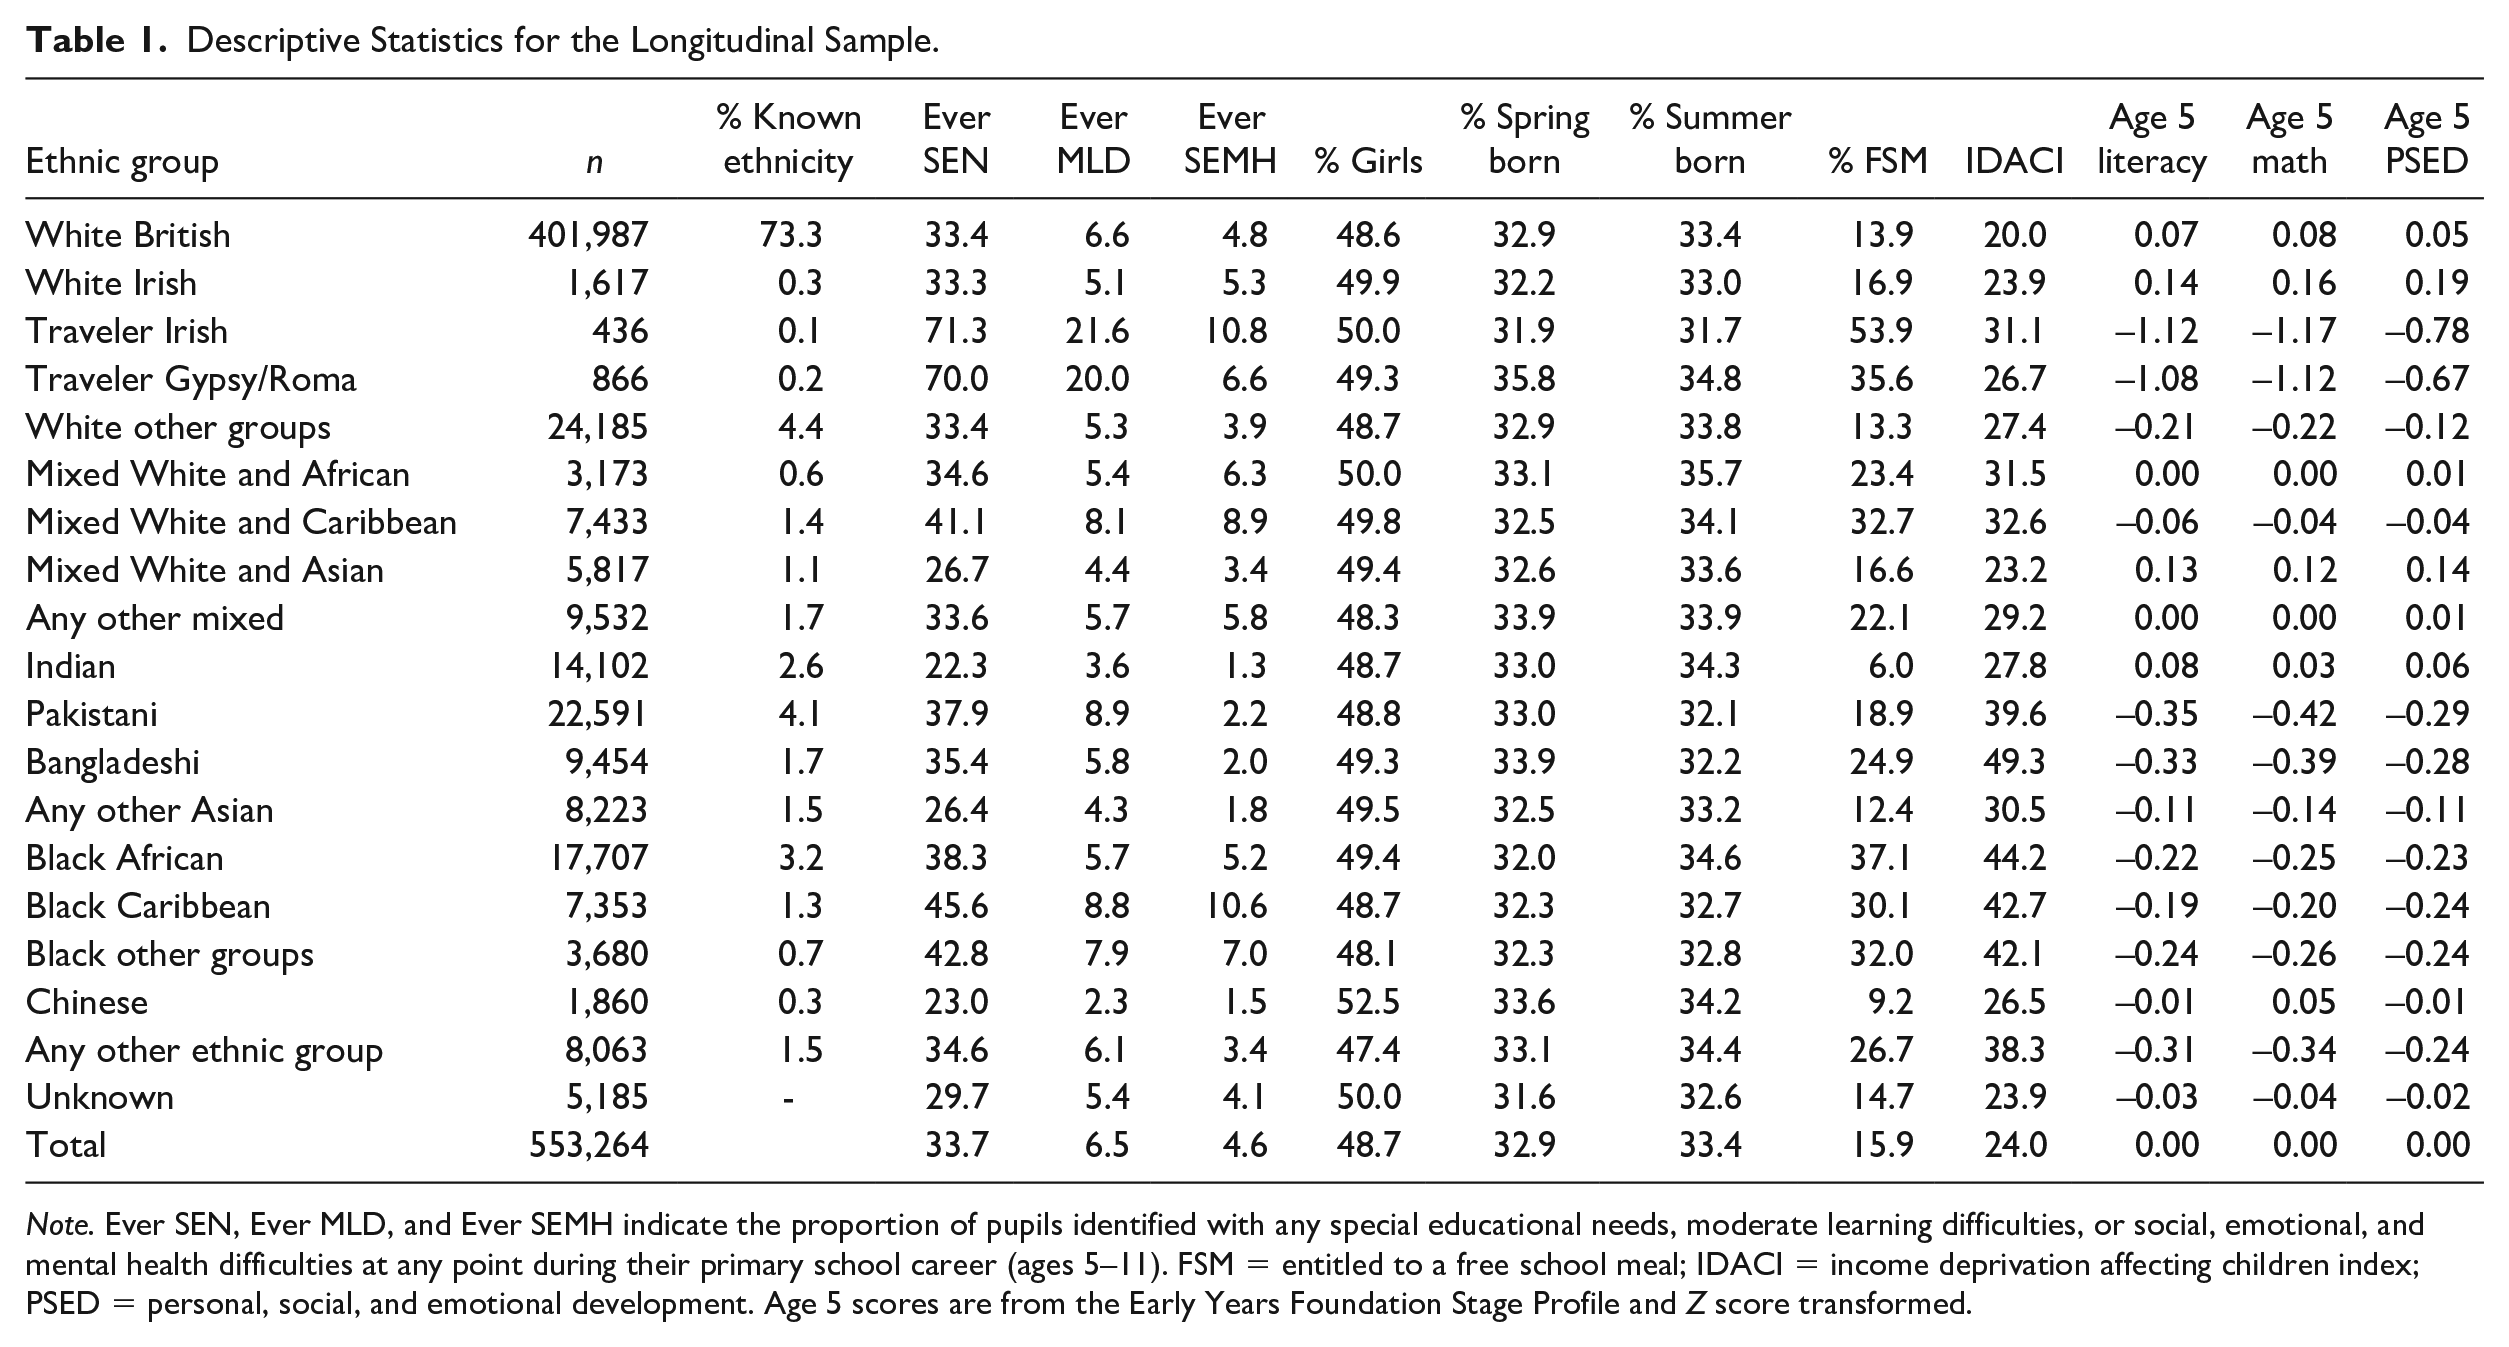
Note. Ever SEN, Ever MLD, and Ever SEMH indicate the proportion of pupils identified with any special educational needs, moderate learning difficulties, or social, emotional, and mental health difficulties at any point during their primary school career (ages 5–11). FSM = entitled to a free school meal; IDACI = income deprivation affecting children index; PSED = personal, social, and emotional development. Age 5 scores are from the Early Years Foundation Stage Profile and Z score transformed.
Birth season
In England, children start school in Reception class in the September of the academic year in which they will have their fifth birthday. There is thus up to a year’s difference in age between the youngest and oldest pupils in a year group. The autumn born (September to December) will be the oldest pupils in the year, spring born (January to April) will be the middle third, and summer born (May to August) the youngest pupils in the year group. The variable is dummy coded with autumn-born pupils as the reference group.
Sex
Girls are coded 0 and boys are coded 1.
Entitlement to FSM
FSM is a statutory benefit available to school-age children from families in receipt of other state benefits because of low income (eligibility criteria are described in DFE, 2018a). In January 2016, 15.2% of pupils ages 5 to 16 were recorded as eligible for FSM. Not entitled to FSM is coded 0, and entitled to FSM is coded 1.
Income deprivation affecting children index (IDACI)
The IDACI is produced by the Department for Communities and Local Government. The index is based on 32,482 Super Output Areas in England, which are geographical regions of around 1,500 residents, designed to include those of similar social backgrounds. The IDACI score is the percentage of under-16s in the area living in income-deprived households (primarily defined by being in receipt of state benefits). This variable is highly skewed, so for the purpose of the regression analysis, the measure was normal score transformed to give a variable with a mean of 0 and standard deviation of 1. A score above 0 indicates greater-than-average deprivation, and a score below 0 indicates below-average deprivation. Further information on IDACI can be found at https://www.gov.uk/government/statistics/english-indices-of-deprivation-2010.
Prior attainment and development
The Early Years Foundation Stage Profile (EYFSP) is completed in May of Reception year and is the first national assessment applied to all pupils in England. “The primary purpose of the EYFSP is to provide [Year 1] teachers with reliable and accurate information about each child’s level of development as they reach the end of the [early years foundation stage]” (Qualifications and Curriculum Authority [QCA], 2008, p. 2). Reception class teachers rate the achievement of pupils against 13 assessment scales. Each scale consists of multiple statements and is scored by the teacher from 1 to 9. A small number of pupils who did not achieve a score of 1 are likely to have significant developmental delay and are included with a score of 0. Ten of the scales are grouped into three key areas of learning: (a) communication, language, and literacy (CLL) comprises four scales (Language for Communication and Thinking, Linking Sounds and Letters, Reading, Writing) with score range 0 to 36; (b) problem solving, reasoning, and numeracy (PSRN) comprises three scales (Numbers as Labels for Counting; Calculating; Shapes, Space, and Measures) with score range 0 to 27; (c) personal, social, and emotional development (PSED) comprises three scales (Dispositions and Attitudes; Social Development; Emotional Development) with score range 0 to 27. A summary of the PSED items is given in the online supplementary materials. Further detail and a description of all scales can be found in the EYFSP handbook (QCA, 2008). Computed Cronbach’s alpha for our age cohort yielded internal consistency coefficients of .93 for CLL, .91 for PSRN, and .90 for PSED. The language components of the EYFSP have good concurrent validity against formal tests of language abilities (e.g., Snowling et al., 2011), and all elements have good predictive validity against subsequent educational achievement at age 7 (Fischer Family Trust, 2011). In relation to SEN, we are not exclusively interested in the prediction of academic achievement and so use all three elements as separate independent variables. Scores were standardized (Z score transformed) prior to analysis to aid the interpretation of regression coefficients in standard deviation units.
School-level variables
We included school type (foundation, academy, church, or special school, contrasted with community) and quintiles for school percentage FSM, school percentage ethnic minority, and school size (number of pupils on roll). For greater reliability, all percentages were calculated from the whole school rolls in January 2009, not just for those pupils in the longitudinal cohort. Quintile 5 (Q5) represents the 20% of schools with the lowest percentage FSM and the 20% of schools with the largest school rolls. The ethnic-group quintiles were based on different ethnic groupings in each of the three models, reflecting the pattern of ethnic under- or overrepresentation observed empirically for each outcome: For any SEN, Q5 represents the 20% of schools with the lowest percentage of White British pupils; for MLD, Q5 represents the 20% of schools with the lowest proportion of Asian pupils (excluding Pakistani); for SEMH, Q5 represents the 20% of schools with the lowest percentage Black Caribbean and MWBC pupils. For the latter variable, almost 40% of schools had no Black Caribbean or MWBC pupils on roll at all, so the lowest quintile represents the bottom 40% of schools.
Survival Analysis, Hazard Ratios (HRs), and Defining Disproportionality
Cox proportional hazards regression results are reported in terms of HRs. These have an interpretation somewhat similar to ORs but with a time aspect and based on probabilities rather than odds. An HR gives the “risk” of identification per unit of time (in the context of this research, 1 year) for a given condition (e.g., an ethnic-minority group) relative to the reference group (e.g., White British pupils). So, for example, an HR of 2.0 for an ethnic-minority group would indicate that this group has twice the risk of identification in any particular year, relative to the White British majority group. These risks are compounded year on year, indicating differential rates of growth in the risk of identification for the minority relative to the majority group. This method more appropriately models SEN identification as a dynamic, over-time process. This is probably best illustrated graphically and can be seen in Figure 1. We ran analyses for three outcomes calculating time to first identification of any SEN, MLD, and SEMH, respectively. We replicated Morgan et al.’s (2015) approach of estimating separate regressions for MLD and for SEMH where, once identified, the pupil was censored from the sample for those SEN but not other SEN. Given our sample size of over half a million pupils, statistical significance is a poor guide to educational significance, because even the smallest differences are likely to be statistically significant. We choose instead to emphasize effect sizes and to highlight instances in which the likelihood of identification for pupils from an ethnic-minority group were one third (33%) higher (HR > 1.33), or the inverse ratio (HR < 0.75) lower, relative to White British pupils.
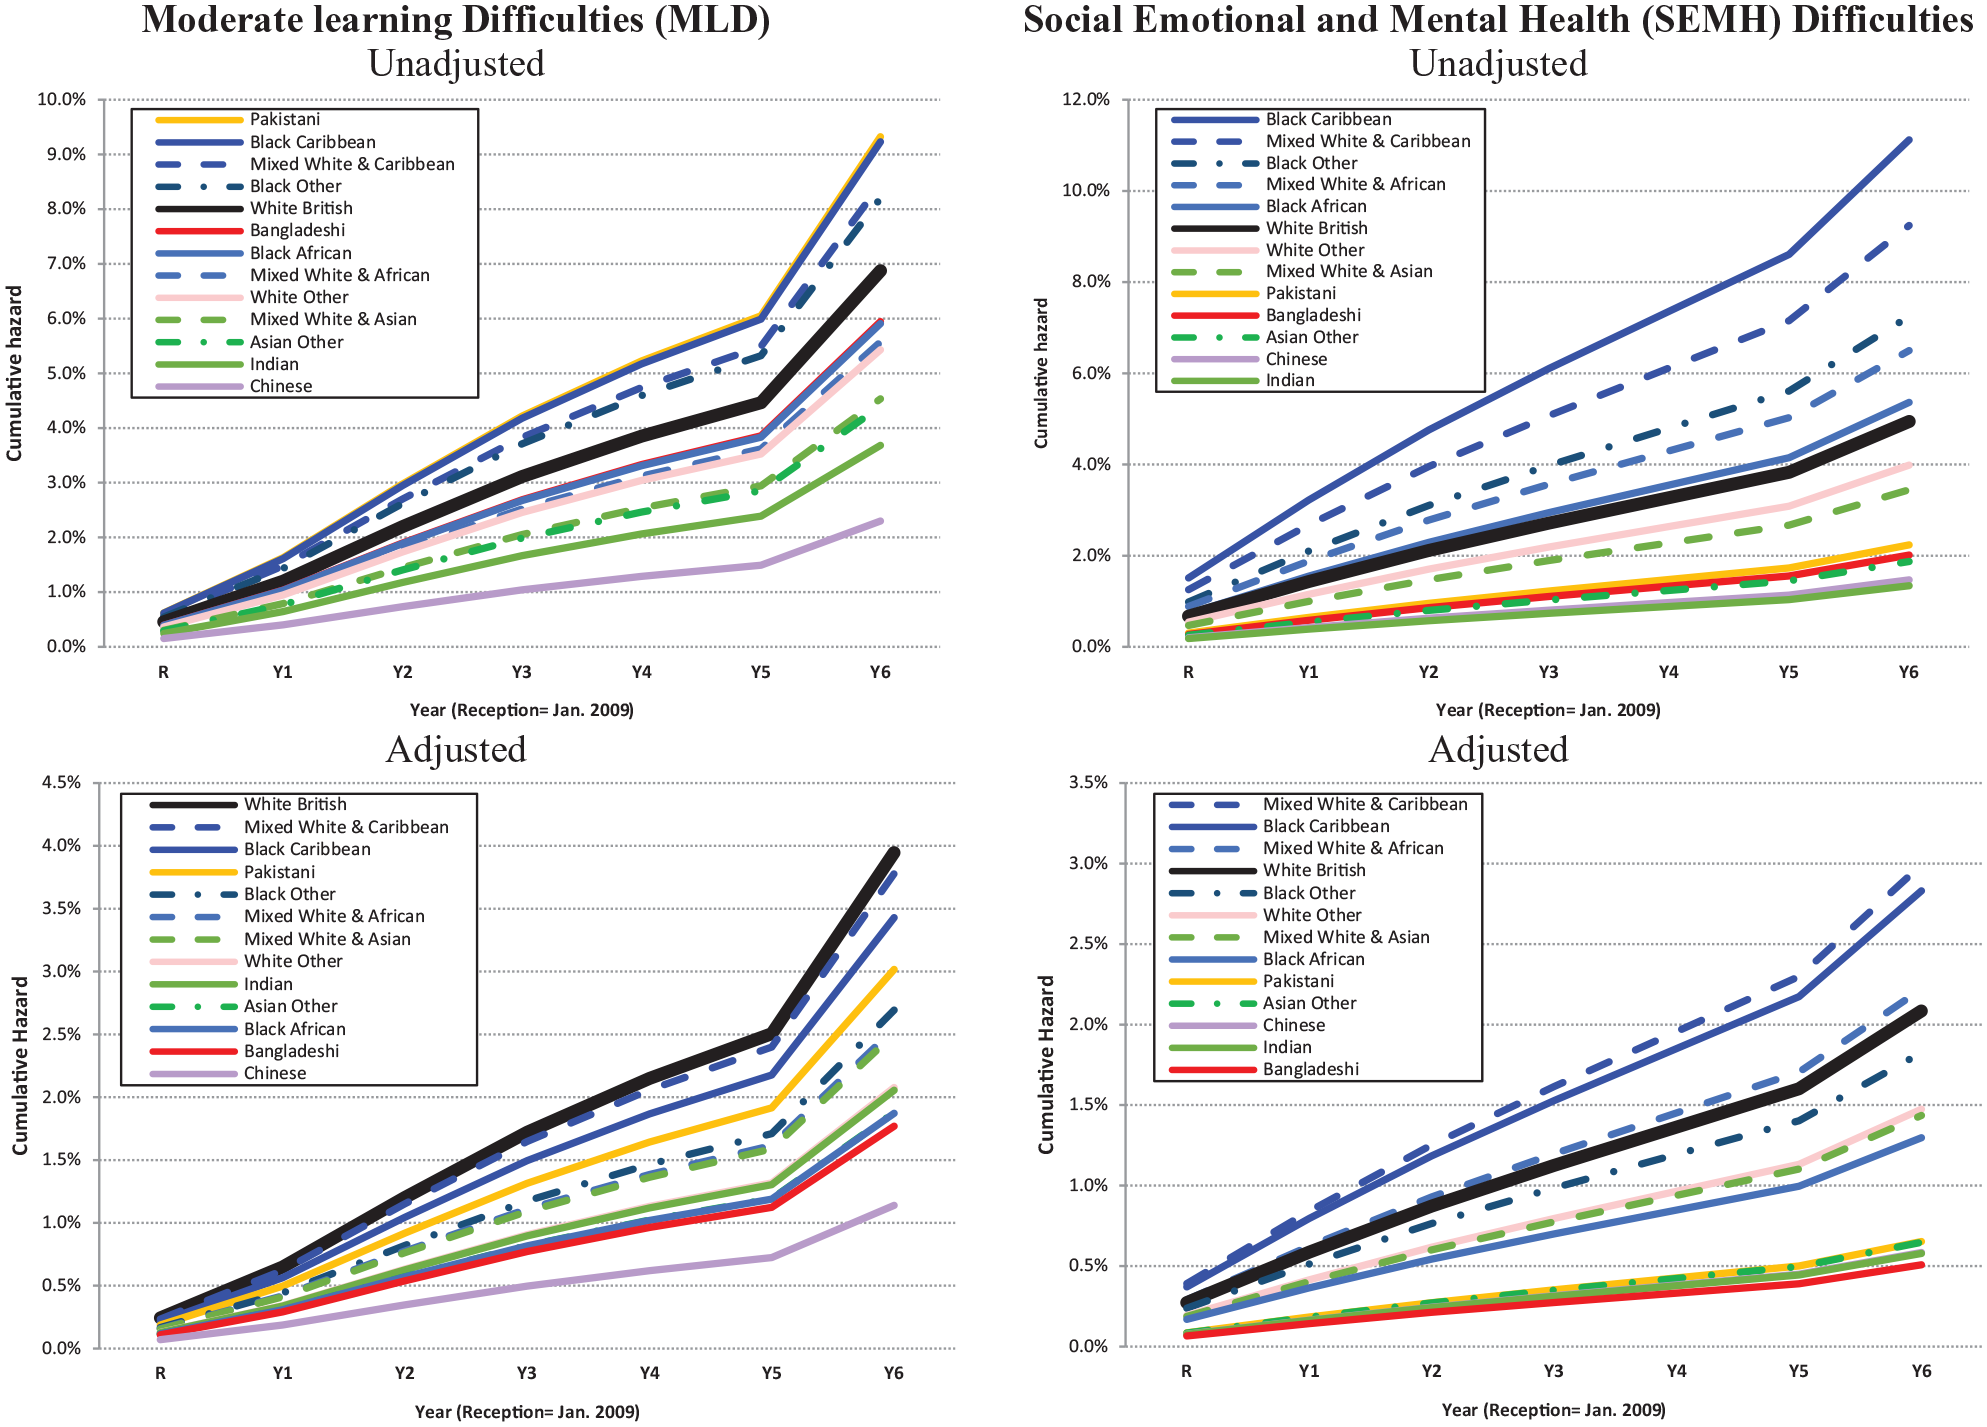
Unadjusted (Model 1) and adjusted (Model 3) hazard functions for identification of MLD and SEMH, respectively.
Results
Descriptive Statistics
Table 1 presents descriptive statistics for the cohort. We see that 73% of pupils are White British, 10% are from Asian groups (Indian, Pakistani, Bangladeshi, and other Asian groups), 5% are from Black groups, 5% are from White other groups, and 5% are of mixed heritage. To give an indication of the incidence of SEN identification, Ever SEN, Ever MLD, and Ever SEMH are binary indicators of whether or not a pupil was ever identified with a given type of SEN at any point during primary school. We see that cumulatively one third of pupils are identified with SEN at some point during their primary schooling, more than double the 16% that is observed cross-sectionally in any single year (Strand & Lindorff, 2018). In relation to our focal types of SEN, we see that 6.5% of pupils were identified with MLD and 4.7% with SEMH at some point during primary school. These levels vary considerably by ethnicity. For example, for MLD, 6.6% of White British pupils were identified, compared with 8.8% of Black Caribbean and Pakistani pupils. For SEMH, 4.8% of White British pupils were identified, compared with 8.9% of MWBC and 10.6% of Black Caribbean pupils. It is also apparent that risk factors are higher for ethnic-minority groups. For example, 14% of White British pupils are eligible for FSM, but this more than doubles to over 30% for all three Black groups and for MMBC pupils, and the average deprivation score is 20% for White British pupils but more than double this for Pakistani, Bangladeshi, and all three Black groups. Finally, average age 5 scores for literacy, mathematics, and PSED are typically around 0.25 standard deviations below the population mean for all three Black groups and for Pakistani, Bangladeshi, and White other pupils.
Hazard Modeling
We ran four models for each outcome. Model 1 indicates “raw” ethnic disproportionality before including any covariate controls. Model 2 adds gender, age, and the SES explanatory variables. Model 3 further adds the age 5 attainment and development measures, and Model 4 adds school type and composition variables. Models 2 through 4 control for all variables within the model simultaneously, so each coefficient represents the unique effect for that variable, after the variation in the outcome associated with all other explanatory variables in the model is controlled. The results are presented in Tables 2 and 3. Figure 1 also presents the results graphically, showing the likelihood of identification of MLD and SEMH over time for the largest ethnic groups, both in the raw results (upper panels) and after adjustment for covariates (lower panels).
Hazard Model for Time to First Identification for Any Special Educational Needs (SEN).
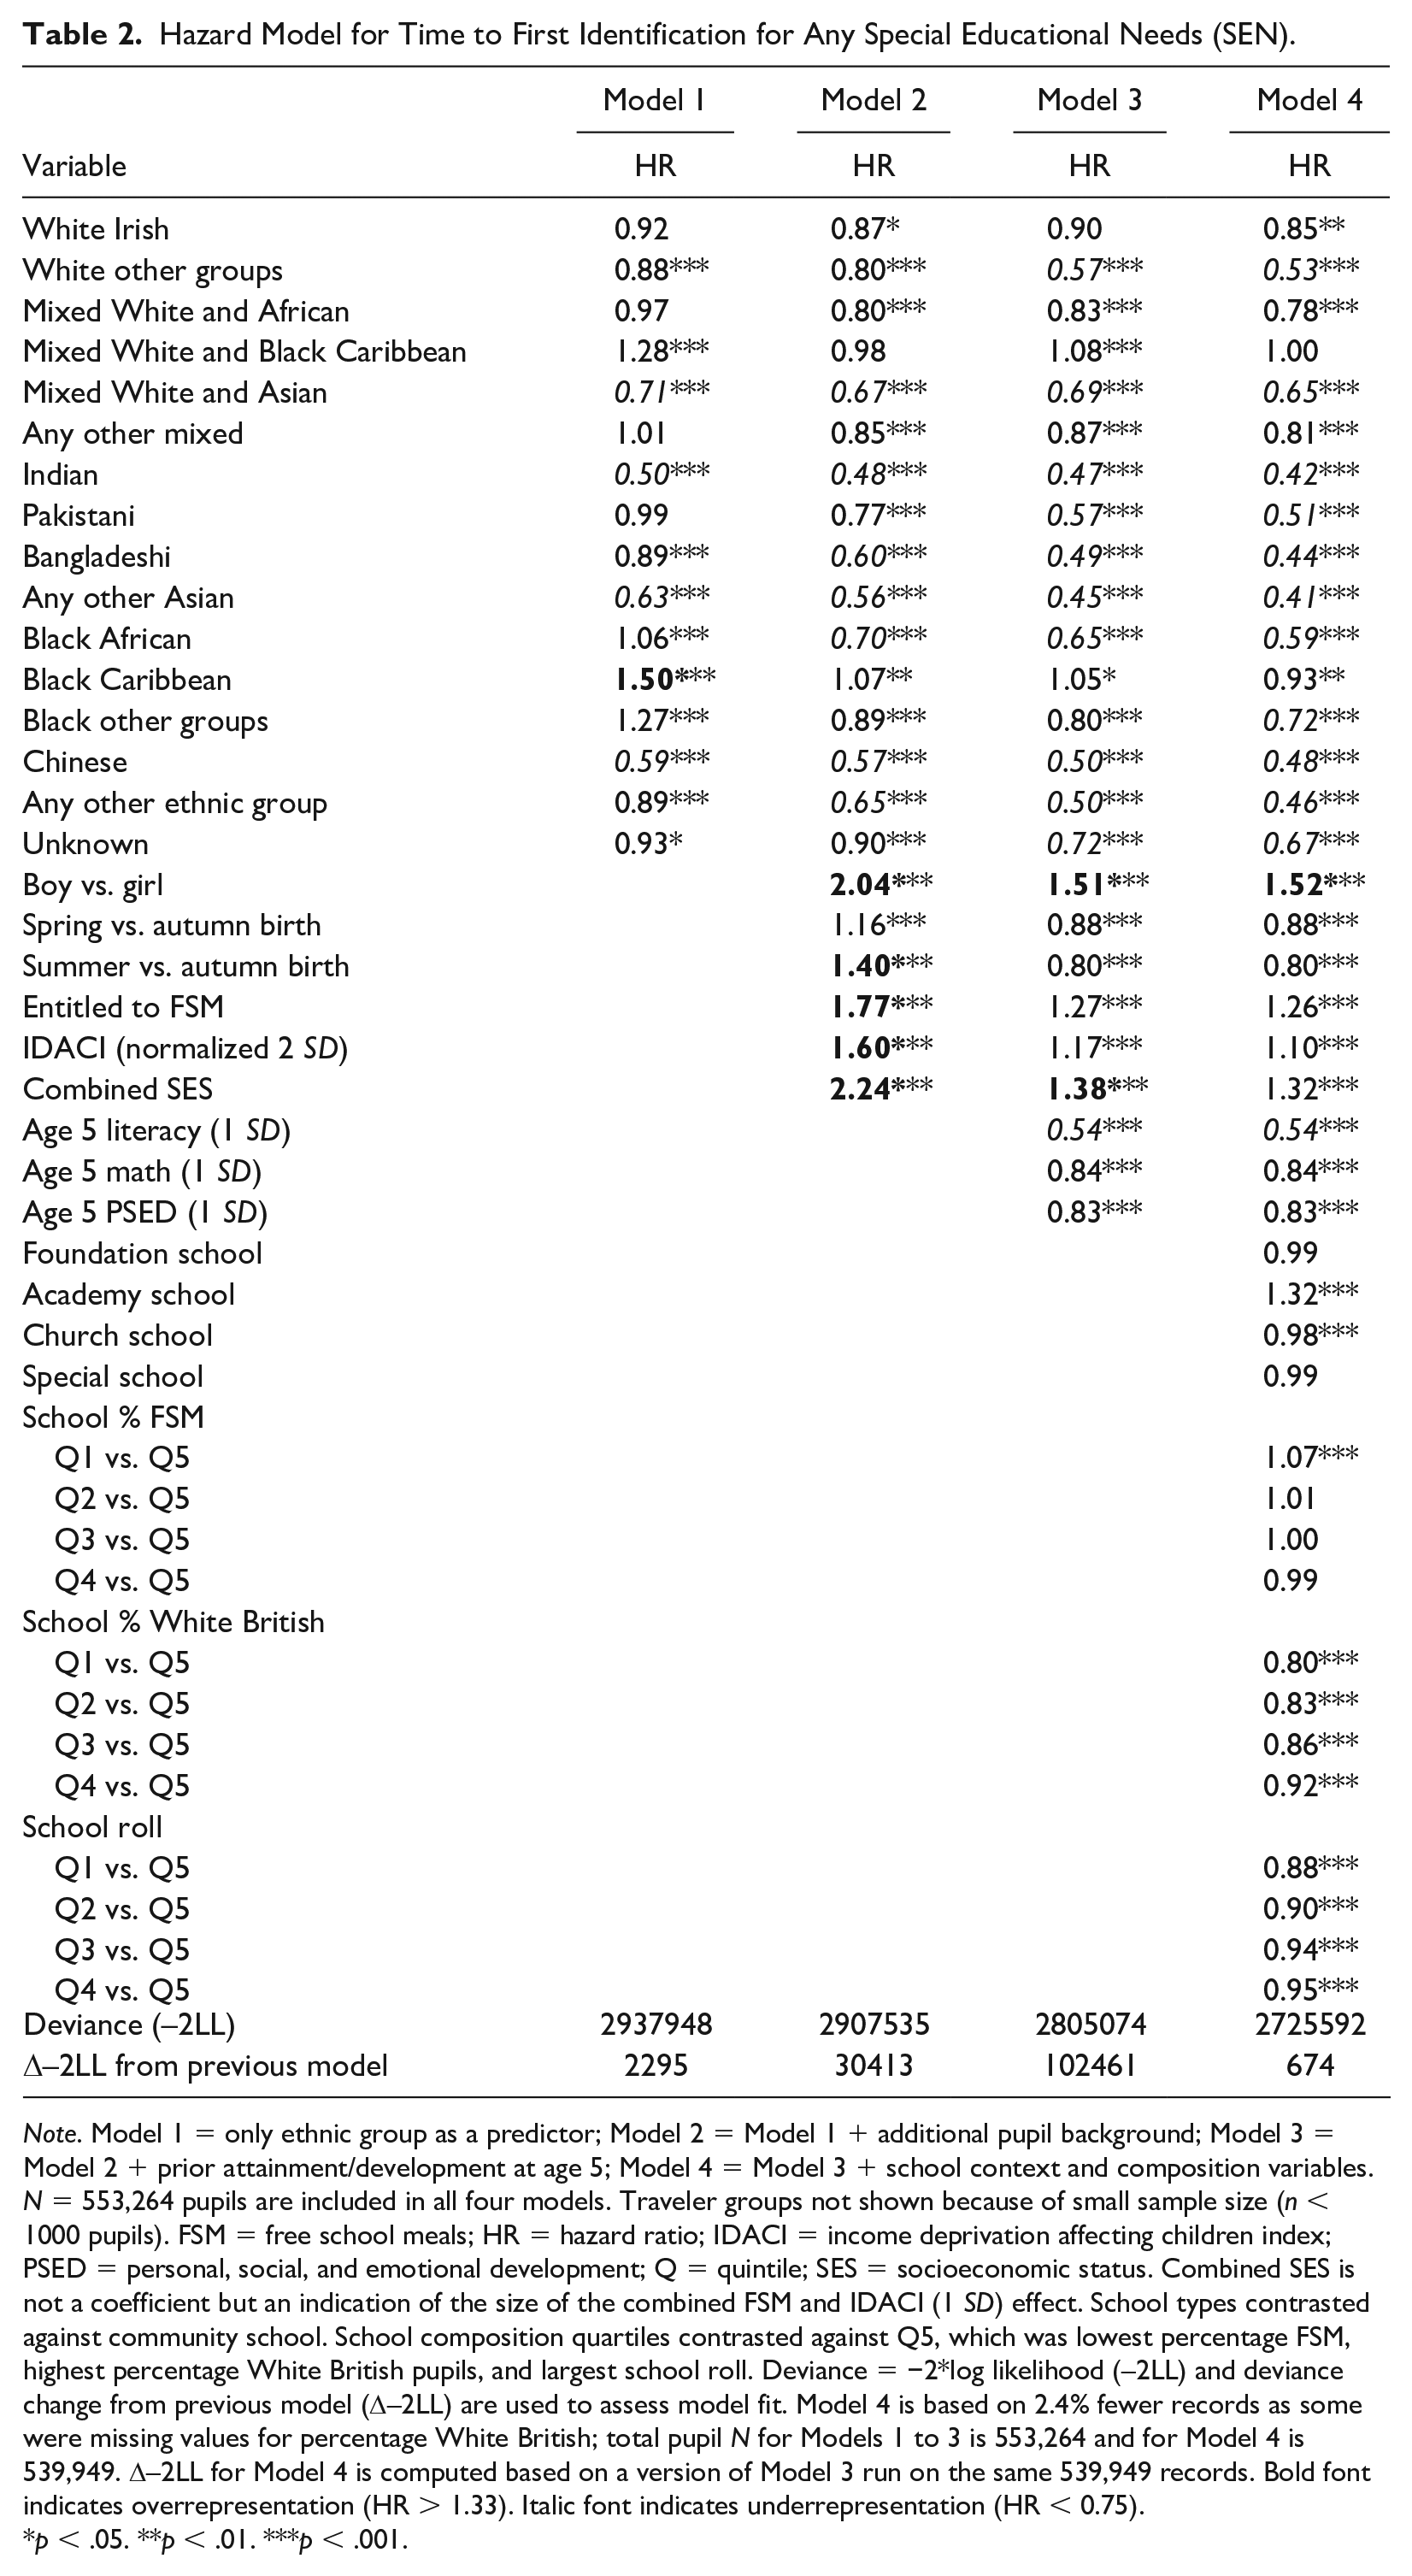
Note. Model 1 = only ethnic group as a predictor; Model 2 = Model 1 + additional pupil background; Model 3 = Model 2 + prior attainment/development at age 5; Model 4 = Model 3 + school context and composition variables. N = 553,264 pupils are included in all four models. Traveler groups not shown because of small sample size (n < 1000 pupils). FSM = free school meals; HR = hazard ratio; IDACI = income deprivation affecting children index; PSED = personal, social, and emotional development; Q = quintile; SES = socioeconomic status. Combined SES is not a coefficient but an indication of the size of the combined FSM and IDACI (1 SD) effect. School types contrasted against community school. School composition quartiles contrasted against Q5, which was lowest percentage FSM, highest percentage White British pupils, and largest school roll. Deviance = −2*log likelihood (–2LL) and deviance change from previous model (Δ–2LL) are used to assess model fit. Model 4 is based on 2.4% fewer records as some were missing values for percentage White British; total pupil N for Models 1 to 3 is 553,264 and for Model 4 is 539,949. Δ–2LL for Model 4 is computed based on a version of Model 3 run on the same 539,949 records. Bold font indicates overrepresentation (HR > 1.33). Italic font indicates underrepresentation (HR < 0.75).
p < .05. **p < .01. ***p < .001.
Hazard Model for Time to First Identification for Moderate Learning Difficulties (MLD) and Social, Emotional, and Mental Health Difficulties (SEMH).
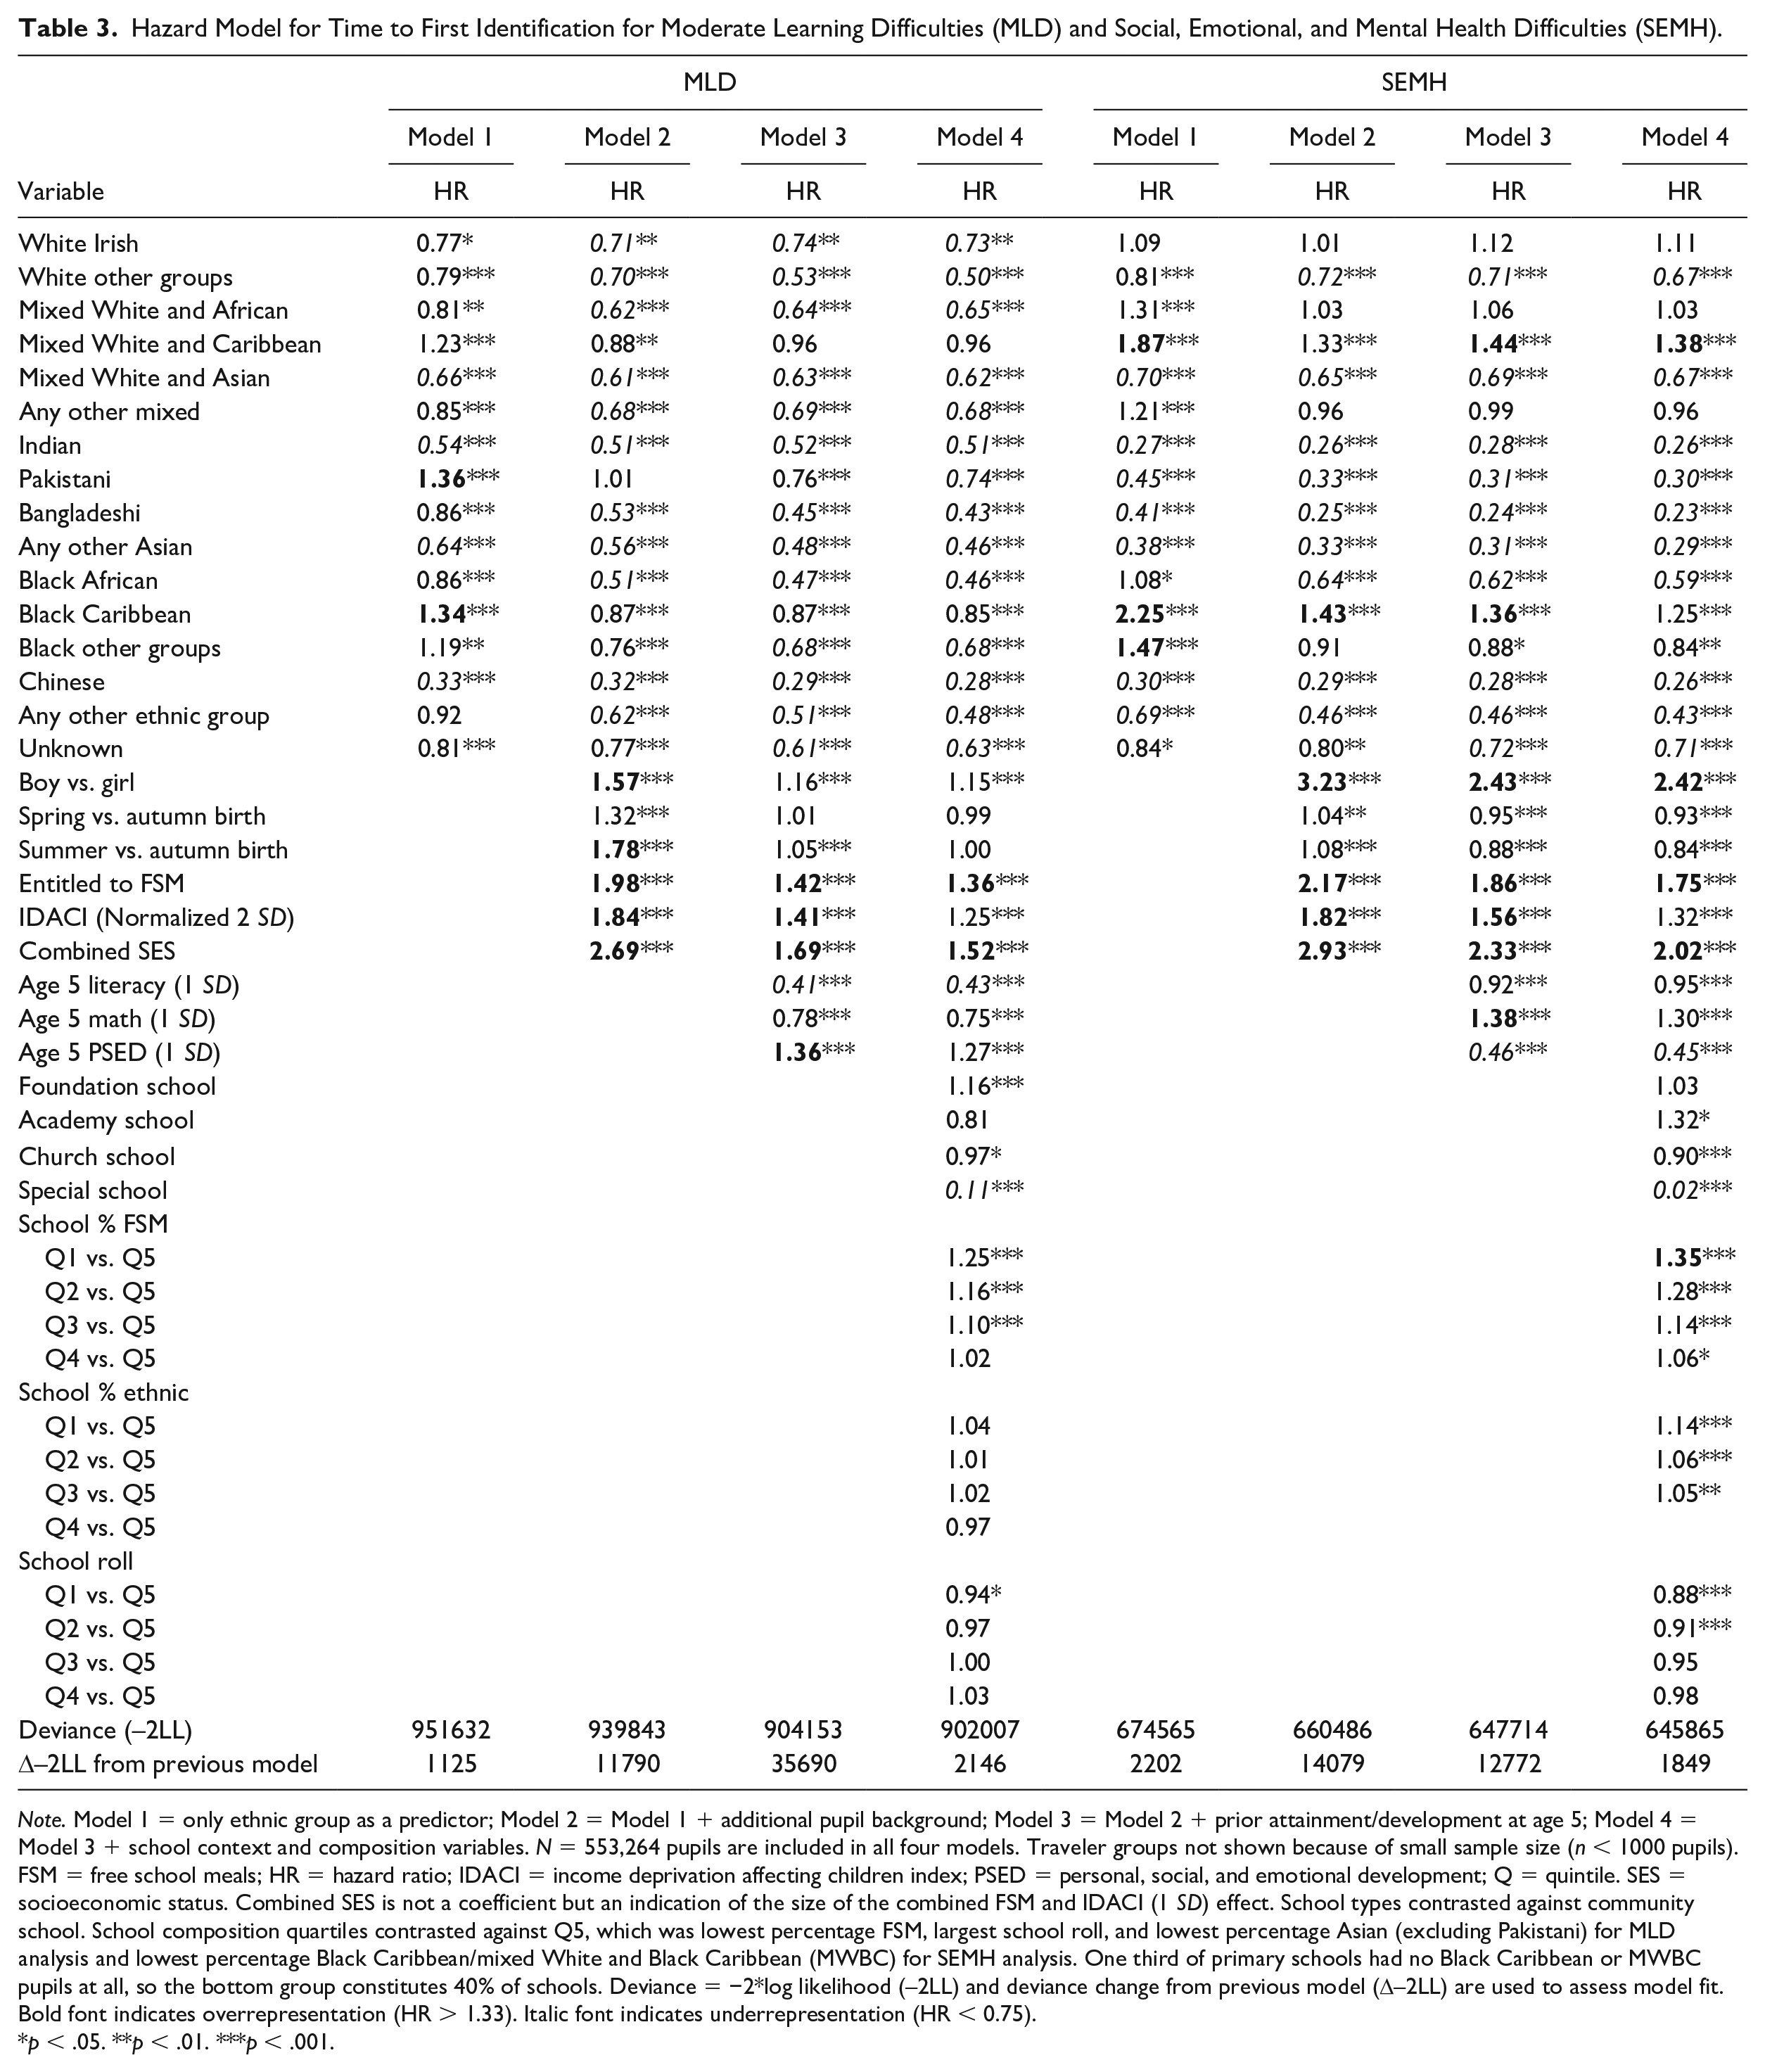
Note. Model 1 = only ethnic group as a predictor; Model 2 = Model 1 + additional pupil background; Model 3 = Model 2 + prior attainment/development at age 5; Model 4 = Model 3 + school context and composition variables. N = 553,264 pupils are included in all four models. Traveler groups not shown because of small sample size (n < 1000 pupils). FSM = free school meals; HR = hazard ratio; IDACI = income deprivation affecting children index; PSED = personal, social, and emotional development; Q = quintile. SES = socioeconomic status. Combined SES is not a coefficient but an indication of the size of the combined FSM and IDACI (1 SD) effect. School types contrasted against community school. School composition quartiles contrasted against Q5, which was lowest percentage FSM, largest school roll, and lowest percentage Asian (excluding Pakistani) for MLD analysis and lowest percentage Black Caribbean/mixed White and Black Caribbean (MWBC) for SEMH analysis. One third of primary schools had no Black Caribbean or MWBC pupils at all, so the bottom group constitutes 40% of schools. Deviance = −2*log likelihood (–2LL) and deviance change from previous model (Δ–2LL) are used to assess model fit. Bold font indicates overrepresentation (HR > 1.33). Italic font indicates underrepresentation (HR < 0.75).
p < .05. **p < .01. ***p < .001.
Any SEN
The raw data (Model 1) indicate that Black Caribbean pupils are the only ethnic group to be significantly overrepresented (HR = 1.50) relative to White British among those identified with SEN, whereas Indian, Chinese, any other Asian, and mixed White and Asian pupils are underrepresented.
Model 2 shows there is a strong social gradient related to the identification of SEN. Pupils entitled to FSM are identified approximately 2.0 times more frequently than pupils not entitled to FSM, and a 2-standard-deviation change in IDACI is associated with an increased likelihood of 1.60. The combined SES indicator shows pupils entitled to FSM and living in a deprived area (+1 SD on IDACI) are 2.24 times more likely to be identified with SEN than those not so socioeconomically disadvantaged. 4 Gender has a strong association with identification of SEN, with the probability of identification for boys 2.0 times higher than for girls. There is also an age effect, with the likelihood of identification for pupils who are young for their year group (summer born) being 1.40 times higher than the older (autumn-born) pupils.
Model 3 shows the gender, age, and SES effects are attenuated when prior attainment and development is included, indicating the increased risks are partially mediated by boys, younger and low-SES pupils having lower age 5 scores than girls, and older and higher-SES pupils. It is the literacy scale of the age 5 assessments that has by far the greatest explanatory power of the three age 5 measures: Pupils’ 1 standard deviation above the population average for literacy have a much lower likelihood (HR = 0.54) of identification, whereas conversely, those 1 standard deviation below the average age 5 literacy score have a much higher likelihood of identification (HR = 1.90), relative to those with an average score. 5 Mathematics and PSED scores make only small contributions. Model 4 shows that school type and composition have only very small associations with the likelihood of identification and no substantive impact on the ethnic coefficients. 6
In relation to our focal interest in ethnicity, we see that after controlling for SES, there is no longer any overrepresentation of Black Caribbean pupils and that Bangladeshi and Black African, as well as Indian, Chinese, and other Asian pupils, are underrepresented relative to White British pupils. After controlling for age 5 attainment and development, the Pakistani and White other groups also become underrepresented. Thus all ethnic groups—other than Black Caribbean, MWBC, Black other, mixed White and African, and White Irish pupils—are actually underrepresented relative to White British pupils among those identified with SEN.
These results are important, but aggregating all types of SEN together combines very heterogeneous types of need. We next investigate the patterns for the two highest-incidence and more judgmental categories of MLD and SEMH.
MLD
The raw data (Model 1) indicate that Black Caribbean pupils are significantly overrepresented (HR = 1.34) among those identified with MLD relative to White British pupils, as are Pakistani pupils (HR = 1.36). The likelihood of identification is raised for MWBC pupils (HR = 1.23), but this is below the 1.33 threshold. Chinese, Indian, mixed White and Asian, and other Asian pupils are all underrepresented.
Model 2 shows there is a strong social gradient related to the identification of MLD. Pupils entitled to FSM are identified approximately 2.0 times more frequently than pupils not entitled to FSM, and a 2-standard-deviation change in IDACI is associated with increased likelihood of 1.84, giving HR = 2.69 for the combined SES indicator. Gender has a strong association with identification of MLD, with the probability of identification for boys 1.57 times higher than for girls. There is also an age effect, with the likelihood of identification for pupils who are young for their year group (summer born) being 1.78 times higher, and spring-born pupils 1.32 times higher, than the older (autumn-born) pupils. Both these effects are no longer substantial in Model 3, indicating the increased risks are mediated by boys and younger pupils having lower age 5 scores than girls and older pupils.
Model 3 reveals it is the literacy scale of the age 5 assessments that has by far the greatest explanatory power in accounting for the risk of identification of MLD. Pupils 1 standard deviation above the population average for literacy have a much lower likelihood (HR = 0.41) of MLD identification, and conversely, those 1 standard deviation below the average age 5 literacy score have a much higher likelihood of MLD identification (HR = 2.43), relative to those with an average score. Mathematics and PSED scores make only relatively small contributions, and the direction of the association with PSED reverses when literacy is in the model. In relation to our focal interest in ethnicity, we see that after controlling for the aforementioned variables, there is no longer any overrepresentation of Black Caribbean pupils, with the HR reduced from 1.34 in Model 1 to nonsubstantial levels in all subsequent models. Additionally, Pakistani pupils, who were overrepresented in the raw data (HR = 1.36), are not overrepresented after accounting for SES (HR = 1.01) and are borderline underrepresented (HR = 0.76) once age 5 attainment and development is controlled. No ethnic minority is overrepresented, and indeed, the majority are in fact underrepresented relative to White British pupils after all age 5 controls. School type and composition have only small effects and no substantive impact on the ethnic coefficients.
SEMH
The raw data (Model 1) indicate significant overrepresentation for SEMH among Black Caribbean (HR = 2.25), MWBC (HR = 1.87), Black other (HR = 1.47), and to some extent mixed White and African (HR = 1.31) pupils relative to White British pupils. There is significant underrepresentation for all the Asian groups.
Model 2 shows a strong social gradient for SEMH identification. Pupils entitled to FSM have probabilities that are 2.17 times higher than pupils not entitled to FSM, and a 2-standard-deviation change in IDACI is associated with increased probability of 1.82, giving an HR of 2.93 for the combined SES indicator. Gender has a strong association with SEMH, with the likelihood for boys 3.23 times higher than for girls. In contrast to MLD, teachers are not more likely to identify the younger pupils within a year group, with no significant difference in rates of identification between summer-, spring-, or autumn-born pupils.
Model 3 shows it is the PSED score that has the greatest explanatory power in accounting for the risk of identification of SEMH. Pupils 1 standard deviation above the population average for PSED had a much lower probability (HR = 0.46), and those 1 standard deviation below the population average much higher probability (HR = 2.17), of SEMH identification compared with those with the average PSED score. There was a slightly raised risk associated with higher mathematics scores when PSED and reading scores were held constant, but the effect was small relative to PSED. Further investigation of the three PSED subscales (not reported here) showed that dispositions and attitudes did not predict SEMH; it was social development (e.g., ability to play with others, take turns, form good relationships, understand the need for agreed codes of behavior, understand that people have different needs and views) and emotional development (e.g., expressing needs and feelings, awareness of feelings of self and others, considering the consequences of actions for self and others, understanding of right and wrong and why) that held the predictive power. Accounting for all age 5 controls reduces the overrepresentation, but Black Caribbean (HR = 1.36) and MWBC pupils (HR = 1.44) remain overrepresented relative to White British pupils. The Black other and mixed White and African pupils are no longer overrepresented, and Black African pupils are substantially underrepresented (HR = 0.62) relative to White British. Chinese pupils and all four Asian groups (Indian, Pakistani, Bangladeshi, and any other Asian) remain significantly underrepresented.
Model 4 shows that even after controlling for pupil-level variables, there were higher risks of SEMH identification in schools with higher proportions of pupils entitled to FSM, particularly in the two most deprived quintiles (HR = 1.35 and 1.28, respectively), slightly raised risks (HR = 1.14) in schools in the top quintile for proportion of Black Caribbean and MWBC pupils, and very slightly lowered risks in larger schools (HR = 0.88 and 0.91 for the highest two quintiles in terms of school size, respectively). 7 These slightly attenuated the Black Caribbean coefficient (HR = 1.25), indicating a part of the raised risk for Black Caribbean pupils reflects their greater likelihood of sorting into urban high-deprivation schools, where they represent a relatively large proportion of the population (the mean percentage Black Caribbean and MWBC in Q1 was 9.8%, SD = 6.6). Nevertheless, the increase in explanatory power of Model 4 in terms of reduction in deviance was small. In equivalent logistic regression models, the change in Nagelkerke pseudo R2 between Model 3 and Model 4 was from 34.5% to 34.8% for Ever SEN, from 22.5% to 23.5% for Ever MLD, and from 16.2% to 17.2% for Ever SEMH.
Discussion
Ethnic-Minority Underrepresentation
Black Caribbean pupils were overrepresented relative to White British pupils for any SEN (HR = 1.50), Black Caribbean (HR = 1.34) and Pakistani (HR = 1.36) pupils were overrepresented for MLD, and Black Caribbean and MWBC pupils were overrepresented for SEMH. There was no overrepresentation of any other ethnic-minority group for these three outcomes. Pupils entitled to FSM and living in a neighborhood 1 standard deviation above the mean disadvantage had a greatly raised likelihood of identification of any SEN (HR = 2.24), MLD (HR = 2.69), and SEMH (HR = 2.93); and when age, gender, and SES were controlled, the ethnic overrepresentation for any SEN and MLD was eliminated (we discuss the results for SEMH separately in the next section). These results indicate the greater socioeconomic deprivation experienced by Black Caribbean and Pakistani pupils, rather than school identification processes, can account for their overrepresentation. Indeed, the predominant pattern of results is one of underrepresentation for most ethnic-minority groups. For MLD, Indian, Chinese, mixed White and Asian, and any other Asian groups are underrepresented in the raw data. After controlling for SES and prior attainment, most of the other large ethnic groups, including Indian, Bangladeshi, Chinese, Black African, and White other pupils, are about half as likely as White British pupils to be identified with MLD, and Pakistani pupils are about two thirds as likely. This may reflect the fact that a significant proportion of pupils in these ethnic groups enter school with English as an additional language (EAL) but make rapid educational progress as they acquire fluency in the language of instruction (e.g., Strand & Demie, 2005; Strand et al., 2015). 8 It may be therefore that a low age 5 literacy score is a less accurate indicator of academic potential and risk of SEN for many pupils in these ethnic groups. Unfortunately, the EAL flag in the National Pupil Database (NPD) is a measure only of exposure to a language other than English in the home or the community and not a measure of proficiency in English, so we cannot empirically confirm this hypothesis (see Strand et al., 2015, for a detailed discussion of the policy context in England). Other mechanisms hypothesized to lead to underrepresentation are “big fish, little pond” school contrast effects (e.g., Hibel et al., 2010), though we find school variables explain very little of the variability in SEN identification across our English primary schools. Also, in contexts such as the United States, where there are strong legal frameworks, it is argued there may be “local political and administrative pressure not to identify minority children as having disabilities to avoid reporting overrepresentation” (Morgan, Farkas, Hillemeier, et al., 2017, p. 319), though this is less likely in England, where there is no comparable legislation, publication, or statutory monitoring of ethnicity and SEN data. It is probable that wider cultural factors are involved. Low levels of identification may reflect parents’ attributions of academic difficulties to effort rather than disability (Archer & Francis, 2007) or communities with lower awareness of special needs, parents’ rights, and relevant services; where having a child with SEN is particularly stigmatizing; where cultural or linguistic barriers impede access to services; or where the services available do not meet their needs (Butt & Mirza, 1996; Mir et al., 2001). This would suggest a need to raise awareness of SEN among the relevant ethnic-minority communities, improve outreach, and review the extent to which services are configured appropriately.
This under-representation would suggest a need to raise awareness of SEN among the relevant ethnic-minority communities, improve outreach, and review the extent to which services are configured appropriately.
Black Caribbean and MWBC Overrepresentation for SEMH
The only overrepresentation to survive age 5 controls is the substantial overrepresentation of Black Caribbean and MWBC pupils for SEMH, which is reduced but not eliminated, with these two groups remaining over one third more likely to be identified (HR = 1.36 and HR = 1.44, respectively), and with earlier onset, than comparable White British pupils. Although drawn from a different national context, this result is not what we might expect given the findings of Hibel et al. (2010) and Morgan et al. (2015). First, we noted earlier that Morgan et al. (2015) are unusual in that they do not report statistically significant overrepresentation of Black pupils for ID, ED, and learning disabilities even before any adjustment for covariates, out of line with population data (e.g., Donovan & Cross, 2002; Skiba et al., 2008; U.S. DOE, 2018; Waitoller et al., 2010). Morgan and Farkas (2016) argue that national U.S. DOE data “measure disability status and race/ethnicity imprecisely as a result of state-by-state variability in disability criteria, reporting errors and inconsistencies in who reports on children’s race/ethnicity” (p. 226), but this seems a small concern relative to the large and generally consistent disproportionality across states (e.g., U.S. DOE, 2018, pp. 135–136) and in most quantitative research studies (see recent review by Cruz & Rodl, 2018, p. 58). It seems more likely that the absence of disproportionality reflects issues with the ECLS-K sample. As outlined in the introduction, even though the ELCS-K sample size is large at around 20,000 pupils, it may be underpowered to reliably detect relatively low-frequency outcomes, like the overlap between SEN and ethnic-minority status.
Second, Morgan et al. (2015) report significant under-representation of Black pupils for SEN after what they describe as controls for ‘prior attainment’. The importance of controlling for prior attainment rests on the extent to which it is criterion-relevant. Where the SEN relates to cognitive impairment (e.g., MLD, severe learning difficulties, or SLD), control for prior attainment as a risk factor is relevant, but prior attainment may be poorly correlated or even conceptually orthogonal to some SEN. For example, we demonstrate here that academic attainment at age 5 (particularly in literacy) is strongly related to subsequent identification of MLD but not to identification of SEMH. “Prior attainment” is also an incomplete description of Morgan et al.’s controls in relation to the ED outcome, which included teacher ratings of pupils’ externalizing problem and self-regulatory behaviors. These were sourced not just at the start of kindergarten but also concurrently at Grades 1, 3, 5, and 8. Teachers’ ratings of concurrent externalizing problem behaviors and approaches to learning have endogeneity problems because, to the extent that teacher bias is posited to play some role in overrepresentation, concurrent behavior ratings by the pupil’s teacher are not independent of the ED identification itself. This model may therefore overcorrect, and we would argue it is more appropriate to limit controls to behavior on entry to kindergarten and to assess in separate steps controls for prior attainment and for behavior. We note that a very recent study using the ECLS-K 2011 (Kulkani & Sullivan, 2019), which included controls for reading scores and teacher-rated externalizing behavior and self-control at entry to kindergarten but not from later grades, reported that Black pupils were still overrepresented (OR = 2.76) for ED and ADHD in the third grade, congruent with our current results.
concurrent behavior ratings by the pupil’s teacher are not independent of the ED identification itself.
Accounting for Black Caribbean and MWBC Overrepresentation
Our findings of the persistent overrepresentation of Black Caribbean and MWBC pupils after age 5 controls raise important questions about the drivers of this disproportionality. Black Caribbean and MWBC pupils are more often subject to disciplinary sanctions than other ethnic groups (Strand & Fletcher, 2014), and some authors give primacy to out-of-school cultural factors, arguing that Black Caribbean pupils experience considerable pressure by their peers to adopt the norms of an “urban” or “street” subculture, where more prestige is given to unruly behavior with teachers than to high achievement or effort to succeed (e.g., Foster et al., 1996; Sewell, 2009). Other explanations give primacy to school processes, with greater surveillance and preemptive disciplining by teachers leading to greater staff–pupil conflict and leading some Black Caribbean pupils toward a distinct subculture to resist their differential treatment by schools and teachers (e.g., Rollock, 2007). There was little evidence for the importance of school factors in the current study, but we are focusing here on the primary phase. A parallel study with a national cohort ages 11-to-16 indicates that variation between secondary schools accounts for a significant part of the overrepresentation of Black Caribbean pupils for SEMH (Strand & Lindorff, 2018). Of course, variability in outcomes between schools does not preclude the existence of out-of-school cultural factors that may exacerbate ethnic disproportionality, and the reverse is also true.
Our findings of the persistent overrepresentation of Black Caribbean and MWBC pupils after age 5 controls raise important questions about the drivers of this disproportionality.
Explanations do need to take account of the substantial contrast between Black Caribbean and MWBC pupils on the one hand and Black African pupils on the other, with the latter not overrepresented for SEMH despite the same or higher levels of risk in terms of entitlement to FSM, neighborhood deprivation, and attainment and development at age 5. There are 3 times more Black African pupils in England as there are Black Caribbean pupils (DFE, 2018c), so the data show no simple bias against Black pupils. Similar differences are revealed in school exclusions that indicate Black Caribbean and MWBC pupils (OR = 1.72 and 1.87, respectively) are more likely to be permanently excluded from school than White British pupils, even after controlling for age, gender, SES, and prior attainment, but that Black African pupils (OR = 1.22) are not (Strand & Fletcher, 2014). Equally, Black Caribbean pupils are underrepresented by their teachers in entry to higher-tier examinations compared with White British pupils, but Black African pupils are not, again after a wide range of controls for prior attainment, SES, attitudes, and behavior (Strand, 2012). An important differentiating factor may lie in patterns of immigration, as summarized in the introduction. Most Black Caribbean and MWBC pupils are third-generation U.K.-born, whereas many Black African pupils are more recent immigrants, some of whom have arrived directly from abroad. For example, the 2011 national population census indicates that 60.2% of the Black Caribbean population were born in the United Kingdom, compared with less than one third (32.3%) of the Black African population (Office for National Statistics, 2013). The “immigrant paradigm” (Kao & Thompson, 2003) suggests that immigrants devote themselves more to education than the native population because they lack financial capital and see education as a way out of poverty. In a similar vein, Ogbu (1978) made a distinction between “voluntary minorities” (such as immigrant groups who may be recent arrivals to the country and have very high educational aspirations) and “involuntary” or “caste-like” minorities (such as African Americans or Black Caribbean pupils in England) who have different cultural orientations. Despite high levels of poverty, Black African parents are more likely to be educated to degree level and have high educational aspirations for their children, and Black African pupils report the most positive attitudes to school, the highest levels of aspiration to continue in postcompulsory education, and the highest levels of homework completion of all ethnic groups (Strand, 2011). These data suggest out-of-school cultural factors are important in the disproportionate identification of SEMH.
Conclusions and Implications
This study, with a national longitudinal cohort of over half a million pupils, demonstrates that a substantial element of ethnic disproportionality reflects differences in SES and in early attainment and development and that failing to account for them risks overemphasizing the role of teacher bias in the SEN identification processes. Indeed, most ethnic-minority groups are substantially underrepresented for SEMH and for MLD after controlling for age 5 covariates. Nevertheless, for SEMH, there is overrepresentation of Black Caribbean and MWBC pupils that needs to be explored carefully. First, local authorities and schools should be mindful of both the under- and the overrepresentation in the context of their duties under the Equality Act 2010 (DFE, 2014) and should monitor and evaluate their identification processes with care. Second, the DFE should consider new guidance on criteria for defining different types of SEN, given that the previous guidance (DFES, 2005) no longer exists following the new SEND Code of Practice. Third, we argue that data on ethnic disproportionality should be incorporated into preinspection reports, and the issue should be included in the local authority special educational needs and disability inspections conducted by the Office for Standards in Education.
Although ethnic disproportionality has been our main focus, it is only one factor related to risks of identification of SEN. As well as large associations with gender and SES, we see that pupils who are young for their year group (summer and spring born) are more likely to be identified with MLD than their older (autumn-born) peers. Raised risks for summer-born pupils have also been reported for SLD (Martin et al., 2004); for speech, language, and communication needs (Lindsay & Strand, 2016); and more rarely, for receiving special services under a diagnosis of EBD (Polizzi et al., 2007), though we find no evidence of this regarding SEMH. Teachers need to consider carefully whether they are making sufficient allowance for the age of their younger pupils when forming their judgments, particularly around cognitive development and learning needs. Particularly novel in the English context is our finding that early attainment and development at age 5 is the single strongest predictor of subsequent SEN identification up to age 11. The English government is proposing a new baseline assessment on entry to Reception class at age 4, which will focus on children’s “communication, language, literacy and early mathematics skills” (DFE, 2018b). Our results suggest it should also assess social and emotional behaviors because they are also important, being better predictors than attainment measures for some SEN outcomes. A focus on early risk factors, and on policies like the recent expansion of free early childhood education programs for low-income families and the Early Years Pupil Premium (DFE, 2015a), may do much to address ethnic inequalities in SEN identification.
Limitations
Our results are novel in the English context and important but not without limitations. First, we are dealing here with the school-recorded primary type of SEN. There are no extensive criteria, diagnostic data, assessment evidence, or other records for pupils. Different data sources do not always provide consistent outcomes. For example, the Mental Health of Children and Young People Survey 2017 (National Health Service Digital, 2018), using the Development and Well-Being Assessment Questionnaire, reported rates for behavioral disorders were highest among White British (5.7%) and lowest among Black British (0.7%) and Asian British (0.8%) young people. Further research is necessary to explore divergences between different data sets and approaches to definition of SEN. Second, our national cohort are followed for 6 years but only until the end of primary school. Larger differences may emerge as pupils enter secondary school. Third, our age 5 measures were based on structured teacher assessment rather than standardized tests, though evidence of internal consistency and both concurrent and predictive validity are cited. Fourth, although we believe proficiency in English may be an important variable in understanding the results for our Asian and Black African pupils, we do not have the direct data to confirm this. Fifth, our survival analysis is conducted in a single rather than multilevel model, although it is clear that school-level variables had only a very weak association with SEN identification in this English context. A detailed paper utilizing the full national data set to explore variation at the pupil, school, and local authority levels is in preparation. Finally, we report on any SEN and the high-incidence MLD and SEMH outcomes, but further analysis of lower-incidence SEN would also be informative.
Supplemental Material
sj-docx-1-ecx-10.1177_0014402921990895 – Supplemental material for Ethnic Disproportionality in the Identification of High-Incidence Special Educational Needs: A National Longitudinal Study Ages 5 to 11
Supplemental material, sj-docx-1-ecx-10.1177_0014402921990895 for Ethnic Disproportionality in the Identification of High-Incidence Special Educational Needs: A National Longitudinal Study Ages 5 to 11 by Steve Strand and Ariel Lindorff in Exceptional Children
Footnotes
Authors’ Note
This research was funded by the England Department for Education through its highlight to the Economic and Social Research Council Secondary Data Analysis Initiative (Grant No. ES/P000991/1).
Supplemental Material
Supplemental material for this article is available online.
Notes
References
Supplementary Material
Please find the following supplemental material available below.
For Open Access articles published under a Creative Commons License, all supplemental material carries the same license as the article it is associated with.
For non-Open Access articles published, all supplemental material carries a non-exclusive license, and permission requests for re-use of supplemental material or any part of supplemental material shall be sent directly to the copyright owner as specified in the copyright notice associated with the article.