
Abstract
Home yard and neighbourhood physical environment typologies were identified using data from 1,634 preschool children. Relationships between neighbourhood typologies and preschooler physical activity behaviour were investigated. Physical activity was measured using accelerometry and parent-reported outdoor play. Traffic exposure, street connectivity, public transport, residential density, land use mix, vegetation, blue space and home yard size were measured objectively. Parent perceptions of the neighbourhood were collected using the Neighbourhood Environment Walkability Scale for Youth. Latent profile analysis identified six neighbourhood profiles: ‘No blue space’, ‘Higher blue space’, ‘Higher public transport & destination mix’, ‘Connected residential’, ‘Established’ and ‘Semi-rural’. Living in ‘Higher blue space’ and ‘Semi-rural’ profiles was associated with more minutes of total daily physical activity compared with living in ‘Higher public transport & destination mix’. Further research to understand how urban form varies within and between neighbourhoods by population group and geographic location is needed to guide urban planning and policy.
Introduction
Daily physical activity including outdoor play is critical for preschool children’s physical and mental health and development (Carson et al., 2017; Lambert et al., 2019; Lee et al., 2021; Tremblay et al., 2015; Veldman et al., 2021). Many countries along with the World Health Organisation have developed 24-Hour Movement Guidelines for the Early Years (Australian Government Department of Health, 2019; Tremblay et al., 2017; World Health Organization, 2019). These guidelines recommend children aged 2 to 5 years accumulate at least 3 hr of physical activity per day including energetic play (moderate-to-vigorous physical activity), with 3–5-year-olds needing at least 60 min of energetic play per day. However, many young children do not meet these guidelines, negatively impacting their current and future health and development (Active Healthy Kids Australia, 2022).
The social-ecological model (Stokols, 1996) considers the effect of an individual’s social and physical environment on health behaviours such as physical activity. Three principles underpin social-ecological theory: (1) Health and illness are determined by multiple environmental and personal factors; (2) A person’s home is interrelated to other life settings; and (3) There is an emphasis on a multiple-level and multidisciplinary perspective of health. The level of compatibility between a person and their surroundings is seen as an important predictor of health. The social-ecological model also accepts that the interaction between environment and behaviour can be in multiple directions (Stokols, 1996). Several individual (e.g., child sex and age), social (e.g., parenting practices) and physical environment (e.g., park access) factors have been correlated with preschool children’s physical activity behaviour (De Craemer et al., 2012; Hinkley et al., 2008).
Given the importance of the physical environment to early child health and development (Christian et al., 2015; Villanueva et al., 2016), a comprehensive understanding of how features of the neighbourhood built environment uniquely influence young children’s physical activity behaviour is needed to inform inclusive urban policy and design. An umbrella review (Carlin et al., 2017) of the physical environment determinants of physical activity behaviour across the life course identified that preschool children’s total physical activity was positively associated with home yard space (Robinson et al., 2024), outdoor play equipment at home (Armstrong et al., 2019) and access to neighbourhood parks and playgrounds (Carlin et al., 2017; Gemmell et al., 2022). For example, objectively measured home yard size was positively associated with outdoor play in a large sample of 1,558 preschool children in the PLAYCE cohort study (Robinson et al., 2024). The finding was consistent across high and low household level socio-economic groups (Robinson et al., 2024). Overall, there are relatively few studies of the relationship between neighbourhood-level built environment features, other than park access, and preschooler physical activity behaviour (Carlin et al., 2017). Further studies using objective measures of both the built environment and movement behaviour are required to confirm whether the relationships concur with those found in older school-aged children.
For preschool children who have very little independent mobility, parent’s perceptions of the built environment may play a critical role in shaping their physical activity behaviour. As such, studies conducted in adults show perceptions of the neighbourhood built environment may have a greater influence on physical activity behaviour compared with objective measures (Christian, Knuiman, et al., 2017; Giles-Corti et al., 2013). In a recent study parent perceptions of the neighbourhood environment moderated the relationship between objectively measured neighbourhood environment attributes and preschooler physical activity (Nathan et al., 2023). For example, objectively measured street connectivity was associated with fewer minutes of energetic play when parents perceived pedestrian and traffic safety to be below average (Nathan et al., 2023). These findings highlight the importance of including both parent perceptions and objective measures of the built environment in studies of preschooler physical activity behaviour.
Further, research on the influence of the neighbourhood built environment on physical activity behaviour should consider the combined and interrelated effects of multiple built environment attributes. An example is the walkability index, which includes the combined effects of three built environment attributes, street connectivity, land use mix and residential density (Giles-Corti et al., 2014). However, studies rarely consider the wider aggregated effects of multiple built environment attributes in a neighbourhood. The built environment attributes of a neighbourhood may or may not be correlated and could have synergistic or opposing effects on physical activity behaviour. Furthermore, the influence of different combinations of built environment attributes on physical activity behaviour is likely to be geographically specific. For example, the built environment characteristics of a low-density city such as Perth, Western Australia is very different to a high-density European city such as Copenhagen, Denmark.
It is important to examine the neighbourhood as a whole and compare the makeup of different types of neighbourhoods and their influence on preschooler physical activity behaviour. An innovative method to classify different types of neighbourhoods based on a broad set of neighbourhood attributes is latent profile analysis (LPA; Weden et al., 2011). Such cluster-based statistical techniques can be used to describe patterns of neighbourhood typologies based on a combination of measures of the built environment. Data-driven approaches reflect the pattern of attributes ‘on the ground’ and may therefore provide a fuller picture of neighbourhood environments. Many such studies have been conducted in physical activity with adults with some in adolescents and school-aged children but none to date appear to have been conducted with preschool children. Of the handful of studies conducted in school-aged children the findings have been mixed (DeWeese et al., 2018; Kurka et al., 2015; Timperio et al., 2017; Tu et al., 2016). A study examining patterns of food and physical activity environments using latent class analysis found that children living in neighbourhoods characterised by high residential density, more physical activity facilities, less parks and more healthy and unhealthy food outlets were more likely to walk to destinations (DeWeese et al., 2018). To our knowledge, no studies of neighbourhood typologies using both perceived and objective measures of the built environment and preschooler physical activity have been reported. Thus, this study sought to (i) identify neighbourhood typologies using both parent perceived and objective measures of the home yard and neighbourhood physical environment, and (ii) examine the association with preschool children’s device-measured physical activity and parent-reported outdoor play.
Methods
Study Population and Setting
This study used baseline data (2015–2018) from the Play Spaces and Environments for Children’s Physical Activity (PLAYCE) cohort study (Christian et al., 2016; Christian et al., 2025). The PLAYCE cohort study examined changes in young children’s movement behaviours, the influence of setting-specific (childcare/school, home, neighbourhood) physical, social, and policy environmental factors, and the impact on child health and development outcomes. Children, aged 2 to 5 years, were recruited from childcare centres, within the Perth metropolitan area of Western Australia. Parents provided written informed consent for themselves and their child to participate in the research. Ethics approval was granted by The University of Western Australia Human Research Ethics Committee (RA/4/1/7417 and 2020/ET000353).
Perth, the capital city of Western Australia, is inhabited by approximately 2.3 million residents. The city is characterised by urban sprawl spanning 125 kilometres north to south (6,420 square kilometres), constrained by the Indian Ocean to the west and the Darling scarp to the east. The population density across Perth varies greatly from area to area, however the average population density is 359.7 persons per square kilometre. Perth experiences a Mediterranean climate with hot dry summers and cool wet winters (Australian Bureau of Statistics, 2024).
Device-Measured Physical Activity and Parent-Report Outdoor Play
Children’s physical activity was measured using ActiGraph GT3X+ accelerometers (ActiGraph Corporation, Pensacola, FL USA) worn on the hip during waking hours for 7 days. Raw accelerometer data (30 Hz) was processed using a random forest machine learning model for preschool-aged children developed by Ahmadi, Pavey, and Trost (2020) to estimate daily time sedentary (sitting and lying down), light intensity activities and games (slow walking or ‘pottering about’, standing, standing arts and crafts), walking, running and moderate-to-vigorous activities and games (active games with balls, riding scooters/tricycles).
The random forest physical activity classification model (Ahmadi, Pavey, & Trost, 2020) used in the current study was trained and cross-validated in the foregoing manner: (1) Accelerometer data were collected on 31 preschool-aged children while completing a 20-minute free-living active play session (e.g., family home, park, local green space); (2) Accelerometer data was segmented into 15-second non-overlapping windows and 22 time and frequency domain features in the signal vector magnitude were extracted; (3) Windows were annotated with ground truth labels specifying one of five broad activity classes: sedentary, light-intensity activities and games, walking, running, and moderate-to-vigorous intensity activities and games. The children were video recorded during the free play sessions with a hand-held Go-Pro Hero 5 (GoPro, Inc., San Mateo, CA, USA) camera for subsequent direct observation coding. A two-step coding scheme was implemented in which each child’s movement behaviour was first coded for physical activity intensity using the Children’s Activity Rating Scale (CARS; Puhl et al., 1990) and then activity type based on a list of 23 developmentally appropriate physical activities for preschool-aged children; and (4) The random forest algorithm was trained on the fully annotated dataset, and the resultant models predictions were compared to ground truth using leave-one-out cross-validation.
Cross-validation data (Ahmadi & Trost, 2022) indicated that the random forest classification model predicted walking with acceptable accuracy. Accuracy [F-scores] for each activity class was as follows: 87.7% for SED, 88.2% for light-intensity activities and games, 78.5 % for moderate-to-vigorous activities and games, 79.4% for walking, and 82.6% for running, providing an overall weighted average F-score of 85.9% accuracy. The random forest model exhibited significantly higher agreement with preschooler measured physical activity intensity than cut-point methods and exhibited evidence of equivalence with directly observed time spent sedentary, light-intensity and moderate-to-vigorous physical activity (Ahmadi & Trost, 2022). Further details on the random forest physical activity classification model used have been previously published (Christian et al., 2024).
Non-wear periods were identified by summing the time periods in which the standard deviation of the accelerometer signal vector magnitude was <13 mg for ≥30 consecutive minutes (Ahmadi, Nathan, et al., 2020). Data validation was based on at least 3 weekdays and 1 weekend day with a minimum 8 hr wear time per day (Christian et al., 2016). Daily ‘energetic play’ (moderate-to-vigorous intensity physical activity) was calculated as the sum of minutes of walking, running, and moderate-to-vigorous activities and games. Daily total physical activity was calculated as the sum of minutes of light intensity activities and games and energetic play.
To complement device-based measures of physical activity and provide a more context-specific measure of young children’s physical activity behaviour parent-reported outdoor play was included. Parents completed the PLAYCE survey which included an existing established measure of outdoor play (Burdette et al., 2004). Parents were asked how much time their child spends playing outdoors on a typical day in two locations: in the yard or street around their house; and at a park, playground, or outdoor recreation area. The day was divided into three time periods: wake-up time until noon, noon until 6 pm, and 6 pm until bedtime. Within each time period, the amount of outdoor play was reported using a 5-point scale (0, 1–15, 16–30, 31–60, over 60 min) and were coded 0 through 4. Responses for each question were summed resulting in a score ranging from 0 to 24 (Burdette et al., 2004). The parent survey also collected information on child sex, age and parent education level (secondary school, higher education certificate, or university).
Home Yard and Neighbourhood Physical Environment Variables
Two home yard and nine neighbourhood physical environment variables were calculated using geographic information systems (GIS). These variables were calculated for the same years physical activity was measured (i.e., 2016–2017). Parent perceptions of the neighbourhood physical environment (six variables) were collected using the PLAYCE parent survey.
Outdoor Home Yard Environment
Total yard size (m2) was calculated using data provided by the Western Australian Land Information Authority (Landgate, 2017). It included any portion of the cadastre not part of the building footprint including both the front and back yard. Yard greenness was assessed using four-band (Red, Green, Blue, Infrared) high resolution stereo-ortho-imagery with vegetation classified using a Normalised Vegetation Index (NDVI) thresholding approach (>0.2). Data was provided by the Commonwealth Scientific and Industrial Research Organisation’s (CSIRO) Urban Monitor Program (Caccetta et al., 2012). Vegetation cover (m2) was calculated as the sum of grass (height: <50 cm), shrub (height: 50 cm to 3 m), and tree (height: >3 m) cover (Duncan et al., 2019) then calculated as a percentage of total yard size.
Neighbourhood Physical Environment
All GIS measures of the neighbourhood physical environment, except blue space, were based on a 1,600 m road network buffer (service area), centred around the child’s geocoded residential address. An adult-based road network buffer was chosen due to the very high level of dependency preschool children have on their parents/carers in relation to where they are physically active in their neighbourhood.
Neighbourhood vegetation was calculated in the same way as home yard vegetation: percentage of vegetation (grass, shrub, and tree) of the total service area. The percentage of total area of blue spaces (oceans, river ways, canals, estuaries, lakes, and swamps) within a 1,600 m Euclidean buffer (as the crow flies) from the child’s residential address was calculated (George et al., 2024). Euclidian buffers were used as blue spaces are more often accessed through trails, paths and adjacent beaches or green spaces (George et al., 2024).
All other neighbourhood built environment measures have been previously described (Christian, Ball, et al., 2017; Duncan & Boruff, 2023; Villanueva et al., 2013). Briefly, street connectivity was measured as the number of three-way nodes and number of one-way intersections (i.e., cul de sacs) per square kilometre in a service area. Low road traffic exposure was calculated as the percentage of the length of access (low traffic: ≤3,000 vehicles per day) roads of the total length of all roads in a service area. Public transport stops were measured as the total count of transport stops within a service area. Net residential density was measured as the number of residential dwellings per hectare of total land use area within each service area.
Two measures of land use mix were calculated using data from the Western Australian Land Use and Employment Survey (WA Department of Planning Lands and Heritage, 2022). A measure of service destination mix was calculated by counting the presence of eight different types of services (post office, bank, pharmacy, general practice/medical centre, dentist, community centre/hall, childcare centre, public library; range 0–8). A measure of food outlet mix was calculated by counting the presence of five types of food stores (supermarket, deli, speciality food including meats, fish, fruit, bread, or confectionary, petrol station, and other food stores including health food store; range 0–5).
Parental Perceptions of the Neighbourhood Physical Environment
The PLAYCE parent survey included items from a modified version of the Neighbourhood Environment Walkability Scale for Youth (NEWS-Y) to assess parent perceptions of the neighbourhood environment (Rosenberg et al., 2009). The modified version comprised six of the nine NEWS-Y subscales: (i) pedestrian and traffic safety, (ii) crime safety, (iii) land use mix access (e.g., access to shops, parks, public transport), (iv) street connectivity, (v) walking and cycling facilities, and (vi) neighbourhood aesthetics (Vanwolleghem et al., 2016). Thirteen additional items, which specifically related to young children, such as access to local play equipment, safety of walking with young children during the day and presence of footpaths on both sides of the street, were included across the subscales. Each item was scored on a four-point Likert scale (strongly disagree to strongly agree) with some items reverse-coded so that all items were in the same conceptualised direction. Higher scores represented more positive perceptions of the neighbourhood environment (Robinson et al., 2022).
Analysis
All 17 home yard and neighbourhood physical environment variables were first standardised using z-scores. Latent profiles of the home yard and neighbourhood physical environment and the association with physical activity were determined using the three-step latent profile analysis approach with a distal outcome (Bakk et al., 2013). Standardised home yard and neighbourhood physical environment variables were entered into the latent profile analysis. Models with 1 through 10 profiles were examined to determine the optimal number of profiles. Model selection was based on the log-likelihood (LL); the Akaike Information Criterion (AIC), Consistent Akaike Information Criterion (CAIC), Bayesian Information Criterion (BIC), and sample-size adjusted Bayesian Information Criterion (SABIC) information criteria; entropy, interpretability, posterior probabilities, and profile size. Lower information criterion (LL, AIC, CAIC, BIC, SABIC) indicate better fit, while higher entropy (>0.8) and higher average latent posterior probabilities (>0.9) indicate better fit (Sinha et al., 2021). Characteristics of the emerging profiles were considered to determine whether profiles were qualitatively and quantitatively distinguishable and made conceptual sense within the Perth, Western Australia geographical context. To aid interpretation, participants geocoded residential addresses were mapped onto the Perth metropolitan area by their assigned profile (colour coded). Children were included in latent profile analyses if they had valid age and sex and parent education data and home yard or neighbourhood physical environment variables (n = 1,634); the minimum number of home yard or neighbourhood physical environment variables a child had was five.
Second, children were assigned the most appropriate profile using proportional assignment adjusted for uncertainty when modelling profiles using the Bolck-Croon-Hagenaars (BCH) correction method (Bakk et al., 2013; Bakk & Vermunt, 2016). Third, linear regressions were used to examine the association between assigned latent profiles of the home yard and neighbourhood physical environment and preschooler’s daily minutes of energetic play and total physical activity (as well as the components of sedentary, light intensity activities and games, walking, running, moderate-to-vigorous activities and games) and outdoor play score, adjusting for child age and sex and socio-economic status as measured by parent education. For each physical activity variable, estimated mean differences (95% CI) between profiles and daily mean minutes for each profile are reported. The sample size for analysis of the device-based outcomes was n = 1,108 (after excluding participants who did a not meet accelerometer valid wear time criteria (Ahmadi, Nathan, et al., 2020) and n = 1,545 for parent-reported outdoor play. Data were prepared in Stata v17.0 and the three-step latent profile analysis was undertaken in LatentGOLD 6.0 using the cluster and step3 procedures (Statistical Innovations Inc., 2016).
Results
Overall, 52.1% of preschool children were boys and the median age was 3.3 years. Over half of parents had a university degree (56.5%), 27.7% had a higher education certificate and 15.8% had completed secondary school (Supplementary Table 1). On average, preschoolers engaged in 291.8 (standard deviation (SD) 63.2) minutes sedentary time, 334.3 (SD 46.5) minutes of light intensity activities and games, 17.5 (SD 8.3) minutes walking, 4.3 (SD 2.9) minutes running, 17.7 (SD 10.4) minutes of moderate-to-vigorous activities and games, 39.4 (SD 14.2) minutes of energetic play and 373.7 (SD 51.0) minutes of total physical activity per day. The mean outdoor play score was 9.2 (SD 4.7; Supplementary Table 1). Table 1 presents the summary descriptives of the home yard and neighbourhood physical environment.
Characteristics of the Home and Neighbourhood Physical Environment.
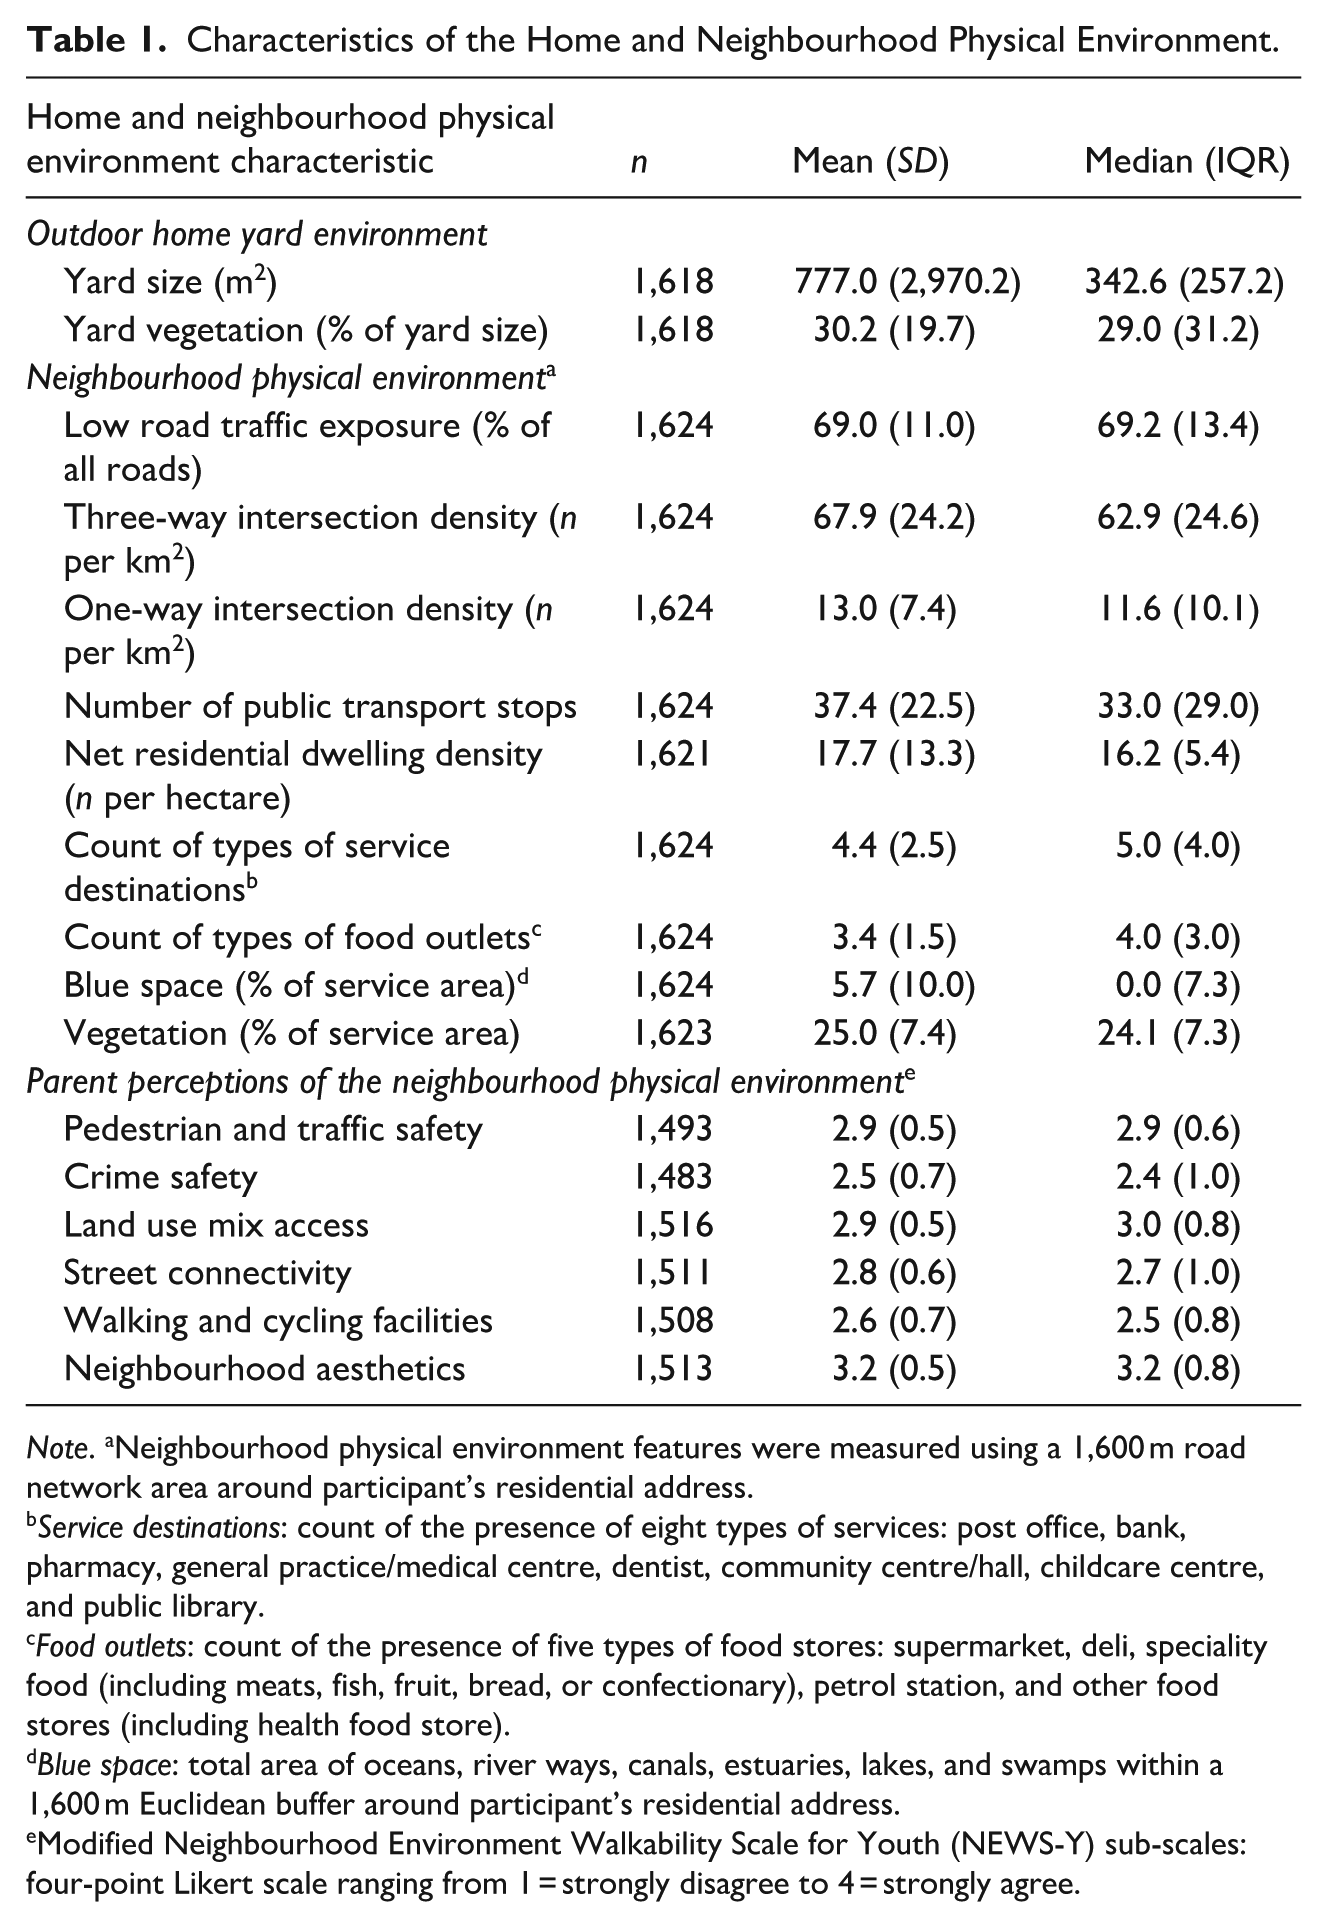
Note. aNeighbourhood physical environment features were measured using a 1,600 m road network area around participant’s residential address.
Service destinations: count of the presence of eight types of services: post office, bank, pharmacy, general practice/medical centre, dentist, community centre/hall, childcare centre, and public library.
Food outlets: count of the presence of five types of food stores: supermarket, deli, speciality food (including meats, fish, fruit, bread, or confectionary), petrol station, and other food stores (including health food store).
Blue space: total area of oceans, river ways, canals, estuaries, lakes, and swamps within a 1,600 m Euclidean buffer around participant’s residential address.
Modified Neighbourhood Environment Walkability Scale for Youth (NEWS-Y) sub-scales: four-point Likert scale ranging from 1 = strongly disagree to 4 = strongly agree.
Latent Profiles of Preschooler’s Home Yard and Neighbourhood Physical Environments
Number of Profiles
Information criterion improved with increasing number of profiles, however the improvements to fit were minimal beyond six profiles (Supplementary Table 2). Entropy declined to three profiles then increased to 10 profiles (except for a decline at seven profiles) but generally remained high (>0.9) and indicative of high levels of classification prediction. Models with six or more profiles included at least one profile with fewer than 5% of the sample, and models with seven, nine, or 10 profiles included a profile with fewer than 2% of the sample. Models with four, five, and six profiles were investigated further for interpretability. The model with six profiles was selected as the best fitting model.
Characteristics of Profiles
Each profile was labelled based on its distinguishing physical environment feature/s relative to the other profiles and knowledge of the study location (Perth, Western Australia). Standardised scores for each profile are displayed in Figure 1, and unstandardised means are displayed in Table 2 and Figure 2. A spatial map of participants by profile is in Figure 3.
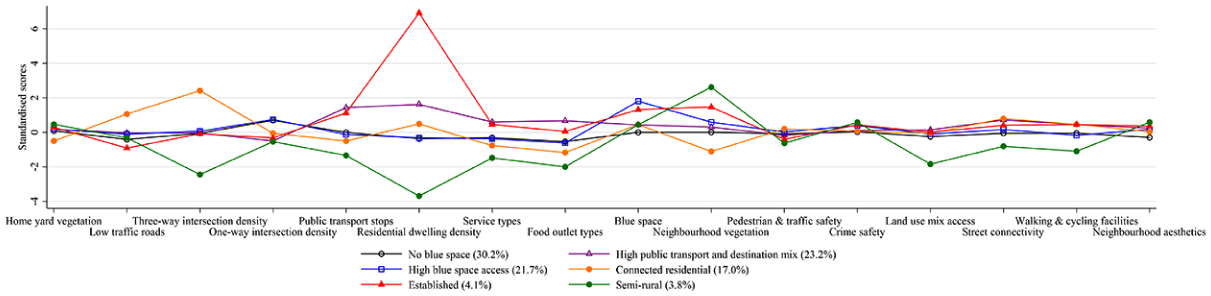
Standardised home yard and neighbourhood physical environment variables scores by latent profile.
Characteristics of the Six Latent Profiles of Preschooler Home and Neighbourhood Physical Environments.
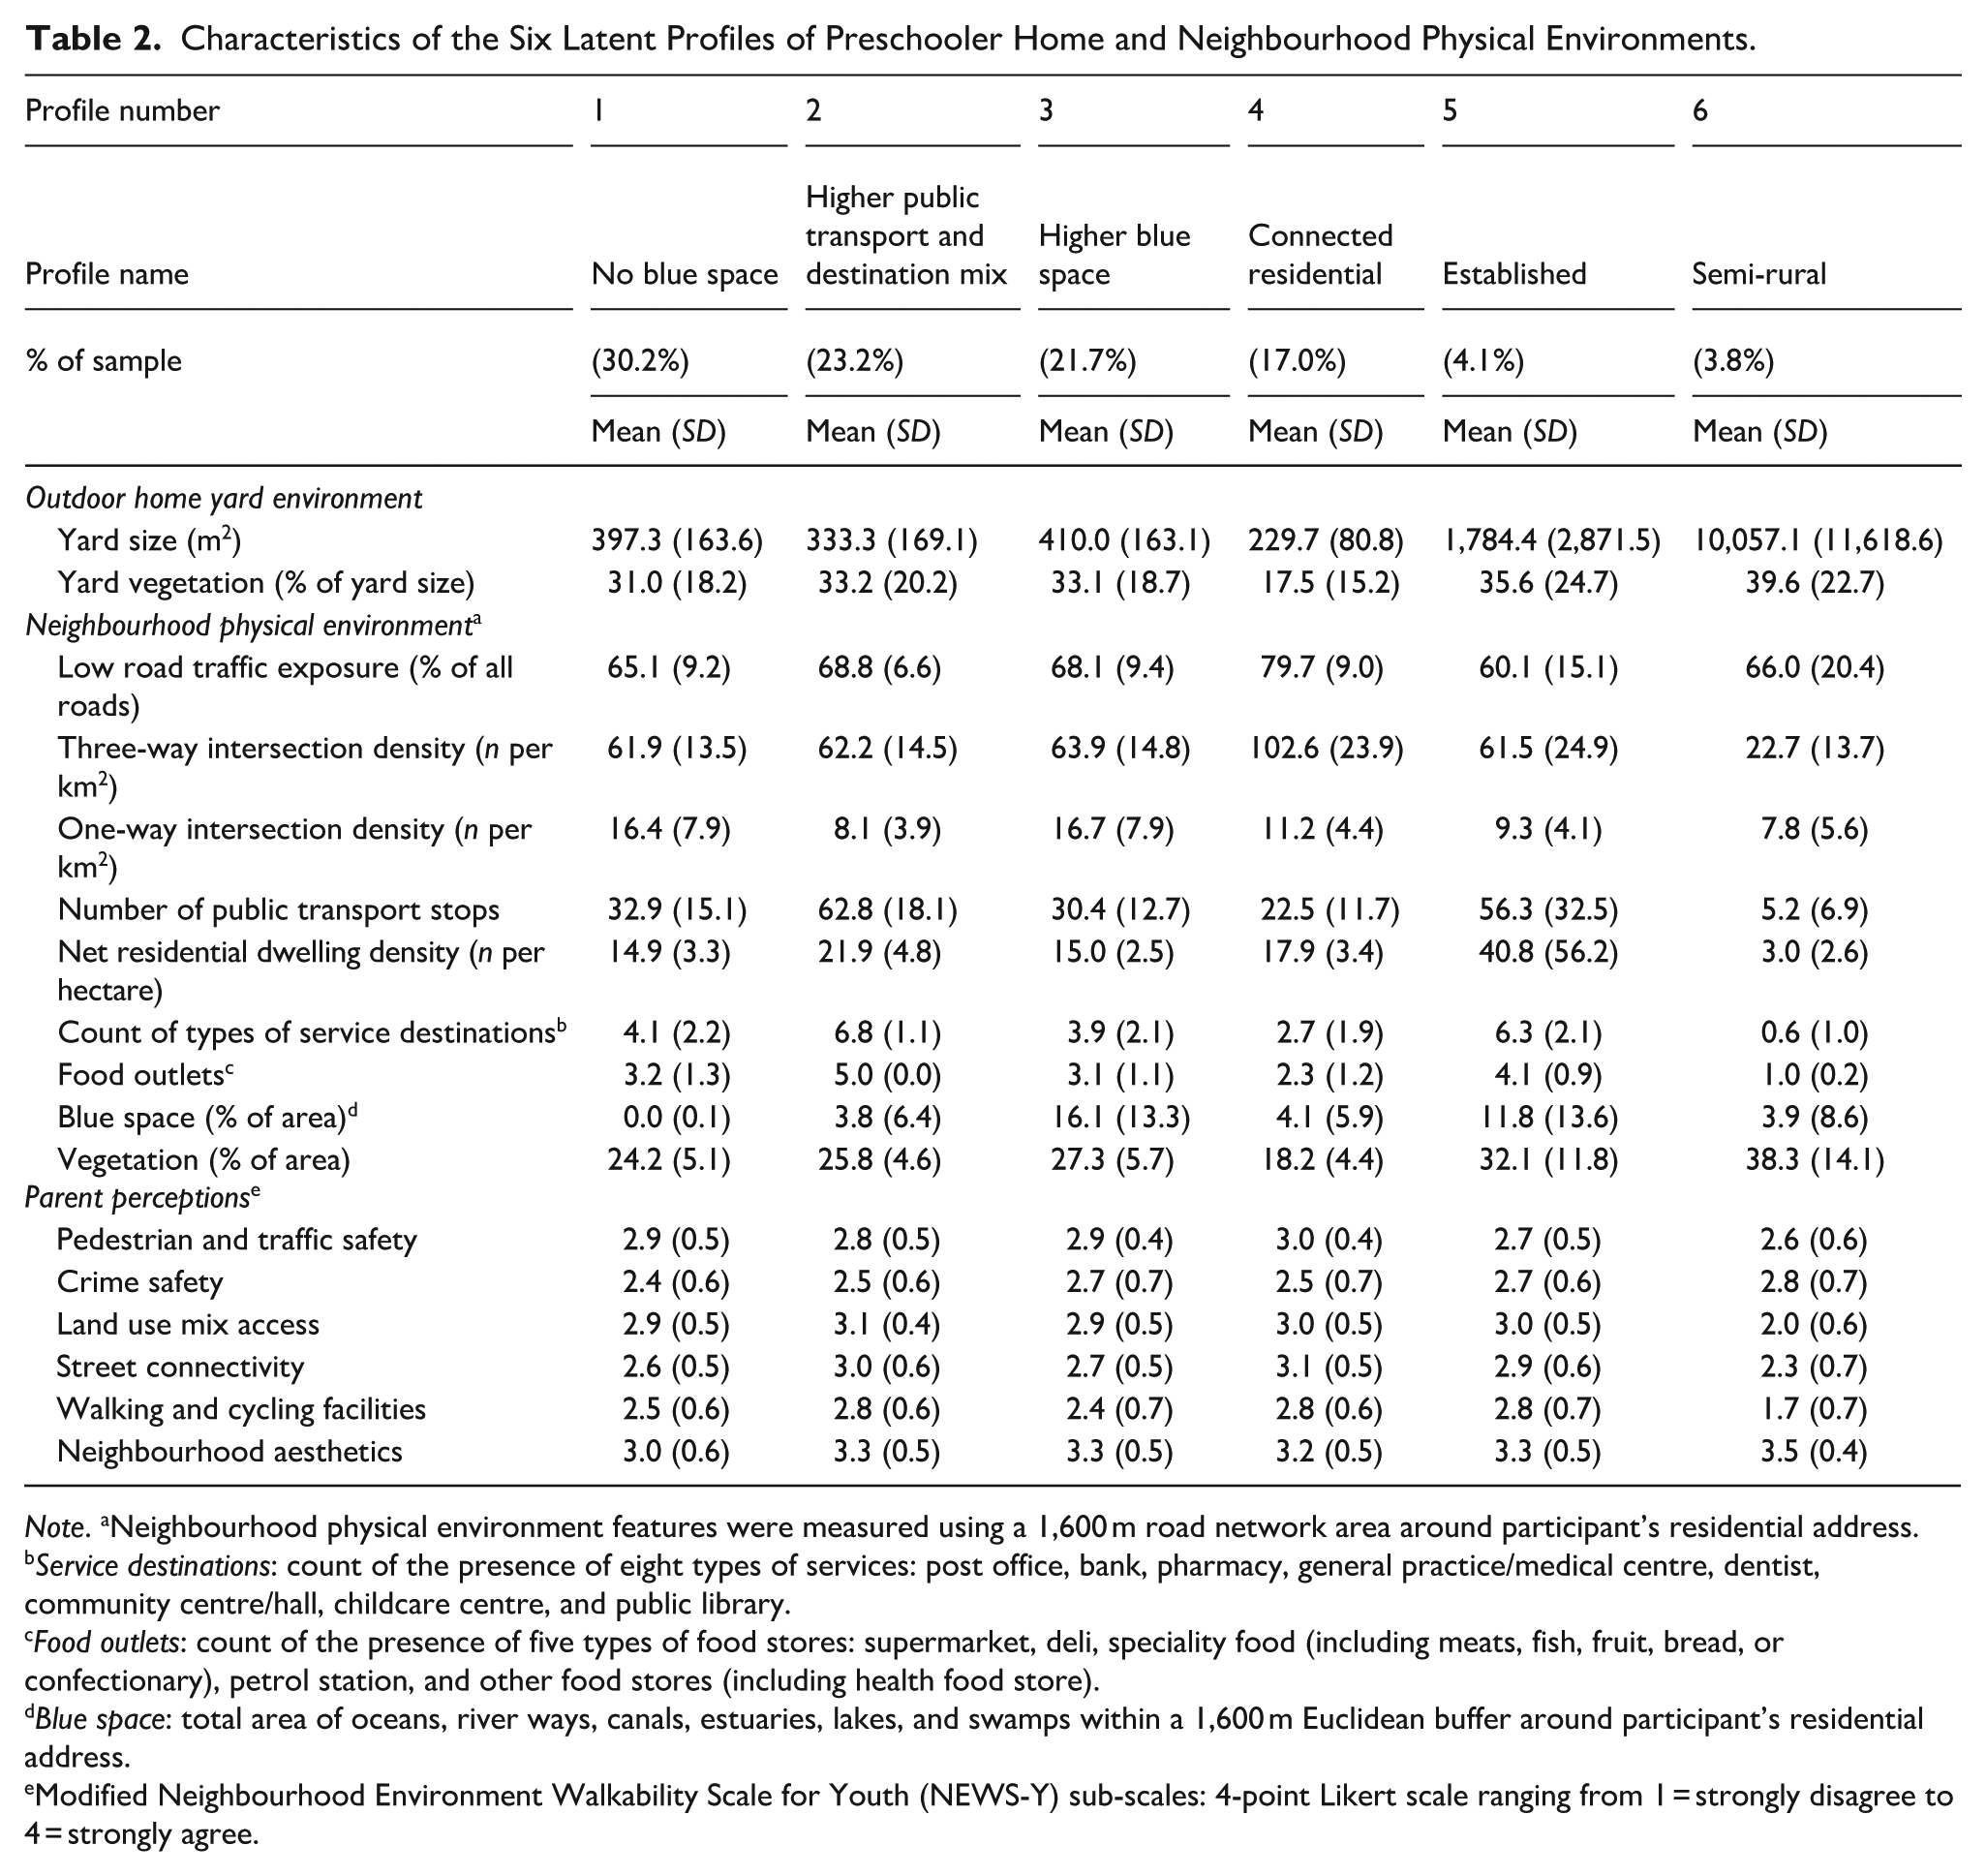
Note. aNeighbourhood physical environment features were measured using a 1,600 m road network area around participant’s residential address.
Service destinations: count of the presence of eight types of services: post office, bank, pharmacy, general practice/medical centre, dentist, community centre/hall, childcare centre, and public library.
Food outlets: count of the presence of five types of food stores: supermarket, deli, speciality food (including meats, fish, fruit, bread, or confectionary), petrol station, and other food stores (including health food store).
Blue space: total area of oceans, river ways, canals, estuaries, lakes, and swamps within a 1,600 m Euclidean buffer around participant’s residential address.
Modified Neighbourhood Environment Walkability Scale for Youth (NEWS-Y) sub-scales: 4-point Likert scale ranging from 1 = strongly disagree to 4 = strongly agree.
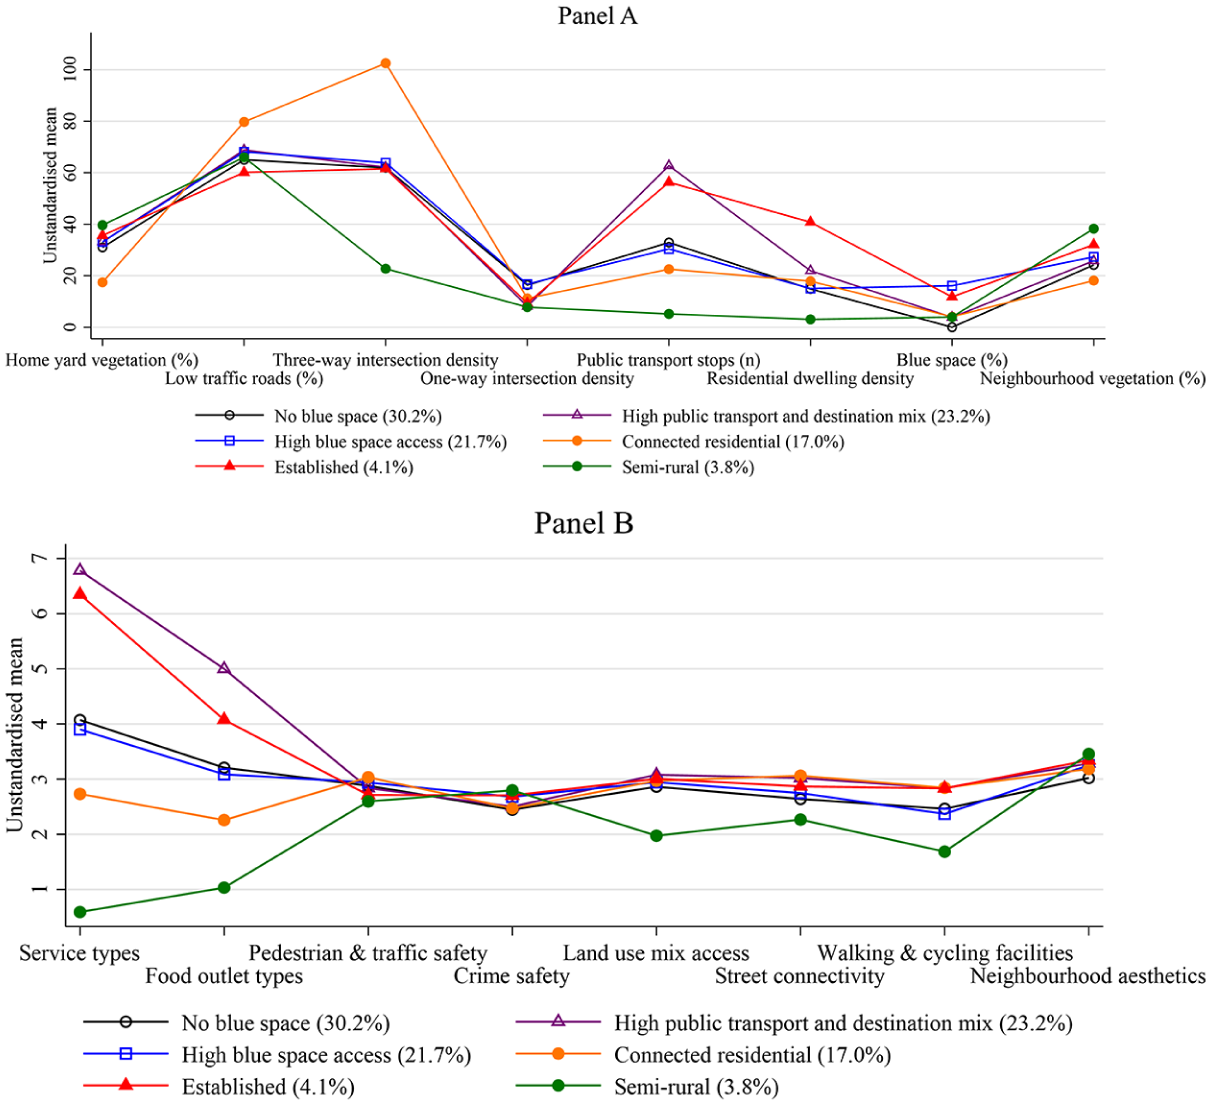
(A) Unstandardised home yard and neighbourhood physical environment GIS derived variables means by latent profile and (B) unstandardised home yard and neighbourhood physical environment GIS derived variables (service and food outlet types) and parent perception variable means by latent profile.
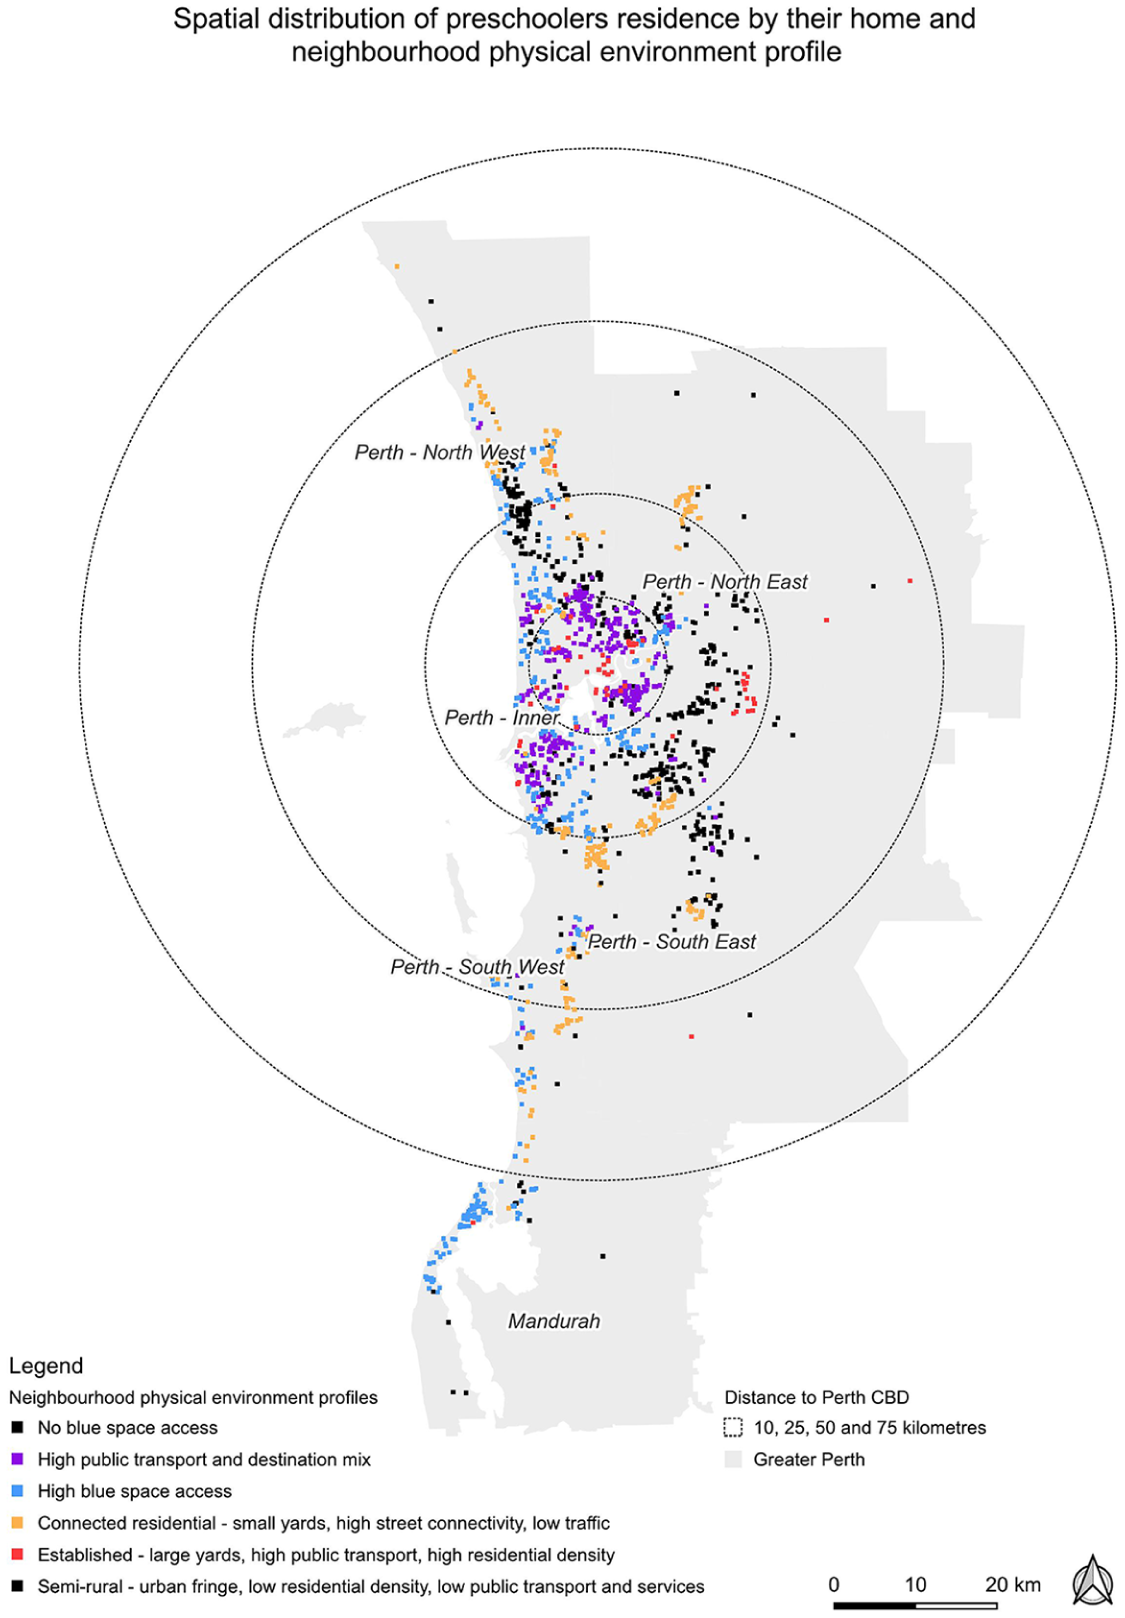
Spatial distribution of preschoolers residence by their home and neighbourhood physical environment profile.
The first profile was labelled ‘No blue space’ and represented 30.2% of preschoolers and was characterised most notably by the absence of any blue space in the neighbourhood. Across all other variables, this profile had values close to the median. The second profile, ‘Higher public transport & destination mix’ (23.2% of preschoolers) was characterised by the highest number of public transport stops and count of service and food outlet destination types, relative to other profiles. The third profile, ‘Higher blue space’ (21.7%), was similar to profile one with values close to the median for most variables, however it had the most blue space compared with the other profiles. The fourth profile, ‘Connected residential’ (17.0%) had the smallest yard size, the highest proportion of low traffic roads, the highest three-way intersection density, and low counts of different types of services and food outlets. The fifth profile, ‘Established’ (4.1%), had large yards, a high number of public transport stops, the highest residential density, and high counts of different types of services and food outlets. Profile five was similar to profile two, except for having larger home yard outdoor areas and higher residential density. The final profile, ‘Semi-rural’ (3.8%), had very large home yard outdoor areas, low three-way intersection density, low residential density, few public transport stops, the highest proportion of neighbourhood vegetation, and few different types of service and food outlets. Profile six also had the lowest parent perception scores for land use mix access, street connectivity, and walking and cycling facilities. Overall, the profiles differed least on home yard vegetation (except for profile four ‘Connected residential’) and parent perception subscales (except for profile six ‘Semi-rural’).
Association Between Latent Profiles of Preschooler’s Home Yard and Neighbourhood Physical Environment and Physical Activity
After adjusting for socio-demographic factors, latent profiles of preschooler’s home yard and neighbourhood physical environment were significantly associated with daily minutes of total physical activity (Wald test p = .029). Children living in the ‘Higher blue space’ and ‘Semi-rural’ profiles had greater daily total physical activity than children in the ‘Higher public transport & destination mix’, by an estimated 13.5 (95% CI 4.1, 22.9) and 26.5 (95% CI 7.2, 45.8) minutes per day, respectively (Table 3). There were no other significant differences between the profiles for daily total physical activity. Children living in the ‘No blue space’, ‘Higher blue space’, ‘Connected residential’ and ‘Semi-rural’ profiles had greater daily minutes of light intensity activities and games than children in the ‘Higher public transport & destination mix’ (all p < .05; range 9–24 min/day; Supplementary Table 3). Profiles were not associated with daily minutes of energetic play (p = .190), walking (p = .220), running (p = .290), moderate-to-vigorous physical activities and games (p = .120), sedentary time (p = .094) or outdoor play score (p = .140).
Coefficients (β, 95% Confidence Intervals) and Mean Daily Minutes of Total Physical Activity and Energetic Play and Outdoor Play Score for Each Latent Profile of Preschooler’s Home and Neighbourhood Physical Environment.
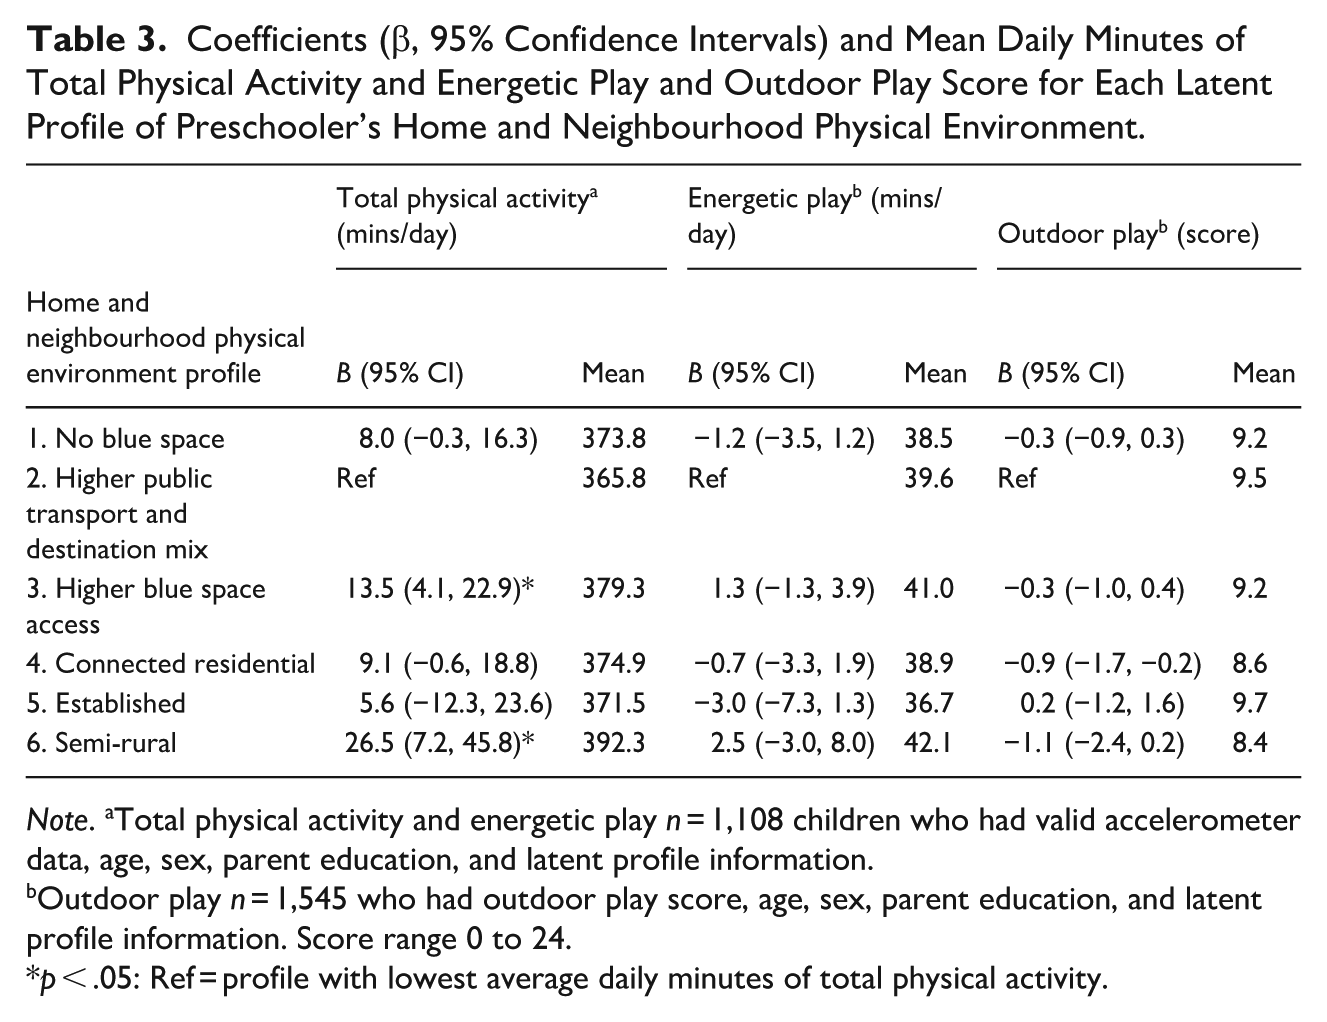
Note. aTotal physical activity and energetic play n = 1,108 children who had valid accelerometer data, age, sex, parent education, and latent profile information.
Outdoor play n = 1,545 who had outdoor play score, age, sex, parent education, and latent profile information. Score range 0 to 24.
p < .05: Ref = profile with lowest average daily minutes of total physical activity.
Discussion
This study sought to identify neighbourhood typologies using parent perceived and objective measures of the home yard and neighbourhood physical environment, and the association with preschool children’s device-measured physical activity and parent-reported outdoor play. Six profiles of preschool children’s home yard and neighbourhood physical environment were identified including ‘No blue space’, ‘Higher blue space’, ‘Higher public transport & destination mix’, ‘Connected residential’, ‘Established’ and ‘Semi-rural’. Preschooler home yard and neighbourhood physical environment profiles were associated with total daily physical activity, in particular light intensity physical activities and games, but not energetic play or outdoor play. Specifically, children in the ‘Higher blue space’ and ‘Semi-rural’ profiles accumulated between 13 and 26 more minutes of total daily physical activity compared with children in the ‘Higher public transport & destination mix’ neighbourhood profile. These findings were largely driven by the contribution light intensity activities and games (e.g., slow walking or ‘pottering about’, standing, standing arts and crafts) make to daily minutes of total physical activity (almost 90%).
Differences in the characteristics of these profiles may explain the observed difference in preschooler total daily minutes of physical activity. The ‘Higher blue space’ and ‘Semi-rural’ profiles had fewer public transport stops and fewer types of service and food outlet destinations compared with the ‘Higher public transport & destination mix’ profile. In addition, the ‘Higher blue space’ profile had greater access to blue spaces and the ‘Semi-rural’ profile had higher levels of neighbourhood vegetation and home yard space, compared with the ‘Higher public transport & destination mix’ profile. Previous research has also shown neighbourhoods with access to blue space are positively associated with light intensity activities and games in preschoolers (George et al., 2024). In addition, a review of the physical environment determinants of physical activity behaviour has shown home yard space is positively associated with young children’s physical activity (Carlin et al., 2017). Our findings lend further support to the social-ecological framework that home yard space and nature-based neighbourhood attributes such as vegetation and water are salient influences on preschooler s’ physical activity behaviour, particularly engagement in light intensity activities and games.
These findings in general support the handful of studies of the relationships between neighbourhood typologies and physical activity in school-aged children (DeWeese et al., 2018; Kurka et al., 2015; Timperio et al., 2017). For example, among school-aged children living in Victoria, Australia, neighbourhood typologies characterised by few playgrounds and sport venues, low intersection density and mixed land use were associated with less moderate-to-vigorous physical activity, compared to other neighbourhood typologies (Timperio et al., 2017). Furthermore, in a study combining GIS, Global Positioning Systems (GPS) and accelerometry data from 168 preschoolers, parks, playgrounds, childcare centres and non-home residences in the neighbourhood were found to have higher levels of daily moderate-to-vigorous physical activity (i.e., they were moderate-to-vigorous physical activity ‘hot spots’; Bai et al., 2023). While it is apparent neighbourhood typologies contain built environment attributes (i.e., parks and playgrounds) known to be associated with children’s physical activity when examined individually, additional studies examining the influence of data driven neighbourhood typologies on preschoolers’ movement behaviours are warranted to confirm these findings, especially in cities with different geographies. Future research should also investigate longitudinal relationships between neighbourhood typologies and movement behaviours across childhood.
Despite efforts to use comparable methodologies in studies of neighbourhood typology and physical activity behaviour, comparison of findings based on the different neighbourhood typologies identified may not be possible. This is due to neighbourhood typologies being specific to the geographical location of the study with limited generalisability to other cities. For instance, it is possible to compare the current study’s findings with other studies conducted in low density cities such as those found in the US, but it would be problematic to compare with high density (and often much older) cities more common throughout Europe. Furthermore, the contribution of built environment attributes such as blue space access may not be relevant for neighbourhood typology studies not conducted in coastal areas.
The six neighbourhood typologies identified in the current study for the most part are specific to families of preschool children living in the Perth, Western Australian metropolitan urban landscape. Specifically, the ‘Higher blue space’ profile represents a typical Perth neighbourhood located along the sprawling Perth coastline or Swan River. In contrast the ‘No blue space’ profile represents a typical Perth neighbourhood without access to blue space (i.e., the beach or Swan River). The ‘Higher public transport & destination mix’ profile was characterised by better land use mix and public transport access and for the most part are located in ‘activity centres’. Activity centres in Perth were designed to have compact urban form and mixed land uses (employment, housing, goods and services) and support active transport (WA Department of Planning Lands and Heritage, 2023). The ‘Established’ profile had the highest residential density with larger yards, better public transport and more land use mix, with most situated in the older and more established (relative to other suburbs) areas of Perth. The ‘Connected residential’ profile included neighbourhoods located in the newer growth areas of Perth characterised by new homes built lot-line to lot-line on smaller blocks, with low traffic and highly connected street networks but little access to shops and services. These areas provide more affordable housing for young families. The last profile, ‘Semi-rural’ included neighbourhoods located on the urban fringe and were characterised by larger blocks with more vegetation and yard space and thus lower residential density. They also had less access to public transport and lower street connectivity and land use mix. While the findings show that neighbourhood profile characteristics such as home yard space and access to green and blue space are associated with preschooler physical activity, it is important to consider the urban planning implications of such findings. It is not feasible particularly for low density cities with high levels of urban sprawl to continue to provide high levels of private (home yard) space. Thus, it is essential with increasing densification that additional safe and attractive public open space is made available close to homes, especially in areas with higher proportions of households with children.
Overall, it is not clear why device-measured energetic play and parent-reported outdoor play were not associated with preschool children’s home yard and neighbourhood physical environment profile. The parent-reported outdoor play checklist measures time spent playing outdoors on a typical day in the yard or street around the house; and at a park, playground, or outdoor recreation area. It is possible this measure is limited because it is parent-reported and/or too specific to the location of outdoor play (i.e., home and park/playground) and thus did not capture outdoor play undertaken in other locations such as blue spaces or that outdoor play is occurring in places outside the neighbourhood. Our previous research using GPS to identify the spatial location of device-based moderate-to-vigorous physical activity in preschoolers showed a key location was other households outside of the neighbourhood (i.e., the homes of relatives and friends; Bai et al., 2023). Further research matching device-based movement behaviour data with GPS data to specifically match behaviours to their environments will help to confirm where young children are more physically active and the profile of the neighbourhood built environments they reside in.
Finally, despite parent perceptions of the neighbourhood built environment being included in each of the six neighbourhood profiles identified, they did not appear to be a defining characteristics of one profile over another. This may in part be due to the limited number of response options used in the Y-NEWS as well as the relatively small amount of variation in the responses provided by parents. Furthermore, the Y-NEWS may be less sensitive at identifying differences in parents’ perceptions of the built environment in the context of preschool aged children or that parent perceptions somewhat moderate the relationship between objective measures of the built environment and young children’s physical activity (Nathan et al., 2023).
Strengths and Limitations
Strengths of this study were its relatively large sample size, focus on an understudied population group (preschool age children), latent profile analysis approach to determine the different combinations of neighbourhood built environment attributes in a geographical area (and the relationship with young children’s physical activity behaviour) and the inclusion of 17 objectively measured (GIS) and parent perceptions of the home yard and neighbourhood physical environment created at the individual-child-level. It was however limited in terms of the generalisability of findings which may only be relevant to other low density coastal cities. Further research in other countries is needed to confirm similarities and identify differences in young children’s profiles of their home yard and neighbourhood physical environment and the relationship with preschool children’s movement behaviours. In addition, other objectively measured and or parent perceptions of the home yard and neighbourhood physical environment not measured may be important to include in future studies (e.g., playground access, quality and use of different neighbourhood physical environment attributes). Future research should also investigate the longitudinal relationship between neighbourhood built environment profiles and movement behaviours across childhood, the multi-level nature of these relationships as well as the role that preschool children’s own level of independence and decision making has on the interaction between young children’s physical activity behaviour and the neighbourhood built environment.
Conclusion
Six profiles of preschool children’s home yard and neighbourhood physical environment were identified with children living in ‘Higher blue space’ and ‘Semi-rural’ profiles accumulating significantly more minutes of total daily physical activity compared with children characterised by the ‘Higher public transport & destination mix’ profile. The findings highlight how urban form can vary across neighbourhoods and by study population and geographic location. Findings from such studies can provide more localised and relevant evidence to support urban planning decisions to support young children (and their families) to establish and maintain positive health behaviours such as physical activity. Overall, neighbourhood profiling approaches can provide a ‘real world’ and geographically specific and locally relevant approach to examining the influence of the built environment on child movement behaviour.
Supplemental Material
sj-docx-1-eab-10.1177_00139165251375176 – Supplemental material for Home Yard and Neighbourhood Physical Environment Latent Class Profiles and Preschooler’s Physical Activity Behaviour: Findings from the PLAYCE Study
Supplemental material, sj-docx-1-eab-10.1177_00139165251375176 for Home Yard and Neighbourhood Physical Environment Latent Class Profiles and Preschooler’s Physical Activity Behaviour: Findings from the PLAYCE Study by Hayley Christian, Emma Adams, Stewart Trost, Jasper Schipperijn, Kevin Murray, Bryan Boruff, Andrea Nathan, Gareth Stratton and Trina Robinson in Environment and Behavior
Footnotes
Acknowledgements
The BEACHES Project is a joint initiative between The Kids Research Institute Australia, The University of Western Australia, and Swansea University, with collaborators from Curtin University, Monash University, The Queensland University of Technology, University of Southern Denmark, WA Department of Local Government, Sports and Cultural Industries, WA Department of Health, WA Department of Transport, WA Local Government Association, Australian Childcare Alliance, Nature Play Australia, Heart Foundation, The PLAY Spaces and Environments for Children’s Physical Activity (PLAYCE) cohort study, Cancer Council WA, Goodstart Early Learning, and Hames Sharley. Bridget Beesley, Dr John Duncan and Dr Claire Boulange are gratefully acknowledged for their work on the geospatial measures and map.
The PLAYCE cohort study research team would like to thank our project team members who helped to collect and prepare the data, participating ECEC services investigators (Prof Michael Rosenberg, A/Prof Leanne Lester, Prof Gina Trapp, Dr Clover Maitland and Dr Ashleigh Thornton) and partners: the National Heart Foundation, Western Australian (WA) Department of Health, WA Department of Local Government, Sport and Cultural Industries, WA Department of Transport, WA Local Government Association, Cancer Council WA, Nature Play WA, Australian Childcare Alliance (WA), UWA Childcare, Goodstart Early Learning, Maragon Early Learning, Sonas Early Learning & Care, Mercy Care, Great Beginnings Early Education, Jellybeans Child Care & Kindy, Buggles Early Learning and Kindy and ArborCarbon who provided in-kind support. We thank the families who participated in the PLAYCE cohort study for their time and commitment.
Ethical Considerations
Ethics approval was granted by The University of Western Australia Human Research Ethics Committee (RA/4/1/ 7417 and 2020/ET000353). Parents provided written informed consent for themselves and their child to participate.
Author Contributions
HC: conceptualisation, methodology, investigation, writing – original draft, writing – review and editing, supervision, project administration, funding acquisition. EA: methodology, formal analysis, writing – original draft, writing – review and editing. SGT: conceptualisation, methodology, writing – review and editing, funding acquisition. JS: conceptualisation, writing – review and editing, funding acquisition. KM: conceptualisation, methodology, writing – review and editing, funding acquisition. BB: conceptualisation, methodology, writing – review and editing, funding acquisition. AN: conceptualisation, methodology, investigation, writing – review and editing. GS: conceptualisation, writing – review and editing, funding acquisition. TR: data curation, project administration, writing – review and editing. All authors read and approved the final manuscript.
Funding
The authors disclosed receipt of the following financial support for the research, authorship, and/or publication of this article: This work is part of the BEACHES Project which is a joint initiative between The Kids Research Institute Australia, The University of Western Australia and Swansea University. The BEACHES Project is funded by the UKRI-NHMRC Built Environment Prevention Research Scheme (GNT1192764 and MR/T039329/1) and partially supported by the Australian Government through the Australian Research Council’s Centre of Excellence for Children and Families over the Life Course (CE200100025). The PLAYCE cohort study was funded by the Western Australian Health Promotion Foundation (Healthway; 24219 and 32018) and part-funded by UKRI-NHMRC Built Environment Prevention Research Scheme (GNT1192764 and MR/T039329/1). This work is supported by the Western Australian Future Health Research and Innovation Fund (Grant ID WACSOSP2023-2024/4). Hayley Christian is supported by an Australian National Heart Foundation Future Leader Fellowship (102549) and The Kids Research Institute Australia – Ascend Senior Research Fellowship. Emma Adams is supported by an Australian Government Research Training Program Fees Offset and Australian Government Research Training Program Stipend, a UWA and Graduate Women (WA) Research Scholarship, and a Stan and Jean Perron Top Up Scholarship.
Declaration of Conflicting Interests
The authors declared no potential conflicts of interest with respect to the research, authorship, and/or publication of this article.
Data Availability Statement
The datasets used during the current study are available through application to the PLAYCE study.
Supplemental Material
Supplemental material for this article is available online.
Author Biographies
References
Supplementary Material
Please find the following supplemental material available below.
For Open Access articles published under a Creative Commons License, all supplemental material carries the same license as the article it is associated with.
For non-Open Access articles published, all supplemental material carries a non-exclusive license, and permission requests for re-use of supplemental material or any part of supplemental material shall be sent directly to the copyright owner as specified in the copyright notice associated with the article.