
Abstract
Urban parks are essential for sustainable urban planning, but their usage patterns remain complex. This meta-analysis of 30 studies identifies factors influencing park visitor volume, focusing on park attributes, neighborhood environments, and temporal aspects. Random-effect models reveal positive associations with park size, diverse facilities, organized activities, trails, maintenance, and quality. Neighborhood population density and points of interest also increase visitation, while socio-economically disadvantaged areas see reduced use. Temporal factors, such as time of day and season, significantly shape patterns. However, features like water, greenness, crime safety, and transit accessibility show mixed or insignificant effects. Regional differences highlight stronger impacts of population density and transit accessibility in the U.S. compared to Asian studies. These findings provide actionable insights for urban planners and landscape architects to design parks that cater to diverse needs, boost visitation, and maximize their community benefits.
Introduction
Urban parks are vital public assets, significantly contributing to residents’ quality of life, public health, social equity, and sustainable urban development. Their potential benefits, however, depend heavily on how these parks are used and by whom. Park usage patterns are complex and dynamic, influenced by interconnected factors, including park features, neighborhood characteristics, and temporal variations (Kaczynski & Henderson, 2008; McCormack et al., 2010; J. Zhao et al., 2024). Understanding these factors is essential for planners and managers to design and manage urban parks effectively to serve diverse communities.
Despite considerable research interest, findings regarding the factors influencing park visitor volume remain fragmented and inconsistent. Previous research has yielded contradictory results about the role of park attributes. For instance, some studies identify park size and facilities as critical drivers of visitation (Donahue et al., 2018; Huai et al., 2023; Liu et al., 2023), while others have reported weak or insignificant relationships (Can Traunmüller et al., 2023; D. A. Cohen et al., 2012). Similarly, neighborhood characteristics like socioeconomic status and racial/ethnic composition are frequently linked to disparities in park usage (Baran et al., 2014; D. A. Cohen et al., 2012; Park, 2020; Van Dyck et al., 2013), but the strength and direction of these associations vary considerably across contexts. Moreover, temporal factors like time of day and seasonality shape park usage rhythms, but have been less studied (D. A. Cohen et al., 2012; Huang et al., 2020; Wei et al., 2023). Such inconsistencies pose substantial challenges for evidence-based park planning and management. Without a systematic synthesis, it remains unclear which factors planners should prioritize to optimize park visitation.
While several systematic reviews have explored factors influencing park use, these studies have limitations that restrict comprehensive and generalizable conclusions. For example, a review of 25 studies on park-based physical activities highlights key environmental features influencing physical activity (e.g., trails, lighting, reduced incivilities) but remains inconclusive regarding greenness and park size (R. Zhang et al., 2019). Zabelskyte et al. (2022) summarized studies using social media data, finding influences from aesthetic quality and recreational facilities, yet this approach limits generalizability due to methodological constraints of data sources. McCormack et al. (2010) review qualitative studies, illustrating how perceptions of safety, aesthetics, and amenities interact with social contexts to shape park use. More recently, J. Zhao et al. (2024) review 20 articles about neighborhood parks and emphasize the interplay of factors such as accessibility, safety, and park quality, but did not employ quantitative synthesis methods.
This indicates a critical research gap—a comprehensive and quantitative synthesis that systematically evaluates the relative importance and consistency of environmental and temporal factors influencing park visitor volume across diverse contexts is missing. While multiple metrics (e.g., visit frequency, accessibility, satisfaction) contribute to comprehensive park planning, visitor volume represents a critical dimension that captures urban vitality and efficient public investment outcomes. Our focus on this specific metric allows for systematic comparison across studies while acknowledging its complementary relationship with other planning objectives. Without such synthesis, urban planners and landscape architects lack clear, actionable guidelines for park design and management decisions.
Meta-analysis offers a powerful tool to address this gap by synthesizing existing evidence systematically, assessing the magnitude and consistency of relationships, and exploring potential moderating variables (Harrer et al., 2022; Lipsey & Wilson, 2001; Stanley & Doucouliagos, 2012). Previous meta-analyses have focused on specific park-related outcomes, such as cooling effects (Rahman et al., 2020), neighborhood socio-demographics (Gerrish & Watkins, 2018), or economic values (Bockarjova et al., 2020; Brander & Koetse, 2011), but none have systematically examined the comprehensive set of environmental and temporal factors influencing overall park use. Our meta-analysis addresses this critical gap by aggregating and quantitatively analyzing the growing body of literature on park visitor volume.
Our study examines three research questions: (1) Which park attributes, neighborhood characteristics, and temporal factors are consistently associated with park visitor volume across studies? (2) What are the magnitudes and directions of these associations? (3) Do these associations vary by study location or regional context? By quantifying these relationships, our meta-analysis aims to enhance theoretical understanding and provide robust, evidence-based guidance.
Ultimately, our findings offer practical insights to support strategic decision-making in park design and management. By clarifying which park and neighborhood characteristics consistently attract visitors, planners and landscape architects can ensure urban parks more effectively deliver intended health, social, and environmental benefits to diverse populations.
Methods
This meta-analysis uses the PRISMA 2020 framework (Page et al., 2021). We include studies examining factors associated with park user volume. Park user volume is measured mostly as either the number of park visitors at a certain time or social media check-ins and posts. An eligible study design is a statistical analysis of park user volume reporting regression models between environmental factors (within or outside of a park) and park user volume. For meta-analysis, each study should report regression coefficients and standard error (or t-statistics) (Harrer et al., 2022). When such statistics were unavailable, we contacted authors, and a few provided the data. We only included full-length peer-reviewed articles published in English.
A systematic search is carried out in two academic databases, Scopus and Web of Science. Google Scholar is another popular platform for literature review, but was not included because it retrieves a large proportion of non-peer-reviewed and non-English sources, making it less suitable for this meta-analysis (Gusenbauer & Haddaway, 2020; Martín-Martín et al., 2018). The search terms are formed by the combination of words that describe types of parks (parks, urban parks, neighborhood parks, regional parks, community parks, city parks, linear parks, public parks, nature parks, natural parks, green space, greenway, open space, public space) and usage-related terms (use, utilization, underuse, non-use, visitation, vibrant, lively, popular). The initial search was done on May 23–30, 2023, and updated on June 1–6, 2024.
All search results (n = 37,629) were imported into Zotero software, and duplicate records were removed, after which 18,185 articles remained (Figure 1). Initial title screening reduced the pool to 4,624 articles, of which 164 remained after abstract review for full-text assessment. A full-text review further removed 90 papers. Once the draft list is confirmed, their reference lists were reviewed for further search, which added 13 papers. Finally, an in-depth assessment removed 57 additional papers for one of the three reasons: total park user volume is not measured (e.g., they measure park visit frequency through surveys), regression models are unavailable or inappropriate (e.g., bivariate tests), or standard errors or t-statistics are unavailable. As a result, the final sample includes 30 papers (Figure 1). In three papers, we included multiple models when they use distinctive data sources (e.g., direct observation vs. social media). Thus, this meta-analysis includes 33 regression models of park user volume from the 30 papers.
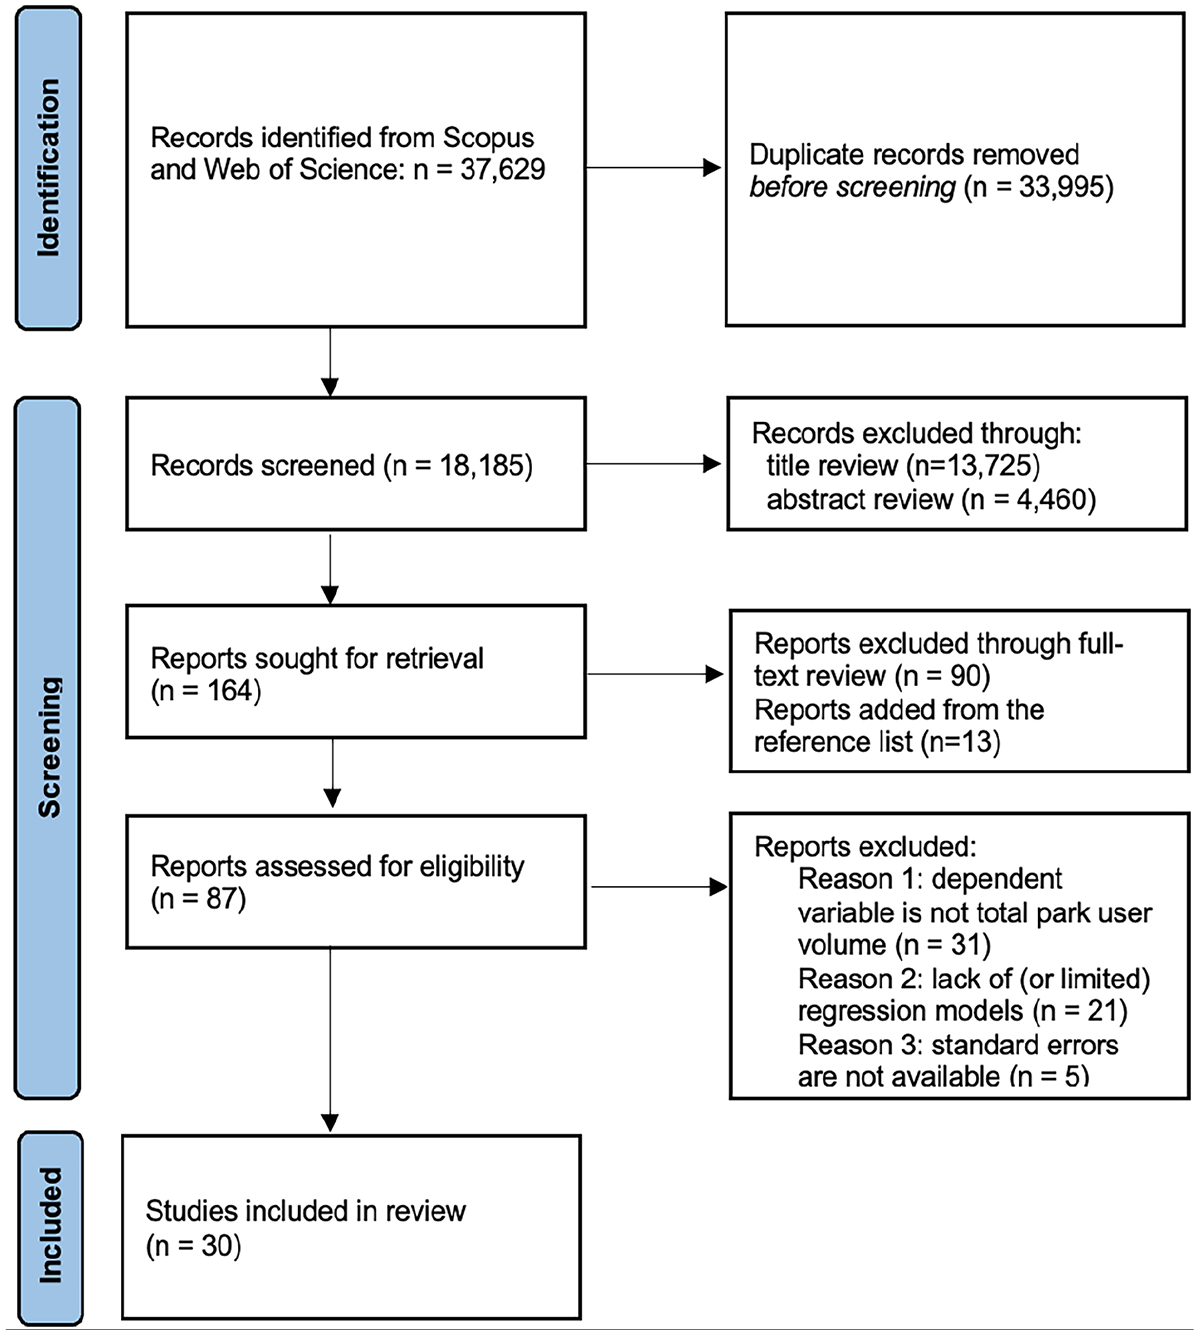
PRISMA 2020 flow diagram for this meta-analysis.
The selected articles are read thoroughly, and certain items were extracted, including: publication year, publication journal, study location, data source, data type (i.e., mobile GPS data, social media data, observational data, etc.), data analysis and statistical methods used, type of study site, number of study sites, interpretation and/or measurement of park usage, factors influencing park usage, and implications for theory and practice. The data extraction process began with two assessors iteratively developing the data extraction method and the final sheet. We developed the criteria, extracted data from five randomly selected papers separately, and discussed any disagreements and ambiguities. Then, the two authors met every time one of them processed 10–20 papers, to discuss the extracted data and to address further areas for clarification. This process ensures the inter-rater reliability of the extracted data as well as its robustness.
To summarize effect size, this meta-analysis utilizes UWLS+3 (unrestricted weighted least squares), an adjusted version of the partial correlation coefficient (PCC) (Stanley & Doucouliagos, 2012; Stanley et al., 2024). This adjustment specifically addresses biases common in meta-analyses of PCCs, particularly those associated with small sample sizes. The UWLS+3 method corrects the degrees of freedom by adding three, as shown in the equation:

where
This approach using UWLS+3 is particularly valuable for synthesizing studies with diverse operationalizations of park user volume, as it standardizes the relationship strength between predictors and outcomes regardless of how usage was measured (e.g., direct observational counts, social media metrics, or specialized indices). By focusing on effect sizes rather than raw metrics, we compare across methodologically heterogeneous studies examining the same conceptual relationships. To aid interpretation of our effect sizes, we applied J. Cohen’s (2013) widely-accepted guidelines: partial correlation coefficients below .10 were considered “very small,” .10 to .29 “small,” .30 to .49 “moderate,” and values ≥.50 “strong” or “large.”
The degrees of freedom are low in several studies. For example, in three studies (D. Chen et al., 2021; Huang et al., 2020; Van Hecke et al., 2016), the number of parks is fewer than the number of independent variables, primarily due to multiple observations per park. To balance statistical robustness and flexibility, we set a minimum degree of freedom (n−j−1) at 5. A sensitivity analysis with a minimum degree of freedom set at 10 yielded nearly identical results (see Supplemental Materials).
We synthesized effect sizes using a random-effects model to account for between-study heterogeneity, as we expected the true effect sizes to vary across studies due to differences in study characteristics, such as sample sizes, measurement methods, and contextual factors (Borenstein et al., 2010). The heterogeneity variance (τ²) was estimated via the Restricted Maximum Likelihood (REML) method (Viechtbauer, 2005). The analyses were conducted using the metafor package in R 4.4.1.
We applied inverse-variance weighting, where each study’s effect size was weighted by the inverse of its variance. To ensure accurate estimates of imprecision, Hartung–Knapp adjustments were used to calculate confidence intervals around the pooled effect size, resulting in a robust synthesis of the data (Hartung & Knapp, 2001). For each model, we calculated the I2 statistic, which quantifies the percentage of total variation across studies due to heterogeneity (Higgins & Thompson, 2002): values around 25% indicate low heterogeneity, 50% moderate, and 75% substantial, acknowledging that the interpretation of I2 is sensitive to the precision of the included studies.
Publication bias occurs when studies with significant or favorable results are more likely to be published and thus, can distort the findings of meta-analyses by overestimating true effects. To address this, we employed Rücker et al.’s (2011) Limit Meta-Analysis Method. Rücker’s method extends the random-effects model by incorporating a bias term, allowing for an adjusted effect size that mitigates potential publication bias.
Results
Study Characteristics
Table 1 lists included studies (30 studies and 33 models) and their information. Most studies were published in 2020 or after (n = 20 or 67%), while only Loukaitou-Sideris and Sideris (2009) was published before 2010. It shows that statistical modelling of park user volume became more available recently, thanks to the development of direct observation protocols, particularly SOPARC (McKenzie et al., 2006), and data availability from social media or mobile services.
List of Included Studies (30 Studies and 33 Models) and Their Characteristics.
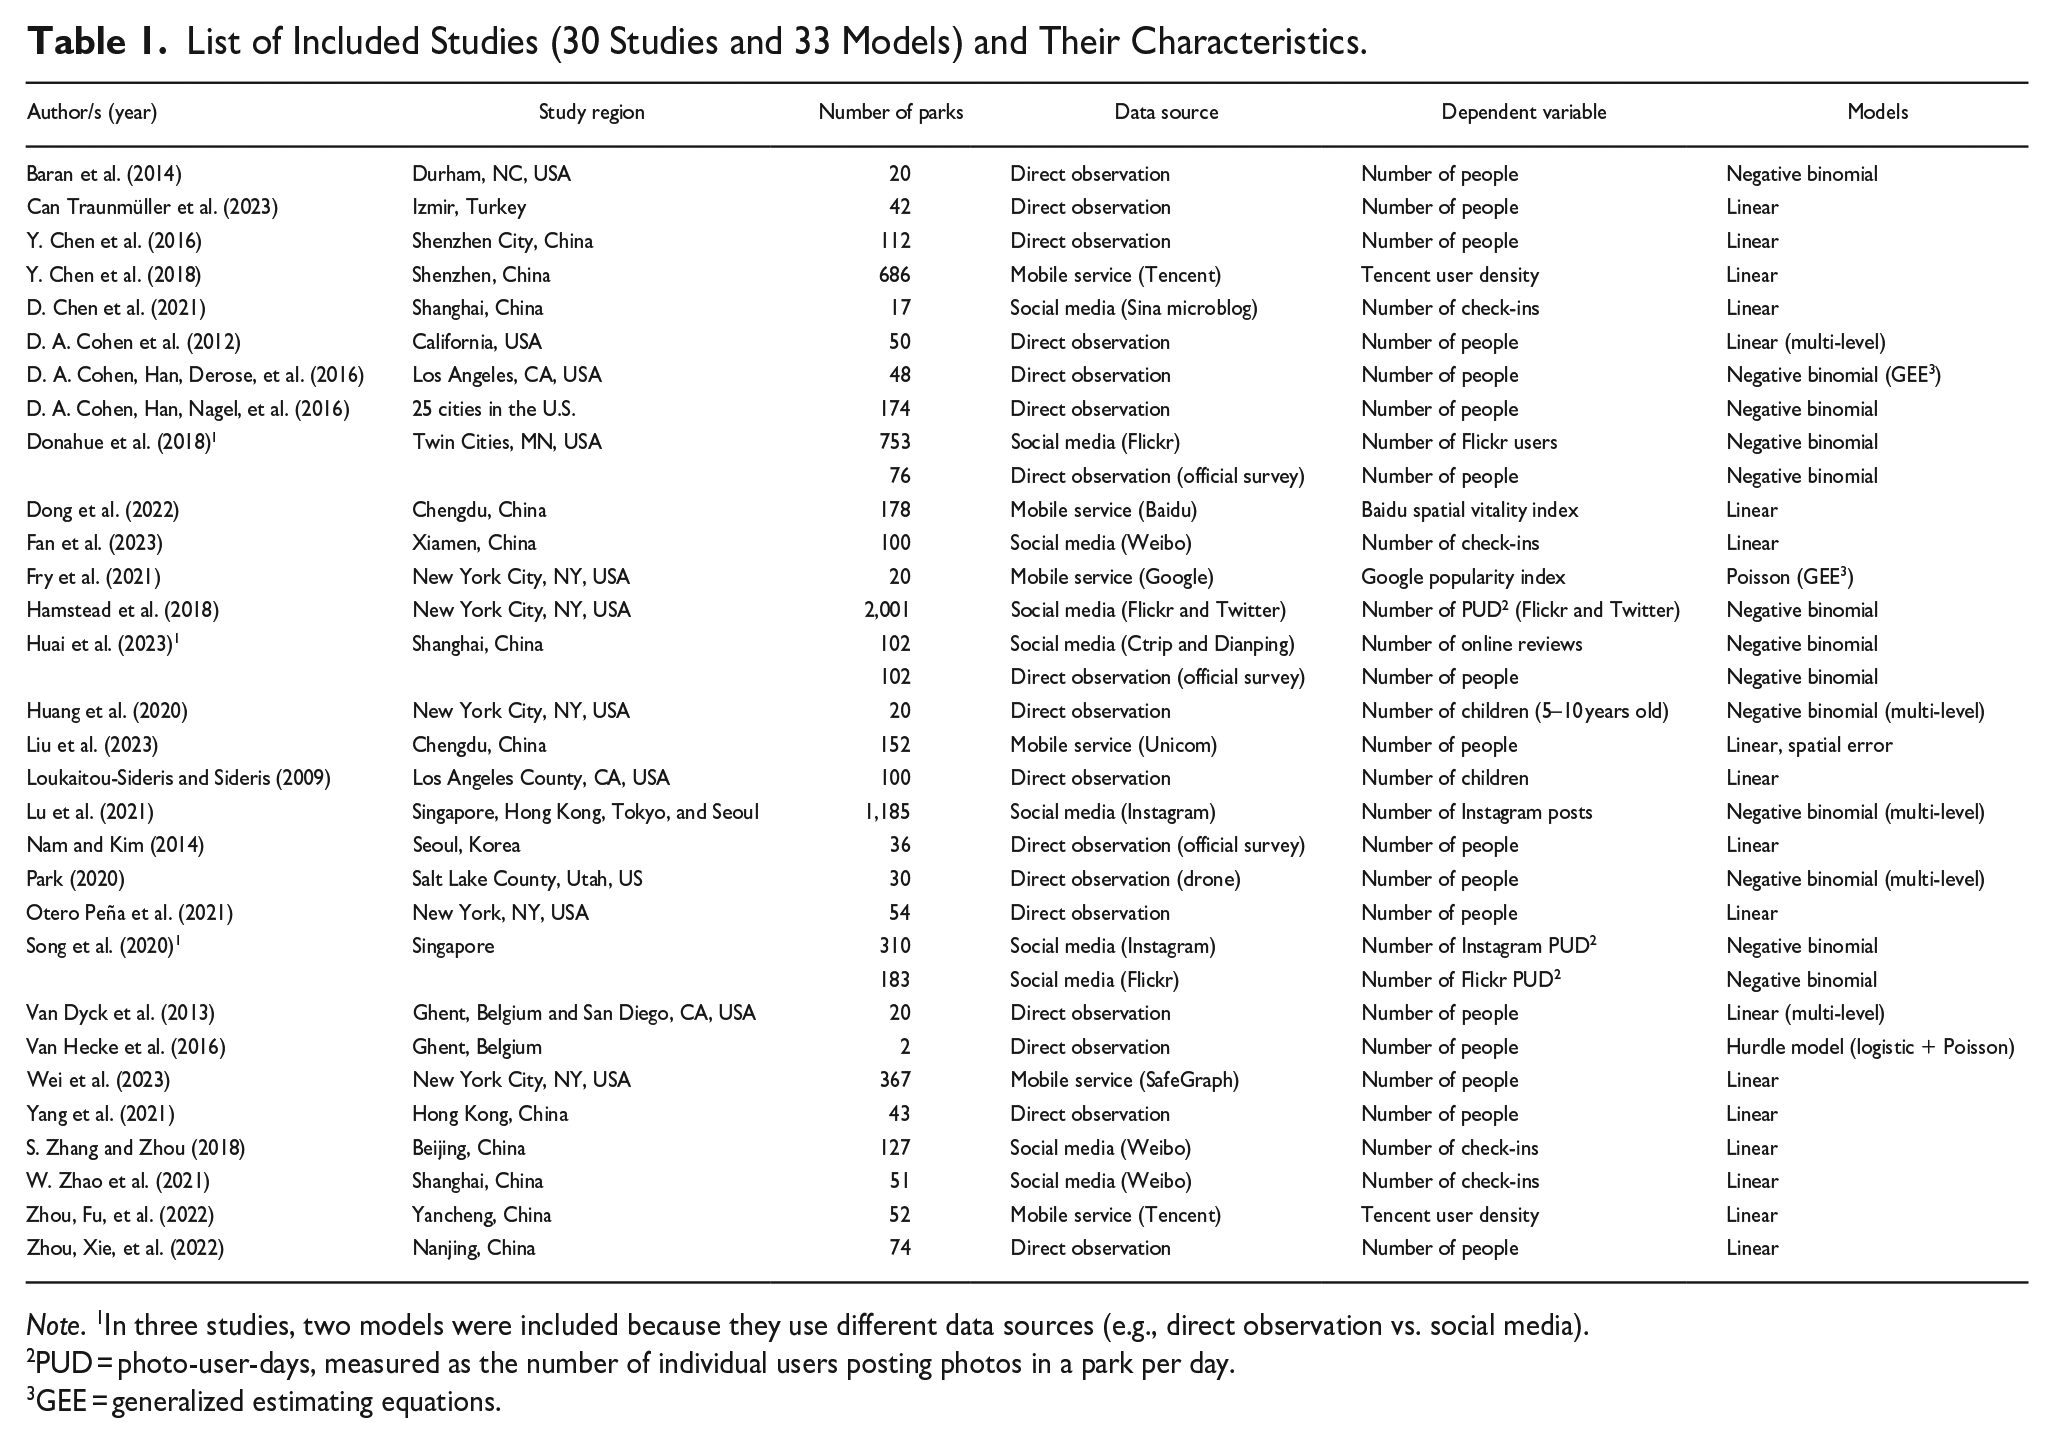
Note. 1In three studies, two models were included because they use different data sources (e.g., direct observation vs. social media).
PUD = photo-user-days, measured as the number of individual users posting photos in a park per day.
GEE = generalized estimating equations.
China and the USA include the most studies (12 studies or 40% each), while other countries (e.g., Singapore, Korea) have only one or two studies, and two studies include multiple countries (four Asian cities in Lu et al., 2021 and Belgium and USA in Van Dyck et al., 2013). The included studies cover an average of 224 parks (minimum: 2, maximum: 2,143, median: 76).
Park user volume was measured through three methodological approaches: direct observation (n = 17; 51%), social media (e.g., Weibo, Flickr, Twitter, Instagram; n = 10; 30%), and mobile services (e.g., SafeGraph, Tencent, Unicom; n = 6; 18%) (Figure 2). Accordingly, dependent variables also vary, from the number of people to the number of check-ins or the number of photo-user-day (from social media data), and to certain density indexes in mobile service data.
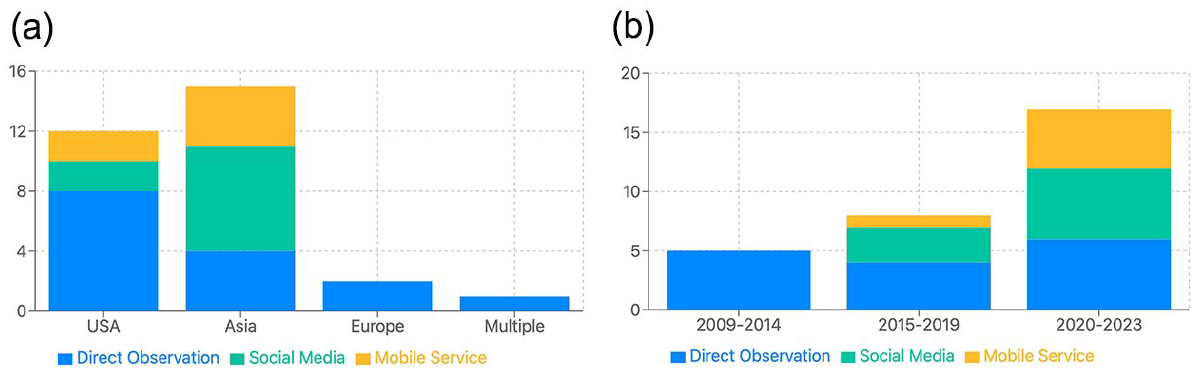
Number of studies by data collection methods and study region (a) and time (b).
Direct observational measures (e.g., Baran et al., 2014; D. A. Cohen et al., 2012; Park, 2020) involved systematic counts of individuals within park boundaries during specified time periods, typically employing standardized protocols such as SOPARC (McKenzie et al., 2006). Social media approaches (e.g., Donahue et al., 2018; Lu et al., 2021; Song et al., 2020) analyzed digital footprints through platform-specific APIs. Metrics included check-ins on platforms like Weibo (D. Chen et al., 2021; S. Zhang & Zhou, 2018), review counts from tourism and service platforms (Huai et al., 2023), and specialized measures such as “photo-user-days” from photo-sharing services that capture unique user-date combinations within park boundaries (Donahue et al., 2018; Hamstead et al., 2018). Studies using mobile service data (e.g., Y. Chen et al., 2018; Dong et al., 2022; Liu et al., 2023) leveraged location-based information from telecommunications providers and platforms to analyze visitor patterns. These ranged from mobile signaling data with spatial resolutions of 25 to 250 m (Y. Chen et al., 2018; Liu et al., 2023) to platform-specific metrics such as Baidu spatial vitality indices (Dong et al., 2022) and Google Places popularity scores (Fry et al., 2021).
Regarding statistical modelling, multiple linear regression, or Ordinary Least Square modelling, was most common (18 studies or 55%), followed by negative binomial or Poisson regression (15 studies; 46%) to deal with park user volume as a count variable. Seven studies (21%) address multi-model structures with multiple observations per park through a mixed effects model or generalized estimating equations (GEE). In contrast, only one study (Liu et al., 2023) uses spatial regression to control for spatial autocorrelation issues.
We assessed methodological quality across four key criteria: sample size adequacy, measurement quality, control for confounders, and analytical appropriateness. Most studies were rated at least “moderate” across all criteria. Of the 30 studies, 29 had sufficient sample sizes (e.g., more than 10 parks or 100 observations), 29 clearly defined their measures of park visitor volume, and 28 included key confounding variables (e.g., population, land use, or weather). While all studies used multiple linear regression, six applied more advanced analytical techniques (e.g., multilevel models for nested data, spatial models when needed). Full details are provided in the Supplementary Materials.
Factors Associated with Park User Volume
Table 2 shows meta-analysis results for park user volume. Estimates are measured as partial correlation coefficients using UWLS+3. The table also presents the number of included studies (K) for each variable and the percentage of positive, negative, and nonsignificant studies at p < .05 level. I2 statistics describes the percentage of variation across studies due to heterogeneity rather than chance. I2 values are very high in most variables, indicating the inconsistency of studies’ results and that a random-effects model is suitable, as presented in Table 2.
Meta-Analysis Results for Park User Volume.
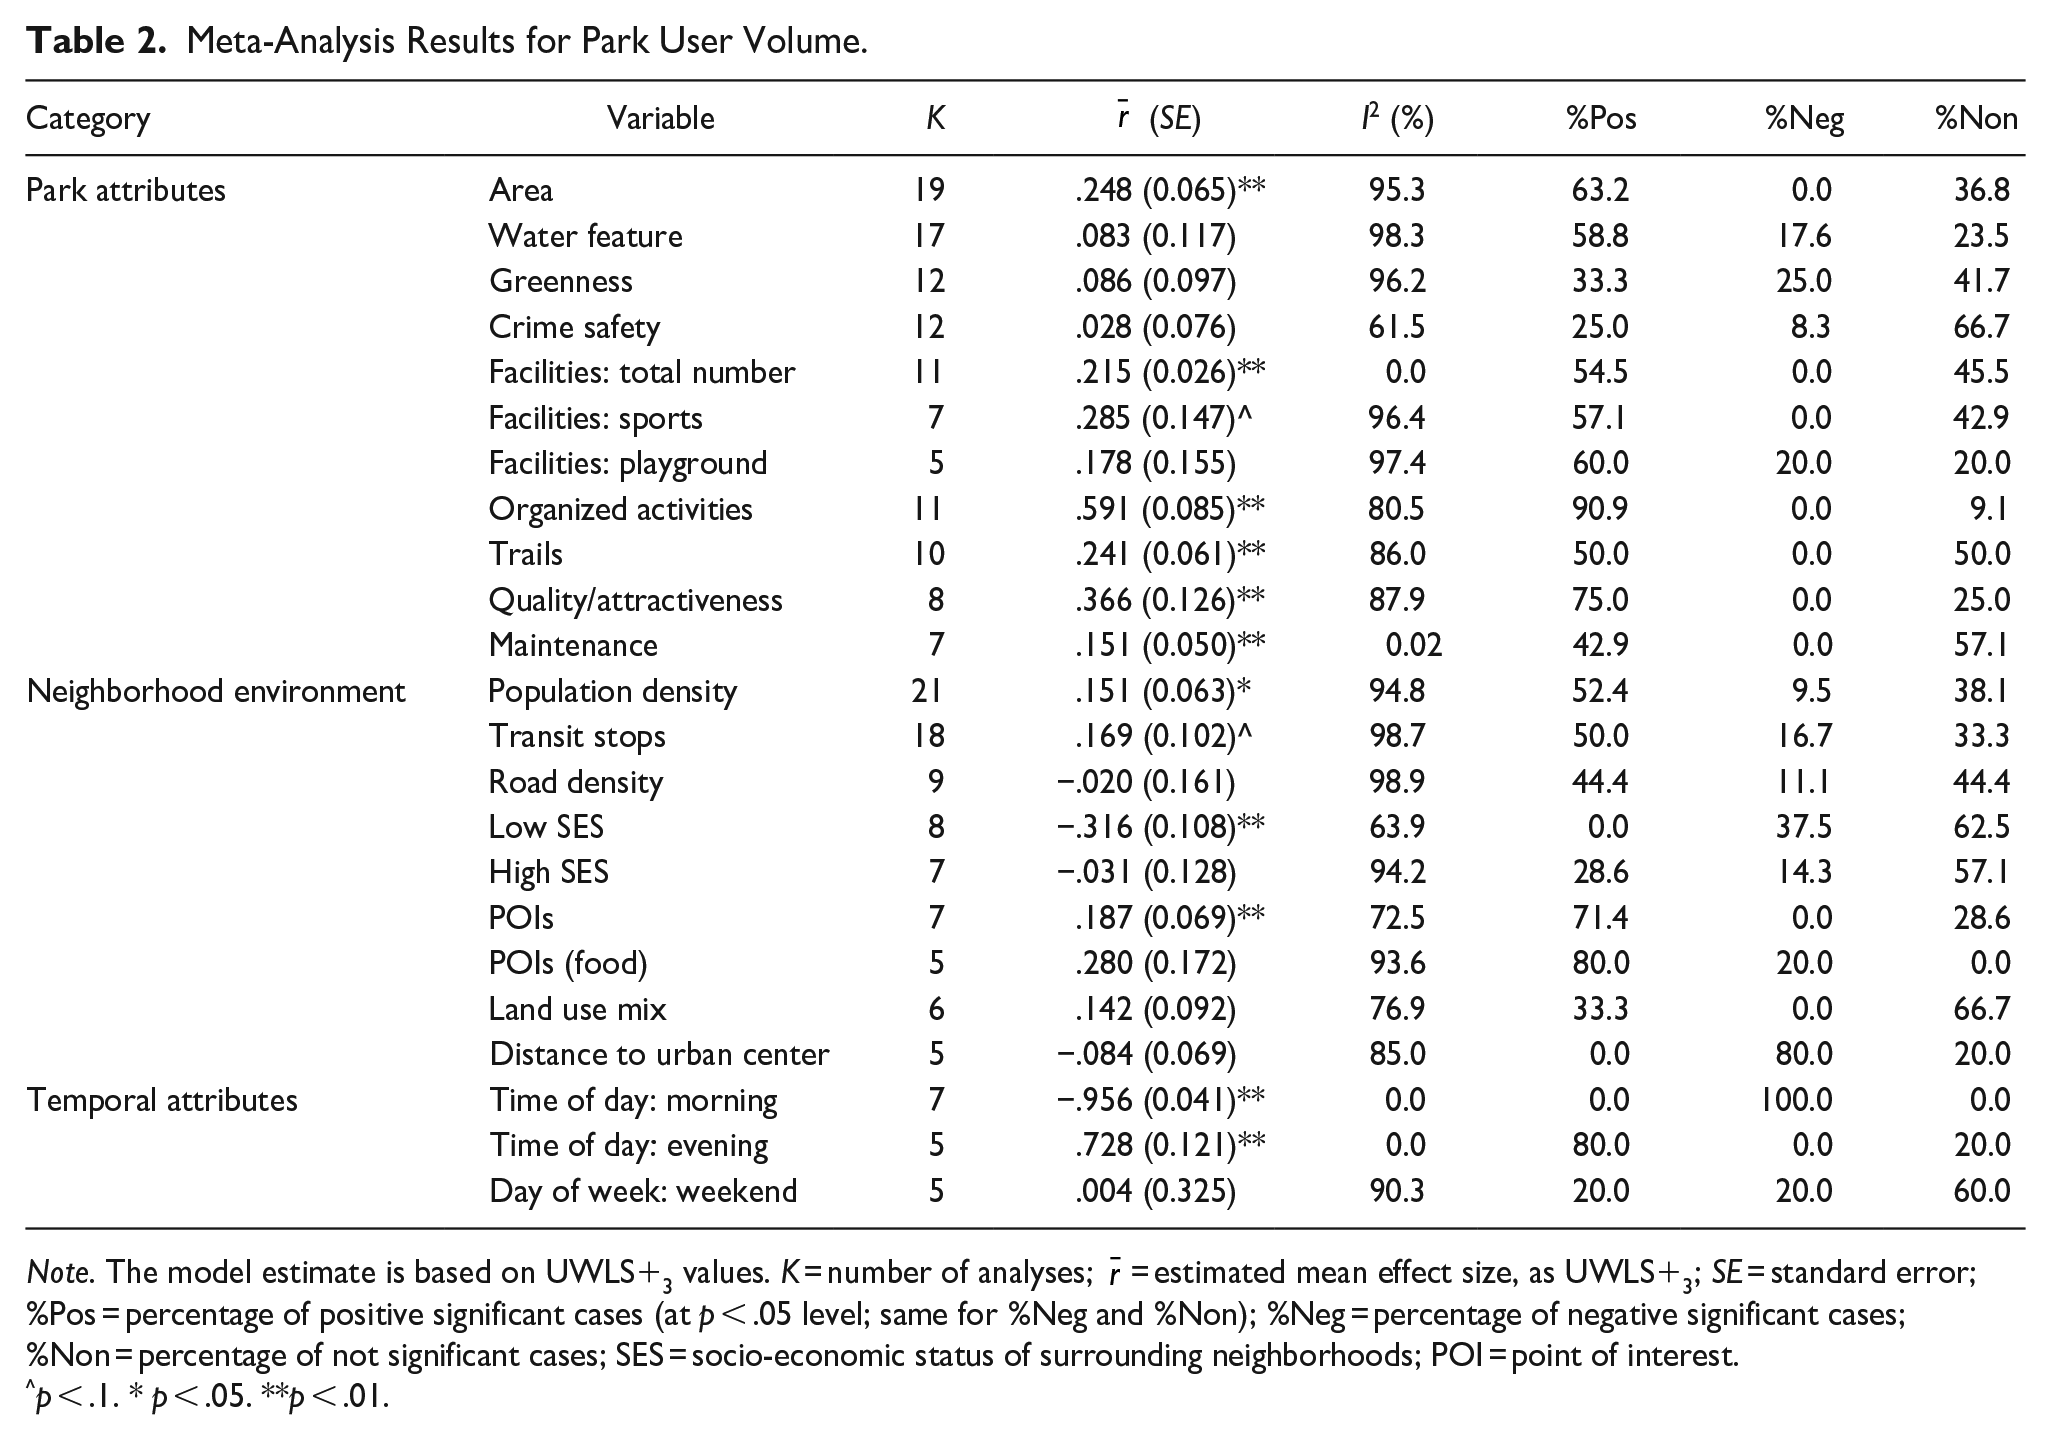
Note. The model estimate is based on UWLS+3 values. K = number of analyses;
p < .1. * p < .05. **p < .01.
Park Attributes
Nine measures of park attributes—area, water features, greenness, crime safety, facilities (including total number, sports, children’s play), organized activities, trails, quality/attractiveness, and maintenance—were included in more than five studies. The mean effect sizes, measured as UWLS+3, were statistically significant for area, the number of facilities, organized activities, trails, quality, and maintenance at p < .05, with the number of sports facilities being marginally significant at p < .01.
Park size is included in 19 studies. The estimated partial correlation coefficient is .248, indicating a small positive effect on park user volume. In other words, the number of park users increases in larger parks. It is statistically significant (p < .01), with 63% of studies showing a positive effect and no studies showing a negative effect.
A total of 17 studies include water features—number or presence. The estimated effect size is very small at .083 and not statistically significant, with 59% of studies showing a positive effect and 18% negative effect.
Greenness measures, such as the amount or proportion of vegetation within a park, have a mixed effect on park user volume: 33% are positive, and 25% are negative. The estimated effect size is not statistically significant.
Twelve studies include crime-related safety measures, either as actual crime counts (their coefficients were inversed in this meta-analysis to measure the degree of safety) or observed safety levels. The partial correlation coefficient is .028, indicating a very small positive effect of a safe environment on park user volume but not statistically significant, with two-thirds (67%) of the studies presenting no effect.
The number of facilities (e.g., sports facilities, playgrounds, cultural facilities, amenities) is included in 11 studies. The partial correlation coefficient is .215, indicating a small positive effect on park user volume. It is statistically significant (p < .01), with 55% of studies showing a positive effect and no studies showing a negative effect. Regarding specific types of facilities, the number of sports and fitness facilities is included in seven studies, among which four found positive effects. Five studies have included the presence or number of playgrounds, out of which three have found positive effects.
Organized activities or programs, measured either by their number or their presence within a park, have the highest partial correlation coefficient of .591 among park attributes, indicating a strong positive effect on park user volume. It is statistically significant (p < .01), with 91% of studies showing a positive effect and no studies showing a negative effect.
Trail length or its presence within a park (including walking and bike paths) is analyzed in 10 studies. The partial correlation coefficient estimate is .241, indicating a small positive effect on park user volume. It is statistically significant (p < .01), with half of the studies showing a positive effect and no studies showing a negative effect.
The quality of a park is included in eight studies through diverse measures (e.g., CPAT scores through a park audit, scenic quality scores by a field assessor, and visitor ratings from social media). The estimated partial correlation coefficient of park quality variables is .366, indicating a moderately positive effect on park user volume. It is significant (p < .01), with 75% of studies showing a positive effect and no studies showing a negative effect.
High maintenance has a statistically significant effect on park user volume with a partial correlation coefficient of .151 (p < .01). But among the seven studies included, three (43%) showed positive, and four (57%) showed no effect.
Figure 3 shows forest plots for six park attribute variables that are statistically significant (p < .05). A forest plot visually displays the effect sizes and confidence intervals of individual studies, illustrating the overall pooled effect estimate.
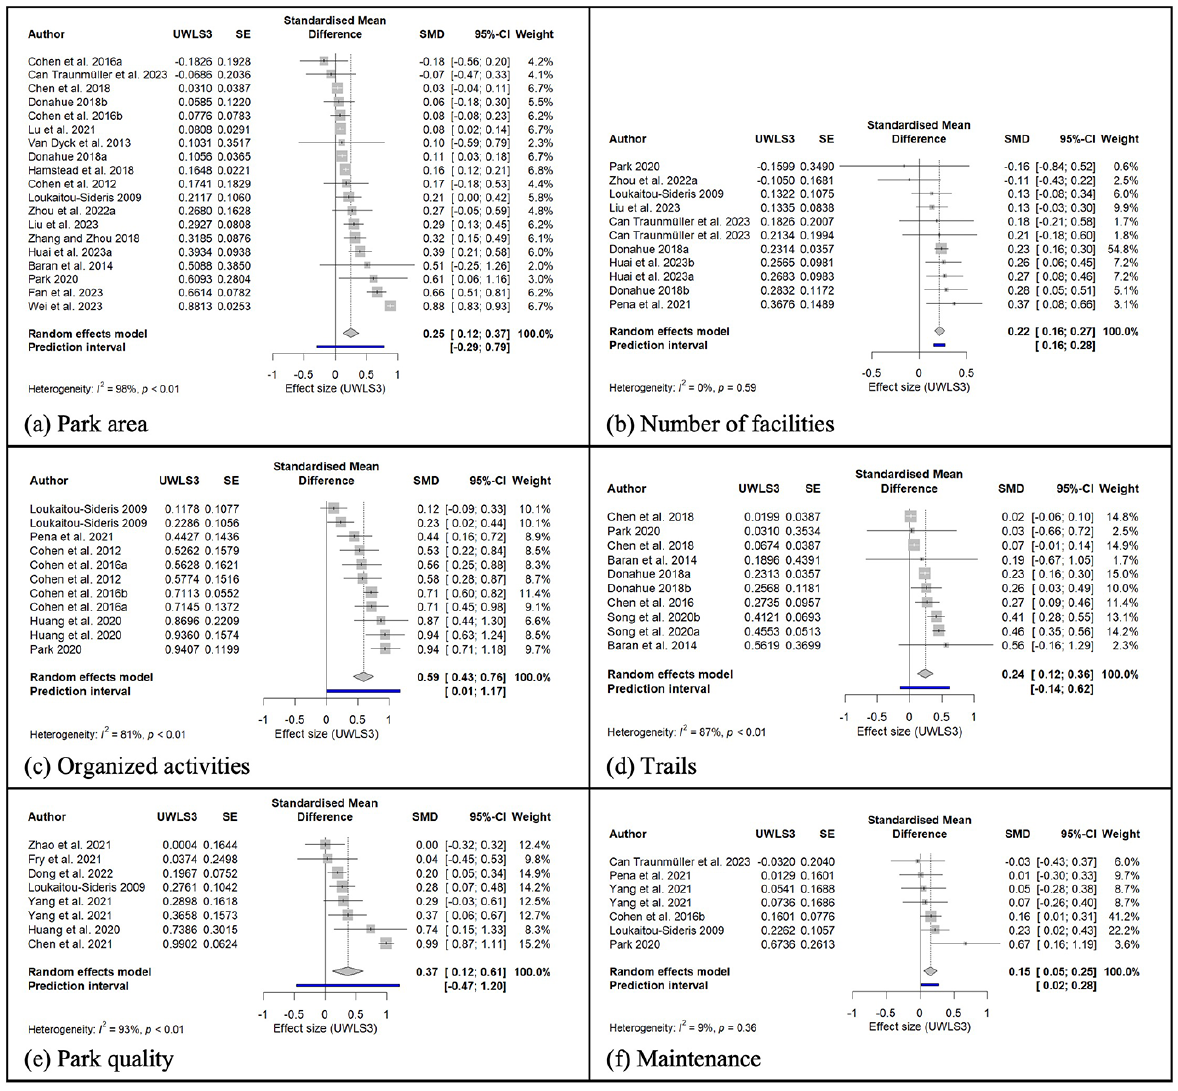
Forest plots of park attribute variables.
Neighborhood Environment
Eight measures of park-adjacent neighborhoods—population density, transit stops, road density, percentage of the low (or high) socio-economic status groups, POIs (general or food-specific), land use mix, and distance to urban center—were included in more than five studies. The mean effect sizes, measured as UWLS+3, were statistically significant for population density, percentage of low socio-economic status population, and POIs at p < .05, with the transit stop access being marginally significant at p < .01.
Twenty-one studies accounted for population density, or the number of residents in park-adjacent neighborhoods, in estimating park user volume. The partial correlation coefficient is .151, indicating a small positive effect on park user volume (p < .05). More than half of the studies find that park user volume increases as surrounding neighborhoods have more residents, with two (10%) showing a negative effect.
Access to public transit stops was included in 18 studies, with an estimated effect size of .169, indicating a small positive effect on park user volume. Transit accessibility is measured as the number of stops (bus, subway, etc.) within a certain distance (in 14 studies) or distance to the nearest stop, in which we inverted the direction of the coefficient. It is marginally significant (p < .1), with 50% of studies showing a positive effect and 17% showing a negative effect.
Nine studies include road density near a park, with a partial correlation coefficient of −.020, indicating a very small negative effect on park user volume. However, this effect is not statistically significant, with 44% of studies showing a positive effect (more roads and more visitors) and 11% showing a negative effect (fewer roads and more visitors).
Several studies, mostly based in the U.S., modelled the association between neighborhood socio-demographic characteristics and park user volume. Eight studies included disadvantaged populations in the neighborhood, measured through poverty rate or deprivation index, and found a negative association with park user volume. In other words, park visitation rates decrease in more disadvantaged neighborhoods. The effect size of −.316 is moderate and statistically significant (p < .01), with 38% of studies showing a negative effect and no studies showing a positive effect. On the other hand, seven studies included average household income or housing price, but the pooled results are mixed (29% positive and 14% negative) and not statistically significant. Three studies—all in the U.S.—examine the role of neighborhood racial and ethnic compositions on park visitor volume, and the findings are mixed—Baran et al. (2014) and Hamstead et al. (2018) find fewer park users in more racially diverse neighborhoods while Wei et al.’s (2023) finding is the opposite.
The diversity of land use is measured in two ways: the number of POIs (points of interest) in seven studies and the entropy index in six studies. POI counts have a partial correlation coefficient of .187, indicating a small positive effect on park user volume (p < .01). 71% of studies show a positive effect. On the other hand, the land use entropy index is not statistically significant, with 33.3% of studies showing a positive effect and the rest showing a non-significance. Food-specific amenities such as restaurants and food vendors near a park are included in five studies, with 80% (four studies) showing a positive effect. However, the effect size estimate is not statistically significant.
Lastly, five studies account for distance to urban centers, such as CBD (central business district), in park user volume and find a small negative effect. Four out of five studies show a negative effect, but the pooled effect size of −.084 is very small and not statistically significant.
Figure 4 shows forest plots for three neighborhood environment variables that are statistically significant (p < .05).
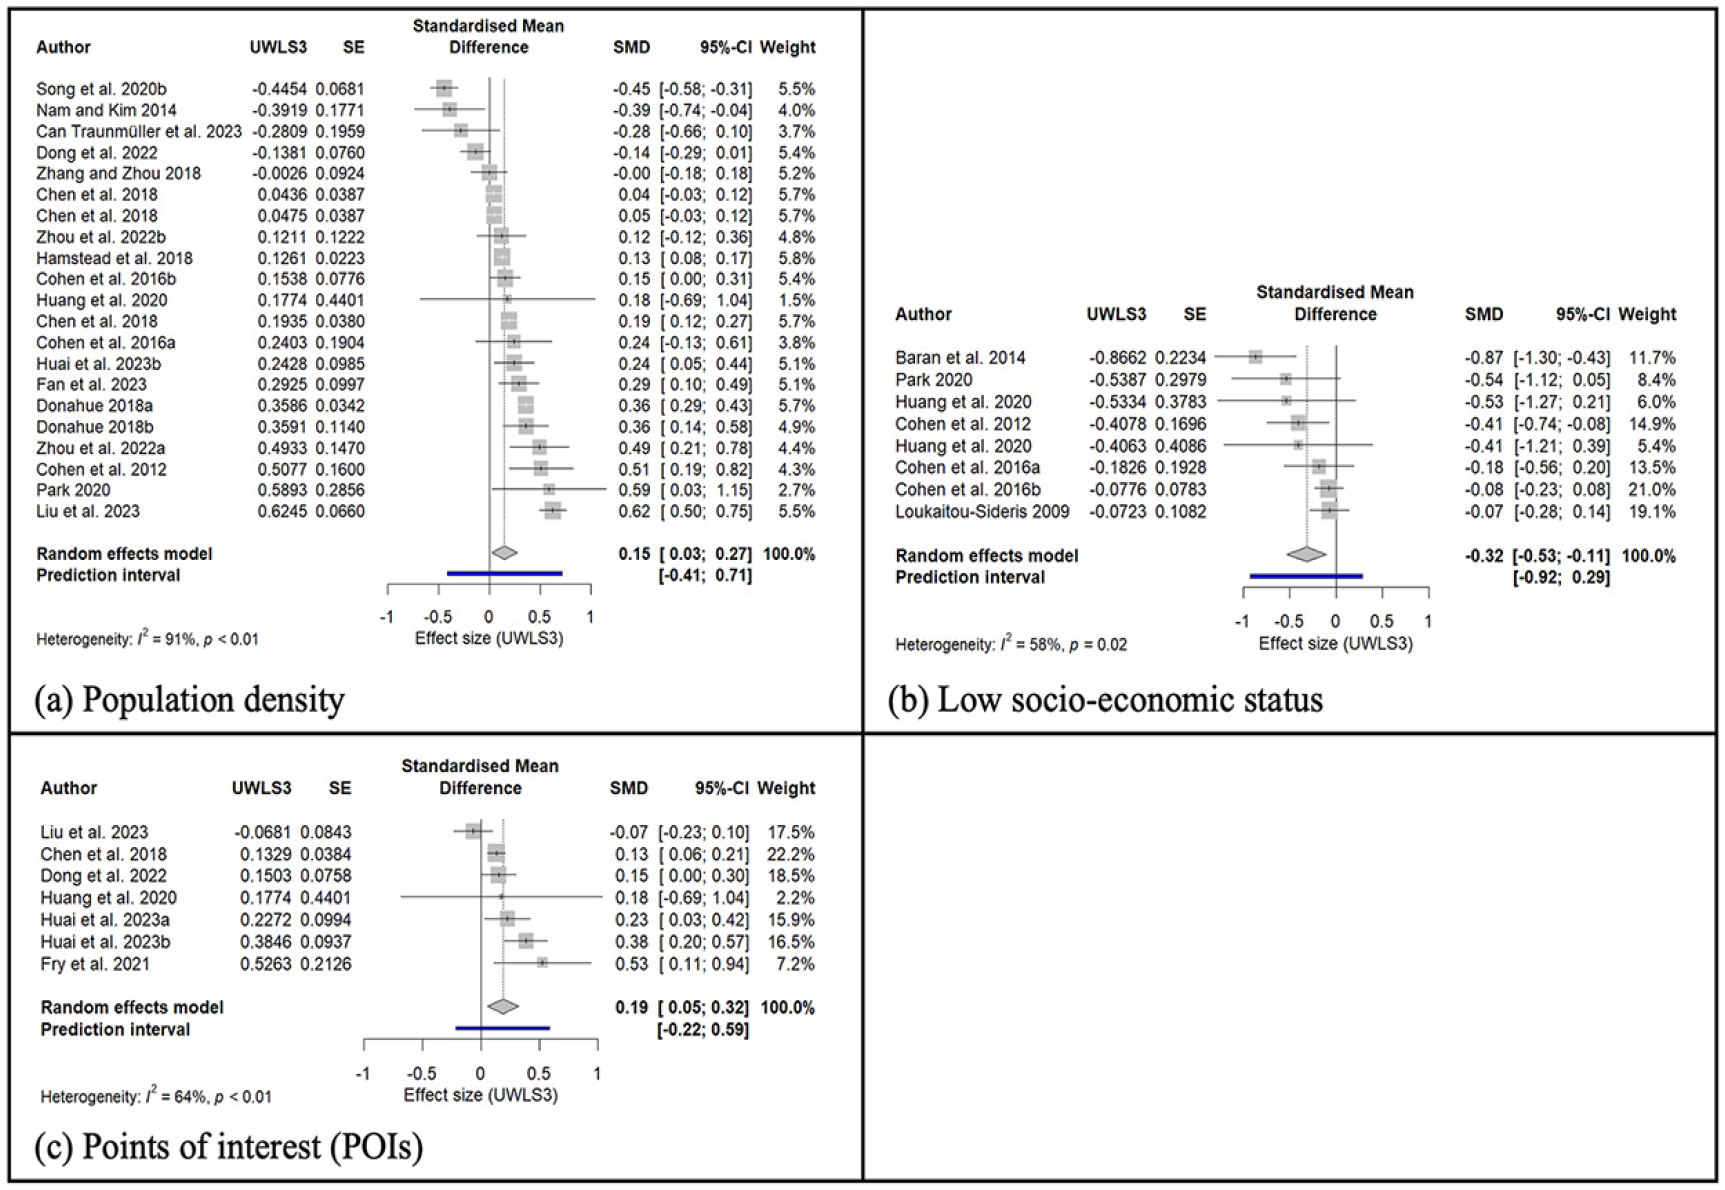
Forest plots of neighborhood environment variables.
Temporal Factors
Several studies include the time of day and consistently find that morning has the lowest park user volume, and evening or later afternoon has the highest after controlling for other temporal and environmental variables. The time-of-day variables have the strongest effect size (−.956 for morning and .728 for evening) among all independent variables included in this meta analysis.
Day of week—weekend versus weekday—shows an inconsistent relationship with park user volume in six studies, with 20% showing more people on weekends, 20% showing more people on weekdays, and the remaining 60% with no effects. The small effect size of .004 is not statistically significant.
We did not run a meta-analysis for seasons due to limited data availability—three studies. Wei et al. (2023) documented higher visitation in summer and fall in New York City parks after controlling for confounding variables. Huang et al. (2020) similarly identified increased children’s presence during summer compared to spring. D. A. Cohen et al. (2012) found no significant variation after accounting for environmental factors.
A sensitivity analysis to test for publication and reporting bias using Rücker et al.’s (2011) Limit Meta-Analysis Method is presented in the Supplemental Material. Most variables remain statistically significant. In the new models, two variables—number of sports facilities and transit stop accessibility—shifted from significance at p < .1 to p < .05, indicating stronger evidence of their effects. Conversely, four variables—maintenance level, population density, low socio-economic population, and POIs—became insignificant. This shift suggests that the previous significance of these variables might have been exaggerated due to publication bias. These findings highlight the importance of exercising caution when interpreting the effects of these variables, as their impact may not be as robust or reliable as initially thought, particularly in light of potential biases in the available data.
Figure 5 shows forest plots for two temporal variables that are statistically significant (p < .05).
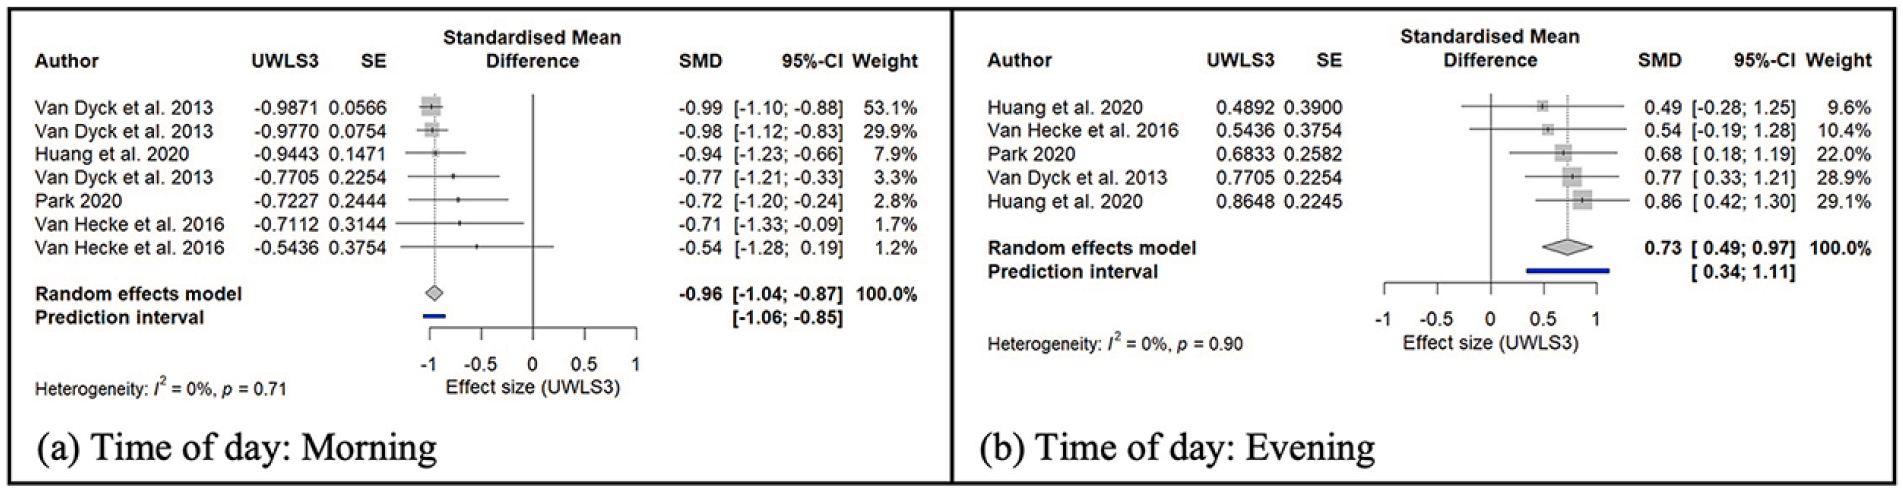
Forest plots of temporal variables.
Regional Variations
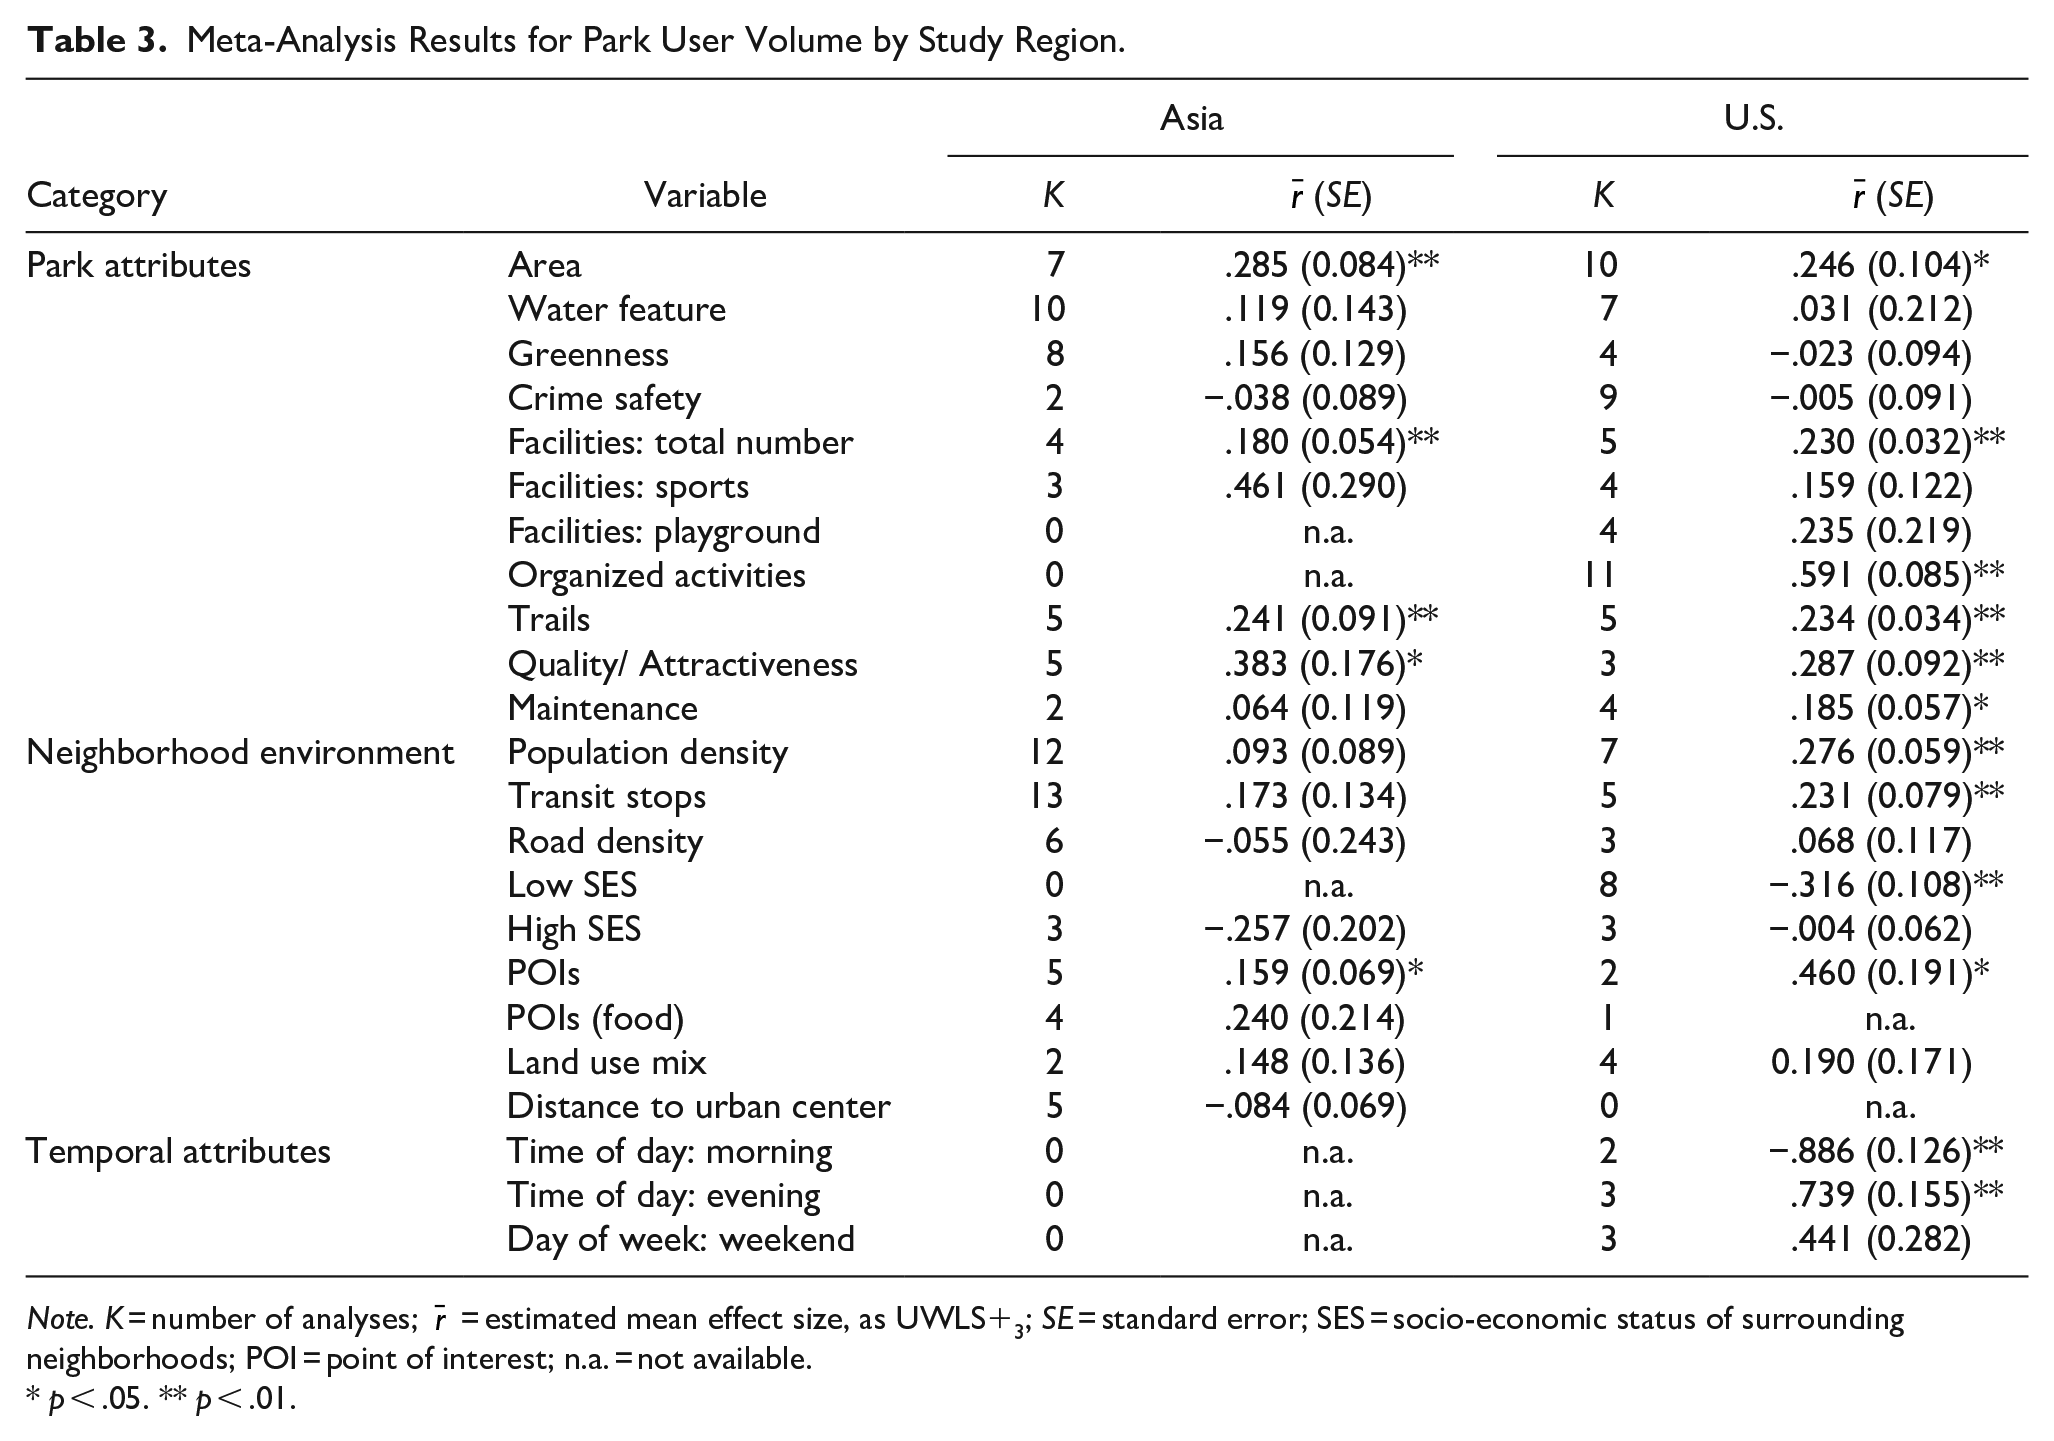
Two primary regions of park use studies are the U.S. (12 studies or 40%) and Asia (15 studies or 50%, 12 of which are in China). We further examined whether or not the relationship between environmental factors and park user volume varies between the two regions. Most results are consistent in both regions (Table 3). For example, in both U.S.- and Asia-based studies, park area, the number of facilities, trail lengths, quality, and POIs are statistically significant, and water features, greenness, crime safety, road density, High SES, and land use mix are insignificant.
Meta-Analysis Results for Park User Volume by Study Region.
Note. K = number of analyses;
* p < .05. ** p < .01.
However, several variables show regional differences. Most notably, two built environment variables—population density and transit accessibility—are only significant in U.S.-based studies. Population density near a park is positively associated with park user volume in 7 U.S.-based studies (
Another pattern observed is that different measures are used in different regions. More U.S.-based studies tend to include measures related to crime safety, organized activities/events, neighborhood socioeconomic status, and temporal variables, while studies in Asia do not. On the contrary, Asian-based studies include more built environment measures near a park, such as transit stops, road density, POIs, and distance to urban centers, compared with U.S.-based studies. Such discrepancy in the inclusion and exclusion of explanatory variables may reflect geographical and cultural differences in park usage and urban development, which limits the generalizability of this multi-region meta-analysis.
Discussion
Summary of Findings
This meta-analysis identified park attributes, neighborhood environments, and temporal factors associated with park visitor volume across 30 studies. While prior reviews qualitatively emphasized the importance of park features and perceived environment, our findings provide quantitative estimates of the strength and consistency of these effects. Among park attributes, park size, number of facilities, organized activities, trail availability, maintenance, and overall quality showed consistently positive effects, aligned with other quantitative and qualitative review studies (McCormack et al., 2010; Park, 2017; R. Zhang et al., 2019; J. Zhao et al., 2024). This suggests that larger, well-maintained parks with diverse amenities and programming tend to attract more visitors.
In contrast, the influence of water features and greenness was mixed and statistically insignificant on average. Greenness, mostly measured through tree canopy coverage within a park, showed a more divergent result, with 33% positive and 25% negative associations with park user volume. This apparent contradiction aligns with qualitative studies that suggest complex relationships between greenness and park use—Gobster (2002) found through interviews that while people express preference for green spaces, actual usage behavior often prioritizes facilities and amenities. Contrary to J. Zhao et al. (2024) emphasizing the role of perceived safety, our results suggest this factor may be less robust across studies, particularly after adjusting for potential publication bias.
While many studies examine the influence of neighborhood context on park use, this meta-analysis synthesizes these findings to reveal broader patterns and provide a comprehensive understanding. Among neighborhood environmental attributes, population density and nearby points of interest (POIs) positively impacted park use. However, park visitation decreased in more disadvantaged areas, highlighting potential equity issues. This association warrants careful interpretation, as our meta-analytic approach cannot determine whether local residents use parks less frequently or whether these parks attract fewer visitors overall, nor can it identify specific mechanisms (e.g., park quality variations, time constraints, or access barriers) driving this pattern. Effect sizes for other neighborhood environment variables—transit access, road density, land use mix, and urban proximity—were insignificant overall.
Interestingly, population density and transit accessibility showed stronger positive associations with park use in U.S. studies compared to Asian contexts. This difference may be attributed to the generally higher population densities and more extensive public transit systems in many Asian cities compared to their U.S. counterparts. In lower-density U.S. cities with more limited public transit, incremental improvements in density and transit access around parks may have a more pronounced impact on park usage by enhancing the convenience and accessibility of park visits for a larger proportion of the population (D. A. Cohen et al., 2012; Hamstead et al., 2018; Park, 2020; Wei et al., 2023).
Temporal factors, especially time of day, exhibited the strongest effects on visitor volume. Our meta-analysis quantified these patterns, with mornings showing significantly lower usage and evenings demonstrating substantially higher visitor volumes. These strong temporal effects were consistent across studies despite geographic and methodological variations (Baran et al., 2014; Van Dyck et al., 2013). Seasonal patterns, though based on fewer studies, similarly showed higher visitation in summer and fall months (D. A. Cohen et al., 2012; Wei et al., 2023).
Figure 6 summarizes these findings, presenting a conceptual framework of factors positively associated with park user volume across the three domains of park attributes, neighborhood environment, and temporal factors. This framework highlights the multifaceted influences on park visitation.
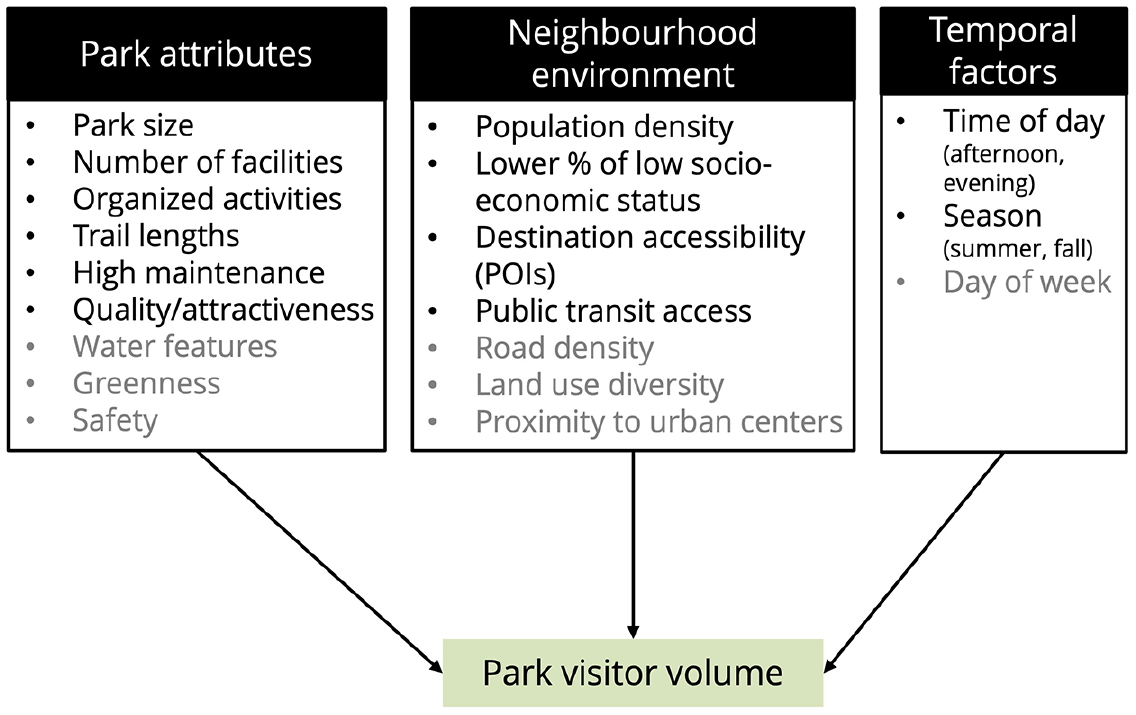
Factors positively associated with park user volume.
Practical Implications
The meta-analysis findings offer several actionable insights for urban planners, landscape architects, and park managers seeking to optimize park usage and benefits. First, the strong positive associations of park size, facilities, trails, and programming with visitor volume underscore the value of designing larger parks with diverse amenities and activities (McCormack et al., 2010; Park, 2017; R. Zhang et al., 2019; J. Zhao et al., 2024). Planners should prioritize creating parks with ample space, varied facilities, and extensive trail networks to attract users. Organizing events and programs tailored to community interests can further boost park vitality.
It is crucial to note that this recommendation does not suggest prioritizing large parks over smaller, more accessible parks in residential areas. Park visitor volume should not be the sole metric guiding planning decisions. While maximizing visitor volume captures the goals of enhancing social and health benefits and efficient public investment, it potentially overlooks equity considerations—ensuring different population groups have adequate park access (distributional equity), participate in related decision-making (procedural equity), and see their values and preferences represented in park design and management (recognition equity) (Nesbitt et al., 2018; Rigolon, 2016). A balanced approach combining strategically located large parks with abundant facilities and a network of smaller, accessible neighborhood parks may best serve diverse community needs and planning objectives.
Second, the importance of park quality and maintenance highlights the need for ongoing investment and upkeep. Previous review studies have demonstrated that well-maintained parks with high aesthetic quality consistently attract more visitors and encourage longer stays (McCormack et al., 2010; R. Zhang et al., 2019; J. Zhao et al., 2024). Proper upkeep not only enhances visual appeal but also signals safety and care, which are critical determinants of visitation decisions. Allocating sufficient resources for regular maintenance, upgrades, and renovation efforts can pay off in terms of increased visitation and community appreciation.
Third, the positive impact of neighborhood population density and POIs on park use suggests that parks should be strategically integrated within vibrant, mixed-use urban fabrics. Jane Jacobs (1961) emphasized that neighborhood parks can only be well used and safe throughout the day when the surrounding sidewalks are also well used and safe. Walkable neighborhoods with mixed use buildings can provide an intricate sequence of users throughout the day and week (Fry et al., 2021; Jacobs, 1961). Our findings reinforce established planning principles that emphasize strategic park location and accessibility to residential areas, workplaces, schools, and other community destinations (Harnik, 2003; Mertes & Hall, 1996), while also supporting newer, more integrated approaches to parks planning that view parks as essential components of a larger interconnected public realm (Barth, 2020). However, the regional variations in density and transit effects we observed also highlight the importance of context-sensitive approaches aligned with local development patterns and mobility cultures, consistent with Barth’s (2020) emphasis on community-specific standards that reflect local issues, values, needs, priorities, and available resources.
Fourth, planners and park managers should address socioeconomic disparities in park usage through evidence-based interventions. Our meta-analysis reveals consistent negative relationships between neighborhood socioeconomic disadvantage and park visitation, indicating that enhancing park equity requires deliberate strategies beyond standard improvements. Park departments should prioritize safety enhancements in disadvantaged areas by improving visibility, lighting, and maintenance—factors shown to correlate with increased usage (D. A. Cohen Han, Derose, et al., 2016; Park, 2020). While organized activities and trails universally drive visitation, practitioners should recognize varying preferences toward programs and amenities by demographic and cultural groups (Baran et al., 2014; Loukaitou-Sideris & Sideris, 2009; Wei et al., 2023). Implementation of community co-design processes with residents in disadvantaged neighborhoods can generate context-specific solutions that address locally relevant barriers, thereby promoting more equitable distribution of park benefits (Nesbitt et al., 2018; Wolch et al., 2014).
Finally, the strong temporal variations in park use suggest opportunities for dynamic park management. Parks could benefit from targeted resource allocation by concentrating events and staffing during peak evening hours while developing specific programming to attract visitors during traditionally underutilized morning hours, helping to distribute visitation more evenly throughout the day (Park et al., 2020).
By applying these evidence-based insights in context-sensitive ways, planners, designers, and managers can create more vibrant, equitable, and well-utilized park systems for diverse user groups. Realizing this vision will require sustained collaboration across sectors, agencies, and stakeholder groups, as well as ongoing monitoring and adaptation to shifting community needs and usage patterns over time.
Limitations and Suggestions for Future Research
The overall quality of evidence is moderate due to variations in study designs and data sources. Key strengths include the diverse range of variables assessed and robust sensitivity analyses. However, several limitations warrant attention in future research. One important consideration is that the factors influencing park visitor volume can differ substantially across parks of varying types, sizes, and locations. For instance, Zhou, Xie, et al. (2022) found that mini-parks are more sensitive to surrounding environmental characteristics compared to larger parks, highlighting the nuanced role of scale in determining usage patterns. Similarly, Gao et al. (2024) demonstrated that the determinants of park visits vary significantly among different park types, underscoring the need for tailored approaches. Future research should therefore stratify analyses by park size, type, and function to refine discussions and provide targeted, context-specific recommendations.
The high heterogeneity observed in many variables also suggests that the relationships between environmental factors and park usage are complex and context-dependent. Future studies should aim to disentangle these complexities by examining non-linear and interaction effects. For example, Xiao et al. (2024) explored the interactions between different environmental attributes using machine learning.
Additionally, this study focuses solely on total visitor volume at a certain time point, which provides a limited perspective on the complexity of park usage. Future studies could incorporate additional indicators, such as the diversity of user groups or activity types, to measure shareability or inclusiveness in parks. Importantly, research examining park proximity, accessibility patterns, and their relationship with visitor volume would provide valuable insights into potential trade-offs between usage intensity and equitable access. Moreover, future research may disaggregate park use and access data by demographics to better understand how different population groups interact with park environments. Geographically, the differences observed between U.S. and Asian studies highlight the importance of cross-cultural and cross-regional comparisons. Future investigations should explore how cultural, social, and urban development factors mediate the relationships between environmental variables and park usage, providing a more comprehensive framework for understanding and improving park equity and accessibility.
Lastly, variations in data sources and methods, such as metrics for greenness—for example, canopy coverage rate (Donahue et al., 2018; Song et al., 2020; Zhou, Xie, et al., 2022) versus NDVI (Liu et al., 2023)—contribute to high heterogeneity. While this study did not reconcile such differences due to sample size limitations, future research should prioritize standardizing or clearly documenting metrics to improve comparability. Additionally, combining big data sources with traditional methods can provide richer insights into park usage, and incorporating advanced spatial analysis techniques, such as spatial filtering (Murakami & Griffith, 2019), can better address spatial autocorrelation issues.
By addressing these methodological limitations and pursuing more integrative research approaches, future studies can develop a more nuanced understanding of the factors influencing park usage. This knowledge is crucial for designing vibrant, equitable, and well-utilized urban spaces that contribute to the health and well-being of diverse communities.
Supplemental Material
sj-docx-1-eab-10.1177_00139165251342974 – Supplemental material for Park Features, Neighborhood Environment, and Time Factors Affect Park Visitor Volume: A Meta-Analysis
Supplemental material, sj-docx-1-eab-10.1177_00139165251342974 for Park Features, Neighborhood Environment, and Time Factors Affect Park Visitor Volume: A Meta-Analysis by Keunhyun Park and Asim Khanal in Environment and Behavior
Footnotes
Author Contributions
All authors contributed to the study conception and design. Material preparation and data collection were performed by Asim Khanal and analyses were performed by Keunhyun Park. The first draft of the manuscript was written by Keunhyun Park and all authors commented on previous versions of the manuscript. All authors read and approved the final manuscript.
Data Availability Statement
Data will be available upon request.
Declaration of Conflicting Interests
The author(s) declared no potential conflicts of interest with respect to the research, authorship, and/or publication of this article.
Funding
The author(s) received no financial support for the research, authorship, and/or publication of this article.
Supplemental Material
Supplemental material for this article is available online.
Author Biographies
References
Supplementary Material
Please find the following supplemental material available below.
For Open Access articles published under a Creative Commons License, all supplemental material carries the same license as the article it is associated with.
For non-Open Access articles published, all supplemental material carries a non-exclusive license, and permission requests for re-use of supplemental material or any part of supplemental material shall be sent directly to the copyright owner as specified in the copyright notice associated with the article.