
Abstract
Evaluating adaptive capacities that support the resilience of at-risk communities can be from an objective (top-down) approach or from a subjective (bottom-up) approach. While both approaches are valuable, there remains a need for quantitative subjective measures that complement objective measures by grounding understanding in community members’ perceptions and experiences. To address this need, a 12-item self-report assessment scale of community adaptive capacity to coastal hazards was developed and validated using data collected from two samples of Texas Gulf Coast residents. Findings support the psychometric validity and reliability of the measure and indicate that at-risk coastal communities in Texas can be meaningfully segmented using the measure. The perception of greater adaptive capacity, real, or otherwise, may ameliorate natural hazard concerns and inflate beliefs about preparedness. As such, subjective measures are important companions to objective measures of adaptive capacity and can offer opportunities to identify mismatches between top-down approaches to building adaptive capacity and community perceptions.
Introduction
Since 2010, hazards and disasters have caused over $1.3 trillion in damages in the United States (NOAA National Centers for Environmental Information, 2022). For many U.S. coastal communities, threats related to tropical cyclones and hurricanes continue to grow as the global climate system continues to change. The Intergovernmental Panel on Climate Change (IPCC) has indicated that the impacts of climate change are already being experienced and that the frequency and intensity of climate and weather extremes will continue to grow in the coming decades (Masson-Delmotte et al., 2018, 2021). Additionally, sea level and temperature variability will continue to rise, compounding the stress and effect of natural hazards on coastal social-ecological system (SES) function and testing the resilience of at-risk communities (Masson-Delmotte et al., 2018; NOAA National Centers for Environmental Information, 2022). To address vulnerability and the growing risk of climate change, coastal communities turn to fostering adaptive capacities that bolster community resilience and enable communities to adapt to disturbances caused by natural hazards (Bostick et al., 2018; Ross, 2013).
Multiple approaches have been used to assess adaptive capacity, vulnerability, and resilience. Approaches can generally be divided between objective and subjective measurement methods. Objective measures, or top-down approaches, use aggregates of area and population characteristics as indirect proxies for these concepts at various spatial scales but have been criticized for their ecological validity (Cutter et al., 2003; Mortreux & Barnett, 2017; Summers et al., 2018). Subjective measures, or bottom-up approaches, often ground understanding of vulnerability, resilience, and adaptive capacity in the community through stakeholder involvement and community engagement but often lack generalizability and comparability due to their place-specific nature and qualitative methods (Butler et al., 2017; Pfefferbaum et al., 2013).
Subjective and objective assessments can complement one another to provide a deeper understanding of a community’s vulnerabilities, capacities, and resilience. Where subjective measures connect people and their experiences to adaptive capacity and resilience, objective measures provide an understanding of exposure and risk associated with hazards and their intersection with social structures. Using these approaches together can reveal disconnects between the lived experience of those at risk and initiatives designed to build adaptive capacity. With this in mind, the purpose of this investigation is to develop and validate a subjective measure of community adaptive capacity to supplement existing objective indicators. First, we address the need for a self-report adaptive capacity measure by developing and validating the Perceptions of Community Adaptive Capacity (PCAC) scale. Second, we explore the relationships between the PCAC and the natural hazard experience, including sociodemographic variations in perceptions of adaptive capacity, household characteristics, perceived vulnerability, preparedness, and evacuation decision-making.
Literature Review
Disaster Vulnerability, Resilience, and Adaptive Capacity
The concepts of vulnerability, resilience, and adaptive capacity have been applied across multiple facets of the disaster cycle and at varying scales. While debate exists about the conceptual interrelatedness of these concepts (e.g., Gallopín, 2006; Lanlan et al., 2023), we conceptualize these terms as related concepts, with vulnerability and resilience as opposing sides of a spectrum. The connected system humans and our social structures inhabit with ecological processes develops interdependencies between the system’s functions (Ostrom, 2009). These interdependencies’ relative vulnerability or resilience characterizes the system’s adaptive capacity (Nelson et al., 2007; Walker & Salt, 2012). For example, when a community is economically and socially reliant on a natural resource, changes in that resource expose the community to greater vulnerability and reduce the ability of the system to adapt to change (Marshall et al., 2007). Community actors influence community adaptive capacity through these interdependencies (Folke et al., 2010).
Vulnerability unites physical risk caused by potential hazard exposure with the social structure and response to hazards and is a product of the interplay between sensitivity to disruption, exposure, and ability to respond (Cutter, 1996; Gallopín, 2006). Although everyone in a community may be exposed to a hazard, the level of vulnerability of individual households and neighborhoods is not evenly distributed across that field of exposure, highlighting the interaction between societal structures and hazard exposure (Van Zandt et al., 2012). Social vulnerability is a product of the social structures and institutions that underpin the distributions of population characteristics in communities and their interactions with the external environment (Cutter et al., 2003; Van Zandt et al., 2012). The exposure, risk, and social vulnerability of individuals can lead to vulnerable aspects of the larger SES and reduce the system’s adaptive capacity.
Community resilience has been conceptualized from multiple perspectives in the literature. Drawing from an SES perspective, a community is a complex system, and the function of that system can be resilient (Folke, 2016). Aligning more with a psychological perspective, Cutter et al. (2013) define community resilience as “the ability to plan and prepare for, absorb, recover from, and more successfully adapt to disruptive events” (p. 27). This approach to resilience emphasizes the process of resilience. Community resilience relies on community members to act collectively to prepare, recover, and adapt to disturbances (Norris et al., 2008; Ross, 2013). At the broader level, resilience can incorporate collective problem-solving, resource sharing, and leveraging social capital to meet community needs in preparation for, during, and in response to a disturbance (Pfefferbaum et al., 2013). Berkes and Ross (2013) recognize the convergence of system resilience with psychological resilience. Although the system function represents the resilience of the SES, the individuals within the SES play a part in developing system functions and practices. Individual action to reduce disaster risk (i.e., household preparedness) builds toward a resilient community and is a necessary “precursor to adapting to climate change and its impacts in the longer term” (Cutter, 2020, p. 206). It is this integrated approach of psychological and system resilience grounded in the common focus of improving adaptive capacities in these approaches that this paper seeks to explore.
Adaptive capacity is the ability of a community to adapt to a given circumstance (Adger, 2006; Smit & Wandel, 2006). It is a dynamic and socially constructed concept influenced by the relative vulnerability or resilience of community aspects (Ford et al., 2006; Jurjonas & Seekamp, 2018). Tangible community aspects, such as physical infrastructure and technology, provide the physical resources for adaptive capacity, while intangible community aspects, such as bridging and bonding social capital and resource access, leverage tangible resources in translating adaptive capacity to adaptation (Bixler et al., 2021). Often, adaptive capacities are categorized as capitals (e.g., physical capital, social capital, natural capital, financial capital, human capital), further highlighting their role as resource or asset bases to be drawn upon by communities in adaptation (National Academies of Sciences, Engineering, and Medicine, 2019; Ross, 2013).
The literature proposes and validates multiple measures to quantify adaptive capacity, resilience, and vulnerability. For instance, Sherrieb et al. (2010) explored community resilience through economic development, social capital, information and communication, and community competence capacities. Whereas other measures identify characteristics such as exposure, financial wealth, external dependencies, and race and ethnicity as underlying aspects contributing to a community’s vulnerability (Bernier et al., 2018; Cutter et al., 2003; Van Zandt et al., 2012). Still, others have relied on categorizing and quantifying adaptive capacities as capitals (National Academies of Sciences, Engineering, and Medicine, 2019; Ross, 2013). Although these are important aspects of community resilience and vulnerability, they focus on measuring indicators of these concepts through top-down approaches and rely on proxies to indirectly assess resilience (Parsons et al., 2021). For example, community capital—the local and social ties and networks that may enable disaster survival and recovery—has been measured through voter turnout (Cutter et al., 2014). While voter turnout may be telling of community engagement that affects disaster response and recovery, it is influenced by institutional and ideological factors that may not be relevant to a community’s adaptation following a disaster. Such aggregate proxies of capacity, therefore, may not be meaningful (Mortreux & Barnett, 2017).
Conversely, bottom-up approaches largely rely on community engagement and qualitative methods to understand place-specific vulnerabilities and opportunities for building adaptive capacity. For example, the Communities Advancing Resilience Toolkit (CART; Pfefferbaum et al., 2013) is designed to encourage “communication, public engagement in the identification of local issues, problem solving, resource sharing, and the development and proper application of local assets to address community needs.” (p. 251). While also informative, these subjective approaches are place-dependent and generally lack comparability across areas (Cutter, 2016).
A burgeoning literature has expressed a need for subjective measures to supplement objective evaluations of community adaptive capacity to reincorporate community perceptions within the evaluation of adaptive capacity (Adger et al., 2009; Jones & Tanner, 2017). The concept of subjective resilience suggests that individuals understand their ability to adapt to challenges and the factors contributing to their ability (Jones & Tanner, 2017), but relatively little progress has been made in developing these measures. Lockwood et al. (2015) developed a self-report measure in the context of rural landholders in Australia. Findings support the application of a self-report measure but replicate the place-specific issues seen in bottom-up approaches while not producing a psychometric measure of adaptive capacity (Lockwood et al., 2015). Quantitative subjective measures, such as the one proposed in this study, provide an avenue for including community members’ perceptions in evaluations of adaptive capacity while ameliorating the place-specific dependencies and allowing for comparisons across at-risk communities. Through understanding adaptive capacity as a position on the vulnerability-resilience spectrum that individuals influence, subjective measures of adaptive capacity can be developed, emphasizing the perceived vulnerability or resilience of specific system components.
Foundation for Study Scale: Rural Coastal Community Resilience Framework
We build on the Rural Coastal Community Resilience (RCCR) framework proposed by Jurjonas and Seekamp (2018) to develop a quantitative subjective measurement of community adaptive capacity. The framework identifies six themes of coastal community resilience: resilience, livelihood, prosperity, development, community engagement, and agency (Table 1; Jurjonas & Seekamp, 2018).
RCCR Framework Themes.
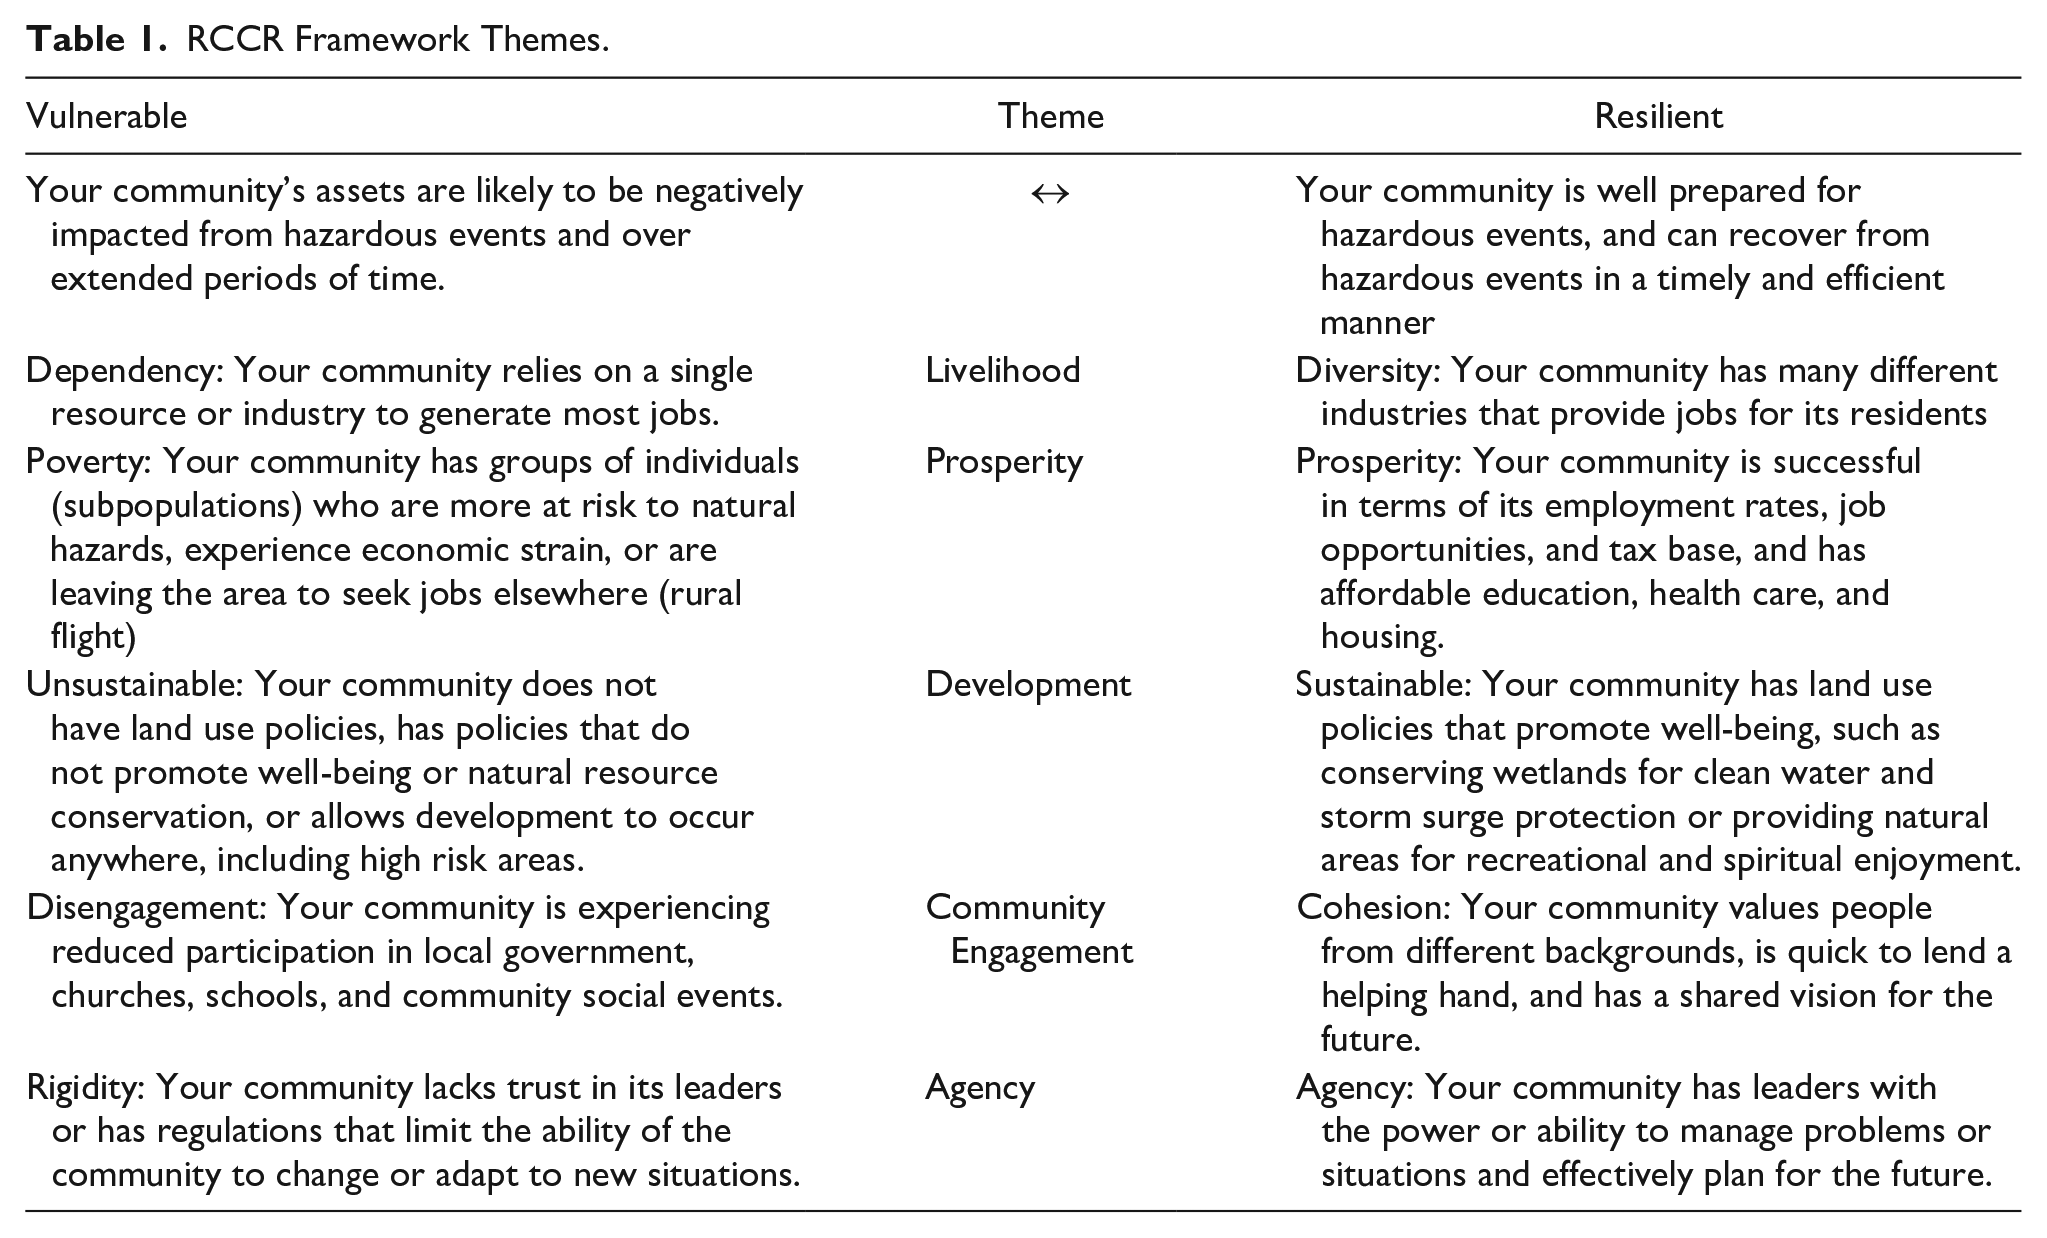
Livelihood encompasses the diversification of industries and livelihood opportunities within a community. As the impacts of climate change progress, some livelihoods will diminish, and others will flourish. It is the opportunity to transition across a variety of opportunities that highlights livelihood resilience. As Jurjonas and Seekamp (2018) note, “a resilient community will have options for diversification or transition of livelihoods if extant livelihoods begin to fade or fail” (p. 139). Communities with a diverse array of industries founded on various resources within the community or region insulate community members from sustained job loss due to changing environments and natural hazards.
The prosperity of a community consists of the physical, mental, and economic well-being of community members and is intertwined with the physical and social resources available to community members (Cloutier et al., 2019). Consistent with social vulnerability, the distribution of resources within the community is central to reducing vulnerability and building adaptive capacity (Cutter et al., 2003). Low socioeconomic groups, communities of color, and other marginalized communities are disproportionately exposed to hazard risk often due to inequality within the social structure of resources and resource allocation (T. W. Collins et al., 2019; Elliott & Pais, 2006; Smiley et al., 2022). Within this framework, the prosperity of a community is identified as the existence of disadvantaged groups in relation to their distribution of community resources.
The development dimension of the RCCR evaluates the sustainability of community development (Jurjonas & Seekamp, 2018). Development and community resilience are intertwined through hazard exposure and social vulnerability. Communities with land-use policies that allow for development in high-risk areas reduce the resilience of the community by placing populations at unnecessary risk. For example, Highfield et al. (2014) found that households that were closer to water and farther from physical structures that mitigate storm surges had significantly more damage from Hurricane Ike on Galveston Island and Bolivar Peninsula in Texas. While physical vulnerability and hazard exposure significantly predicted damage from Hurricane Ike, indicators of social vulnerability, such as the proportion of the community that was Black or Hispanic and socioeconomic status, were also significantly and positively associated with hurricane damage (Highfield et al., 2014). Historical practices like redlining placed many marginalized subgroups in these high-risk areas, compounding the risks associated with social vulnerability and natural hazards (Fothergill et al., 1999; Linscott et al., 2022). Appropriate land-use policies that emphasize ecosystem well-being include conserving critical ecosystem service providers (e.g., wetlands), considering land-use change, and reducing the development of infrastructure within risky areas provide legislative protections from natural hazards (Jurjonas & Seekamp, 2018). Communities with strategic policies for sustainable development are more resilient than those that lack sustainable development policies.
The ability of a community to implement change is partly grounded in the social system and community members’ belief that they can enact change to effectively mitigate risks (Engel, 2011; Pfefferbaum et al., 2013). Within the RCCR framework, these perceptions are conceptualized as agency (Jurjonas & Seekamp, 2018). Through individual agency, community members can shape the course and future of their community, but agency alone is not enough. Community engagement, or the involvement of a diverse range of community members in the discourse and decision-making process (Aslin & Brown, 2004), is important for translating individual agency to community-level agency (Magis, 2010). In the RCCR, community engagement is conceptualized as a combination of community cohesion and connection (Jurjonas & Seekamp, 2018). Strong community engagement is highlighted by the diversity of perspectives, the respect between members of varying perspectives, and the strengths of relationships in the community (Aslin & Brown, 2004; Jurjonas & Seekamp, 2018). Lack of engagement and community cohesion can lead to the out-migration of individuals, undermining the sustainability of livelihoods within the community and sustained adaptation efforts (Robson & Berkes, 2011). When coupled with community engagement, individual agency to address natural hazard risks leads to more resilient communities with greater adaptive capacity (Magis, 2010; Norris et al., 2008).
The dimensions of the RCCR are not independent of each other. Instead, they work together to create aggregate community resilience. For instance, agency works with community engagement to develop adaptation measures, while sustainable development and land-use policies guide the implementation of action. These may then influence the availability of a diverse array of livelihoods, which can subsequently bolster community prosperity.
The RCCR was developed within rural communities; however, metropolitan areas, such as Houston on the Upper Texas Gulf Coast, also struggle with vulnerability to hazards and climate change. Vulnerability in urban areas has been a growing focal point of research for the past two decades (Pelling, 2003). Within the SES approaches, urban vulnerability is driven by the ability of a city or its constituents to cope with a wide array of hazards supported or hindered by the social, cultural, and economic structure of the underlying institutions (Lankao & Qin, 2011). Urban areas are not monolithic and are constructed of multiple geographic and sociodemographic communities with varying degrees of vulnerability and resilience based on infrastructure and development, socioeconomic values and opportunities, and political powers (Krellenberg et al., 2017). The dimensions of the RCCR align with previously identified aspects of resilience in urban areas (Riberio & Gonçalves, 2019). We suggest that the RCCR framework has utility beyond rural contexts and can be applied, at the community level, to the urban context due to the patchwork of geographic and demographic communities that create larger metropolitan areas.
Collectively, the RCCR provides a foundation for evaluating community perceptions of adaptive capacity by grounding the ability of a community to adapt within the individual community members’ relationships and participation in community structures, recognizing that they are acutely aware of their own vulnerabilities (Jones & Tanner, 2017). This study seeks to address the relatively minimal attention given to developing a subjective measure of adaptive capacity that is grounded in the perceptions of community members. The subjective measure developed here adds to the work of Lockwood et al. (2015) by using a pre-existing conceptual framework of adaptive capacity to develop a quantitative measure of perceptions of community adaptive capacity in coastal communities.
Materials & Methods
Study Area & Sample
The Texas Gulf Coast region is a region of southeast Texas spanning 13,900 square miles across 21 coastal counties (Figure 1). Louisiana borders the region on the northern end of the coast and Mexico on the southern end. The Gulf Coast region has various environments, including 367 mi of shorelines, wetlands, and urban complexes. The land use of the Gulf Coast region is diverse with large urban metroplexes such as Houston in Harris County to smaller agricultural counties such as Colorado County. Almost a quarter of Texas’ population, 6.9 million people, live on the Texas Gulf Coast according to the 2020 census. Although the region overall has grown slower than the rest of the state between 2012 and 2022, large metropolitan coastal areas are growing faster than the rest of the state leading to high concentrations of the population in these areas.
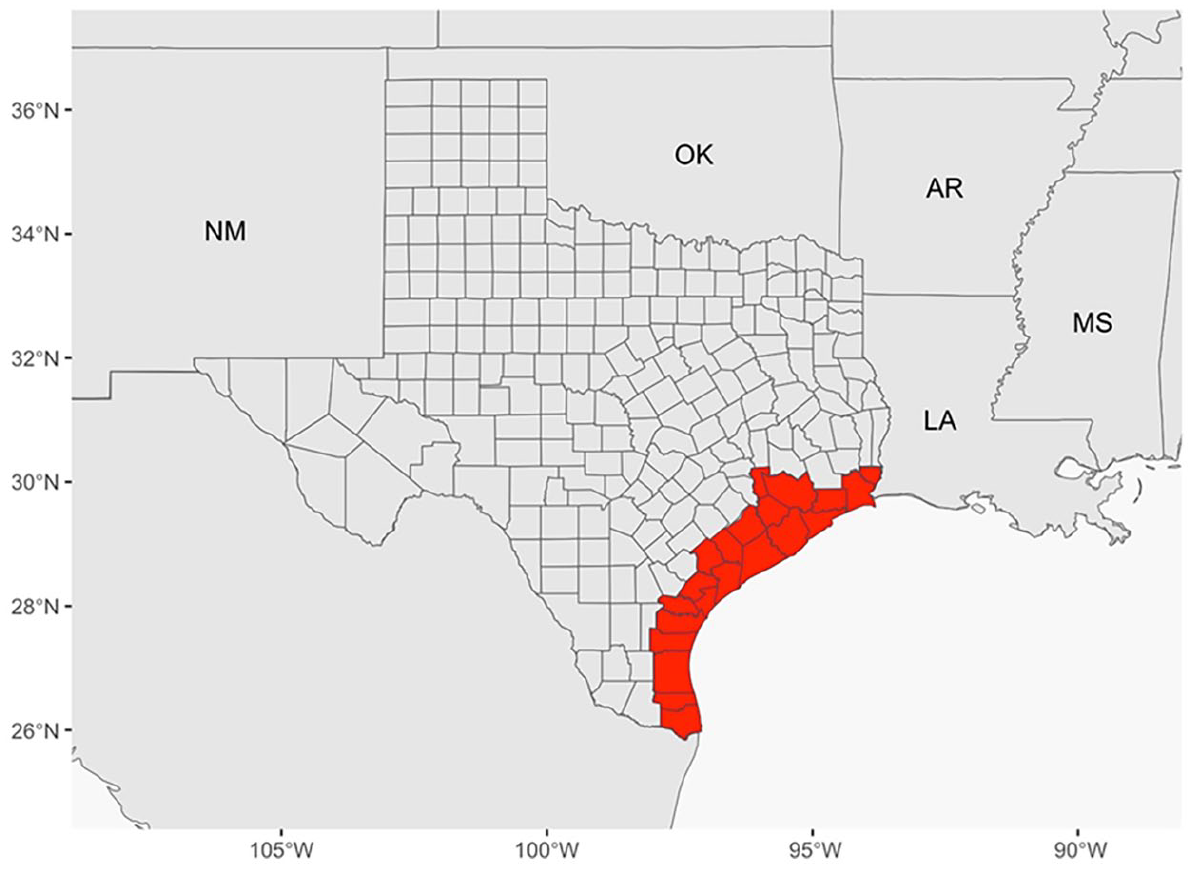
Texas Gulf Coast region study area.
The Texas Gulf Coast region has been impacted extensively by climate change and natural hazards, with 20 tropical cyclones impacting Texas since 2010. Most notably, Hurricane Harvey impacted the Texas Gulf Coast region in August of 2017, causing storm surges of over 8 ft and rainfall totals of over 50 in (National Weather Service, 2017). Despite widespread damage, recovery processes were not uniform across communities. More vulnerable communities, defined as those communities with weaker planning, exploitative industry, and inequalities, had more challenges in recovery (Flores et al., 2021). Hurricane Harvey provides one example of the divergent impacts of natural hazards on communities with varying degrees of vulnerability.
The survey sample included adult respondents (age 18 years and older) from the 21 coastal counties in Texas. Following institutional review board approval, data were collected via two online panels in November of 2018 and 2019. Panel One (2018) included 3,081 participants and was collected using a panel of respondents through Cint, an online market research firm. Panel Two (2019) included 1,045 participants and was collected using a panel of respondents through the online platform Qualtrics. The panels met quotas to match the sociodemographic profile of the population of the 21-county coastal region in terms of age, education, race, and ethnicity.
Measures
The survey instrument included 38 items measuring perceived adaptive capacity through the developed PCAC scale as well as perceptions of disaster vulnerability, preparedness, displacement, and influences on previous evacuation. An array of sociodemographic items—gender, education, ethnicity, political affiliation, age, and home ownership—were also included in the survey. These measures were used to understand the sociodemographic characteristics of respondents and explore their relationships with the PCAC.
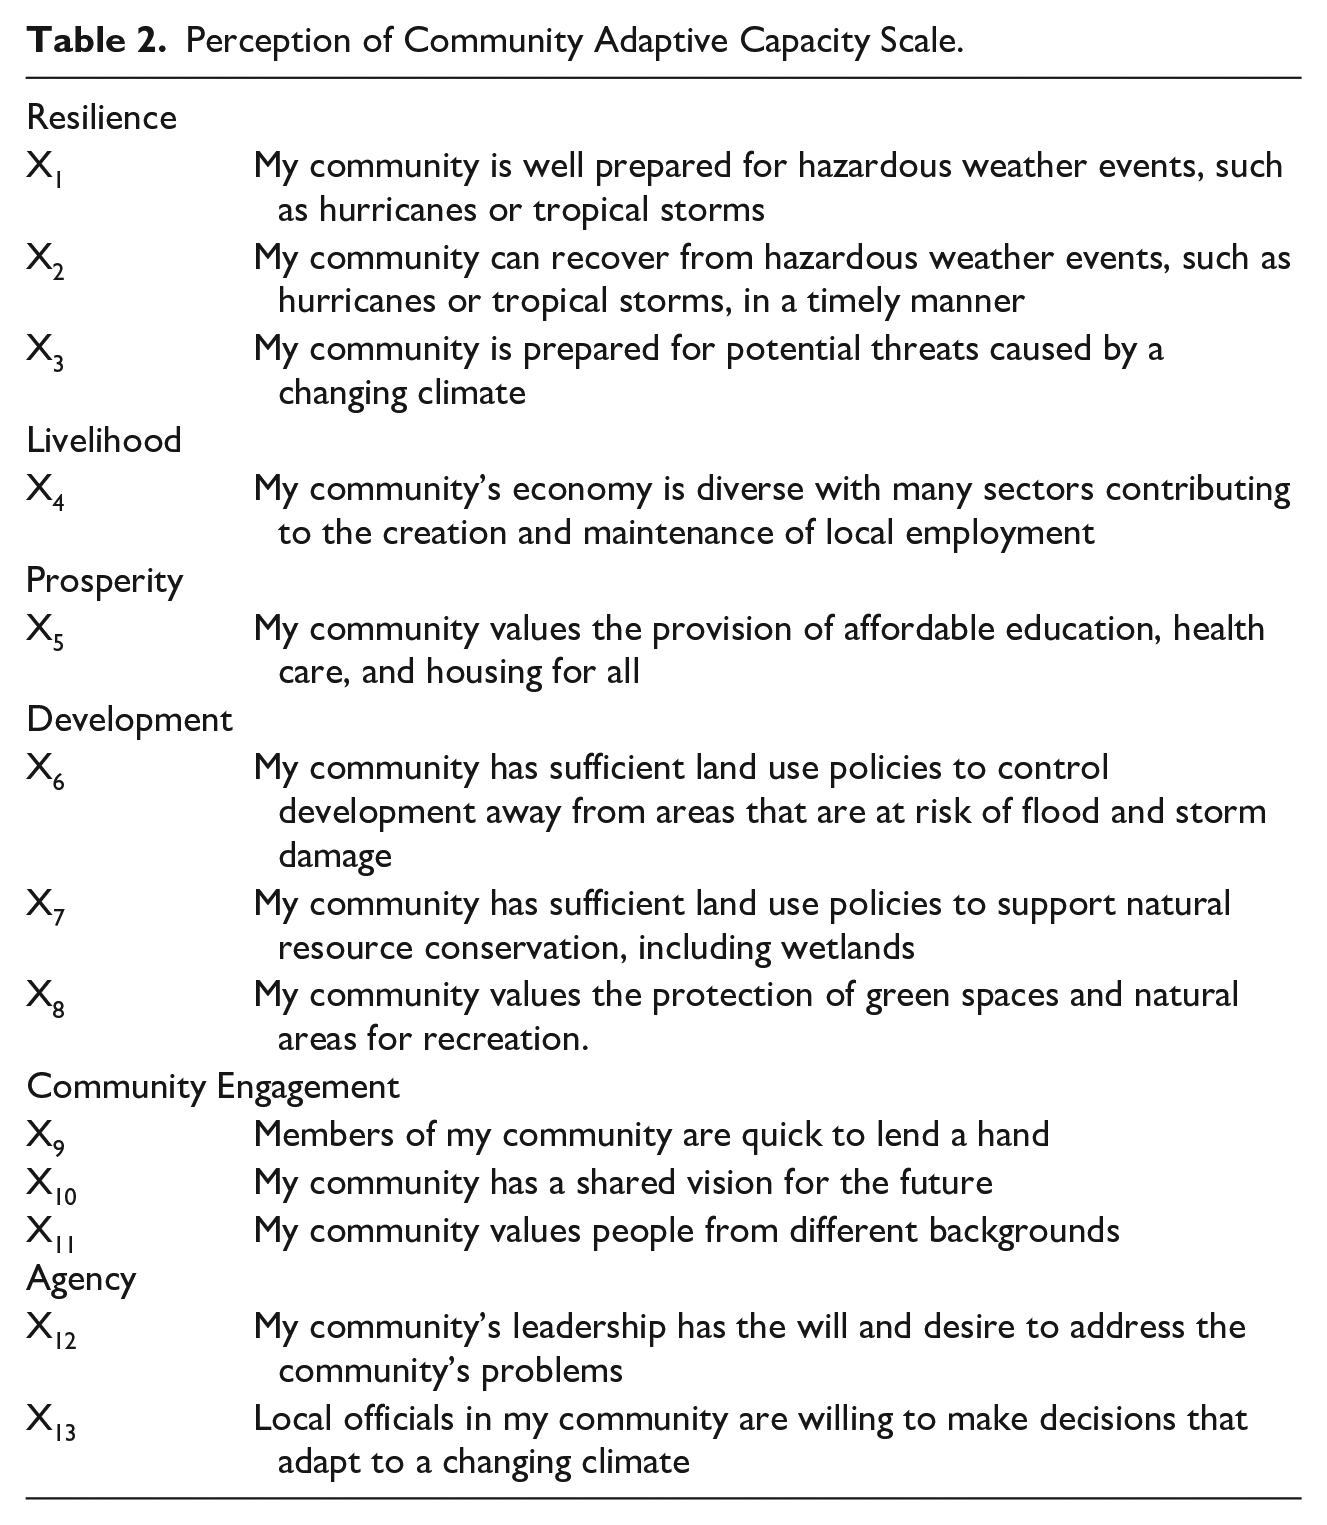
The survey items comprising the PCAC scale are anchored in Jurjonas and Seekamp’s (2018) RCCR framework, owing to its contextual congruence and synergy with the broader literature. We adopt their definitions of each RCCR domain to develop 13 items focused on residents’ beliefs about their community’s vulnerabilities and ability to implement change along the five themes outlined by the framework: livelihood, prosperity, development, community engagement, and agency (Table 2). Resilience was included as a sixth theme to capture perceptions of the overarching push and pull of the five themes. We attempted to strike a balance between parsimony and conceptual coverage as reflected in the definition of each dimension. Respondents were requested to indicate their level of agreement with statements related to their community’s preparedness, ability to adapt to extreme weather events, and a changing coastal climate. Each item was rated on a 5-point Likert scale from strongly agree to strongly disagree.
Perception of Community Adaptive Capacity Scale.
To explore the relationship of adaptive capacities with disaster resilience, the survey included five items to measure perceived vulnerability: (1) Levels of worry when a hurricane or tropical cyclone is approaching on a 5-point Likert scale from not at all worries to extremely worried; (2) Perceived levels of preparedness for hurricanes or tropical cyclones on a 5-point Likert scale from not at all prepared to extremely prepared; and (3) perceptions of the likelihood (i.e., four-point scale from extremely likely through extremely unlikely) of three risks stemming another hurricane event within the next 10 years, including major damage to property in your community, deaths and injuries in your community, and major damage to your home.
Disaster preparedness was operationalized by asking respondents if they had protective features in their homes (i.e., yes or no), including elevated houses, raised A/C units, exterior flood walls, access to temporary or inflatable flood walls or sandbags, walls sealed with waterproof coating, and storm shutters. Disaster displacement was measured by responses to the question: Have you ever considered moving elsewhere to reduce your exposure to the risks of extreme weather events? (out of state). Respondents selected one of four responses: (1) yes, I considered it and am currently making plans, (2) yes, seriously but have not made any plans, (3) yes, but not seriously, (4) no, I’ve never considered moving because of risks created by extreme weather events. Finally, factors that influence evacuation decision-making were operationalized by asking respondents to rate 10 potential evacuation influences, drawn from the literature (Karaye et al, 2019; Marlon et al., 2015; Thompson et al., 2017), on a five-point scale from no influence to very strong influence.
Results
Factor Analyses
Confirmatory factor analysis (CFA; LISREL 10.3.3.26) was used to explore and validate the PCAC scale. CFA was first conducted on Panel One to confirm the hypothesized six-factor structure of the PCAC and evaluate the scale’s psychometric properties. Findings illustrated that the model-implied covariance matrix was a poor fit to the data (χ2 = 2210.91,
We then re-ran the analysis using exploratory factor analysis (EFA; SPSS 29.0.1.0) using maximum likelihood estimation and varimax rotation to explore alternative factor structures of the measure beyond the RCCR framework’s six factors. Following the Kaiser criteria, eigenvalues greater than one were considered to be factors (Guttman, 1956; Kaiser, 1960, 1961). This resulted in a two-factor model, with factor one accounting for 29.4% of the variance and factor two accounting for 24.2% of the variance (Table 3). Six items loaded onto factor one, reflecting respondents’ perceptions of their community values (Community Values; CV). Six items loaded onto factor two reflecting respondents’ perceptions of their community’s capacity to anticipate and overcome disturbances from natural hazards (Anticipatory Capacity; AC). One item (X8) was removed owing to excessive cross loading. All factor loadings were within acceptable thresholds (>.5; Hair et al., 2010). Reliability measures for each factor suggest strong internal consistency in CV (α = .867) and AC (α = .797). Together, these factors accounted for 53.6% of the variance within the measure.
Exploratory Factor Analysis (Panel 1).
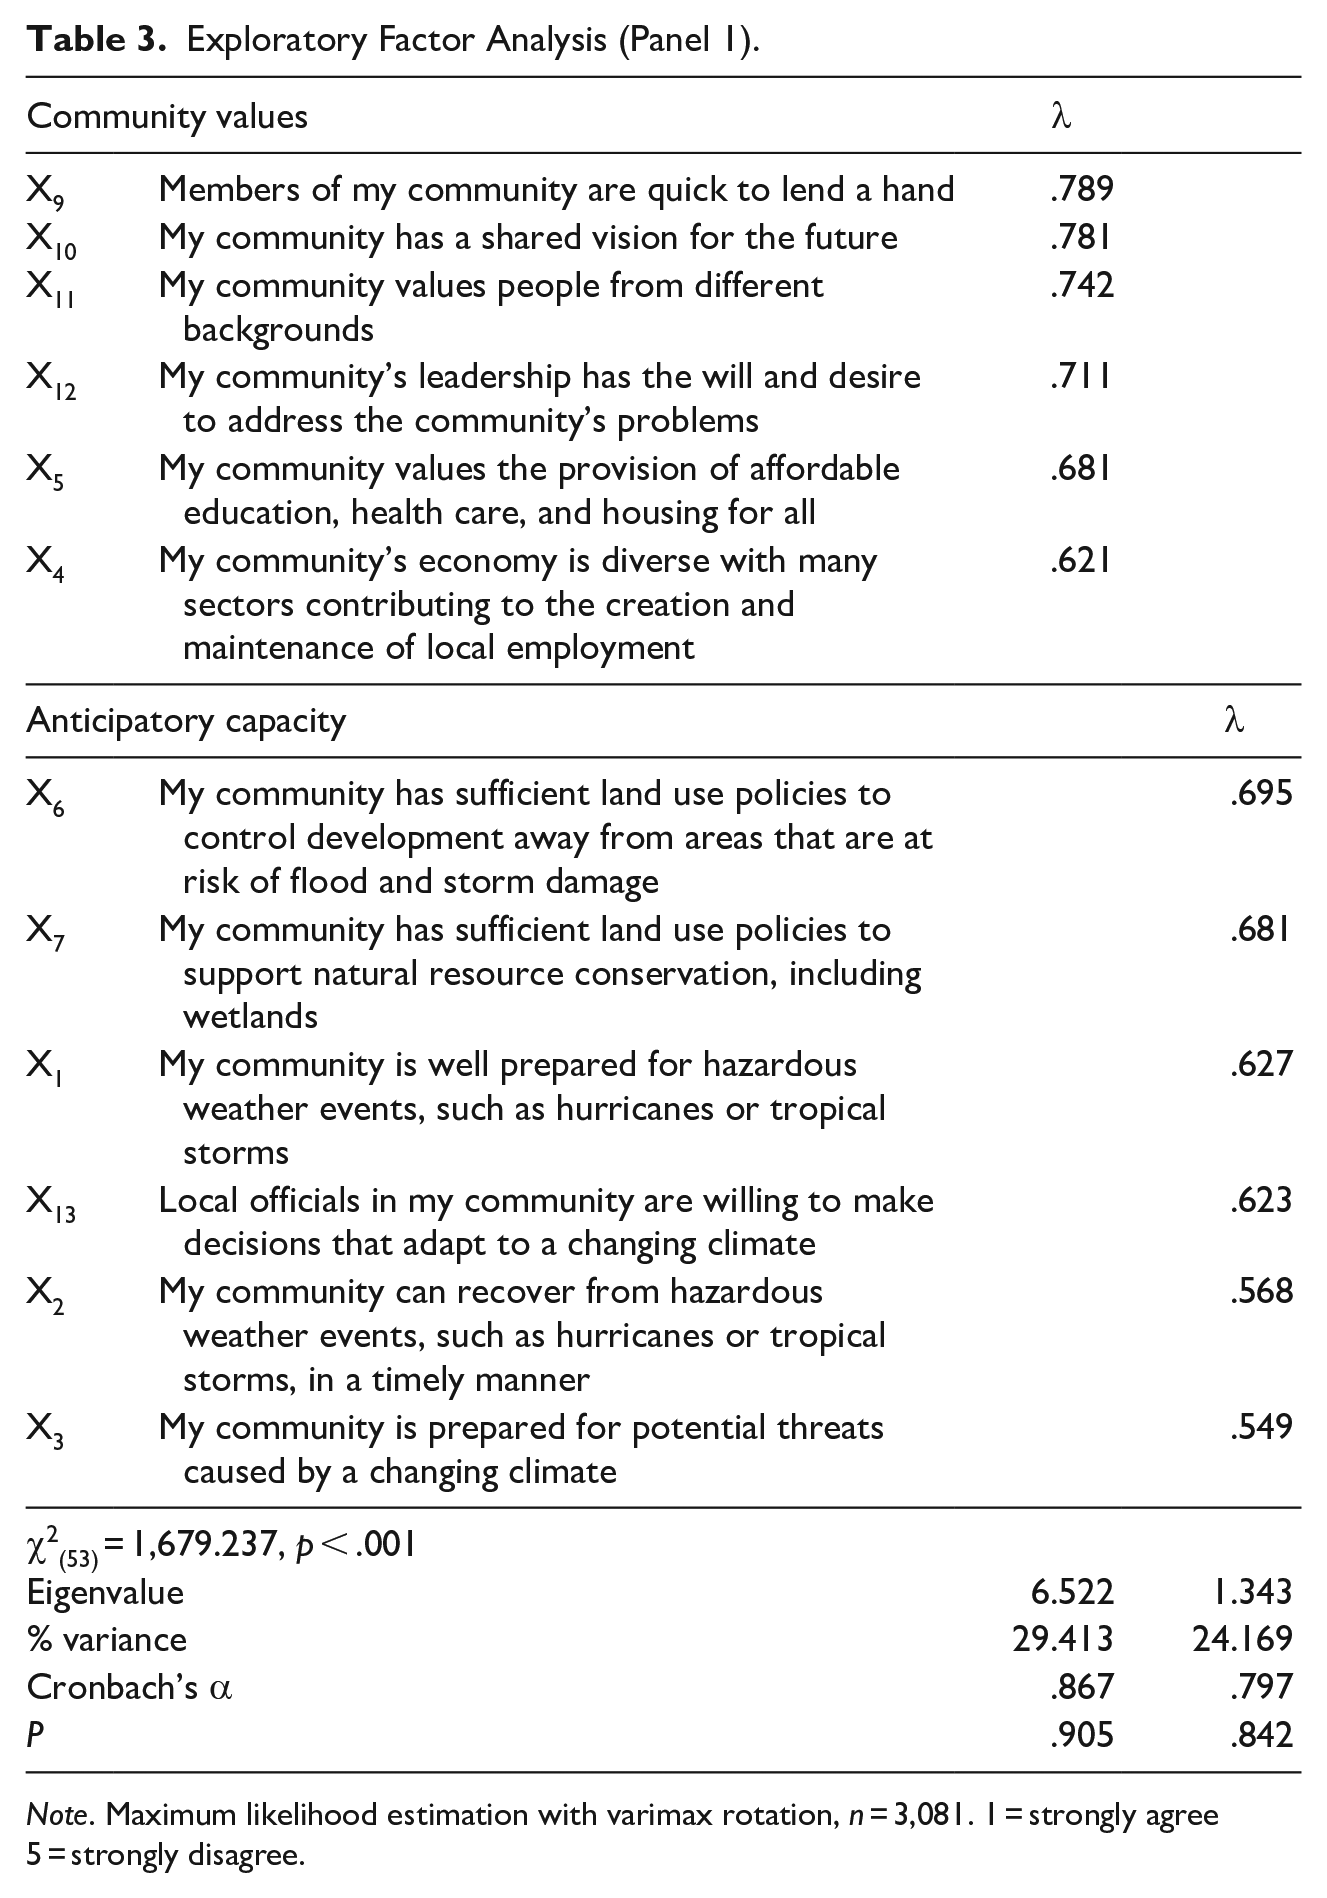
Note. Maximum likelihood estimation with varimax rotation, n = 3,081. 1 = strongly agree 5 = strongly disagree.
To validate the factor structure and further assess the psychometric properties of the scale, multigroup CFA was then conducted using the solution emerging from the EFA. First, we conducted CFA using the pooled sample from panels one and two. The resulting fit indices (χ2 = 1,158.094, df = 50, RMSEA = .076, CFI = .953) displayed adequate fit with several error terms being permitted to covary (i.e., X9 and X11, X6 and X7, X1 and X7). The factor solution displayed satisfactory convergent and discriminant validity (Brown, 2015), with items loading strongly on their parent factor.
To further test the psychometric properties of the PCAC across panels, we conducted multi-group CFA between Panel One and Panel Two. A series of constraints were used to test measurement invariance across the panels (Table 4). Invariance across the panels in the factor structure (configural) and the factor loadings (metric) were supported. Partial scalar invariance was supported with intercepts for two anticipatory capacity indicators (X6, X3) and two community value indicators (X10 and X12) being released. All other intercepts were constrained to be equal across groups.
Summary of Invariance Testing.
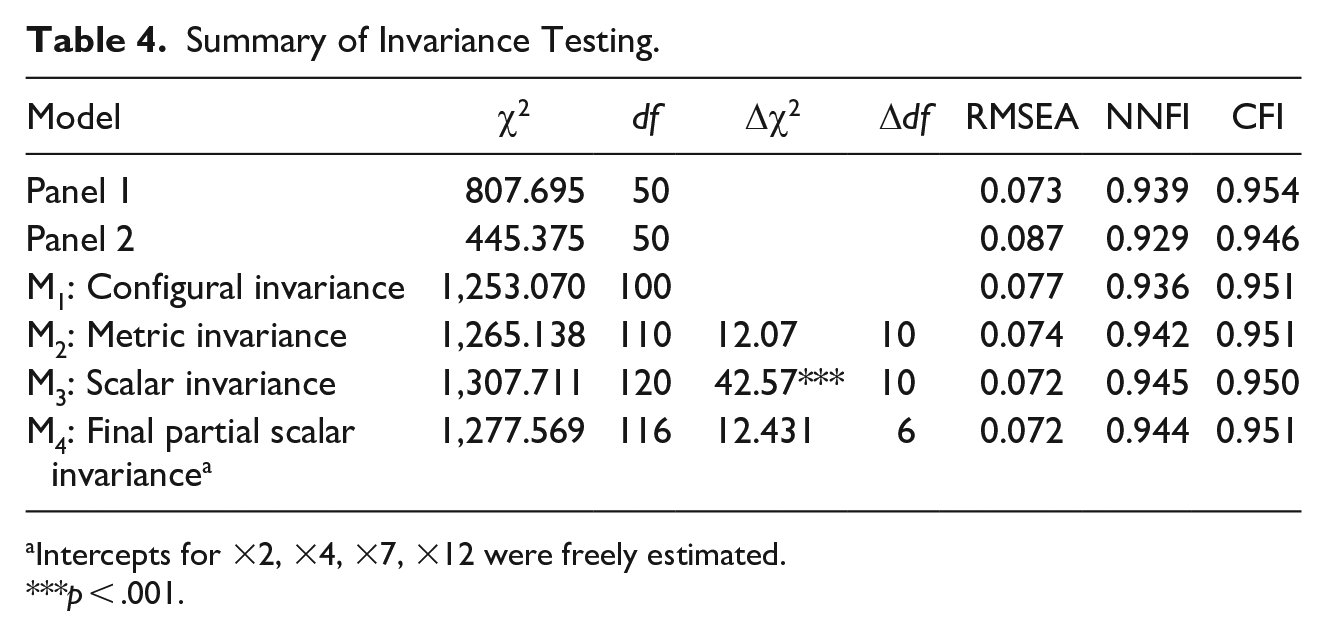
Intercepts for ×2, ×4, ×7, ×12 were freely estimated.
p < .001.
K-Means Cluster Analysis
To examine the ability of the PCAC to reveal meaningful heterogeneity within the sample, novel segments were identified based on their scoring profiles on the PCAC using Panel Two. We then examined variation among segments on managerially relevant indicators of natural hazard preparedness and vulnerability. Heterogeneity was identified using k-means cluster analysis in SPSS (Kodinariya & Makwana, 2013; Steinley, 2006). Cluster profiles were sequentially examined, beginning with a two-cluster solution, followed by three, four, and then five. We settled on a four-cluster solution based on the uniqueness of the emergent cluster’s PCAC scores in addition to the sample distribution (Figure 2, Table A1 in Supplemental Appendix A).
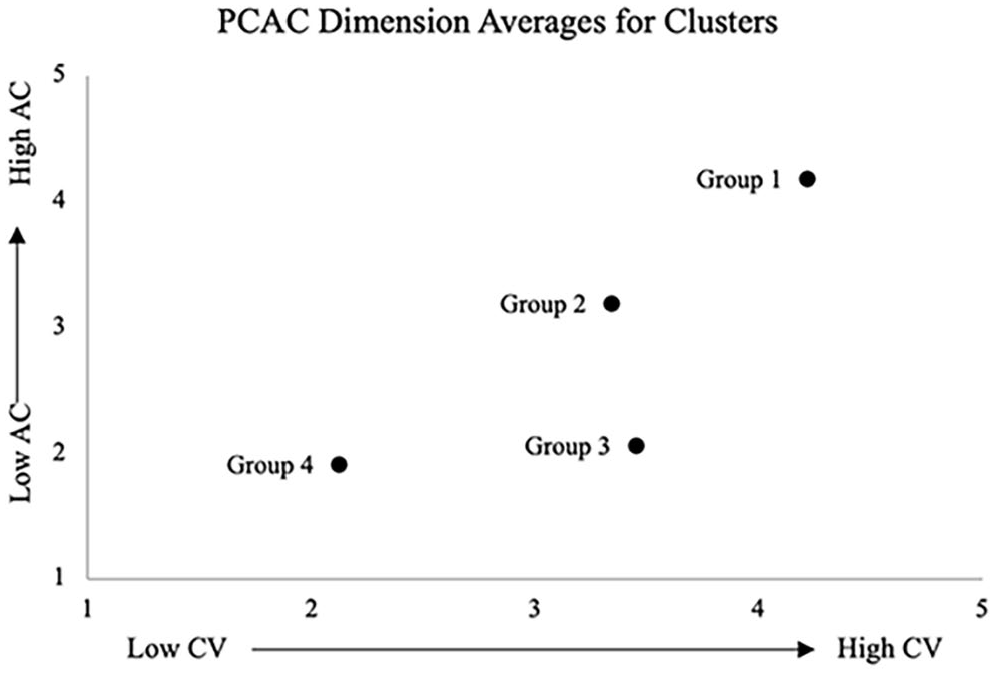
PCAC dimension averages by group.
Group 1 (32.3% of respondents) was comprised of individuals who perceived their community as having strong community structures that value adaptation and the capacity to anticipate and address disturbances (high CV and AC). Group 2 (42.8% of respondents) was comprised of respondents who perceived their community as being in the middle of the road in terms of both CV and AC, recognizing areas to improve upon to increase adaptive capacity. Group 3 (15.2% of respondents) was comprised of respondents who considered their community as valuing community structures and adaptation, but lacked the community capacity to anticipate and overcome disturbances (medium CV and low AC). Lastly, Group 4 (11.7% of respondents) was comprised of individuals who believed their community lacked the values and capacity to address disturbances (low CV and AC).
For the sociodemographic profile of the cluster solution, clusters varied in terms of their education, political affiliation, and age (Table A2 in Supplemental Appendix A). Over 40% of each group consisted of respondents with at least a bachelor’s degree. Those perceiving their communities as having high CV and AC (group 1) were the most likely to have post-graduate education, while those perceiving their communities as having medium CV and AC (group 2) were most likely to have a high school education. Those perceiving their communities as having high CV and AC (group 1) were most likely to be Republicans or lean Republican. While those who reported their communities as having low CV and AC (group 4) were more evenly distributed across Republicans and Democrats. Lastly, those perceiving their communities as having low AC and medium CV (group 3) were older (M = 57.42) than all other groups. There were no significant differences in gender representation across groups.
Perceived Disaster Vulnerability and Resilience
Respondents’ perceptions of their vulnerability to impacts from hurricanes or tropical storms varied across groups. Those perceiving their community as having high CV and AC (group 1) reported their household as being more prepared for a severe hurricane or tropical storm (Table 5). Groups also varied on the perceived likelihood of a hurricane causing significant impacts on their communities in the next 10 years (Table 5). While all groups considered it generally unlikely for a hurricane to cause major damage to property in their community, those with medium CV and low AC (group 3) reported major damage caused by a hurricane in the next 10 years as least likely. Further, those same respondents reported deaths and injuries to people in their community as being least likely. Respondents who perceived their communities as having medium to high CV and AC (groups 1 and 2) considered the likelihood of major damage to their home due to a hurricane or tropical storm in the next 10 years more likely compared to those with medium or low CV and AC (groups 3 and 4).
Perceived Vulnerability.
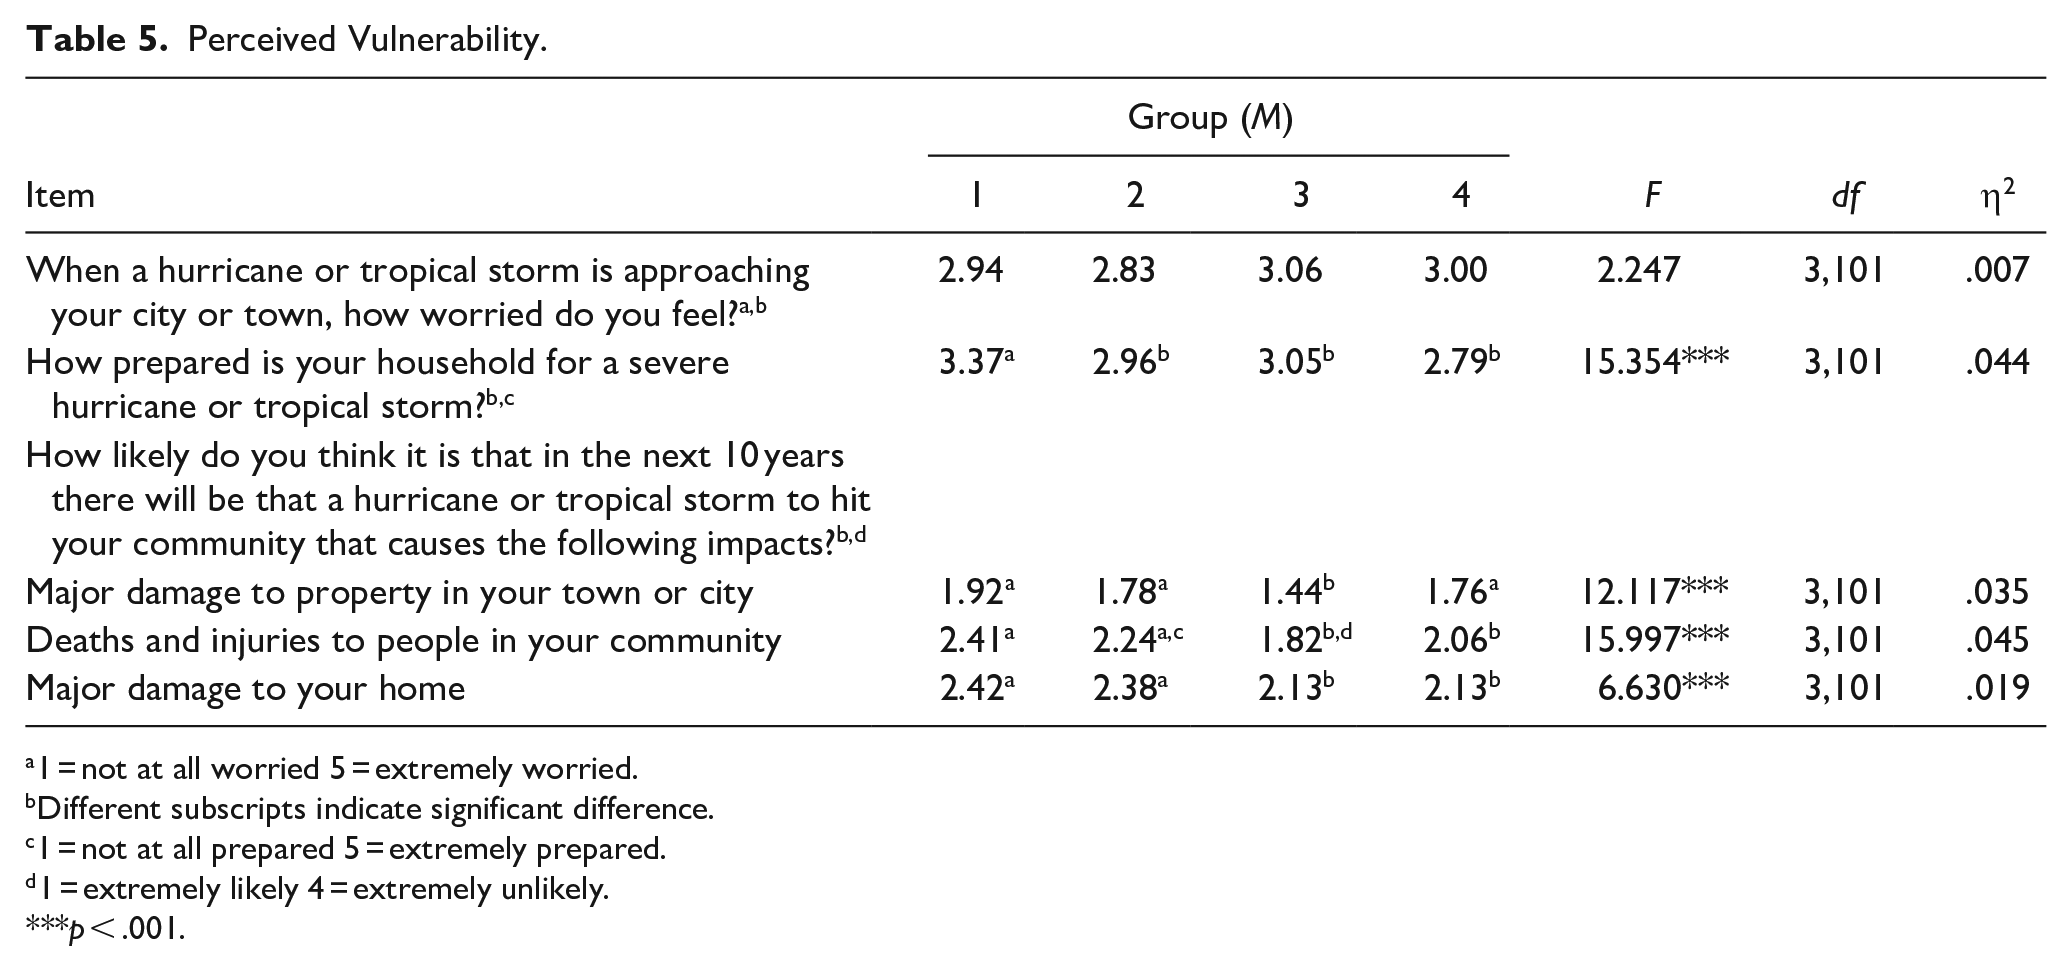
1 = not at all worried 5 = extremely worried.
Different subscripts indicate significant difference.
1 = not at all prepared 5 = extremely prepared.
1 = extremely likely 4 = extremely unlikely.
p < .001.
Self-reported preparedness behaviors varied across groups. Respondents who perceived their communities as having generally stronger values and greater anticipatory capacities were more likely to report hurricane preparedness behaviors relative to those with lower perceptions of community values and anticipatory capacity (Table 6). For instance, those perceiving their communities as having high CV and AC (group 1) were more likely to have raised A/C units, exterior flood walls, temporary or inflatable flood walls or sandbags on hand, walls sealed with waterproof coating, and storm shutters than those with low CV and CAC (group 4).
Preparedness.
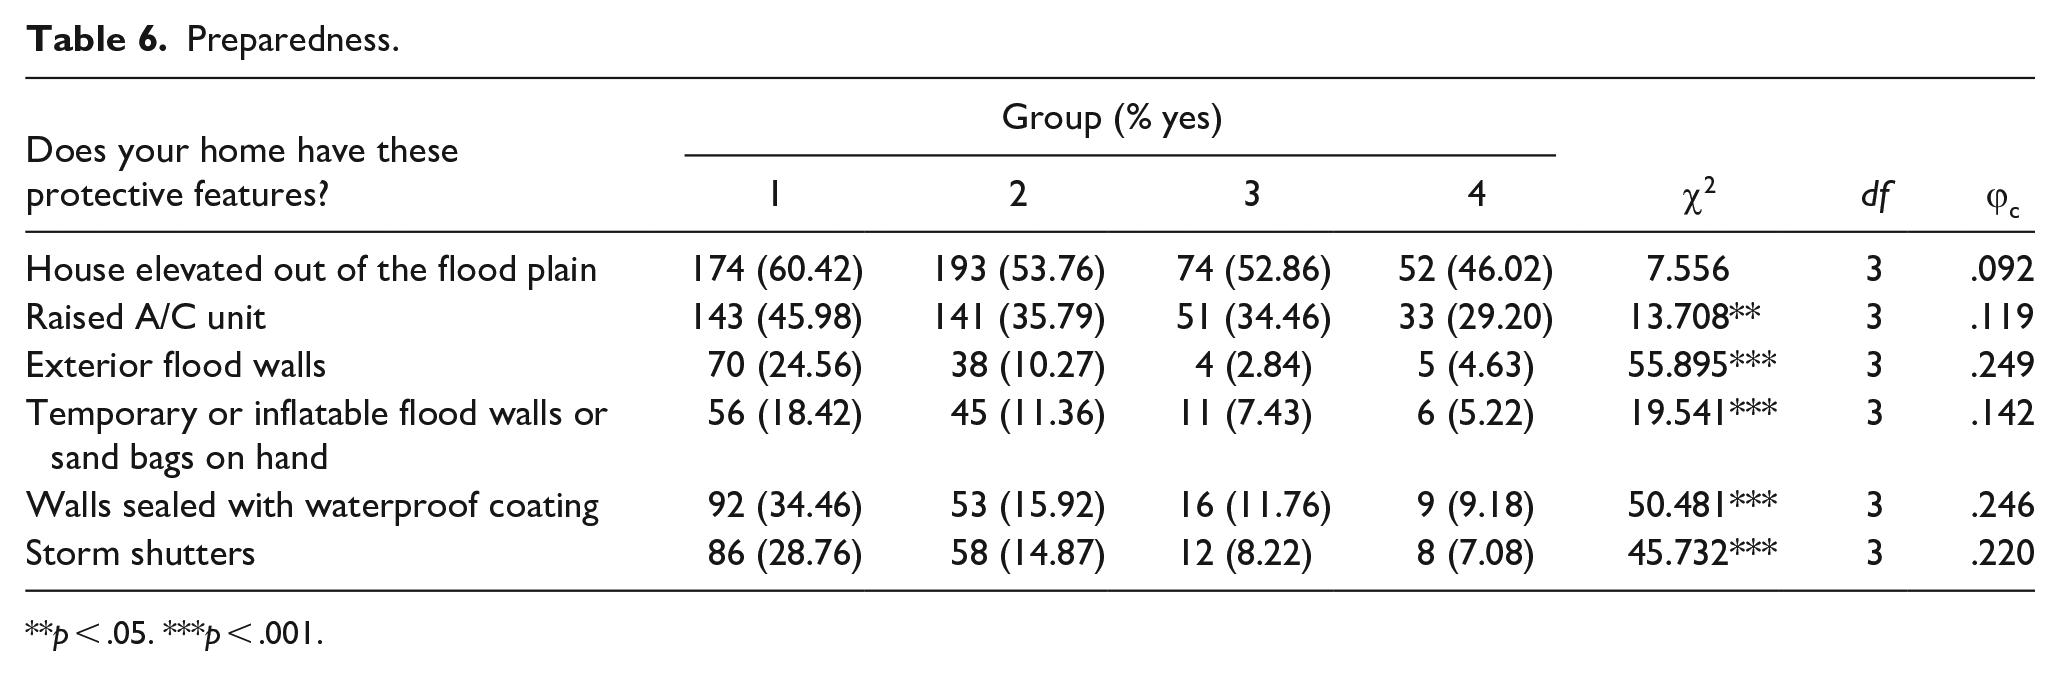
p < .05. ***p < .001.
Natural Hazard Experience & Decision Making
Respondents who considered their communities high in CV and AC (group 1) were most likely to be making plans to move elsewhere to reduce their exposure to natural hazards relative to other groups (Table 7). Those who perceived their communities as having low CV and AC (group 4) were most likely to have considered moving but had not made plans relative to other groups. Overall, the majority of each group had not considered moving because of risks created by extreme weather events.
Displacement.
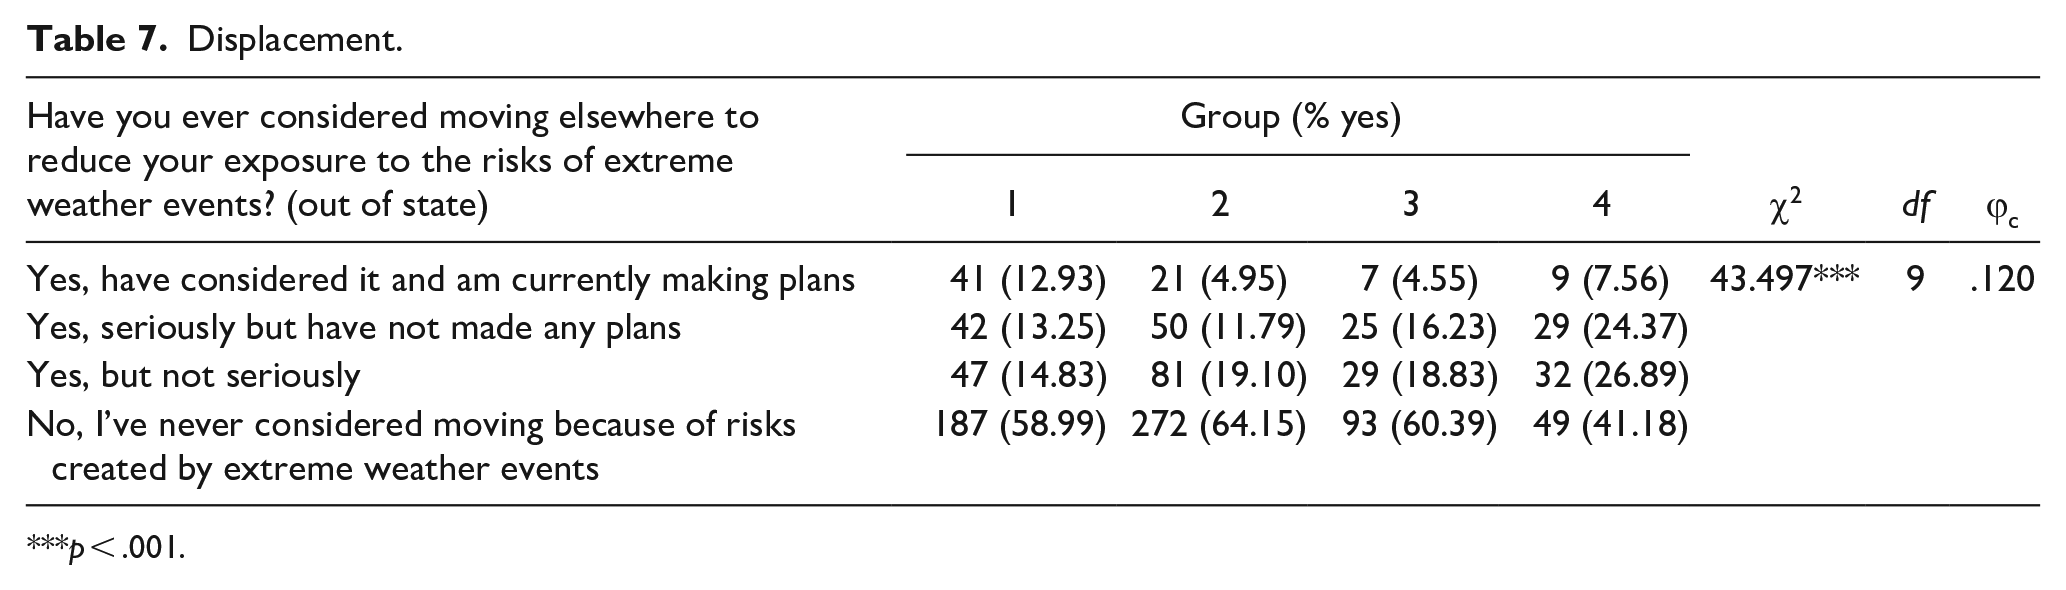
p < .001.
There was no statistical difference between groups in terms of their previous evacuations. However, groups did vary significantly in their reasoning behind not evacuating during a hurricane or tropical storm (Table 8). Those who perceived their community as having high CV and AC (group 1) indicated that storm strength, home build quality, and home location as a significantly stronger influence on their decision to evacuate relative to all other groups.
Evacuation—Factor Influencing Decision.
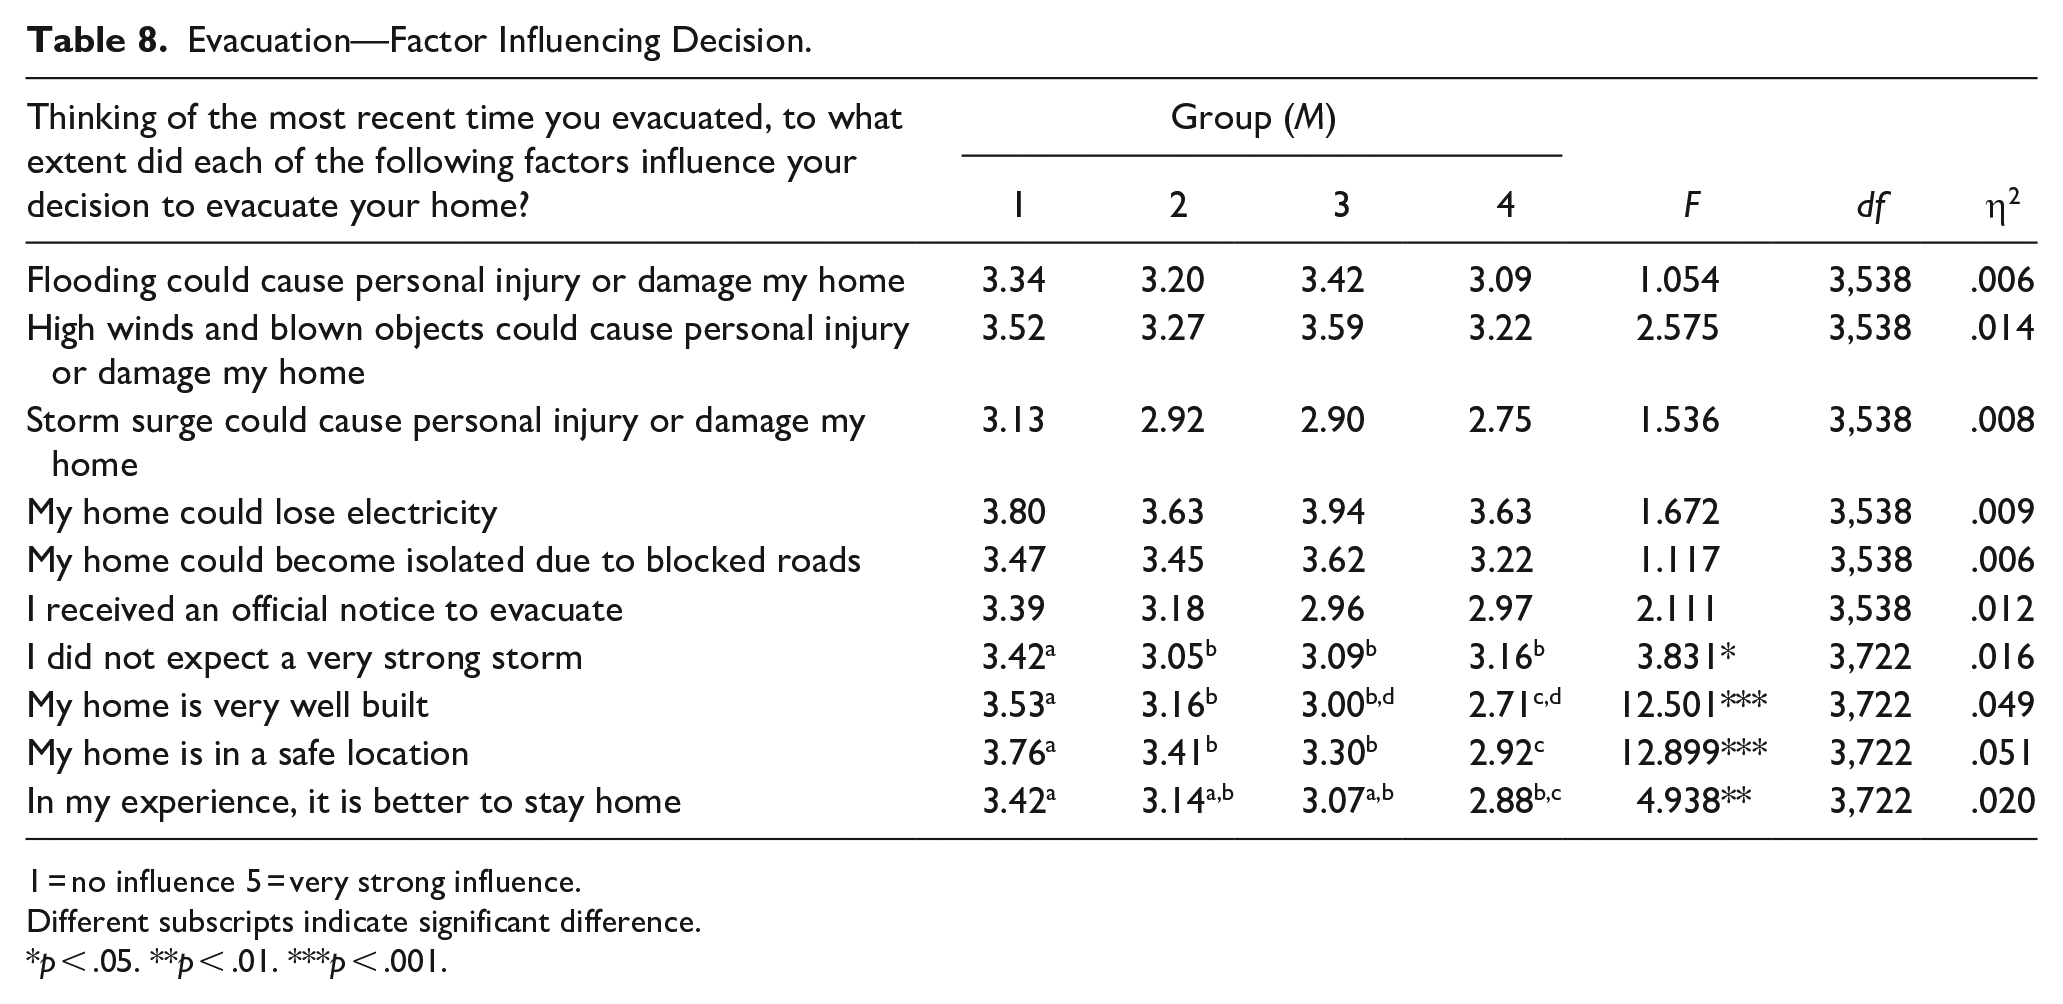
1 = no influence 5 = very strong influence.
Different subscripts indicate significant difference.
p < .05. **p < .01. ***p < .001.
Discussion
Disaster adaptive capacity, vulnerability, and resilience have been measured extensively using objective indicators and proxies (Mortreux & Barnett, 2017; Van Zandt et al., 2012). Although these are important aspects of adaptive capacity, they may overlook the social aspects of SES and the idea that at-risk individuals and communities are acutely aware of their own vulnerabilities and abilities to adapt. Where some objective measures attempt to operationalize social aspects through proxies, there remains a need to develop subjective measures of adaptive capacity anchored in residents’ perceptions of their community’s capacity (Jones & Tanner, 2017; Lockwood et al., 2015). Doing so allows for the direct inclusion of at-risk community members’ understanding of their own vulnerability, adaptive capacity, and resilience in community adaptive capacity building, bypassing the need for proxies to estimate subjective adaptive capacity.
Drawing on the RCCR framework proposed by Jurjonas and Seekamp (2018), we developed the PCAC scale and tested its psychometric properties within the Texas Gulf Coast context. Our findings revealed that two dimensions of residents’ perceptions of community adaptive capacity—anticipatory capacity and community values—displayed good validity and reliability. The community values dimension of the measure focuses on perceptions about community structures that can be leveraged to respond to a disruption, whereas the anticipatory capacity dimension of the measure primarily focuses on perceptions of the community’s structures that anticipate and insulate the community to future change. Our analyses indicated that respondents could be meaningfully segmented based on these dimensions, indicating the scale’s sensitivity for revealing variation in respondents’ perceptions of community adaptive capacity in at-risk coastal communities in Texas.
While the two-factor PCAC does not align with the structure suggested by the RCCR, it does align with the framework’s purpose in the community. The themes in the RCCR framework help members identify vulnerabilities at the community level and promote community engagement and dialogue. While the themes are distinct in the framework, qualitative findings suggest that community members view them as interconnected. “To improve agency within the community, study participants identified the need to improve livelihood diversity, particularly among vulnerable populations, and address rigidity issues caused by local government” (Jurjonas & Seekamp, 2018, p. 145). Our findings support this interconnectedness and suggest that these themes are not distinctly perceived by community members. Instead, they perceive community vulnerabilities collectively, namely through the ability to anticipate and adapt to future impacts (i.e., anticipatory capacity) and the community structures that can be used to effect change (i.e., community values). Although the framework has distinct areas of vulnerability and resilience, they function together to inform community members’ perceptions of adaptive capacity.
Our analyses also revealed associations between Texas Gulf Coast residents’ perceptions of community adaptive capacity and their preparedness behaviors. Respondents perceiving greater adaptive capacity considered themselves to be more prepared as well as reporting the possession of more preparedness resources. These results align with findings from Pollock et al. (2019) and Lucas et al. (2022) who reported that more engaged community members were also more engaged in community preparedness action.
Although respondents’ reported evacuations did not vary across dimensions of the PCAC, those reporting greater community adaptive capacity indicated that characteristics of their homes, including build quality and previous experiences with not evacuating, were more influential in their decisions not to evacuate than those reporting lower community adaptive capacity. These findings suggest that those perceiving their community as being highly adaptive could lead to a stronger tendency to wait out a storm at home instead of evacuating. Previous research has found evidence linking social connections and evacuation decision-making in Florida during Hurricane Matthew in 2016 (J. Collins et al., 2017). Those who considered their community connections as more dependable were less likely to evacuate despite there being an evacuation order and the governor’s urges to evacuate. Our findings build on the work of J. Collins et al. (2017) by illustrating that individuals may perceive themselves and their property as prepared under conditions where they assume their communities possess adequate adaptive capacity, resulting in a reluctance to evacuate. This may place those residents with poorly grounded assumptions of their adaptive capacity at greater risk. Perceiving greater adaptive capacity, real, or otherwise, may ameliorate their concern related to pending natural hazards and inflate their beliefs related to preparedness.
Practically, the PCAC may also be a valuable resource in adaptive capacity initiative implementation. Enhancing adaptative capacity is founded on identifying vulnerable communities and regions (Brooks et al., 2005). The PCAC can be used in tandem with objective measures of vulnerability to support the identification process. Communities that score high on objective vulnerability measures and low on PCAC should be recognized as areas in need of targeted adaptive capacity-building. These communities are areas where citizens are objectively vulnerable while also lacking the social capital and connections to overcome vulnerabilities. Pre- and post-tests using the PCAC could be used as an evaluation tool for capacity-building initiatives. Initiatives that increase individuals’ PCAC scores move communities towards resilience. The PCAC could add to the repertoire of adaptive capacity implementation strategies through community identification and evaluation.
These findings provide insight into three lines of future related research. First, empirical examinations using the PCAC in differing contexts expand the applicability of the PCAC beyond hurricane hazards in the U.S. southwest coastal communities, including different geographies (e.g., Gulf of Mexico, Atlantic, Pacific, Indian, Mediterranean), communities (e.g., communities united by a specific interest or place, urban communities, rural communities), and hazards (e.g., flood, wildlife, heat). Second, our findings indicate that there is an association between perceived adaptive capacity and evacuation decision-making. There is a need to further explore the role of individuals’ perceptions of their community’s adaptive capacity in protective action decision-making and evacuation planning. The focus of this work would examine individuals’ beliefs about their community’s adaptive capacity and how (or if) it inhibits perceived risk and preparedness behavior. Data is also needed that reveals the role of social capital, individual adaptive capacity, and access to resources as confounding variables in the PCAC-protective action relationship. Lastly, the PCAC provides a subjective measure of adaptive capacity. Validating the PCAC with objective measures of adaptive capacity is necessary. Following this validation, applying the PCAC in conjunction with objective measures of vulnerability could provide insight into gaps in community members’ understanding of their community’s vulnerabilities and guide and evaluate targeted adaptive capacity-building measures.
Conclusion
As recent research suggests, subjective aspects of a community are important for translating objective resources into adaptive capacities that build a more resilient community (Lockwood, 2015; Mortreux & Barnett, 2017). A measure of adaptive capacity that is grounded in community members’ lived experiences, perceptions, knowledge, and abilities allows for a greater understanding of the social components of community resilience. This research developed this subjective measure based on the RCCR framework proposed by Jurjonas and Seekamp (2018) and validated the measure in at-risk communities along the Texas Gulf Coast. Results indicate that the developed two-dimensional PCAC measure can meaningfully segment at-risk community members. Further, greater perceptions of adaptive capacity, real, or otherwise, may bolster natural hazard concerns and inflate community members’ beliefs about hazard preparedness, leading to lower evacuation levels and preparedness. Additional research should focus on validating the PCAC measure in contexts beyond the Texas Gulf Coast and other natural hazards.
Supplemental Material
sj-docx-1-eab-10.1177_00139165241307533 – Supplemental material for Validation and Application of a Perception of Community Adaptive Capacity to Coastal Hazards Measure
Supplemental material, sj-docx-1-eab-10.1177_00139165241307533 for Validation and Application of a Perception of Community Adaptive Capacity to Coastal Hazards Measure by Daniel G. Pilgreen, Gerard T. Kyle and Ashley D. Ross in Environment and Behavior
Footnotes
Declaration of Conflicting Interests
The author(s) declared no potential conflicts of interest with respect to the research, authorship, and/or publication of this article.
Funding
The author(s) disclosed receipt of the following financial support for the research, authorship, and/or publication of this article: This research was funded by the Texas A&M University’s President’s Excellence Fund
Supplemental Material
Supplemental material for this article is available online.
Author Biographies
References
Supplementary Material
Please find the following supplemental material available below.
For Open Access articles published under a Creative Commons License, all supplemental material carries the same license as the article it is associated with.
For non-Open Access articles published, all supplemental material carries a non-exclusive license, and permission requests for re-use of supplemental material or any part of supplemental material shall be sent directly to the copyright owner as specified in the copyright notice associated with the article.