
Abstract
Communities near the wildland urban interface (WUI) are exposed to a mix of three interconnected hazards (wildfire, flood, and mudslide), and understanding multi-hazard perceptions is critically important for emergency preparation and hazard mitigation—particularly given the WUI’s rapid expansion and intensifying environmental hazards. Based on a survey of residents living near recent burn scars in Southern California, we document cross-over effects in hazard perceptions, where resident experience with one hazard was associated with greater hazard rankings for other hazards. Additionally, for all three hazards analyzed we document perceptions of increasing hazard levels with increasing spatial scales (home, near-home, neighborhood, and community), providing evidence of spatial optimism, or the tendency to discount proximate hazards. This study stresses the importance of using a multi-hazard and multi-scale approach for understanding and responding to local level environmental hazards.
Introduction
The wildland urban interface (WUI), or areas in which residential development is located near or intermingled with wildland vegetation, has greatly expanded due to construction of new housing near natural amenities and represents the fastest growing land use type in the United States (Carlson et al., 2022; Radeloff et al., 2018). In addition to negative wildlife, habitat, and ecological impacts (Jenerette et al., 2022), rapid WUI growth amplifies wildfire risks by placing people and structures in greater proximity to flammable vegetation (Kramer et al., 2019). Such land use practices coupled with a changing climate have increased the frequency and intensity of wildfires and amplified the risk of post-wildfire flooding and debris flows, particularly during high intensity rainfall events in arid and semi-arid regions such as Southern California (Cheung & Giardino, 2023; Kean & Staley, 2021), as tragically played out in the debris flow that followed the 2017 Thomas Fire and resulted in 23 fatalities, 167 injuries, 558 damaged buildings, and over a billion dollars in recovery costs and property and infrastructure damage (Serra-Llobet et al., 2023).
An expanded understanding of how residents perceive wildfire, flood, and mudslide hazards across WUI communities is critically needed for emergency and adaptation planning. Most research on natural hazard perceptions has focused on a single hazard (Burnett & Edgeley, 2023; Martin et al., 2009). but local-level analysis of multi-hazard “cross-over” effects could help understand how WUI residents perceive and prioritize interconnected, cascading WUI hazards. Cross-over effects occur when experience with one hazard (e.g., wildfire) is associated with the perception of related hazards (e.g., flooding or mudslides; Knuth et al., 2014; Sullivan-Wiley & Short Gianotti, 2017). Additional multi-hazard research is also needed to understand how the scale at which perception is measured can impact perceptions, given previous research indicates that resident rankings of home-level hazards are significantly lower than community-level rankings, suggesting residents discount nearby risks due to spatial optimism, or the tendency to view proximate environmental conditions as more favorable than distant ones (Collins, 2012; Coquet et al., 2019).
Perceptions of WUI hazards could vary spatially given that the topographic, infrastructure, and population dynamics that drive and connect these hazards can vary substantially within WUI zones (Figure 1). The WUI can be defined as areas with a mix of wildland vegetation and developed land within 1.5 miles of a large contiguous area of wildland vegetation (Radeloff et al., 2005). WUI areas can be further subdivided into the intermix WUI zone, in which low-density buildings intermingle with at least 50% wildland vegetation, and the interface WUI zone, in which higher-density development is surrounded by less than 50% wildland vegetation (Carlson et al., 2022).
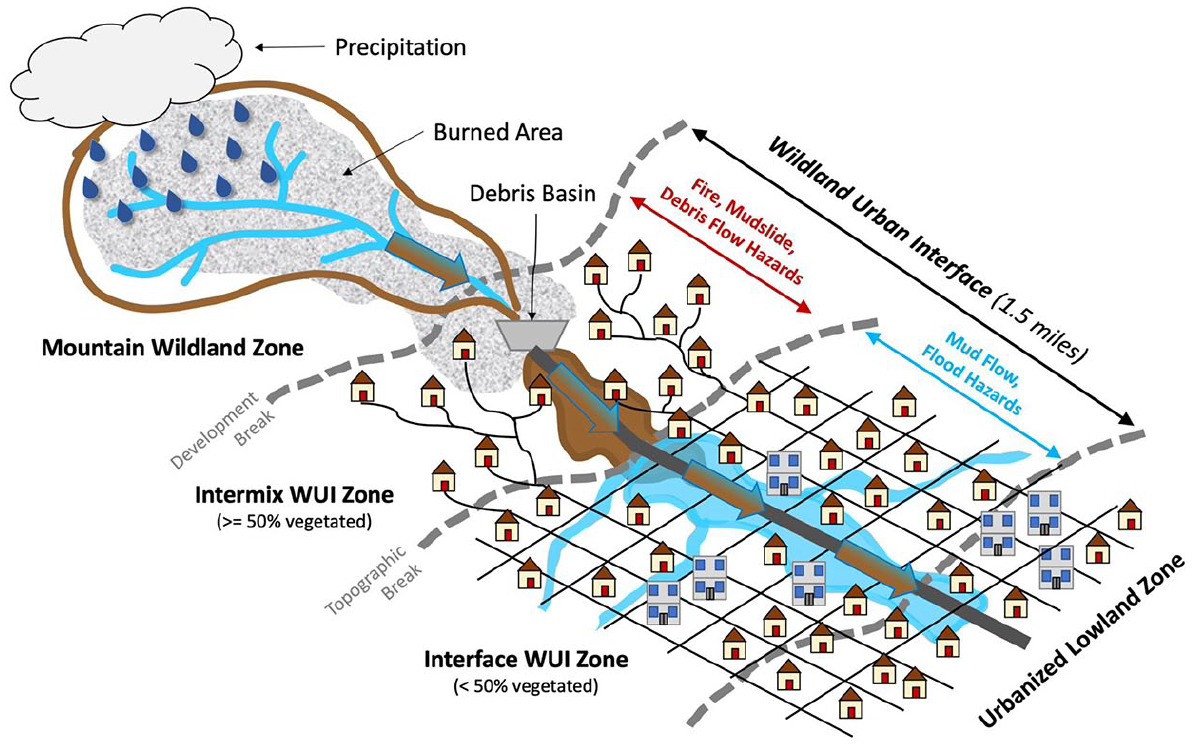
Conceptual framework of cascading multi-hazard dynamics in WUI communities.
WUI areas with a Mediterranean climate and chaparral biome such as Southern California experience a “fire and flood cycle” in which wildfires commonly occur in the mountain wildland zone immediately before wet winter months (Figure 1). They strip vegetation from hillslopes, alter soil properties and damage root systems that would otherwise stabilize hillslopes, creating unstable conditions that can last 5 or more years (Wagenbrenner et al., 2021). With little warning, rainfall during this recovery period can result in raging torrents of runoff down steep slopes that are 1 to 2 orders of magnitude greater compared to pre-burn conditions (Cannon & Degraff, 2009; Jong-Levinger et al., 2022). Runoff can transform into sediment-laden floods and mud flows that can mobilize and transport masses of debris, trees, sediment, and large boulders along established drainage pathways with great force until they encounter a constriction or blockage (Morell et al., 2021).
Without regular maintenance to clear sediment buildup and vegetative growth in debris basins, downstream flood channels designed to carry floodwaters safely through WUI communities can become overwhelmed by post-wildfire flows. Channel clogging and increased flow resistance increases the likelihood that floodwaters will break from established flow paths and cause “ultrahazardous” flooding and damage far from the mountainous edge (Sanders & Grant, 2020; Serra-Llobet et al., 2023). Residents of these areas who assume they are adequately protected by flood controls may be relatively unaware of their potential post-wildfire risks and could therefore be under-prepared to cope with flood-related disasters, a dynamic referred to as the “levee effect” (Hutton et al., 2018; Tobin, 1995). Trust in wildfire protections such as wildland management and thinning could trigger a similar dampening effect on resident perceptions (Martin et al., 2009; Meldrum et al., 2015; Thapa et al., 2023).
In addition, socio-demographic differences across WUI zones could influence hazard perceptions given risk perception varies by social group and prior hazard experience (Lambrou et al., 2023; Zoll et al., 2023). For instance, residents of the intermix WUI zone near wildland areas, which tend to be higher income and White (Garrison & Huxman, 2020; Masri et al., 2021), may be more directly impacted by wildfire and mudslide hazards. Those living farther from the wildlands in the interface WUI or urban lowland zones, which tend to be relatively lower income and Non-White, may be more likely to experience mud flows and floods. Understanding how perceptions vary across these dimensions could inform community-level emergency preparation and response efforts.
To address these gaps in our understanding of how cross-over effects and spatial optimism could influence resident perceptions of WUI hazards, the current study surveyed residents of communities located near recent burn scars of wildfires in the Santa Ana and San Bernardino Mountain ranges in Southern California to examine how WUI hazard perceptions vary across four local spatial levels (home, near-home, neighborhood, community) for wildfire, flood, and mudslide hazards. The literature review section discusses multi-hazard approaches for assessing cross-over effects in the experience and perception of compound, cascading hazards and discusses the influence that spatial optimism could play in local-level perceptions of environmental hazards. The methods section details the survey design and the analytical approach used in the results section to analyze cross-over effects in wildfire, flood, and mudslide hazards across local spatial levels and to assess spatial optimism, or the discounting of perceived home-level hazards. Both stages of analysis account for the influence of socio-demographic characteristics, community dynamics, prior hazard experience, government hazard protective measures, and residential proximity to hazards. The final section discusses implications for emergency and adaptation planning and discuses recommendations for future research.
Literature Review
Cross-Over Effects of Multi-Hazard Experience and Perception
Compound hazards refer to events with multiple consecutive or concurrent drivers (e.g., intensifying drought and precipitation extremes) and/or hazards (e.g., wildfires, floods, mudslides) that have implications for natural or human systems, infrastructure, or populations (AghaKouchak et al., 2020). Cascading or consecutive hazards refer to when two or more disasters occur in succession and overlap spatially and temporally before recovery is complete from the prior event (De Ruiter et al., 2020). In the case of WUI hazards, wildfire, flood, and debris flows geographically co-occur with varying intensity across WUI zones and cascade on the temporal scale of weeks, such as when the January 2018 debris flows were triggered by intense rainfall after the December 2017 Thomas Fire (Serra-Llobet et al., 2023), or on the scale of years depending on the size and intensity of the burn event, precipitation patterns, and the number of years it takes for mountainous vegetation and soils to recover to pre-fire conditions (Cannon & Degraff, 2009; Wagenbrenner et al., 2021).
Substantial challenges remain to analyzing the dynamics of simultaneous multiple hazards and, unfortunately, we know little about how individual residents perceive and prioritize interconnected, cascading WUI hazards (Kappes et al., 2012). In fact, studies focused specifically on understanding perceptions of natural hazards among WUI residents tend to focus only a single natural hazard (Burnett & Edgeley, 2023; Martin et al., 2009; Meldrum et al., 2015). Most available multi-hazard studies compare side-by-side risk rankings of different hazards or report hazard correlations (Lin et al., 2008; Lindell & Hwang, 2008; Peers et al., 2021; Perry & Lindell, 2008), but only a few studies assess “cross-over” effects, or how prior experience with one hazard influences perceptions of other hazards. Knuth et al. (2014) examined perceptions of European survivors of several different emergency events and found evidence of cross-over effects. Their multivariate models revealed that flood hazard perceptions were not only associated with prior flood experience but were also influenced by experience with domestic fires and earthquake events. Sullivan-Wiley and Short Gianotti (2017) examined potential cross-over effects in the perception of eight hazards in eastern Uganda. Their multivariate results suggested experience with landslides was associated with perceptions of floods. In their study of earthquake, flood, landslide, and volcanic hazards in Kyushu, Japan, Tanner (2022) found that more experience and exposure with some hazards affected the risk perceptions of other hazards. To our knowledge, the only available study on perception cross-over effects among WUI residents is by Schulte and Miller (2010). They found that wildfire risk perception and concern of homeowners in WUI areas of Colorado were significantly influenced by perceptions of climate weather impacts measured as a function of perceived trends in drought and warming.
Local-Level Hazard Perception and Spatial Optimism
Only two studies to our knowledge examined how wildfire or flood risk perceptions differed when residents were asked to rank hazards at different local geographic levels. Collins (2012) analyzed wildfire perceptions of WUI residents of Arizona’s White Mountains by asking them to rank the level of wildfire hazard at four ascending spatial scales: home structure, property landscape, neighborhood, and community. Results indicated that the mean perceived hazard level was significantly different and increased with each broader geographic scale such that reported home-level hazard rankings were the lowest and community-level rankings were the highest. He also found significant differences in hazard perceptions for participant subgroups at some but not all spatial scales. For instance, residents with higher property landscape hazards had higher hazard rankings at the home, near-home, and neighborhood levels compared to other residents, but not at the community level. Renters had higher hazard rankings at the home level and, conversely, owners had higher hazard rankings at the community level. Using a similar approach, Coquet et al. (2019) found that residents of four coastal communities in France ranked the current coastal flood risk at a proximate home level more favorably (having lower risk) than risks at geographically broader scales (town, country, and world). They did not observe significant differences between town and country risk rankings but found that rankings at each of these levels were significantly lower than global-level hazard rankings.
Both studies found residents perceived that hazards at broader geographic scales were more severe than home or local hazards, a pattern that both authors attribute to spatial optimism, or the tendency to view more proximate environmental conditions as more favorable than distant ones. Spatial optimism is a geographic dimension of optimistic bias which has been observed for a wide range of natural, technological, and environmental issues across multiple countries. For instance, Uzzell (2000) examined the perceived severity of environmental problems in four countries at five scales (oneself, town/city, country, continent, world), Gifford et al. (2009) examined perceptions of environmental quality in 18 countries at three scales (local, national, and global levels), and Jakovcevic et al. (2013) examined environmental quality in one country at three scales (city, country, world). These and other studies have found consistent evidence that a variety of environmental concerns increase as the breadth of spatial perception scale increases from local to global levels.
A definitive explanation for spatial optimism has not emerged in the literature (Retchless, 2018). Schultz et al. (2014) found limited evidence that place identity was associated with spatial optimism but found stronger evidence that happier and younger individuals had greater spatial optimism, which the authors associate with greater positivity or flexibility when interpreting local environmental conditions. These individuals could employ place-protective reasoning and hazard discounting when proximate environmental problems threaten their pre-existing emotional place attachment (Devine-Wright, 2009). That is, individuals could shift the focus of their concerns away from closer, more proximate scales to more distant scales as a self-protective, coping mechanism that discounts or denies local threat levels.
Others posit that media plays a role in shaping more severe perceptions of distant or global environmental problems by representing these challenges as complex, uncertain, and more psychologically distant both temporally and spatially (Gifford et al., 2009; Uzzell, 2000). Related, construal theory suggests that threats that are observed at more distant scales in terms of space, time, or socially tend to be construed more abstractly compared to more specific, local situations which tend to be construed as more concrete or detailed (Tang & Chooi, 2023). In fact, such psychological distancing processes have been identified as a barrier to taking pro-environmental and protective actions because environmental problems are construed as so large and far away that people feel powerless to address them (Retchless, 2018).
Data and Methods
Study Objectives
Residents living within WUI areas near recent wildfire burn scars in southern California were surveyed to better understand perceptions of three cascading environmental hazards which co-occur in a multi-year fire and flood cycle that plays out across intermix and interface WUI zones: wildfire, flood, and mudslide hazards. First, this study seeks to better understand variations in perceptions of these WUI hazards relative to five types of factors: socio-demographic, community, hazard experience and awareness, hazard protections, and hazard proximity. Second, it examines how WUI hazard perceptions vary across four local spatial levels (home, near-home, neighborhood, community) to assess whether spatial optimism exists for WUI hazards and how it varies by these factors. Third, this study assesses potential cross-over effects in WUI hazards, or whether experience with one of these hazards affects the perceived risk for other WUI hazards.
Survey Areas
Survey subareas include residential communities located near the burn scars of wildfires that occurred since 2017 in the Santa Ana and San Bernardino Mountain ranges in southern California (Figure 2, panel b). They represent a range of WUI communities with both intermix and interface residential areas and differences in the intensity of development, the provision of flood control infrastructure, and socio-demographic characteristics.
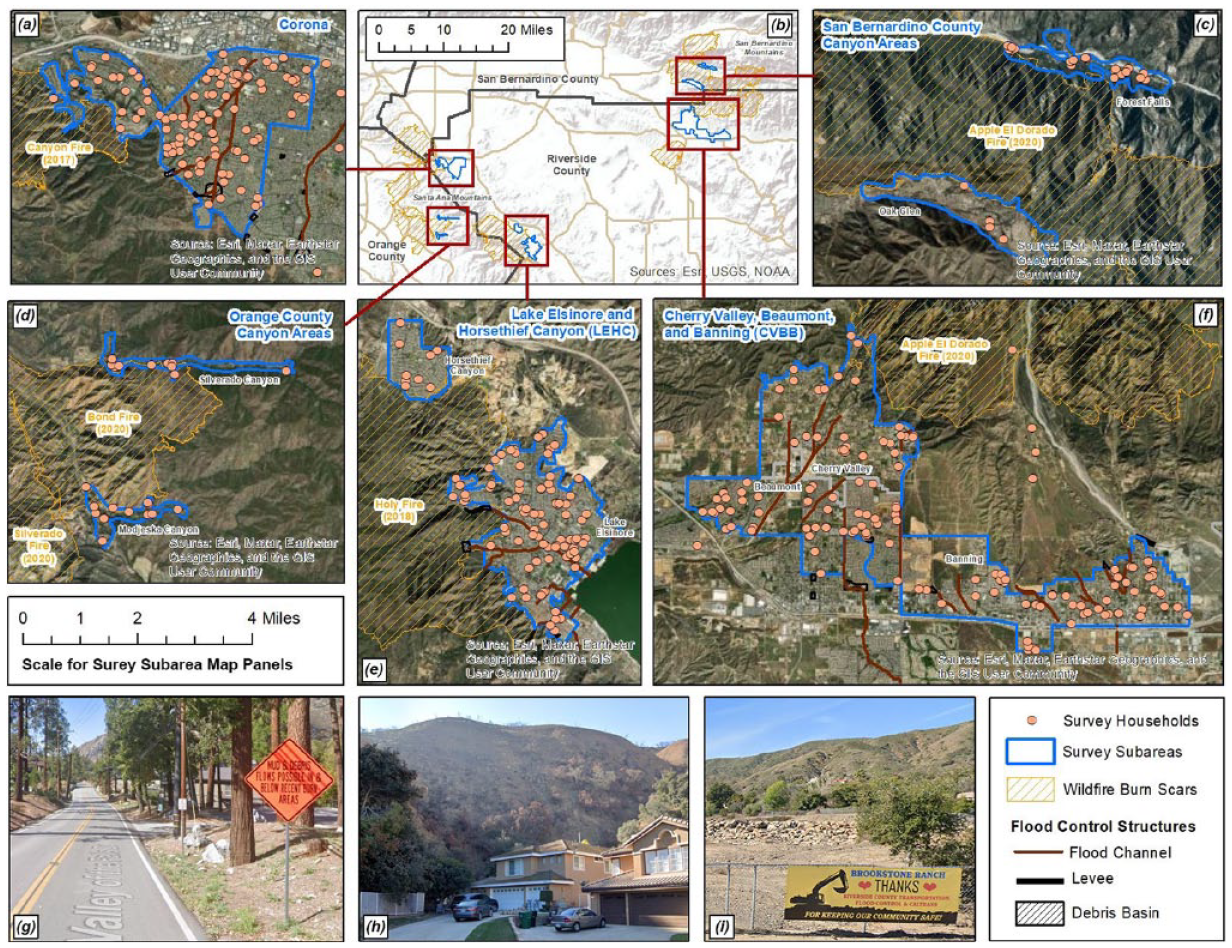
Overview of WUI survey subareas. Survey subarea images: (a) Corona subarea, (b) Overview map of survey subareas, (c) San Bernardino County canyon subareas, (d) Orange County canyon subareas, (e) Lake Elsinore and Horsethief Canyon (LEHC) subareas, (f) Cherry Valley, Beaumont, and Banning (CVBB) subareas, (g) warning sign in a canyon area, “MUD & DEBRIS FLOWS POSSIBLE IN & BELOW BURN AREAS” (2022), (h) residential development below the Holy Fire burn scar (2018), and (i) Banner thanking county governmental agencies “FOR KEEPING OUR COMMUNITY SAFE” along a road crossing an unlined flood channel with a rock berm (2020).
Santa Ana Mountain subareas in eastern Riverside County include northwest City of Corona near the 2017 Canyon Fire burn scar (panel a) and the LEHC subarea which includes northwest City of Lake Elsinore and the unincorporated development of Horsethief Canyon near the 2018 Holy Fire burn scar (panel e). The Corona subarea includes recently developed intermix residential developments along ridges which are surrounded by vegetated canyons and are adjacent to the burn scar, and denser interface urban development farther from the scar with large debris basins along the mountainous edge of development and a dense network of concrete flood channels and storm drains that carry runoff from the mountains toward the Santa Ana River. The LEHC subarea also includes intermix development along ridges extending into recently burned mountainous areas. Like Corona, it includes debris basins and a network of concrete flood channels and storm drains but also has unlined earthen flood channels along which some properties have experienced mudflow and erosion since the 2018 fire. The Corona subarea has a higher representation of renters compared to all subareas (39% vs. 32%) and a higher percentage of households with income over $100,000/year (44% vs. 37%; ACS, 2017–2021).
Survey subareas along the San Bernardino Mountains in Riverside County include the CVBB subarea which includes Cherry Valley and northern portions of the Cities of Beaumont and Banning near the 2020 Apple El Dorado Fire burn scar (panel f). Cherry Valley is an unincorporated and peri-urban community with more dispersed households and a mix of natural stream paths and flood control channels from adjacent mountainous areas. Compared to all subareas, it has the highest home ownership rate (86% vs. 68%), the highest percentage of non-Hispanic White residents (67% vs. 34%), and the highest percentage of households with income over $100,000/year (49% vs. 37%). It is located just north of the rapidly developing city of Beaumont which includes several recently constructed large, dense tract home developments with engineered flood control channels and storm drain systems and which has the lowest percentage of non-Hispanic White residents compared to other subareas (26% vs. 34%). The CVBB area also includes the northern portion of Banning between the lower mountain range to the north and the I-10 freeway to the south which has an older housing stock and is a lower-income community compared to other subareas with the highest percentage of households with income less than $75,000/year (72% vs. 48%; ACS, 2017–2021).
Survey canyon subareas include residential communities located within canyons and valleys, including two unincorporated canyon areas on the Orange County portion of the Santa Ana Mountains, Silverado Canyon and Modjeska Canyon, located near the 2020 Bond Fire and 2020 Silverado Fire burn scars (panel d). They also include the two unincorporated and higher elevation areas in the San Bernardino County Mountains in San Bernardino County, Oak Glen and Forest Falls, which, like CVBB areas, were impacted by the 2020 Apple El Dorado Fire (panel c). All canyon subareas have been impacted by post-wildfire mudslide events and were subject to several evacuation orders during periods of heavy rain since the 2020 fires. They represent intermix WUI given residences in these areas tend to be located within or near heavily forested and vegetated areas. Residential properties in these areas often directly abut steep slopes which could carry a surge of mud, rocks, and even large boulders into homes during severe rainfall. Residents of canyon subareas have higher home ownership rates (81% vs. 68% for all subareas) and have a higher percentage of households with income over $100,000/year (45% vs. 37%; ACS, 2017–2021).
Survey Implementation
The study procedures were classified as exempt by the University of California, Irvine’s Institutional Review Board and did not require IRB approval. All survey respondents provided informed consent before taking the survey.
Invitation fliers were distributed to all residential addresses on postal mail routes in the survey subareas using the United States Postal Service direct mail service called Every Door Direct Mail (EDDM). This postal carrier-route service is lower cost than first class mail distribution and does not require names or addresses, making it a valuable tool for surveys requiring saturation outreach for geographically focused surveys (Grubert, 2019). Fliers invited residents to access the online survey regarding their concerns about and experience with wildfire, flood, and mudslide hazards in both English and Spanish given 34% of households in the survey areas reported in the census they spoke Spanish (ACS, 2017–2021). As an incentive to participate, survey participants were given the opportunity to enter a raffle that provided $50 gift cards to 50 randomly selected winners.
A total of 501 completed surveys were collected between May and November 2023 based on 44,146 invitation fliers distributed resulting in a response rate of 1.1% (Table 1). Although low, this response rate is consistent with previous studies which utilized a mail-based invitation for a detailed online survey (Houston et al., 2015; Spears et al., 2017). The response rates were higher in canyon subareas (3.0%; Figure 2, panels c and d) and lower in Corona (0.8%) and CVBB (0.9%; Figure 2, panels a and f). Although the invitation fliers and online survey were provided in both English and Spanish, only 5% of respondents completed at least part of the survey in Spanish. On average, respondents took 24 min to complete the survey, and 81% completed all survey questions including socio-demographic questions which were administered at the end of the survey. In addition, 85% of respondents provided a street address which was used to geocode respondent residential locations and merge geographic variables with survey responses. Because socio-demographic and geographic variables were required for analysis, only data for respondents who completed the survey and provided a valid street address were retained, resulting in an analysis sample of 321 records.
Survey Subarea and Survey Sample Characteristics.
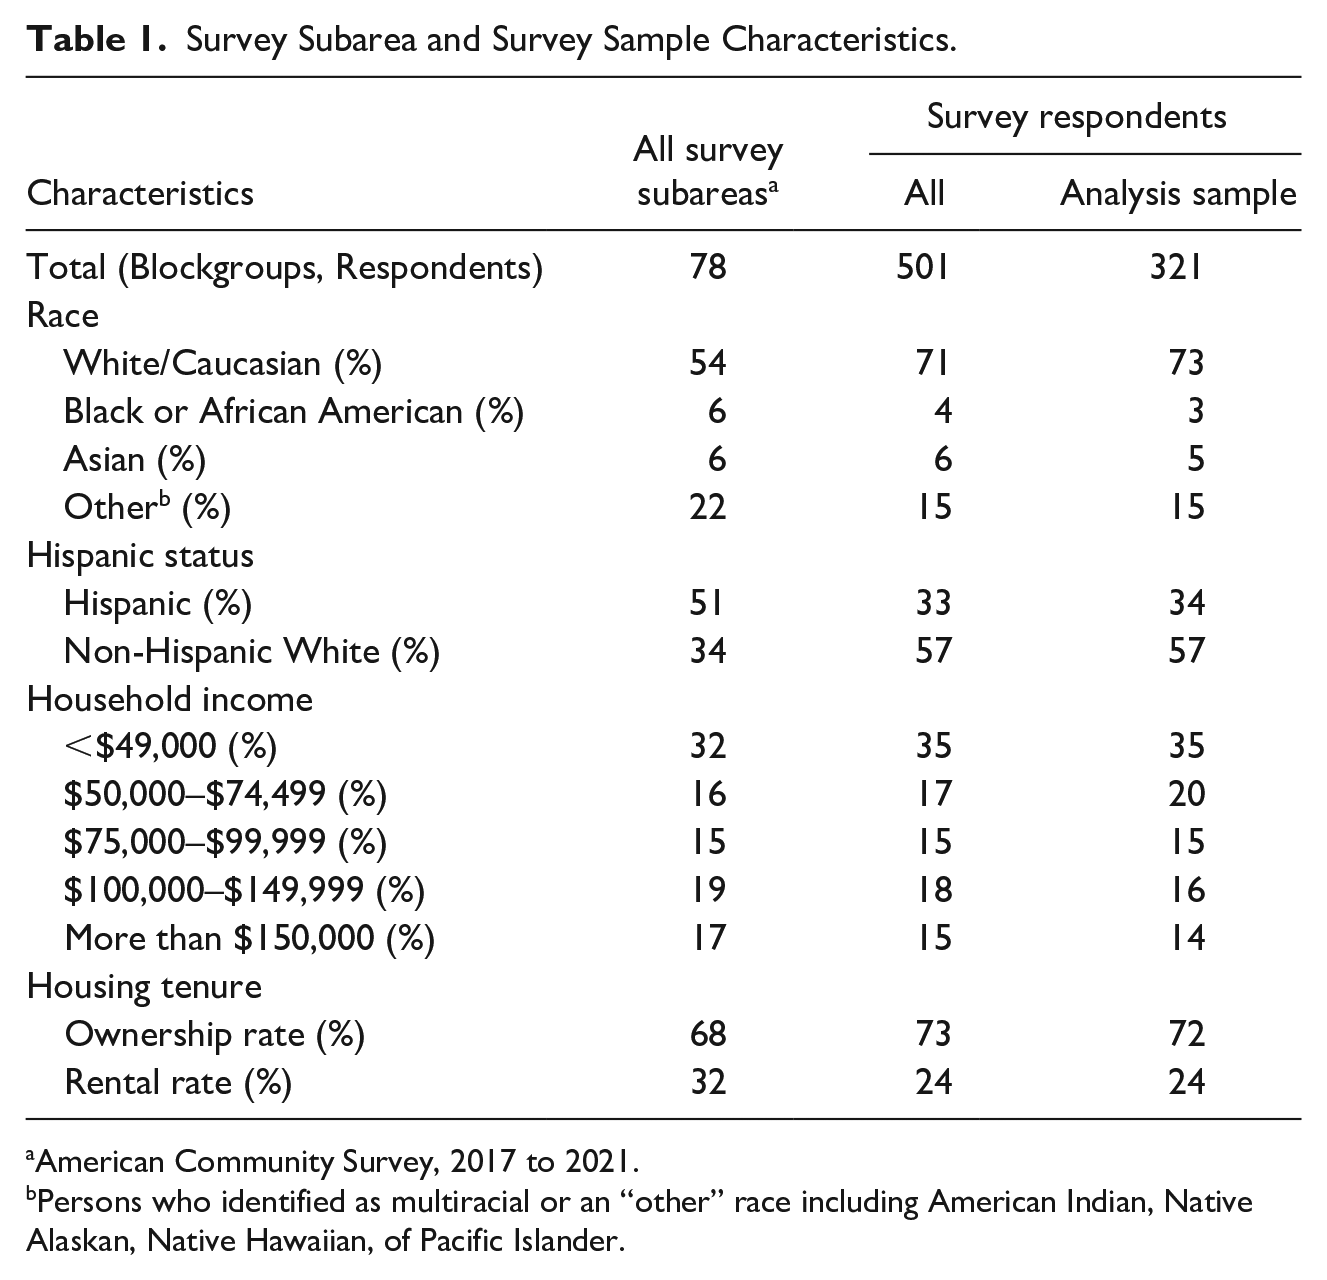
American Community Survey, 2017 to 2021.
Persons who identified as multiracial or an “other” race including American Indian, Native Alaskan, Native Hawaiian, of Pacific Islander.
Relative to census-based socio-demographic characteristics of the survey areas, White/Caucasian and Non-Hispanic White persons were overrepresented in the analysis sample relative to their population distribution (73% vs. 54% and 57% vs. 34%, respectively). Although the sample is not representative of the general survey area population along this racial/ethnic dimension, the analysis sample more closely reflected the area’s home ownership rate (72% vs. 68%) and the rate of households with income over $100,000/year (31% vs. 37%). In addition, the analysis sample includes adequate representation to enable analysis of variations in hazard risk perception across key socio-demographic subgroups including persons of color (43% of sample, defined as persons who were not Non-Hispanic White), lower income households (55% of the sample reported income under $75,000/year), and renters (24%).
Variables
In order to assess differences in hazard perceptions across localized scales, survey participants were asked to separately rate their perceived hazard level on a 6 point scale from 1 (no hazard) to 6 (extreme hazard) due to wildfire, flood, and mudslide at each of the four ascending spatial levels used by Collins (2012): (1) Home, or “your home and areas within 10 feet of your home,” (2) Near Home, or “the area surrounding your residence (beyond 10 feet of your home),” (3) Neighborhood, or “your surrounding neighborhood (less than half a mile from your home),” and (4) Community, or “your community in general (the town or city where you live).” The spatial optimism variable was generated by subtracting home-level rankings from community-level rankings to represent the difference between resident hazard perceptions at the most proximate scale and the broadest scale measured.
Socio-demographic factors were derived from survey questions about gender identity, age, race/ethnicity, Hispanic or Latinx origin or descent, housing tenure, and annual household income given previous research indicates risk perceptions could vary by these characteristics (Kellens et al., 2013; Lambrou et al., 2023; Lechowska, 2018; Zoll et al., 2023). Given most non-White participants identified as Hispanic or Latinx and given the low percentage of other populations of color in the sample, the analysis accounts for race/ethnicity by distinguishing between participants who indicated they were both Non-Hispanic and White/Caucasian (Non-Hispanic White) compared to all other participants, who are referred to as persons of color.
Two community factors were considered because social activity and identity could impact resident evaluations of the potential threat and severity of hazards (Devine-Wright, 2009; Kyle et al., 2014; Wallis et al., 2022). First, community involvement was assessed by asking participants to rank how active overall they are in their community from 1 (extremely inactive) to 7 (extremely active). Second, place attachment was assessed by averaging participant rankings of their level of agreement from 1 (strongly disagree) to 7 (strongly agree) with two statements measuring place identity (“My community is very special to me” and “I identify strongly with my community”) and two statements measuring place dependence (“My community is the best place for what I like to do” and “For doing the things I enjoy most, no other place can compare to my community”). These dimensions of place attachment could influence risk awareness and could be associated with spatial discounting of proximal risk (Bonaiuto et al., 2016; De Dominicis et al., 2015).
Hazard experience variables were obtained by asking participants to indicate if they had been affected by wildfires, floods, or mudslides in their lifetime given research indicates previous hazard experience is strongly associated with risk perception (Bubeck et al., 2023; Dobbin et al., 2023; Kellens et al., 2013; Lechowska, 2018; McGee et al., 2009). Participant awareness of a connection between wildfire and flood hazards was measured by asking participants to rank their level of agreement from 1 (strongly disagree) to 7 (strongly agree) with the statement “A major wildfire near my community would increase the likelihood of flood damage in my community during a major storm.”
Three hazard protection factors were assessed given previous research indicates that trust in government protective infrastructure or programs could reduce perceived risks (Martin et al., 2009; Meldrum et al., 2015; Thapa et al., 2023; Tobin, 1995). First, resident confidence in governmental flood and wildfire protective measures was obtained by asking participants to rate how secure the following measures made them feel with regards to wildfires, flooding, and mudslides from 1 (extremely not secure) to 7 (extremely secure): “Flood control infrastructure (e.g., storm drains, channels, catchment basins)” and “Forest and wildland management (e.g., prescribed burns, mechanical thinning).” Second, given living near protective infrastructure has been associated with reduced risk perceptions (Houston et al., 2019), residential proximity to flood control channels was calculated in Geographic Information System (GIS) based on channel data provided by the Riverside Flood Control District, which was cleaned and updated by reviewing recent conditions using Google Maps and StreetView.
Hazard proximity factors capture the influence of residential proximity to potential hazards within WUI areas. Proximity to undeveloped land (which could represent a burn hazard) was based on the percentage of the area within a one-quarter mile buffer around each respondent residence that was classified as undeveloped based on the 2021 National Land Cover Data obtained from the United States Geological Survey (USGS). Proximity to areas burned by wildfires between 2017 and 2023 was based on the straight-line distance generated in GIS from each residence to the closest burn boundary based on data obtained from the USGS Landslide Hazards Program. Proximity to a natural stream or channel (which could become a flood hazard in extreme weather) was based on the straight-line distance from each residence to these features based on USGS 2021 National Hydrography Data. Dichotomous variables indicating living within one-quarter or one-half mile were used to analyze proximity to protections and potential hazards. Participants were not classified as living in WUI intermix or interface zones given available spatial data were insufficient to meaningfully measure localized variations in proximate vegetative and development densities for specific residential buildings (Carlson et al., 2022; Radeloff et al., 2018).
Analytical Approach
The first stage of analysis examines factors associated with differences in resident hazard rankings of three environmental hazards (wildfire, flood, mudslide) across four spatial levels (home, near home, neighborhood, community). It includes bivariate analysis to compare the difference in mean hazard rankings at both home-level and community-level scales relative to the five types of factors defined above: socio-demographic, community, hazard experience and awareness, hazard protections, and hazard proximity. Multivariate ordinary least square (OLS) regression models are used to assess the relative influence of these factors on home-level and community-level hazard rankings. This stage also assesses evidence of hazard cross-over effects, or whether experience with each WUI hazard or awareness of hazard connections are associated with higher hazard rankings of the other two hazards. The second stage of analysis uses bivariate and multivariate methods to assess the potential presence of spatial optimism, or the tendency to discount the ranking of nearby home hazards relative to broader-scale hazards as a self-protective coping mechanism. It uses bivariate and multivariate OLS methods to examine differences in community-level hazard rankings and home-level hazard rankings to assess how the five types of factors influence spatial optimism.
All regression models include the same socio-demographic, community, and hazard experience and awareness factors. Models for each hazard type include relevant hazard protection factors: wildfire hazard models account for how secure participants feel due to wildland management protection; flood hazard models account for residential proximity to flood control channels and how secure participants feel due to flood control protection; and mudslide hazard models account for all three of these hazard protective factors. Multiple models are specified for each hazard to account for different hazard proximity factors to assess their independent influence while avoiding potential multicollinearity.
Results
Local Perceptions of WUI Hazards and Cross-Over Effects
Bivariate Analysis
Overall, residents indicated that wildfire posed the greatest hazard for their community (4.1, on a scale from 1 or “no hazard” to 6 or “extreme hazard”) compared to 3.2 and 3.1 for flood and mudslide hazards, respectively. Wildfires were also considered more likely and potentially more severe. About three quarters of survey participants (74%) indicated wildfires were somewhat, very, or extremely likely in their community compared to about a third which indicated that floods (36%) or mudslides (37%) were likely. Eighty percent indicated there would be somewhat, very, or extremely severe consequences to their community if a wildfire occurred compared to about half which indicated that a flood (57%) or a mudslide (55%) would result in severe community impacts.
Participant hazard rankings varied by hazard type and spatial scale. Overall, participants ranked wildfire hazard higher than flood and mudslide hazards across all spatial scales (Figure 3). For instance, on average, participants ranked their home wildfire hazards 2.9, on a 6-point scale from 1 (no hazard) to 6 (extreme hazard), compared to 2.1 for both their home flood and mudslide risk. These differences in the mean home hazard rankings (wildfire hazard vs. flood hazard, and wildfire hazard vs. mudslide hazard) were significantly different, as were the same mean comparisons at the near home, neighborhood, and community spatial scales. However, mean flood hazard rankings nearly matched and were not significantly different than mean mudslide hazard rankings for all four spatial scales. For all three hazards, the average ranking consistently increased from the home level to the community level, an indicator of spatial optimism, which is analyzed in the second stage of analysis.
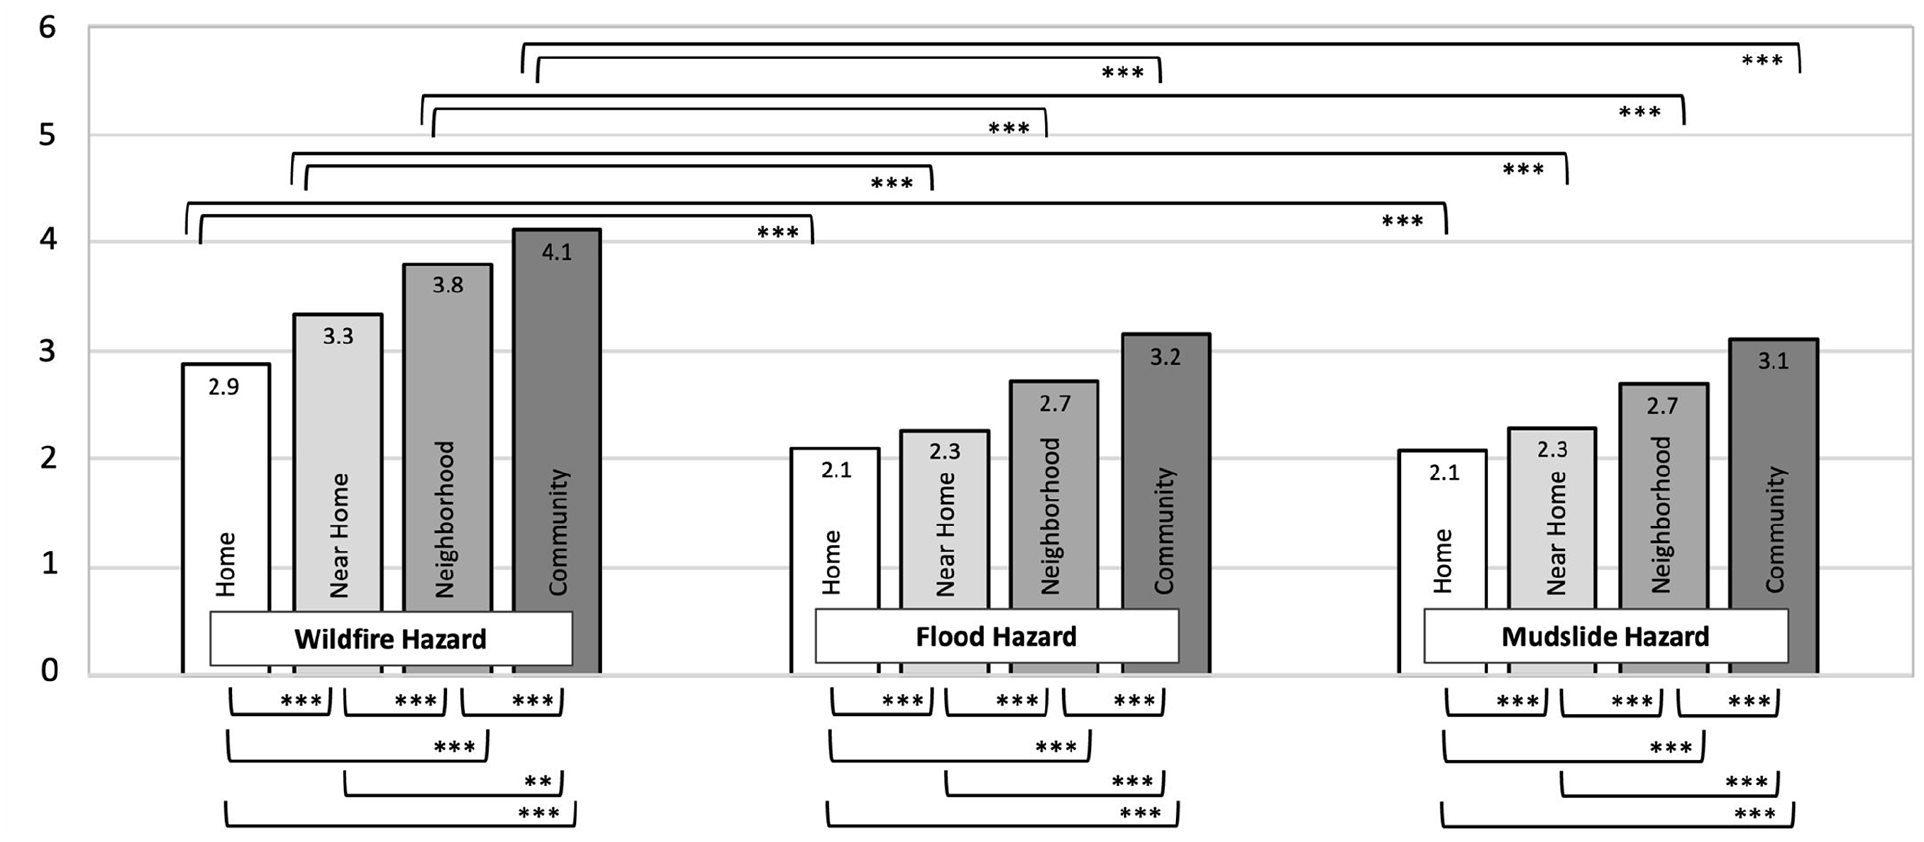
Wildfire, flood, and mudslide hazard ranking by four spatial levels.
In some cases, participant hazard rankings (represented with shaded horizontal bars in Figure 4) were significantly different between home (H) and community (C) scales across socio-demographic subgroups. For instance, female participants had a mean home flood hazard ranking of 2.3 which was significantly higher than the ranking of 1.9 by male participants, but the same comparison at the community level was not statistically different (Figure 4, panel b). In fact, across all three hazards, female participants had a significantly higher ranking than male participants at the home level but not at the community level. In addition, older participants (age 35 years plus) and homeowners had a significantly higher ranking at the community level but not at the home level. Non-Hispanic White and higher income participants had a higher community wildfire ranking, but these groups were not significantly different than other groups in their home or community flood hazard perceptions. Higher income participants had significantly higher home and community mudslide hazard rankings compared to other participants. Although these patterns suggest vulnerable subgroups (lower income residents, renters, etc.) tended to have lower hazard perceptions overall, this trend was not consistent. For instance, participants of color had a higher mean home mudslide ranking compared to other participants.
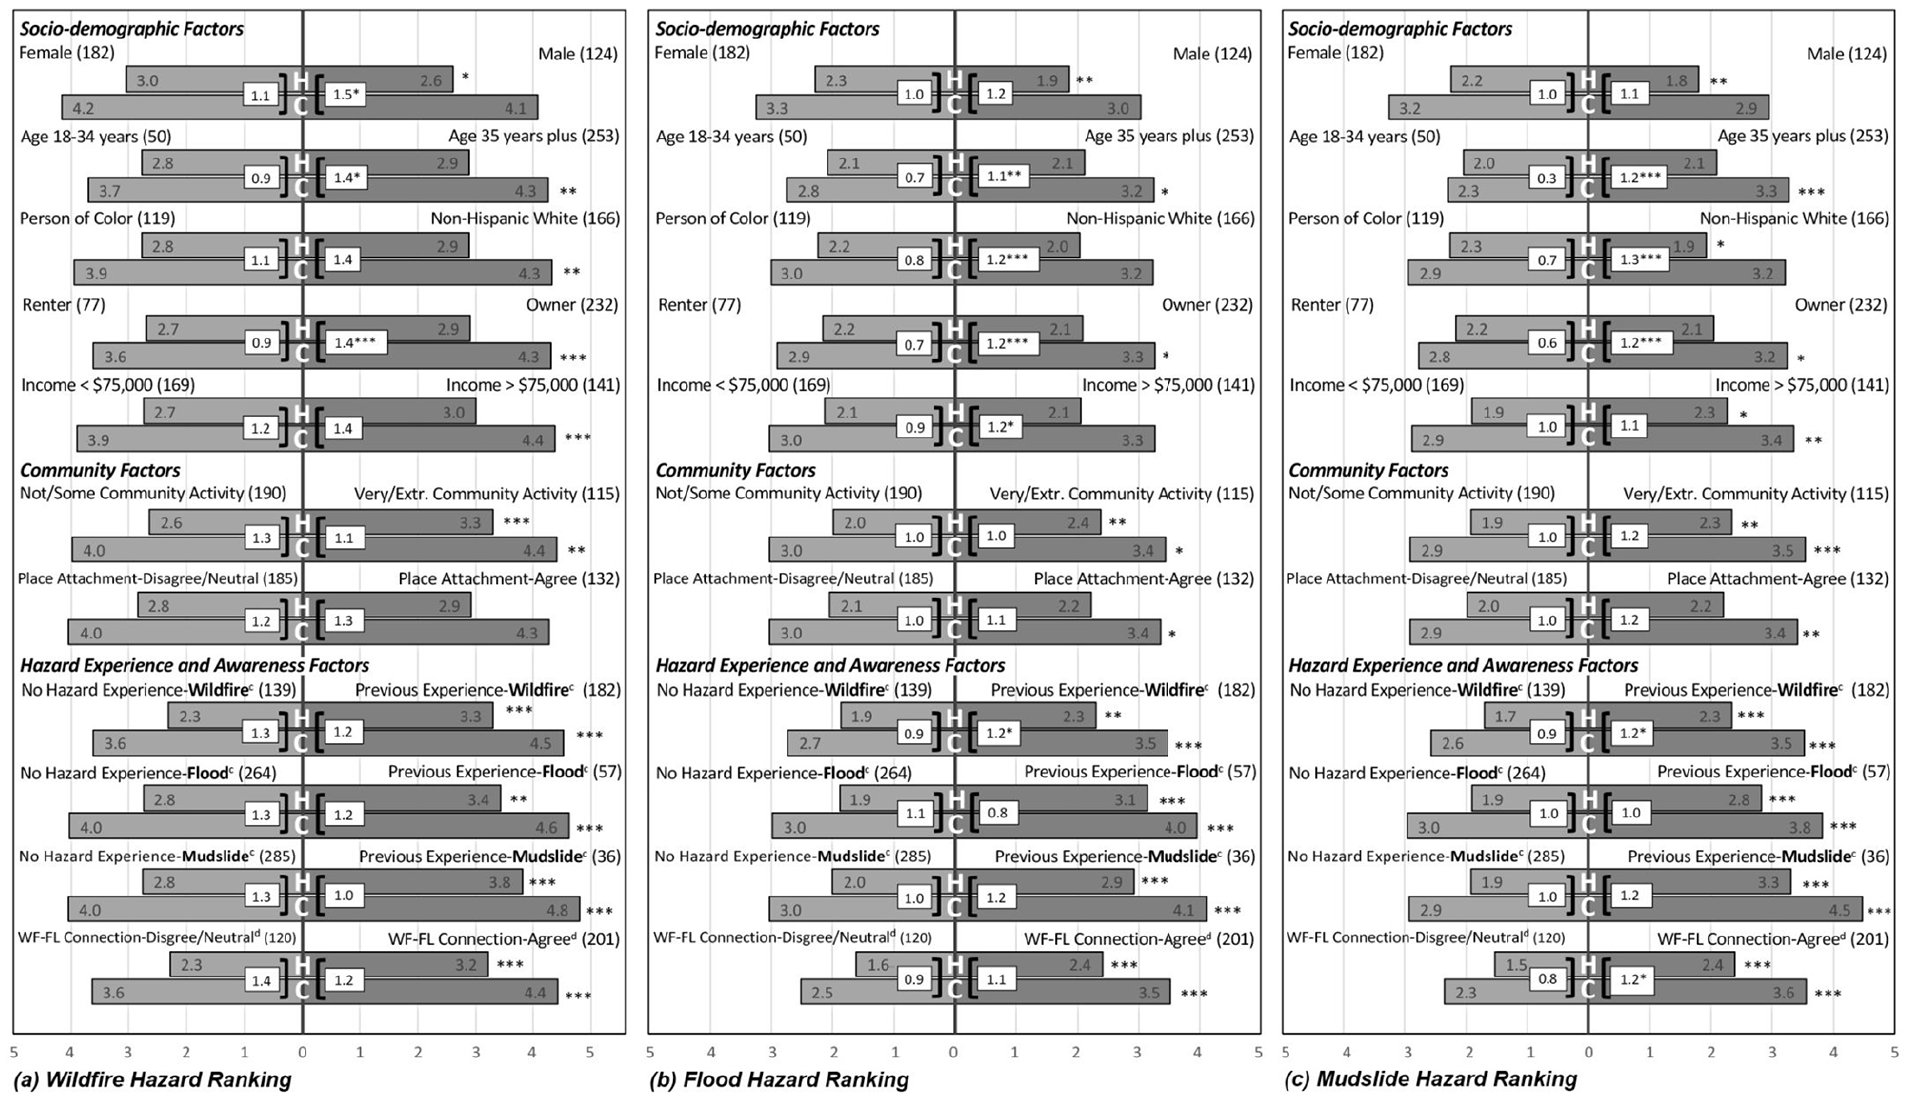
Wildfire, flood and mudslide rankings at home and community spatial levels by sociodemographic, community, and experience factors: (a) wildfire hazard ranking, (b) flood hazard ranking, and (c) mudslide hazard ranking.
Participants who reported they were very or extremely active in their community had consistently higher mean rankings for all three hazards at both the home and community level. Higher place attachment was not associated with significantly different wildfire hazard rankings but was associated with significantly higher flood and mudslide rankings.
Residents who had been impacted in their lifetime by a wildfire had consistently higher mean rankings for all three hazards at both the home and community level. Over half of the sample (57%) reported wildfire experience compared to only 18% for flood experience and 11% for mudslide experience. The magnitude of the difference in hazard rankings between participants with hazard experience and those without ranged some 0.9 to 1.4 and was greater than differences observed for socio-demographic and community factors. These patterns provide evidence that cross-over effects exist in resident perceptions of all three WUI hazards analyzed. That is, experience with each hazard is associated with higher perceptions of the other two hazards. Cross-over effects are further reflected by the high level of resident awareness of the connection between two WUI hazards: Two thirds of WUI residents (63%) agreed that a major wildfire could increase the likelihood of flood damage. These residents also had a higher hazard ranking for all three WUI hazards analyzed at both home and community spatial levels.
As expected, perceived hazard protections were in most cases associated with lower hazard rankings (Figure 5). Feeling very or extremely secure due to flood control infrastructure was significantly associated with lower wildfire and mudslide hazard rankings at the home and community spatial levels. It was also significantly associated with lower flood hazard rankings at the community level, but not flood rankings at the home level, a pattern that matched hazard rankings relative to residential proximity to flood control infrastructure based on straight-line distance measurements calculated in GIS. Feeling very or extremely secure due to wildland management was also significantly associated with lower rankings at the home and community spatial levels, except for home mudslide rankings.
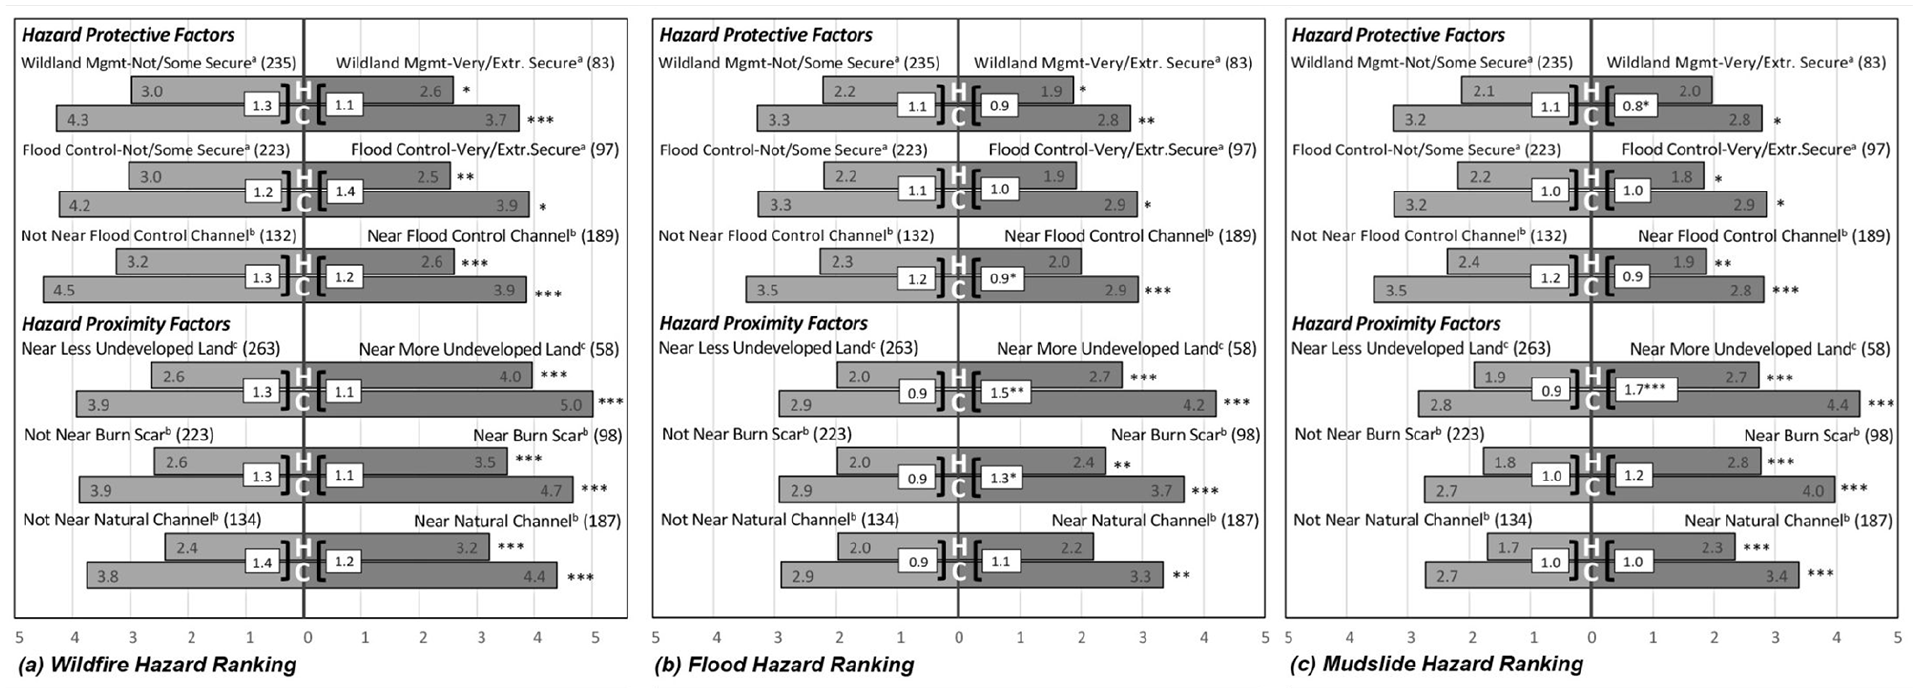
Wildfire, flood and mudslide rankings at home and community spatial levels by hazard protective and proximity factors: (a) wildfire hazard ranking, (b) flood hazard ranking, and (c) mudslide hazard ranking.
Residential hazard proximity was consistently associated with higher hazard rankings at both the home and community levels. The 18% of participants who lived within a quarter mile of undeveloped land had 1.1 to 1.4 higher wildfire rankings than participants with more nearby development, the 31% of participants who lived within a half mile of a burn scar had 0.8 to 0.9 higher wildfire rankings than participants living farther from a burn scar, and the 58% of participants living within a half mile of a natural channel had 0.6 to 0.8 higher wildfire rankings than participants living farther from a natural channel. Higher flood hazard ranking differences (0.4–1.3 higher) and higher mudslide hazard ranking differences (0.6–1.6 higher) were also observed for participants living close to these hazards (except for home flood risk among participants living near a flood channel).
Multivariate Analysis
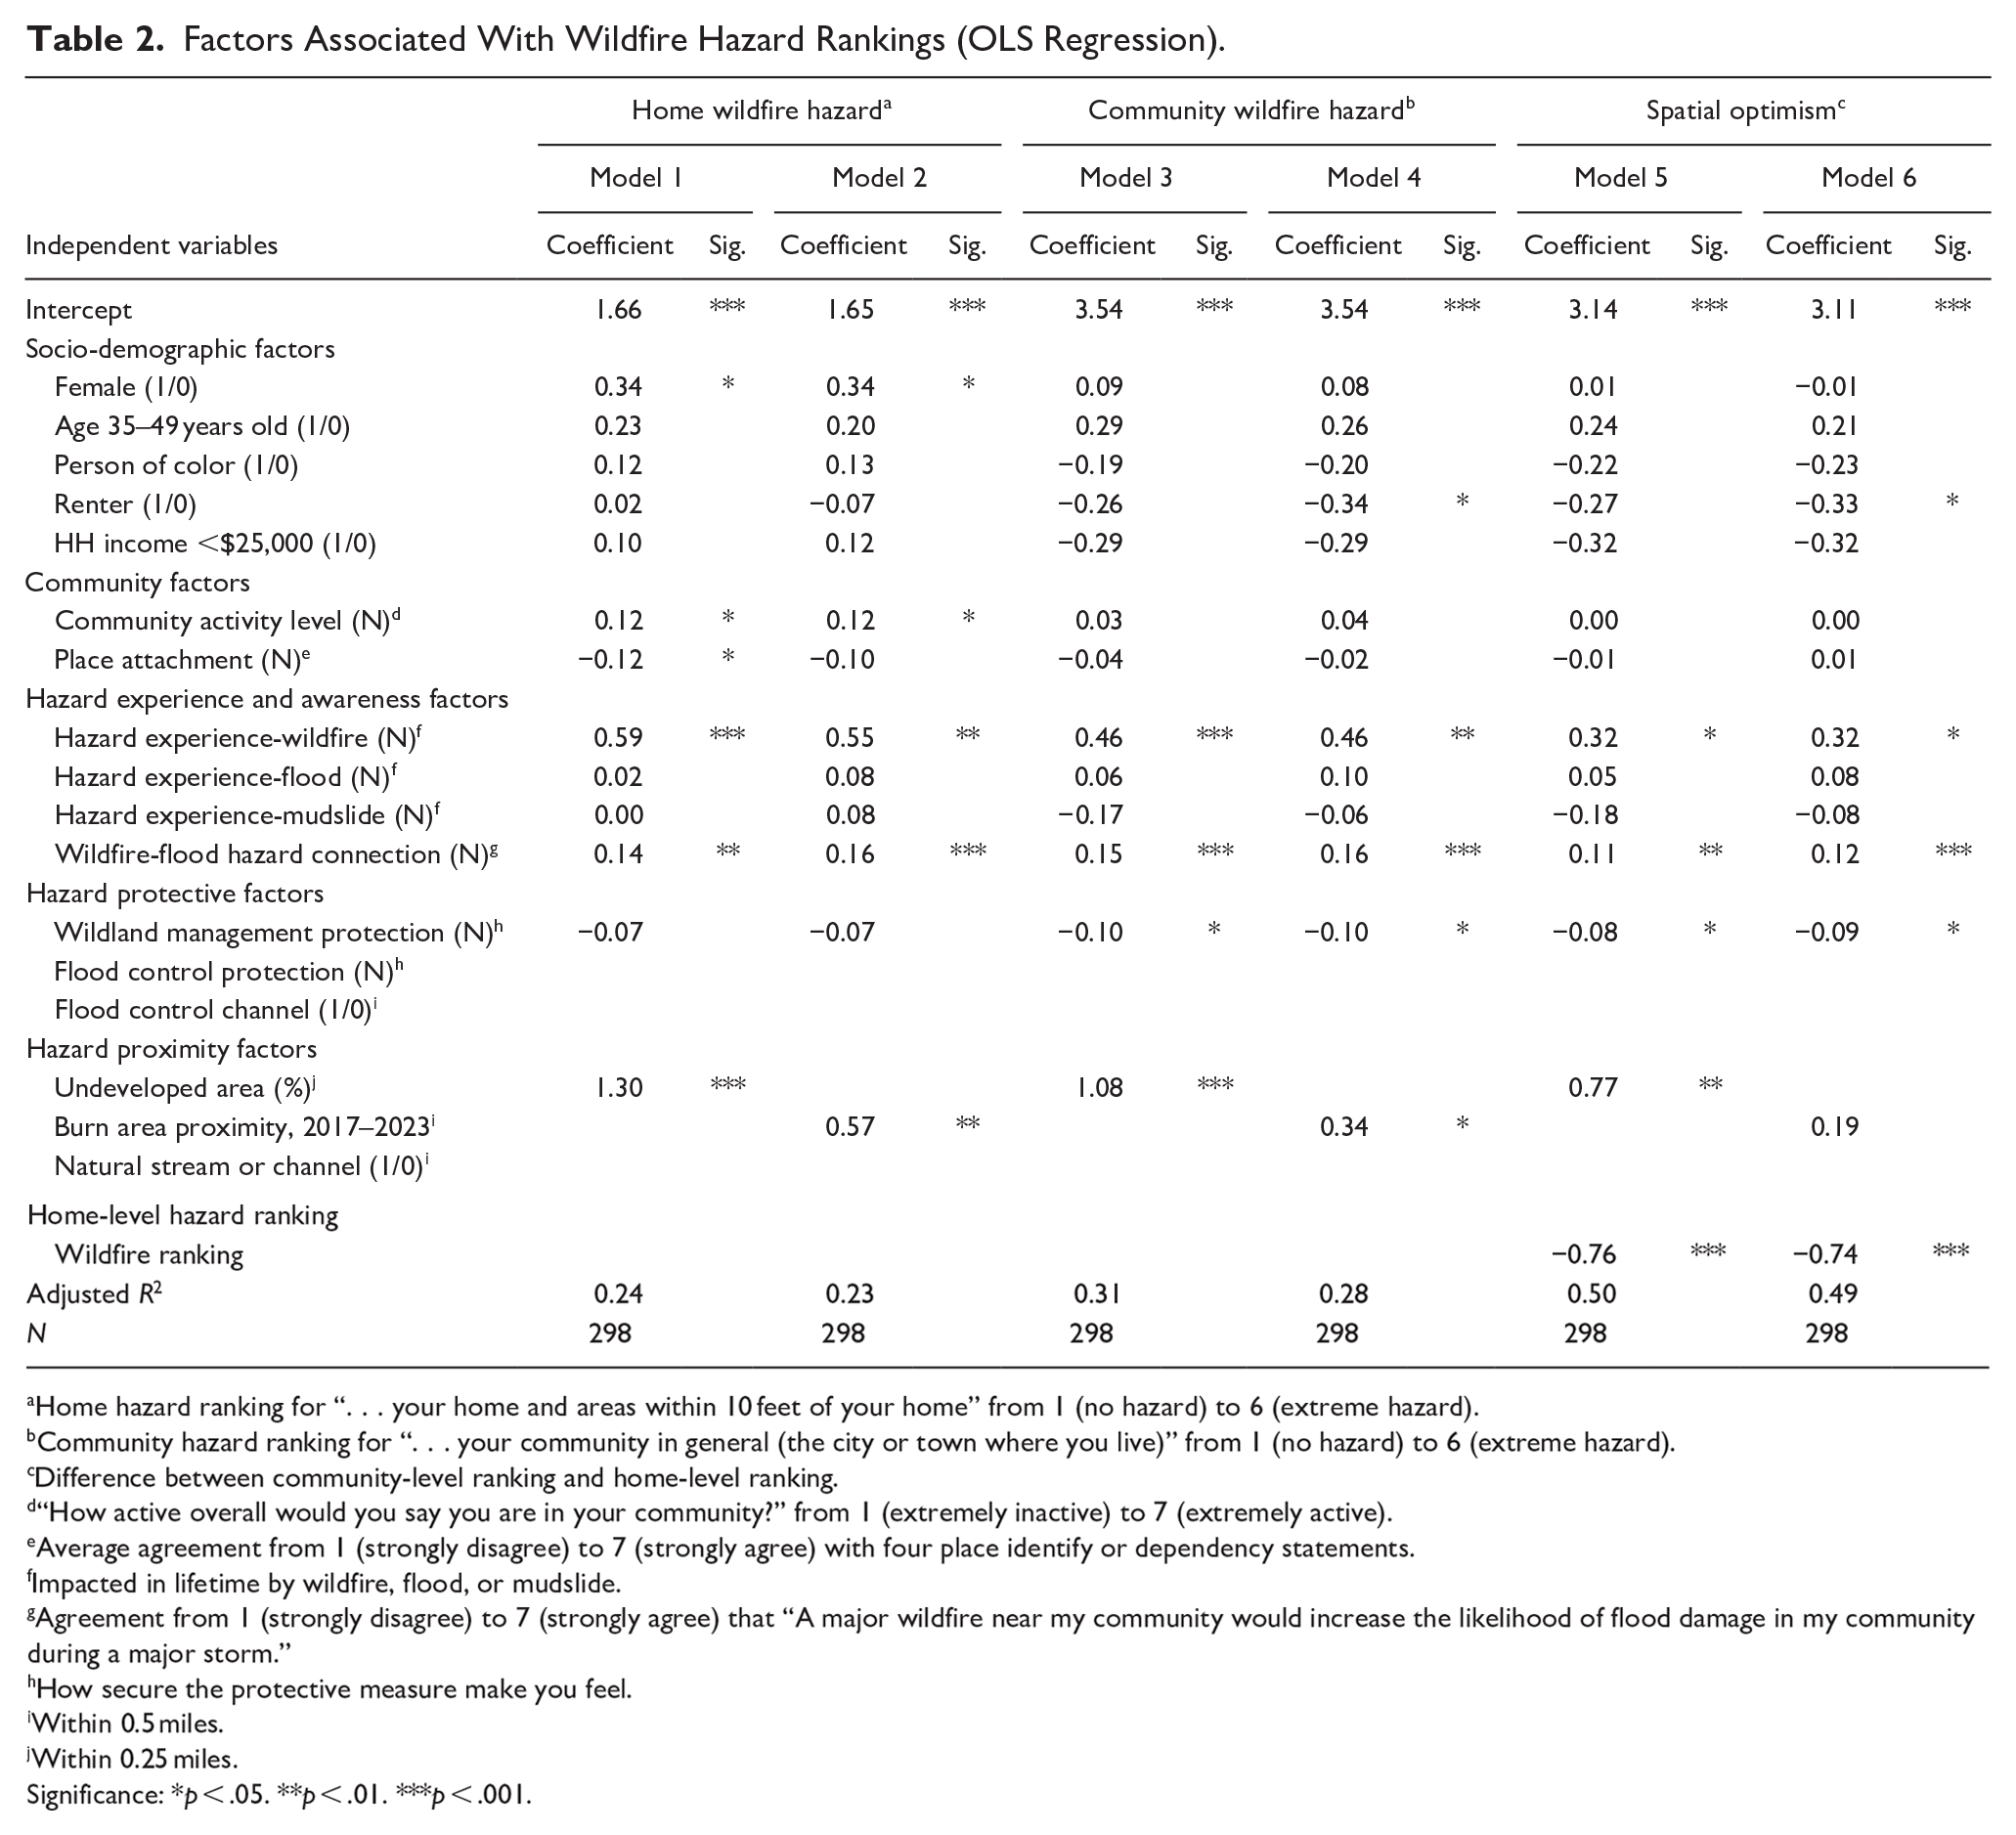
Regression model results provide insights into the relative influence of the five factor types on hazard rankings. Being female and having higher levels of self-rated community activity were positively and significantly associated with higher home wildfire rankings after controlling for other factors (Table 2, Models 1 and 2). Being a renter was associated with lower community wildfire rankings (Models 3 and 4). Residents with higher place attachment were associated with lower home wildfire rankings but this variable was not significantly related to community level wildfire rankings.
Factors Associated With Wildfire Hazard Rankings (OLS Regression).
Home hazard ranking for “. . . your home and areas within 10 feet of your home” from 1 (no hazard) to 6 (extreme hazard).
Community hazard ranking for “. . . your community in general (the city or town where you live)” from 1 (no hazard) to 6 (extreme hazard).
Difference between community-level ranking and home-level ranking.
“How active overall would you say you are in your community?” from 1 (extremely inactive) to 7 (extremely active).
Average agreement from 1 (strongly disagree) to 7 (strongly agree) with four place identify or dependency statements.
Impacted in lifetime by wildfire, flood, or mudslide.
Agreement from 1 (strongly disagree) to 7 (strongly agree) that “A major wildfire near my community would increase the likelihood of flood damage in my community during a major storm.”
How secure the protective measure make you feel.
Within 0.5 miles.
Within 0.25 miles.
Significance: *p < .05. **p < .01. ***p < .001.
Participants who indicated they had been impacted by wildfire in their lifetime were consistently associated with higher home and community wildfire rankings, but, contrary to bivariate results, flood and mudslide experience were not significantly related to wildfire hazard rankings, which suggests a lack of cross-over effects after controlling for other factors. However, residents who agreed that wildfire and flood hazards were connected were consistently associated with higher wildfire hazard rankings at both home and community levels. Feeling very or extremely secure because of wildland management was associated with lower community wildfire rankings but not home wildfire rankings. As expected, both fire-related hazard proximity indicators, the percentage of nearby undeveloped area or living near a wildfire burn scar, were associated with higher wildfire hazard rankings at both spatial levels.
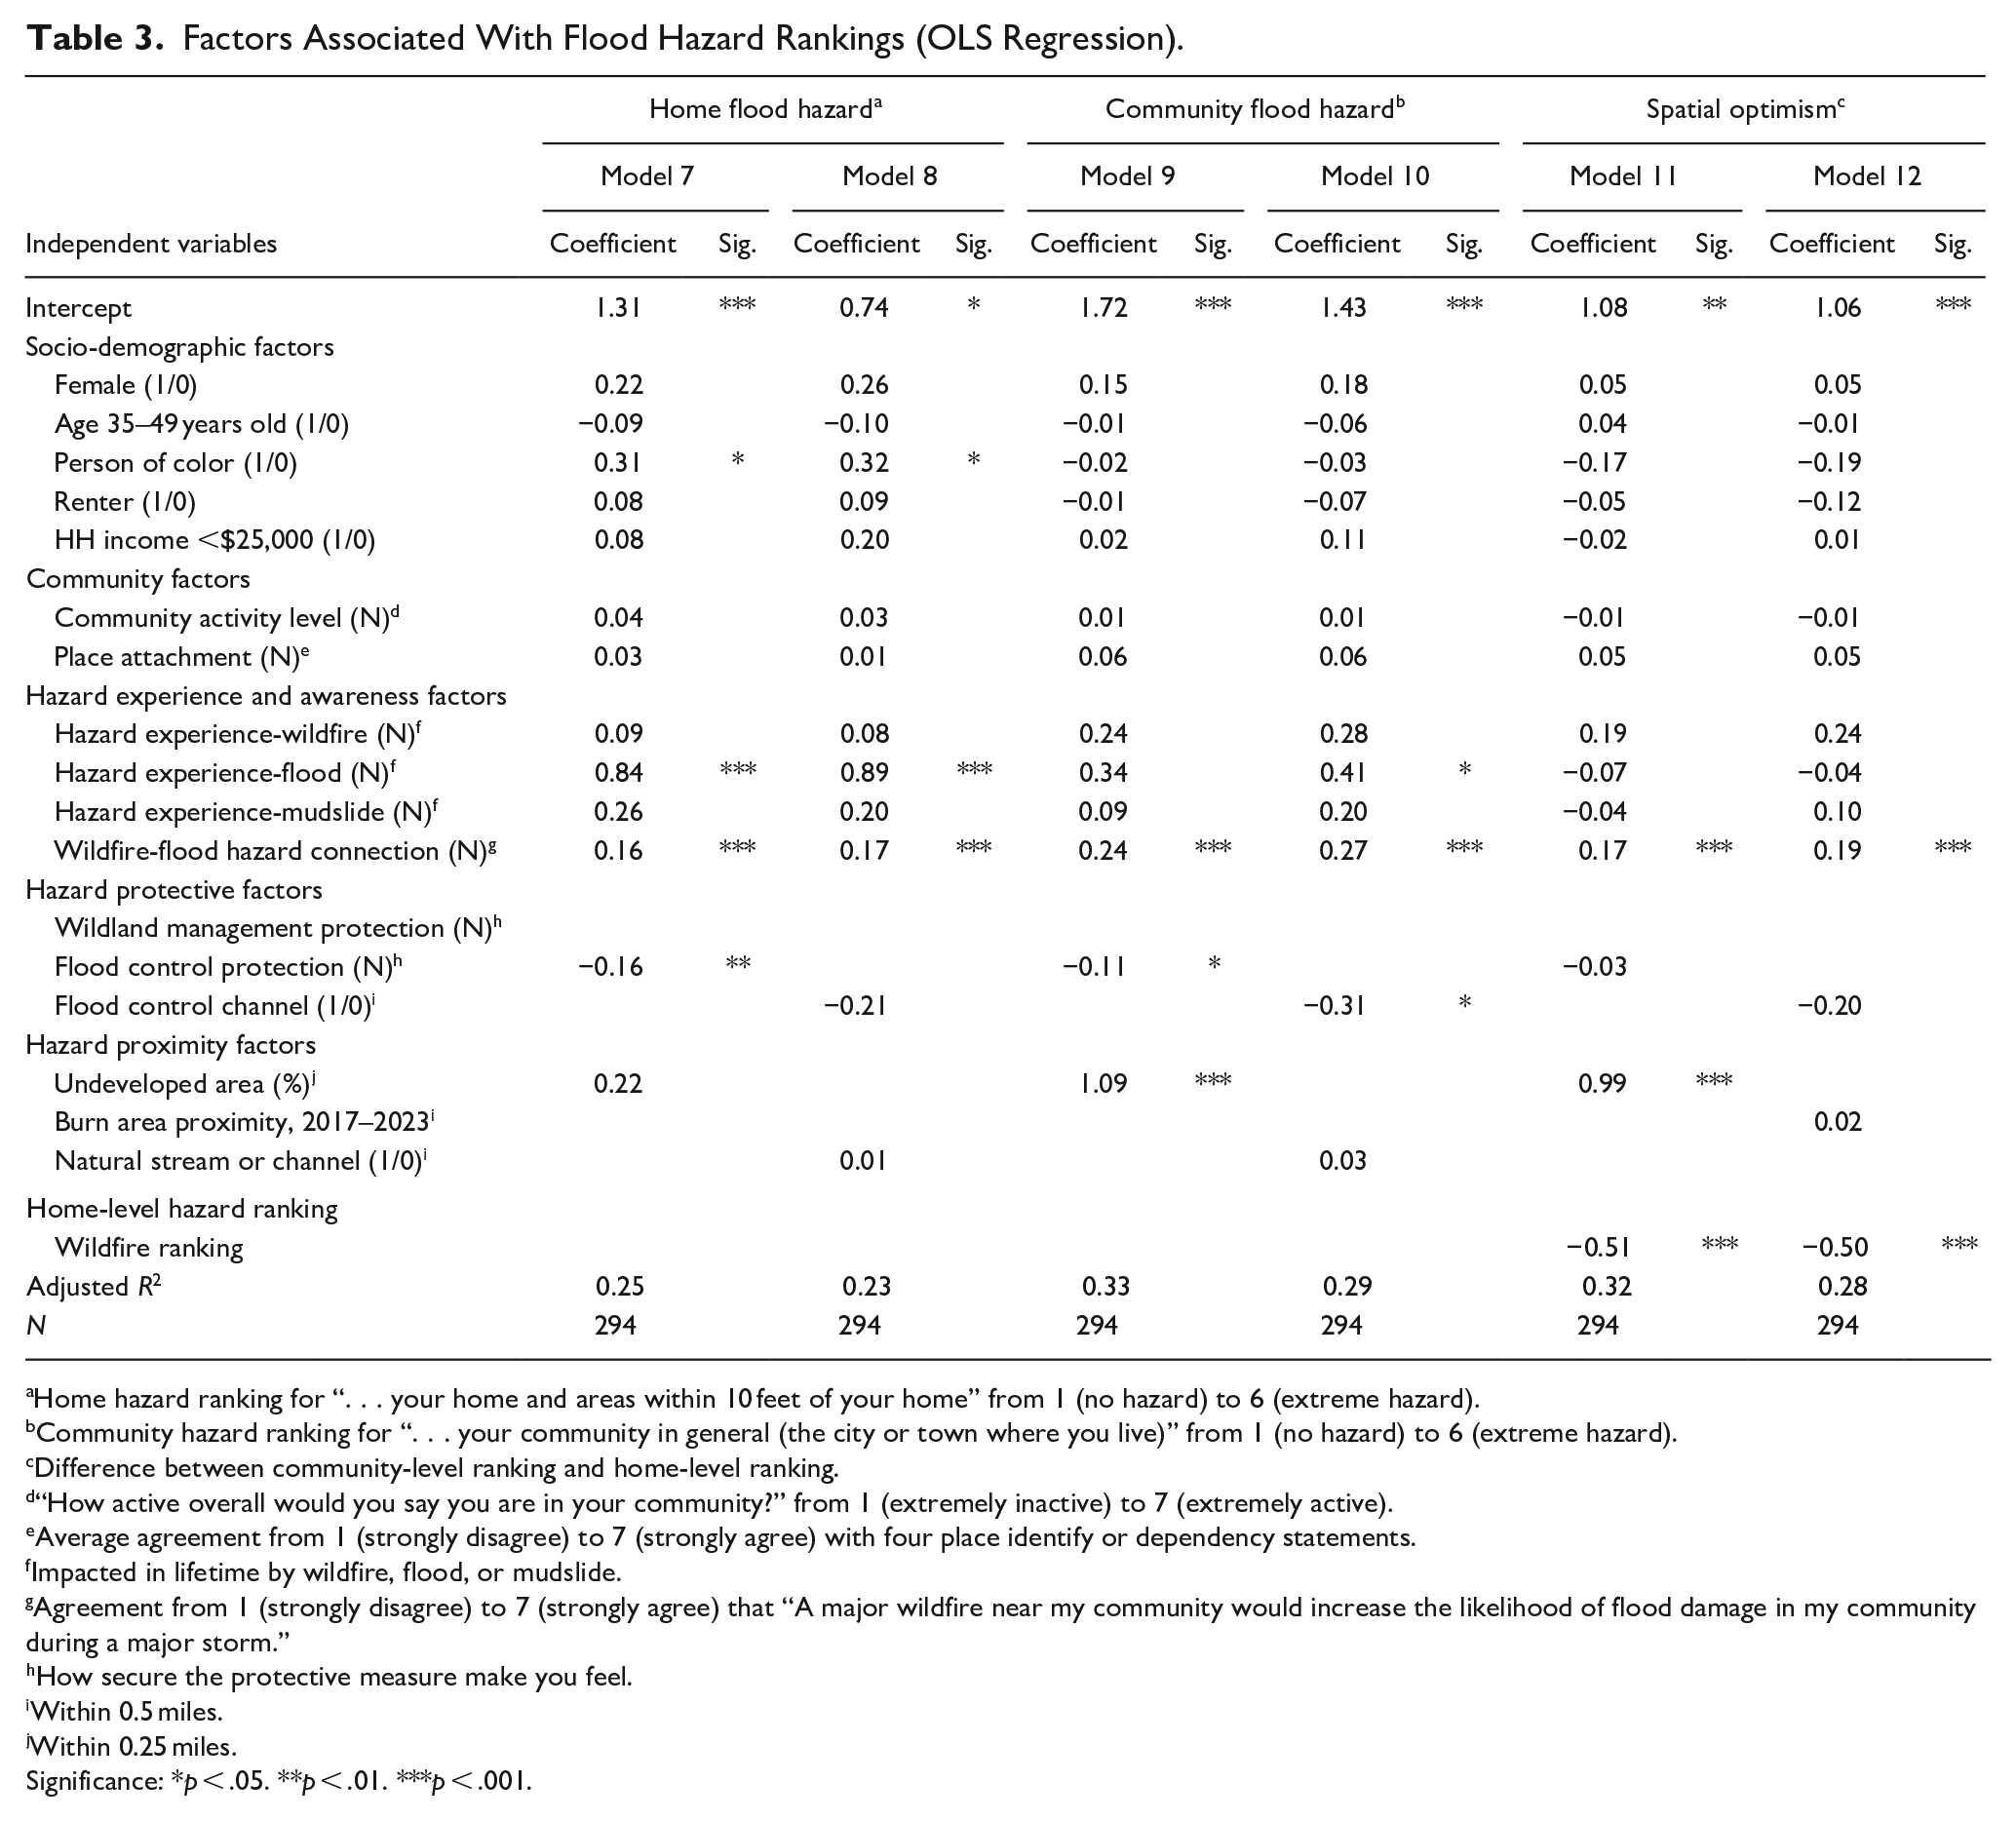
Flood hazard models indicate being a person of color was associated with higher home flood rankings after accounting for other factors (Table 3, Models 7 and 8), but no socio-demographic or community factors were significantly associated with community flood rankings (Models 9 and 10). As expected, prior flood experience was associated with higher home and community flood hazard rankings in most models, and residents who agreed a wildfire-flood connection exists were consistently associated with higher flood hazard rankings. In terms of flood-related hazard protections, feeling very or extremely secure because of flood control protections was associated with lower home and community flood rankings, and living near a flood control channel was negatively associated with community flood rankings but not home flood rankings after controlling for other factors. The percentage of nearby undeveloped area was associated with higher community flood hazard rankings, but living near a natural stream was not significant in the flood hazard models.
Factors Associated With Flood Hazard Rankings (OLS Regression).
Home hazard ranking for “. . . your home and areas within 10 feet of your home” from 1 (no hazard) to 6 (extreme hazard).
Community hazard ranking for “. . . your community in general (the city or town where you live)” from 1 (no hazard) to 6 (extreme hazard).
Difference between community-level ranking and home-level ranking.
“How active overall would you say you are in your community?” from 1 (extremely inactive) to 7 (extremely active).
Average agreement from 1 (strongly disagree) to 7 (strongly agree) with four place identify or dependency statements.
Impacted in lifetime by wildfire, flood, or mudslide.
Agreement from 1 (strongly disagree) to 7 (strongly agree) that “A major wildfire near my community would increase the likelihood of flood damage in my community during a major storm.”
How secure the protective measure make you feel.
Within 0.5 miles.
Within 0.25 miles.
Significance: *p < .05. **p < .01. ***p < .001.
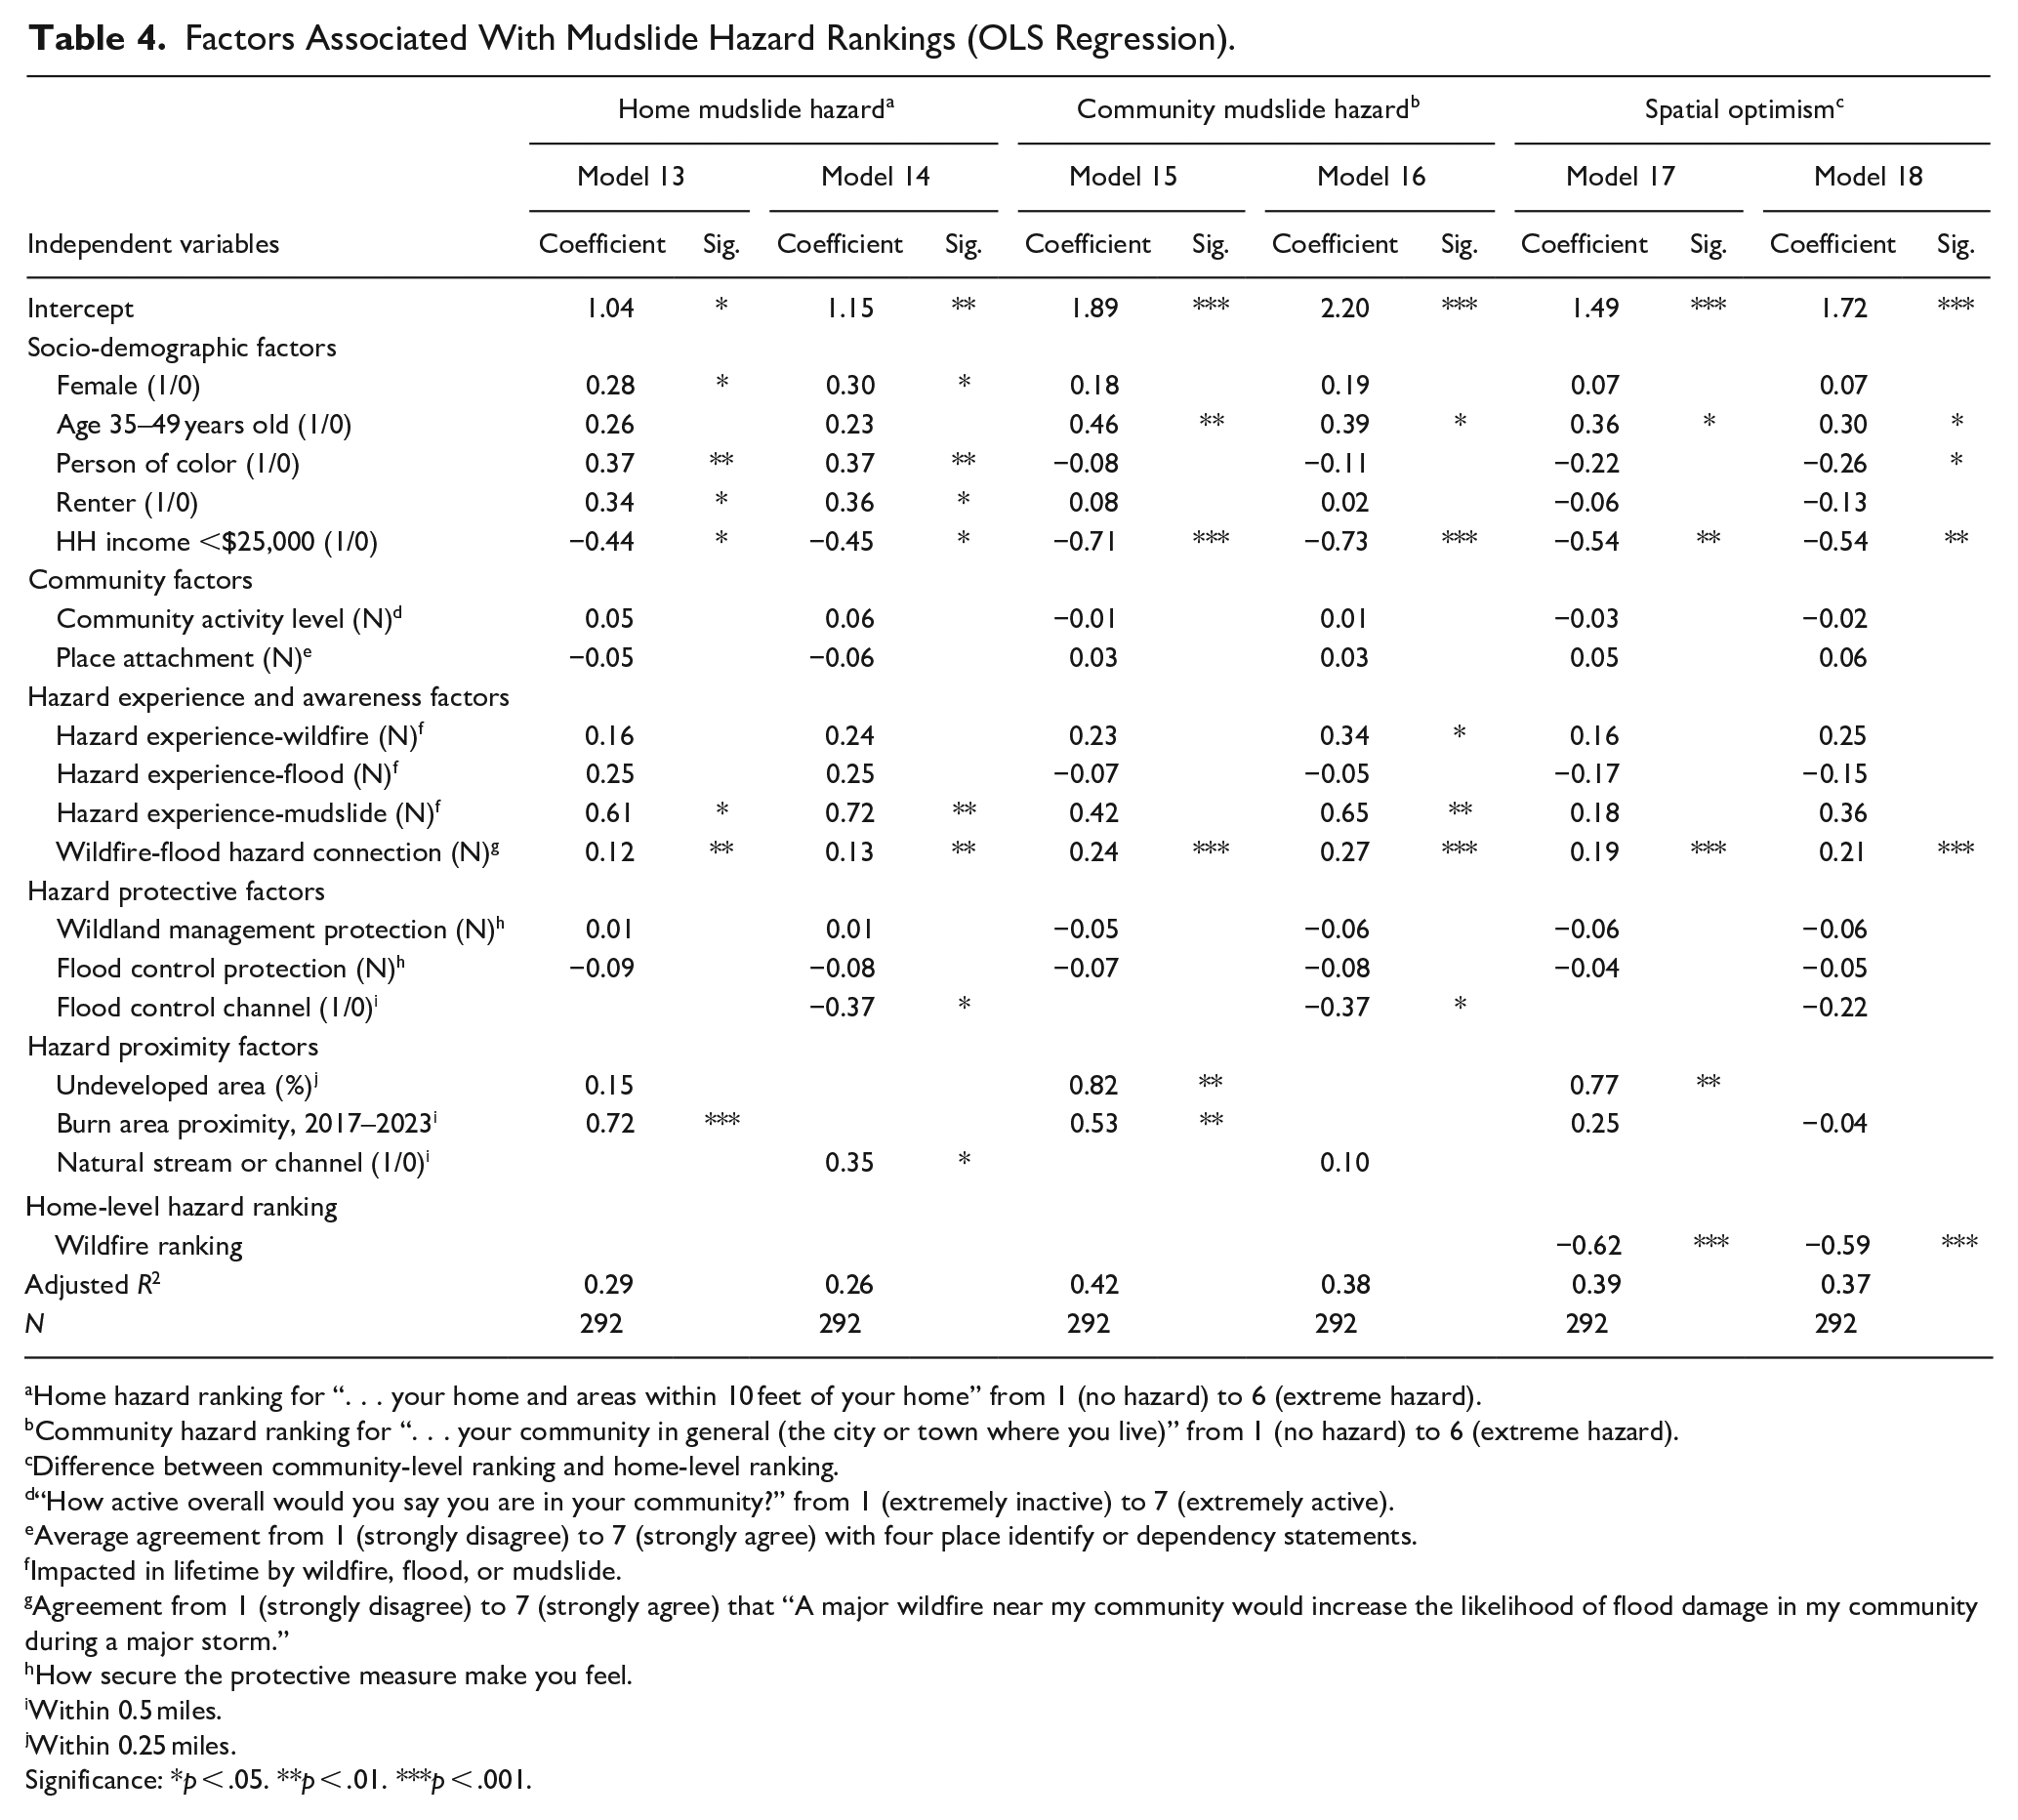
Being female, a person of color, or a renter were positively associated with home mudslide rankings (Table 4, Models 13 and 14) and being between 35 and 49 years old was positively associated with community mudslide rankings (Models 15 and 16). Lower income participants were associated with lower mudslide rankings at both the home and community level. Community factors were not significant in the mudslide models. Prior mudslide experience and agreeing a wildfire-flood connection exists were associated with higher home and community mudslide rankings; prior wildfire experience was associated with higher mudslide risk at the community level, reflecting a wildfire-mudslide cross-over effect. In terms of mudslide-related hazard protections, only being near a flood channel was associated with lower perceived mudslide hazards for both home and community rankings. Living near a burn scar was significantly associated with higher home and community mudslide rankings, while living near a natural stream was associated with higher home mudslide rankings and the percentage of nearby undeveloped area was associated with higher community mudslide rankings.
Factors Associated With Mudslide Hazard Rankings (OLS Regression).
Home hazard ranking for “. . . your home and areas within 10 feet of your home” from 1 (no hazard) to 6 (extreme hazard).
Community hazard ranking for “. . . your community in general (the city or town where you live)” from 1 (no hazard) to 6 (extreme hazard).
Difference between community-level ranking and home-level ranking.
“How active overall would you say you are in your community?” from 1 (extremely inactive) to 7 (extremely active).
Average agreement from 1 (strongly disagree) to 7 (strongly agree) with four place identify or dependency statements.
Impacted in lifetime by wildfire, flood, or mudslide.
Agreement from 1 (strongly disagree) to 7 (strongly agree) that “A major wildfire near my community would increase the likelihood of flood damage in my community during a major storm.”
How secure the protective measure make you feel.
Within 0.5 miles.
Within 0.25 miles.
Significance: *p < .05. **p < .01. ***p < .001.
Local Scales of Spatial Optimism
Bivariate Analysis
Hazard rankings suggest spatial optimism, or the tendency to discount the ranking of nearby hazards as a self-protective coping mechanism, exists for the three WUI hazards analyzed. For each, the average ranking increased from the home level to community level, and these across-scale differences within each hazard type were statistically significant (Figure 3). The overall ranking increased from home to community levels by 1.2 for wildfire hazard, 1.1 for flood hazard, and 1.0 for mudslide hazard.
Results indicate that spatial optimism, measured as this difference between community-level rankings and home-level rankings, varies with regards to the five factor types analyzed. For instance, the difference between the average community and home flood rankings for Non-Hispanic White participants (1.2, as reported in white boxes over shaded bars) was greater and significantly different than the difference between the average community and home flood rankings for participants of color (0.8; Figure 4, panel b). Similarly, the flood hazard spatial optimism for older participants, homeowners, and higher income participants was greater and significantly different than the flood hazard spatial optimism of their counterparts. The mudslide spatial optimism for Non-Hispanic White participants, older participants, and higher income participants was greater and significantly different than the mudslide spatial optimism of their counterparts. For wildfire hazards, spatial optimism was greater for male participants, older participants, and homeowners. Significant differences in spatial optimism were not observed based on community factors.
Spatial optimism differences were also not observed based on hazard experience and awareness for wildfires, but previous wildfire experience was associated with greater flood and mudslide spatial optimism. Residents who agreed a wildfire-flood connection exists also had greater mudslide spatial optimism. In terms of hazard protections, mudslide spatial optimism for participants who felt very or extremely secure because of wildland management was significantly lower than those who felt less secure, and the flood spatial optimism for participants near a flood channel was significantly lower than those farther from a channel. In terms of hazard proximity, participants with more nearby undeveloped land had a higher average home flood and mudslide ranking compared to their counterparts and had some of the highest spatial optimism among the groups analyzed (1.5 for flood and 1.7 for mudslide). Spatial optimism was not observed for wildfire hazards between residents with high hazard proximity compared to their counterparts in less-hazardous areas.
Multivariate Analysis
Spatial optimism regression models provide insight into the relative influence of the five factor types on the difference between community and home hazard rankings after controlling for other factors. Renters and those who felt more secure with wildland management protections were significantly associated with lower wildfire spatial optimism, while having prior wildfire experience, agreeing a wildfire-flood connection exists, or living near a higher level of undeveloped land was associated with greater wildfire spatial optimism (Table 2, Models 5 and 6). Residents aged 35 to 49 years old were associated with greater mudslide spatial optimism, while participants of color and those with lower household income were associated with lower mudslide spatial optimism (Table 4, Models 17 and 18). Residents who agreed a wildfire-flood connection exists or lived near a higher level of undeveloped land had greater flood and mudslide spatial optimism (Table 3, Models 11 and 12; Table 4, Models 17 and 18). Across all spatial optimism models, participant home-level hazard rankings had a significant and negative influence on spatial optimism. This suggests that participants with a lower home-level hazard ranking tended to discount home-community hazard differences more than participants with higher home-level hazard ranking.
Discussion
Findings stress the importance of using a multi-hazard and multi-scale approach for understanding and responding to local level compound hazards. This perspective is particularly important when confronting interconnected and cascading hazards, such as wildfire, flood, and mudslide hazards that occur across WUI zones in a fire and flood cycle that often spans several years. Results extend previous single-hazard studies, which have examined perceptions of wildfires, floods, and mudslides in isolation (Burnett & Edgeley, 2023; Champ & Brenkert-Smith, 2016; McGee et al., 2009; Meldrum et al., 2015), by providing comparative insights into resident perceptions of these three WUI hazards and how they are connected across local spatial scales.
Overall, residents indicated that wildfire posed the greatest hazard for their community compared to mudslide hazards and that wildfires were more likely and potentially more severe compared to floods or mudslides. These stronger perceptions of wildfire hazards relative to flood and mudslide hazards could reflect greater community-wide wildfire experience given that all survey subareas were located near the scar of a recent wildfire and given the study did not sample WUI areas without a recent wildfire in the previous 5 years. Multiple survey subareas were subject to evacuation orders during this period due to increased potential of flooding and debris/mud flows near burn scars. This could have amplified resident awareness of the connection between WUI hazards and resulted in the high level of awareness that a major wildfire could increase the likelihood of flood damage. However, the fact that post-wildfire flooding and mudslides tended to be spatially concentrated in mountainous canyons could have resulted in a sense that these hazards were less likely and would cause less severe impacts than wildfires which impacted a larger geographic area.
Consistent with multi-hazard studies of non-WUI hazards (Knuth et al., 2014; Sullivan-Wiley & Short Gianotti, 2017; Tanner, 2022), findings provide some evidence of the presence of cross-over effects in resident perceptions of hazards in WUI areas. Bivariate results indicate that experience with each hazard is associated with higher perceptions of the other two hazards and that residents who understood the connection between wildfire and flood hazards had higher hazard rankings for all three WUI hazards analyzed. However, after controlling for the relative influence of exposure to each type of hazard in multivariate analysis, cross-over effects based on hazard experience were less apparent: hazard rankings for each hazard were for the most part influenced only by prior experience with that hazard. For instance, wildfire experience was significantly (and positively) associated with wildfire rankings, but flood and mudslide experience were not. The one exception was that prior wildfire experience was significantly (and positively) associated with mudslide rankings, perhaps reflecting that residents closely associate mudslide events with post-wildfire conditions in the study areas.
However, residents who reported they believed wildfire and flood hazards were connected were consistently associated with higher rankings for all hazards in multivariate models. No previous multi-hazard study to our knowledge has accounted for potential cross-over effects by directly asking residents about their cross-over hazard perceptions in this way. Resident awareness that hazards are connected could reflect heightened knowledge about environmental hazards developed through media reports or governmental warnings or could be based on personal hazard experience. For this reason, the inclusion of this wildfire-flood connection variable in multivariate models could mask the influence of the separate hazard experience variables. Revised models not including this variable indicated that while wildfire experience remained the only significant experience variable associated with wildfire risk, wildfire and flood experience variables were both significant predictors of community level flood risk and both wildfire and mudslide experience variables were both significant predictors of home and community level mudslide risk.
These patterns suggest that WUI residents are largely aware that wildfire, flood, and mudslide hazards are connected and that concern about or experience with one of these hazards informs and amplifies concern about the others. Resident awareness likely extends beyond these three WUI hazards to other environmental drivers and hazards connected with the WUI fire and flood cycle such as drought and climate change (Schulte & Miller, 2010). This stresses the need for expanded multi-hazard research to better understand how residents perceive and react to the climate factors driving the intensification of rainfall and wildfire events in expanding intermix and interface zones and how associated hazards compound and interact over natural, built, and social landscapes in WUI areas. Further research is also needed to understand whether and in what ways such multi-hazard awareness could influence resident adaptation priorities and actions and inform governmental risk communication and emergency planning.
Consistent with previous studies which compare differences in wildfire or flood risk perceptions at local scales (Collins, 2012; Coquet et al., 2019), survey results indicate average WUI resident rankings of wildfire, flood, and mudslide hazards consistently increased from the home level to the community level and that these means rankings were significantly different. This points to the presence of spatial optimism in resident perceptions of WUI hazards, or the tendency to discount home-level risk perceptions and view proximate environmental conditions more favorably (less hazardous) than community-level conditions. Although most previous studies of spatial optimism have stressed differences between individual or home proximate levels with broader country and global levels (Gifford et al., 2009; Jakovcevic et al., 2013; Uzzell, 2000), these results stress that spatial optimism can occur at more local. It also stresses that local risk perception studies should account for scale effects given the magnitude of perceptions could vary substantially depending on whether surveys about ask about home or community level environmental perceptions and dynamics.
Although a definitive definition for spatial optimism has not emerged, it could reflect that the discounting of proximate hazards serves as a self-protective coping mechanism that lessens fear and anxiety about nearby threats (Retchless, 2018). It could also be associated with how residents construe hazards across different scalar levels (Gifford et al., 2009; Tang & Chooi, 2023; Uzzell, 2000). Threats at broader levels may be considered more spatially, socially, or psychologically distant based on media or secondary reports and construed more abstractly and potentially more harmful if they are associated with a greater sense of uncertainty and complexity. In contrast, perceptions of threats at more proximate spatial levels may feel more concrete and specific given they are more likely to be based on personal experience and observations. Inverting the spatial optimism hypothesis, this explanation suggests that more proximate hazard perceptions could be more realistic and that perceptions at broader scalar levels could be inflated because they are associated with greater uncertainty.
Another alternative explanation for the observed home-community differences in hazard rankings could be that residents feel the likelihood that a given hazard will impact a larger geographic area (e.g., neighborhood or community level) is higher than the likelihood that the hazard will impact a smaller geographic area (e.g., home or near home). Although beyond the scope of this research, assessing the relative accuracy of home or community hazard perceptions could help better understand whether home-community ranking differences reflect that residents discount home-level hazard rankings or amplify community-level hazard rankings. These questions are particularly important for preparing for and responding to WUI hazards given that psychological distancing processes have been identified as a barrier to taking pro-environmental and protective actions (Retchless, 2018).
Previous studies also suggest that the influence of place attachment on hazard perception and spatial optimism varies based on local context and hazard type (Bonaiuto et al., 2016; De Dominicis et al., 2015; Schultz et al., 2014). Some research suggests residents with strong place attachment may spatially discount nearby risks as a form of protective denial because they strongly identify with a location which could be harmed; other studies suggest residents with strong place attachment demonstrate greater hazard perceptions and take action to protect places they value (Devine-Wright, 2009). Bivariate results suggest place attachment was associated with higher community-level flood and mudslide hazard rankings, but this variable was not significant in multivariate models that accounted for other factors. Multivariate results suggest place attachment was associated with lower home-level flood hazard rankings, but such differences were not apparent in bivariate results. These mixed findings regarding the role of place attachment stress the need for future research to examine whether this factor plays a direct or modifying role in hazard perceptions and the potential influence that it could have on resident protective actions (Bonaiuto et al., 2016).
Consistent with previous research (Martin et al., 2009; Meldrum et al., 2015; Thapa et al., 2023; Tobin, 1995), bivariate results indicate that perceived hazard protections were consistently associated with lower community-level hazard rankings and were in some cases associated with lower home-level rankings. Multivariate analysis confirmed that after accounting for other factors, residents who felt more secure due to government wildland management were associated with lower community-level wildfire hazard rankings, residents who felt more secure due to flood control infrastructure were associated with lower community-level flood hazard rankings, and residents who lived near a flood control channel were associated with lower home- and community-level mudslide hazard rankings. These patterns suggest residents perceive the protective value that these government programs and infrastructure provide, but also raise concerns that these protections may instill a false sense of safety if residents who feel protected are relatively unaware these protections could fail or be insufficient to mitigate amplified and ultrahazardous post-wildfire risks which could occur as hazardous conditions intensify in WUI zones due to climate change (Sanders & Grant, 2020). Further research is needed to understand whether a false sense of home-level safety from hazards due to government protections could be further amplified for residents who also discount their home-level hazards due to spatial optimism. Understanding the potential combined effect of these two local-level discounting dynamics on WUI resident hazard perceptions could provide a pathway for increasing hazard awareness and emergency preparedness through targeted risk communication and education.
Future research is needed to assess whether the hazard perceptions, cross-over hazard effects, and spatial optimism observed among WUI residents living near the scars of recent wildfires in southern California are applicable to interface and intermix zones in other regions with different natural and built environments and population dynamics. Future research is also needed to understand whether residents outside of WUI areas exhibit similar patterns of spatial optimism of environmental hazards across local spatial levels. Although the sample size enabled analysis of patterns of potentially vulnerable populations (renters, people of color, and lower-income groups), Non-Hispanic White residents were overrepresented in the sample relative to the overall study area population. Future research could implement expanded community outreach and more intensive survey methods, such as in-person, door-to-door survey collection with bilingual survey teams, to increase inclusion of Hispanic and Lantix communities.
Results may also be limited by the study’s use of the term “mudslide” to capture perceptions of mud and debris flow hazards given residents may not readily consider these terms synonymous (Serra-Llobet et al., 2023). Given most residents reported they understood that WUI hazards are connected, further research is needed to understand how such multi-hazard awareness is associated with home and community protective actions for these hazards and whether multi-hazard awareness prompts disaster preparedness or adherence to evacuation orders during emergency events (Bubeck et al., 2023; Ghasemi et al., 2020; Lin et al., 2008; McGee et al., 2009; Vaske & Kobrin, 2001). Responding to intensifying compound hazards in WUI areas will also require concerted governmental action to implement protective building standards, expand educational programs and support for household and community mitigation actions for both homeowners and renters, and adopt long-range growth and infrastructure plans that moderate urban expansion within hazardous areas and ensure that development does not outpace the provision of protective infrastructure.
Footnotes
Acknowledgements
The authors are grateful for the data and knowledge shared by the Riverside County Flood Control and Water Conservation District about regional flood management and post-wildfire hazards. The authors thank Aishwarya Bharat Borate and Christopher Ihinegbu for their helpful suggestions on the manuscript.
Declaration of Conflicting Interests
The author(s) declared no potential conflicts of interest with respect to the research, authorship, and/or publication of this article.
Funding
The author(s) disclosed receipt of the following financial support for the research, authorship, and/or publication of this article: This study was supported by the National Science Foundation under Grant HDBE-2031535.